
Arithmetic, Geometrical, and Decadal Population Growth methods, including formulas and their interpretation. These are widely used techniques in demography and urban planning to estimate or analyze population growth trends.
1. Arithmetic Growth Method
✅ Definition:
The Arithmetic growth method assumes that the population increases by a constant number of people every year. This method is suitable for short-term projections and when population growth is linear or slow.
✅ Formula:

Where:
- PtP_tPt = Projected population at time ttt
- P0P_0P0 = Base year population
- rrr = Average annual increase in population
- ttt = Number of years from base year
✅ How to calculate r:

If data from two known years is available: r=Pn−P0nr = \frac{P_n – P_0}{n}r=nPn−P0
Where:
- PnP_nPn = Population at the end of nnn years
- P0P_0P0 = Initial population
- nnn = Number of years between the two known populations
✅ Example:
- Population in 2000 = 50,000
- Population in 2010 = 60,000
- r=(60,000−50,000)/10=1,000r = (60,000 – 50,000)/10 = 1,000r=(60,000−50,000)/10=1,000 people/year
So, for 2015: P2015=50,000+(1,000×15)=65,000P_{2015} = 50,000 + (1,000 \times 15) = 65,000P2015=50,000+(1,000×15)=65,000
2. Geometric Growth Method
✅ Definition:
In the Geometric growth method, the population increases at a constant rate (percentage) every year. Each year’s increase is compounded on the previous year’s population. It follows exponential growth.
✅ Formula:

Where:
- PtP_tPt = Projected population at time ttt
- P0P_0P0 = Base year population
- rrr = Annual growth rate (expressed as a decimal, e.g., 2% = 0.02)
- ttt = Number of years
✅ How to calculate rrr:
r=(PnP0)1n−1r = \left(\frac{P_n}{P_0}\right)^{\frac{1}{n}} – 1r=(P0Pn)n1−1
Where:
- PnP_nPn = Population at year nnn
- P0P_0P0 = Population at base year
- nnn = Number of years
✅ Example:

3. Decadal Growth Method
✅ Definition:
The Decadal Growth Method calculates the percentage increase in population over a 10-year (decade) period. It’s commonly used in census analysis to measure long-term growth trends.
✅ Formula:

Where:
- P0P_0P0 = Population at the start of the decade
- PnP_nPn = Population at the end of the decade
✅ Average Annual Growth Rate:
Annual Growth Rate (%)=Decadal Growth Rate10\text{Annual Growth Rate (\%)} = \frac{\text{Decadal Growth Rate}}{10}Annual Growth Rate (%)=10Decadal Growth Rate
Alternatively, Compounded Decadal Growth Rate (CDGR) can also be used: r=

✅ Example:

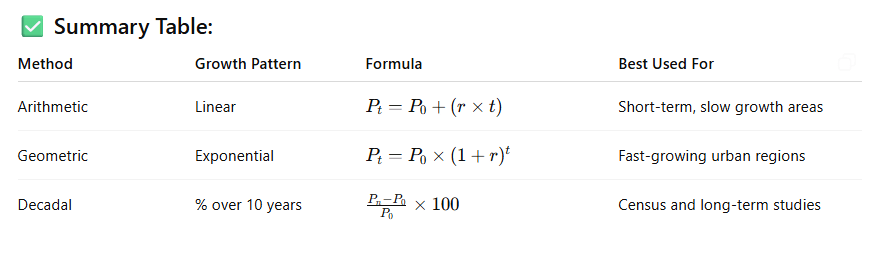
✅ Summary Table:
| Method | Growth Pattern | Formula | Best Used For |
|---|---|---|---|
| Arithmetic | Linear | Pt=P0+(r×t)P_t = P_0 + (r \times t)Pt=P0+(r×t) | Short-term, slow growth areas |
| Geometric | Exponential | Pt=P0×(1+r)tP_t = P_0 \times (1 + r)^tPt=P0×(1+r)t | Fast-growing urban regions |
| Decadal | % over 10 years | Pn−P0P0×100\frac{P_n – P_0}{P_0} \times 100P0Pn−P0×100 | Census and long-term studies |
✅ Application in Urban Planning and Demography:
- Arithmetic: Small towns, rural settlements, or areas with stable growth
- Geometric: Rapidly urbanizing regions, metropolitan cities
- Decadal: Used by national census authorities to compare growth between decades

You must be logged in to post a comment.