Sustainable Development Goal 4 (SDG 4), titled “Quality Education,” is one of the 17 Sustainable Development Goals adopted by the United Nations in 2015 as part of the 2030 Agenda for Sustainable Development. Its main objective is to ensure inclusive and equitable quality education and promote lifelong learning opportunities for all.
Education is a fundamental human right and an essential foundation for social, economic, and sustainable development. It enables people to develop knowledge, practical skills, critical thinking, creativity, and the ability to make informed decisions. Quality education also helps reduce poverty, improve employment opportunities, promote gender equality, and build peaceful and inclusive societies.
However, millions of children and adults worldwide continue to face barriers to education because of poverty, gender discrimination, disability, geographical isolation, conflict, inadequate school infrastructure, and shortages of qualified teachers. In many places, children may attend school without acquiring the basic literacy, numeracy, and practical skills needed for everyday life.
SDG 4 seeks to address these challenges by improving access to education at all levels, strengthening teaching quality, promoting vocational and higher education, reducing educational inequalities, and ensuring that learning opportunities are available throughout life.
The goal recognises that education should not simply be accessible. It should also be meaningful, safe, inclusive, affordable, and capable of preparing learners for employment, citizenship, and sustainable living.
2. Meaning of Quality Education
Quality education refers to an educational system that provides learners with relevant knowledge, skills, values, and opportunities to develop their potential, regardless of their social or economic background.
It involves more than school enrolment or attendance. Students should have access to trained teachers, appropriate learning materials, safe classrooms, inclusive facilities, effective teaching methods, and opportunities to apply what they learn.
The concept of quality education includes the following elements:
Accessibility: Every person should have a fair opportunity to receive education without discrimination.
Affordability: The cost of education should not prevent children and adults from learning.
Equity: Learners from disadvantaged backgrounds should receive appropriate support to overcome educational barriers.
Quality teaching: Qualified teachers and effective teaching methods should support meaningful learning outcomes.
Safe learning environments: Schools and educational institutions should be physically safe, accessible, and free from violence and discrimination.
Relevant curriculum: Education should develop literacy, numeracy, digital competence, critical thinking, creativity, and practical skills.
Lifelong learning: People should have opportunities to continue learning and developing their skills throughout their lives.
For example, a school located near a settlement may improve access to education, but if it lacks teachers, drinking water, accessible toilets, learning materials, or a safe environment, students may still struggle to receive a quality education.
Therefore, SDG 4 focuses on both educational access and the quality of learning experiences.
3. Main Objectives of SDG 4
The major objectives of SDG 4 are:
Universal primary and secondary education: Ensure that all children complete free and quality primary and secondary education.
Early childhood development: Provide access to early childhood care, development, and pre-primary education.
Affordable higher education: Improve equal access to technical, vocational, and university education.
Employment-related skills: Equip young people and adults with the knowledge and skills needed for decent work and entrepreneurship.
Educational equality: Reduce gender disparities and improve educational opportunities for vulnerable groups.
Literacy and numeracy: Ensure that young people and adults acquire essential reading, writing, and mathematical skills.
Education for sustainable development: Help learners understand environmental protection, human rights, equality, peace, and responsible citizenship.
Safe educational infrastructure: Develop accessible, inclusive, and safe schools and learning facilities.
Scholarships and educational support: Expand educational opportunities for students from developing and disadvantaged communities.
Qualified teachers: Increase the availability of trained and competent teachers through education, professional development, and international cooperation.
These objectives establish education as a continuous process that begins in early childhood and extends through formal education, professional training, and lifelong learning.
4. Targets of Sustainable Development Goal 4
The United Nations has established 10 targets under SDG 4, identified as Targets 4.1 to 4.7 and 4.a to 4.c. They address access to education, learning outcomes, equality, sustainability, infrastructure, scholarships, and teacher training.
Target
Name
Description
4.1
Free and Quality Primary and Secondary Education
By 2030, ensure that all girls and boys complete free, equitable, and quality primary and secondary education leading to relevant and effective learning outcomes.
4.2
Early Childhood Development and Pre-Primary Education
By 2030, ensure that all girls and boys have access to quality early childhood development, care, and pre-primary education so that they are ready for primary education.
4.3
Equal Access to Technical, Vocational and Higher Education
By 2030, ensure equal access for all women and men to affordable and quality technical, vocational, and tertiary education, including university.
4.4
Skills for Employment and Entrepreneurship
By 2030, substantially increase the number of youth and adults with relevant skills, including technical and vocational skills, for employment, decent jobs, and entrepreneurship.
4.5
Eliminate Disparities in Education
By 2030, eliminate gender disparities in education and ensure equal access to all levels of education and vocational training for vulnerable groups, including persons with disabilities, Indigenous peoples, and children in vulnerable situations.
4.6
Literacy and Numeracy
By 2030, ensure that all youth and a substantial proportion of adults, both men and women, achieve literacy and numeracy.
4.7
Education for Sustainable Development and Global Citizenship
By 2030, ensure that all learners acquire the knowledge and skills needed to promote sustainable development, including education for sustainable lifestyles, human rights, gender equality, peace, global citizenship, and cultural diversity.
4.a
Safe and Inclusive Learning Environments
Build and upgrade education facilities that are child-, disability-, and gender-sensitive and provide safe, non-violent, inclusive, and effective learning environments for all.
4.b
Scholarships for Higher Education
The original 2020 target aimed to substantially expand scholarships available to developing countries, particularly least developed countries, small island developing states, and African countries, for higher education and vocational and technical training. Its original deadline has passed, but it remains part of the SDG framework.
4.c
Qualified Teachers
By 2030, substantially increase the supply of qualified teachers, including through international cooperation for teacher training in developing countries.
5. Importance of SDG 4
SDG 4 is important because education influences nearly every aspect of human development. It supports economic growth, reduces inequality, strengthens communities, and helps people make informed decisions about their lives and the environment.
5.1 Reduction in Poverty
Education helps people develop skills that improve their employment opportunities and earning potential. Access to quality education can help individuals and families break the cycle of poverty and improve their living conditions.
5.2 Promotion of Gender Equality
Equal educational opportunities allow girls and boys to develop their abilities and participate in society. Educating girls can improve their economic independence, health awareness, and participation in decision-making.
5.3 Employment and Economic Development
Education and vocational training prepare individuals for employment, entrepreneurship, and changing labour-market requirements. A skilled population can contribute to innovation, productivity, and economic development.
5.4 Reduction in Social Inequality
SDG 4 promotes educational access for disadvantaged communities, people with disabilities, rural populations, and low-income households. Inclusive education can reduce differences in opportunities arising from social and economic circumstances.
5.5 Improvement in Health and Well-Being
Education improves awareness of nutrition, hygiene, disease prevention, and healthcare. It can also help individuals make informed decisions about their health and personal safety.
5.6 Environmental Awareness
Education helps people understand climate change, pollution, biodiversity, resource conservation, and sustainable lifestyles. It prepares learners to contribute to environmental protection and responsible resource management.
5.7 Peaceful and Inclusive Societies
Education can promote tolerance, respect for diversity, human rights, critical thinking, and peaceful conflict resolution. These qualities help build stronger communities and more inclusive societies.
5.8 Lifelong Learning
Technological and economic changes require people to continue developing their skills. SDG 4 promotes opportunities for adults to learn new skills, improve digital literacy, change careers, and adapt to emerging challenges.
6. Major Challenges in Achieving SDG 4
Despite progress in expanding educational opportunities, several challenges continue to affect the achievement of quality education worldwide and in India.
6.1 Unequal Access to Education
Children in remote rural areas, low-income settlements, and underserved regions may face long travel distances, inadequate schools, limited transport, and a shortage of teachers. These conditions can reduce attendance and increase the risk of dropping out.
6.2 Poverty and Financial Barriers
Even when tuition is free, families may need to pay for uniforms, books, transport, digital devices, and other educational expenses. Financial pressures can also lead children to leave school to support their households
6.3 Gender Disparities
Social expectations, safety concerns, early marriage, household responsibilities, and inadequate sanitation facilities can affect educational participation, particularly for girls in some communities.
6.4 Shortage of Qualified Teachers
A shortage of trained teachers can affect classroom instruction, individual attention, and learning outcomes. Teachers also need ongoing professional development to adapt to changing curricula and teaching technologies.
6.5 Poor School Infrastructure
Some educational institutions lack adequate classrooms, electricity, drinking water, functional toilets, libraries, laboratories, playgrounds, and facilities for students with disabilities. Such conditions can negatively affect attendance, safety, and learning.
6.6 Digital Divide
Online education and digital learning resources can expand access to information, but students without reliable internet, computers, smartphones, or digital skills may be disadvantaged.
6.7 Learning Gaps and Low Foundational Skills
School attendance does not always guarantee that students acquire essential reading, writing, and mathematical skills. Overcrowded classrooms, limited learning materials, and insufficient individual support can contribute to learning gaps.
6.8 Educational Exclusion
Children with disabilities, children from disadvantaged social groups, migrants, and children affected by conflict or displacement may face discrimination, inaccessible facilities, language barriers, or a lack of specialised support.
6.9 Mismatch Between Education and Employment
Some learners complete formal education without gaining the practical, digital, technical, and communication skills required by employers. Weak connections between educational institutions and industry can limit employment opportunities.
6.10 Climate and Disaster Risks
Floods, heatwaves, storms, and other disasters can damage school infrastructure, interrupt academic schedules, and disrupt access to education. Schools therefore need to be resilient, safe, and prepared for emergencies.
Globally, progress towards SDG 4 remains insufficient. The UN reported that 273 million children and young people were out of school in 2024, highlighting the scale of the challenge.
7. Strategies to Achieve SDG 4
Achieving SDG 4 requires coordinated efforts by governments, educational institutions, communities, teachers, and the private sector.
Expand educational access: Establish adequate schools and learning centres in underserved rural and urban areas.
Strengthen foundational learning: Focus on reading, writing, mathematics, and comprehension during the early years of schooling.
Improve teacher training: Recruit qualified teachers and provide continuous professional development.
Make education inclusive: Provide accessible buildings, appropriate learning materials, assistive technology, and additional support for students with disabilities.
Reduce financial barriers: Strengthen scholarships, financial assistance, school meals, and support for disadvantaged households.
Improve school infrastructure: Ensure adequate classrooms, electricity, drinking water, toilets, libraries, laboratories, and playgrounds.
Bridge the digital divide: Improve internet connectivity and provide access to digital learning resources and devices.
Promote gender equality: Ensure safe school journeys, appropriate sanitation facilities, equal participation, and protection against discrimination.
Strengthen vocational education: Integrate practical training, digital literacy, technical skills, internships, and entrepreneurship education into learning pathways.
Promote lifelong learning: Expand adult literacy, continuing education, community learning centres, and opportunities to update professional skills.
Integrate sustainability into education: Teach environmental protection, climate awareness, responsible consumption, human rights, and sustainable development.
Monitor learning outcomes: Regularly assess attendance, completion rates, literacy, numeracy, educational equality, and the quality of school facilities.
8. Monitoring and Indicators of SDG 4
Progress towards SDG 4 is monitored through indicators that measure school participation, learning outcomes, educational equality, literacy, infrastructure, and teacher qualifications.
Indicator
What it measures
Primary and secondary completion rates
The proportion of learners completing the relevant levels of education.
Minimum proficiency in reading and mathematics
The proportion of learners meeting defined minimum learning standards.
Early childhood development
The proportion of young children achieving expected developmental milestones.
Participation in pre-primary education
The proportion of children participating in organised learning before primary school.
Participation in education and training
The participation of youth and adults in formal and non-formal education or training.
Information and communication technology (ICT) skills
The proportion of youth and adults possessing specified digital skills.
Educational parity indices
Differences in educational outcomes by sex, location, wealth, disability, and other relevant characteristics.
Youth and adult literacy
Literacy rates among young people and adults.
Education for sustainable development
The extent to which sustainability and global citizenship are included in policies, curricula, teacher education, and assessment.
Basic school services
The proportion of schools providing facilities such as drinking water, sanitation, electricity, and other essential services.
Scholarships
Financial support available for eligible students pursuing higher education and training.
Qualified teachers
The proportion of teachers who meet the minimum required qualifications for their education level.
These indicators help governments and educational authorities identify gaps, assess progress, and direct resources towards communities and institutions that need additional support. The official indicator definitions are maintained by the United Nations Statistics Division and supported by UNESCO’s education statistics work.
9. Conclusion
Sustainable Development Goal 4 is essential for building an educated, equitable, and sustainable society. It recognises that education is not only a basic human right but also a powerful instrument for reducing poverty, promoting gender equality, improving employment opportunities, and strengthening social and environmental responsibility.
Although India and other countries have made progress in expanding access to education, challenges such as unequal learning outcomes, inadequate infrastructure, financial barriers, teacher shortages, and digital inequality continue to require attention.
Achieving SDG 4 by 2030 requires investment in educational infrastructure, qualified teachers, inclusive learning environments, foundational literacy and numeracy, vocational training, and lifelong learning. Urban and regional planning can contribute by ensuring that educational facilities are appropriately located, accessible, safe, and adequately equipped to serve growing populations.
Ultimately, quality education means ensuring that every person has the opportunity to learn, develop their abilities, and contribute meaningfully to society. An inclusive and sustainable future depends on making education accessible, equitable, and effective for everyone.
References
1. United Nations. (n.d.). Goal 4: Quality Education. United Nations Sustainable Development Goals. https://sdgs.un.org/goals/goal4
5. Ministry of Education, Government of India. (n.d.). Unified District Information System for Education Plus (UDISE+). Government of India. https://www.udiseplus.gov.in/
Sustainable Development Goal 3 (SDG 3) is one of the 17 Sustainable Development Goals adopted by the United Nations in September 2015 under the 2030 Agenda for Sustainable Development. Its main aim is to ensure healthy lives and promote well-being for all at all ages. It recognizes that good health is essential for individual development, social progress and economic growth.
Health is not limited to the absence of disease. It also includes physical, mental and social well-being. People need access to quality healthcare, nutritious food, safe drinking water, clean surroundings, vaccinations, health education and affordable treatment to lead healthy lives.
SDG 3 focuses on improving healthcare systems, reducing preventable deaths, controlling communicable and non-communicable diseases, promoting mental health, ensuring reproductive healthcare and making essential health services accessible to everyone.
The goal emphasizes equity in healthcare, meaning that access to health services should not depend on a person’s income, gender, age, disability or geographical location. It also recognizes that the health of individuals is closely connected with other development goals, including poverty reduction, nutrition, clean water, sanitation, sustainable cities and environmental protection.
2. Objectives of SDG 3
The major objectives of SDG 3 are:
Reduce maternal and child mortality: Prevent deaths during pregnancy, childbirth and early childhood through timely medical care.
Control communicable diseases: Prevent and treat diseases such as tuberculosis, HIV/AIDS, malaria and other infectious diseases.
Prevent non-communicable diseases: Reduce premature deaths caused by conditions such as cardiovascular diseases, cancer, diabetes and chronic respiratory diseases.
Promote mental health: Improve awareness, early identification and access to mental health support.
Achieve universal health coverage: Ensure that people can access essential health services without suffering financial hardship.
Improve road safety: Reduce deaths and injuries caused by road traffic accidents.
Ensure reproductive healthcare: Provide access to reproductive health information, services and family planning.
Reduce environmental health risks: Minimize illness caused by air pollution, unsafe water, hazardous chemicals and other environmental hazards.
Strengthen healthcare infrastructure: Improve health facilities, medical equipment, medicine availability and the healthcare workforce.
Improve emergency preparedness: Strengthen the ability of health systems to respond to epidemics, pandemics and other health emergencies.
These objectives form the foundation of the goal’s 13 targets.
3. Targets of SDG 3
SDG 3 contains 13 targets, numbered 3.1 to 3.9 and 3.a to 3.d. These targets cover specific health outcomes, access to services and the systems needed to improve public health.
Target
Description
3.1: Maternal health
By 2030, reduce the global maternal mortality ratio to less than 70 deaths per 100,000 live births. This requires antenatal check-ups, skilled birth attendants, emergency obstetric care and postnatal services.
3.2: Newborn and child health
End preventable deaths of newborns and children under five. The targets include neonatal mortality of no more than 12 deaths per 1,000 live births and under-five mortality of no more than 25 per 1,000 live births.
3.3: Communicable diseases
End epidemics of AIDS, tuberculosis, malaria and neglected tropical diseases, while combating hepatitis, waterborne diseases and other communicable diseases.
3.4: Non-communicable diseases and mental health
Reduce premature mortality from non-communicable diseases by one-third through prevention and treatment, and promote mental health and well-being.
3.5: Substance-use prevention and treatment
Strengthen the prevention and treatment of substance-use disorders, including drug abuse and the harmful use of alcohol.
3.6: Road safety
The original 2030 target was to halve global deaths and injuries from road traffic accidents.
3.7: Sexual and reproductive healthcare
Ensure universal access to sexual and reproductive healthcare services, family planning, information and education.
3.8: Universal health coverage
Achieve universal health coverage, including financial risk protection, access to quality essential healthcare and safe, effective, affordable essential medicines and vaccines.
3.9: Environmental health
Substantially reduce deaths and illnesses caused by hazardous chemicals, air pollution, water pollution and soil contamination.
3.a: Tobacco control
Strengthen implementation of the World Health Organization Framework Convention on Tobacco Control.
3.b: Medicines and vaccines
Support research and development of vaccines and medicines, improve access to affordable essential medicines and vaccines, and address diseases affecting developing countries.
3.c: Healthcare workforce
Increase health financing and the recruitment, development, training and retention of healthcare workers, particularly in developing countries.
3.d: Health emergency preparedness
Strengthen early warning, risk reduction and management of national and global health risks.
Understanding the targets
These targets can be understood through three broad areas:
Improving health outcomes: Targets 3.1 to 3.7 focus on preventing deaths, controlling diseases, improving maternal and child health, and promoting mental and reproductive health.
Making healthcare accessible: Target 3.8 focuses on universal health coverage, while 3.b and 3.c support affordable medicines, vaccines and a trained healthcare workforce.
Building a resilient health system: Targets 3.a, 3.9 and 3.d address tobacco control, environmental risks and preparedness for health emergencies.
Together, these areas aim to create a healthcare system that prevents illness, treats disease effectively and protects people throughout their lives.
4. Importance of SDG 3
A. Improvement in quality of life
Good health enables people to participate in education, employment, family life and community activities. Preventive healthcare, timely diagnosis and treatment can reduce avoidable suffering and improve life expectancy.
B. Reduction in poverty and inequality
Serious illnesses can force households to spend a large portion of their income on treatment or lose earnings when family members cannot work. Affordable healthcare and financial protection can reduce this burden, particularly for low-income households.
C. Maternal and child welfare
Access to maternal care, skilled birth attendance, immunization, nutrition and newborn services improves the chances of healthy pregnancies and childhood development. These interventions are particularly important in underserved rural and urban communities.
D. Economic development
A healthy population can contribute more effectively to the economy. Better health reduces preventable absence from work and school, supports productivity and reduces the financial pressure associated with avoidable medical treatment.
E. Disease prevention and emergency preparedness
Strong public health systems help detect outbreaks, provide timely treatment and communicate risks to communities. Surveillance, vaccination programmes and emergency planning can reduce the impact of infectious diseases and other health threats.
F. Environmental sustainability
Air pollution, contaminated water, poor sanitation, unsafe housing and exposure to hazardous substances can contribute to disease. SDG 3 therefore connects healthcare with environmental management, sanitation, housing and sustainable urban development.
5. Major challenges in achieving SDG 3
Despite progress in healthcare, several challenges continue to affect its achievement by 2030.
Unequal access to healthcare: Rural, remote and underserved urban communities may lack nearby facilities, specialists, medicines or diagnostic services.
High healthcare costs: Out-of-pocket expenditure can place significant financial pressure on households, especially when treatment requires hospitalization.
Shortage of trained professionals: Uneven distribution of doctors, nurses, specialists and other healthcare workers can reduce the quality and availability of care.
Communicable diseases: Tuberculosis and other infectious diseases continue to require sustained prevention, diagnosis, treatment and public awareness.
Non-communicable diseases: Cardiovascular diseases, diabetes, cancer and chronic respiratory diseases create a growing need for prevention and long-term care.
Mental health concerns: Stigma, limited awareness and inadequate access to trained professionals can prevent people from seeking support.
Environmental pollution: Poor air quality, contaminated water, inadequate sanitation and unsafe waste disposal contribute to health risks.
Road traffic injuries: Unsafe roads, insufficient pedestrian facilities and inadequate road-safety measures expose people to preventable injuries.
Emergency preparedness: Disease outbreaks, climate-related disasters and other emergencies can disrupt essential healthcare services.
Data and monitoring gaps: Incomplete or outdated health data can make it difficult to identify vulnerable populations and allocate resources effectively.
These challenges show that healthcare improvement requires not only medical services but also coordinated action across government departments, communities and planning institutions.
6. Strategies to achieve SDG 3
The following measures can help governments, local authorities and communities make progress towards the goal.
Strengthen primary healthcare: Improve local health facilities, diagnostic services, medicine availability and preventive care so that people can receive treatment before conditions become severe.
Increase public health awareness: Promote health education, vaccination, nutrition, physical activity, disease prevention and mental well-being.
Improve financial protection: Expand appropriate health coverage and reduce the financial barriers that prevent people from obtaining essential treatment.
Focus on vulnerable populations: Prioritize maternal and child health, older adults, persons with disabilities, low-income households and underserved communities.
Integrate health into urban planning: Consider health impacts when planning roads, housing, public spaces, industrial areas, sanitation systems and transport networks.
Promote road safety: Improve junction design, traffic management, pedestrian crossings, footpaths, cycling facilities and enforcement of road-safety regulations.
Reduce environmental risks: Control pollution, improve waste management, ensure safe drinking water and strengthen sanitation infrastructure.
Strengthen healthcare personnel: Improve training, recruitment, retention and the distribution of health workers, especially in underserved areas.
Use technology and data: Apply GIS mapping, health information systems and spatial analysis to identify service gaps, monitor disease patterns and support evidence-based decisions.
Improve emergency preparedness: Strengthen disease surveillance, early-warning systems, emergency response plans and the resilience of healthcare facilities.
7. Monitoring and indicators of SDG 3
Progress towards SDG 3 is measured through indicators that assess health outcomes, healthcare access and the capacity of health systems. The United Nations maintains the official SDG indicator framework, while the World Health Organization provides health-related data and monitoring resources.
Indicator
What it measures
Maternal mortality ratio
Maternal deaths per 100,000 live births
Neonatal mortality rate
Deaths during the first 28 days of life per 1,000 live births
Under-five mortality rate
Deaths before the age of five per 1,000 live births
Communicable disease indicators
Measures relating to HIV, tuberculosis, malaria and other specified diseases
Premature mortality from non-communicable diseases
Risk of dying prematurely from specified major non-communicable diseases
Universal health coverage
Access to essential health services and related financial protection
Road traffic mortality rate
Deaths resulting from road traffic injuries
Environmental health indicators
Deaths and illnesses associated with air, water and other environmental pollution
Health workforce indicators
Availability and distribution of healthcare professionals
Emergency preparedness indicators
Capacity to detect and manage health emergencies
8. Conclusion
Sustainable Development Goal 3 is essential for achieving sustainable development because health influences every aspect of human life, including education, employment, economic security and social participation. Its focus extends beyond treating illnesses to preventing disease, promoting mental well-being, protecting mothers and children, reducing environmental health risks and ensuring access to affordable, quality healthcare.
Achieving SDG 3 by 2030 requires coordinated efforts from governments, healthcare institutions, local authorities, communities and individuals. For urban and regional planners, this means designing settlements that provide equitable access to healthcare, safe mobility, clean environments, sanitation and recreational spaces.
Ultimately, a healthy population is both a foundation and an outcome of sustainable development. Progress towards SDG 3 depends on building communities in which everyone has a fair opportunity to live a healthy and fulfilling life.
References
1. United Nations. (n.d.). Goal 3: Ensure healthy lives and promote well-being for all at all ages. United Nations Department of Economic and Social Affairs. https://sdgs.un.org/goals/goal3
Sustainable Development Goal 2 (SDG 2), also known as Zero Hunger, aims to end hunger, achieve food security, improve nutrition, and promote sustainable agriculture by 2030. It is one of the 17 Sustainable Development Goals adopted by the United Nations in 2015 as part of the 2030 Agenda for Sustainable Development.
SDG 2 recognizes that access to adequate, safe, and nutritious food is a basic human need. It focuses not only on increasing food production but also on ensuring that food is affordable, accessible, and distributed equitably. The goal also emphasizes sustainable agricultural practices, improved livelihoods for farmers, and the protection of natural resources to ensure long-term food security.
1. Understanding Hunger and Food Insecurity
Hunger is a condition in which people do not receive enough food to meet their energy and nutritional requirements. Food insecurity is a broader concept that refers to the inability to access sufficient, safe, and nutritious food regularly because of financial, social, environmental, or physical barriers.
Food insecurity can affect individuals and communities even when food is available in markets. High food prices, poverty, unemployment, inadequate transportation, and unequal distribution may prevent people from obtaining the food they need.
The four main dimensions of food security are:
Availability: Food must be produced in sufficient quantities or supplied through imports, storage, and distribution systems to meet the population’s needs.
Accessibility: Individuals and households must have the financial resources and physical access necessary to obtain food.
Utilization: Food must provide adequate nutrients and be prepared, stored, and consumed safely. Access to clean water, sanitation, and healthcare also influences nutritional outcomes.
Stability: Food availability, accessibility, and utilization must remain reliable over time, even during economic crises, natural disasters, or seasonal shortages.
Malnutrition is another major concern addressed by SDG 2. It includes undernutrition, micronutrient deficiencies, and overnutrition. Malnutrition can affect physical growth, cognitive development, immunity, and overall well-being, particularly among children, pregnant women, and other vulnerable groups.
2. Targets of SDG 2
The United Nations has established eight major targets under SDG 2 to guide global efforts towards eliminating hunger and improving food systems by 2030.
Target 2.1: End Hunger and Ensure Access to Food
This target aims to end hunger and ensure that everyone, particularly poor and vulnerable populations, has access to safe, nutritious, and sufficient food throughout the year.
Achieving this target requires effective food distribution systems, social protection programmes, affordable food prices, and reliable access to essential food supplies. Special attention must be given to low-income households, children, older people, and communities affected by emergencies.
Target 2.2: End All Forms of Malnutrition
This target focuses on eliminating malnutrition in all its forms, including undernutrition, stunting, wasting, and micronutrient deficiencies.
It emphasizes improving nutrition among children, adolescent girls, pregnant women, breastfeeding mothers, and older people. Nutrition education, maternal healthcare, balanced diets, and school meal programmes can help improve nutritional outcomes.
Target 2.3: Double Agricultural Productivity and Incomes
This target aims to improve agricultural productivity and increase the incomes of small-scale food producers, particularly women, indigenous communities, family farmers, pastoralists, and fishers.
It emphasizes equal access to land, agricultural resources, financial services, technology, knowledge, and markets. Supporting small-scale producers can improve rural livelihoods, reduce poverty, and strengthen local food systems.
Target 2.4: Ensure Sustainable Food Production Systems
This target promotes sustainable and resilient agricultural practices that increase productivity while protecting the environment.
Practices such as crop rotation, efficient irrigation, soil conservation, integrated pest management, and climate-resilient farming can help reduce environmental damage. Sustainable agriculture also improves the ability of farming systems to withstand droughts, floods, and changing climatic conditions.
Target 2.5: Maintain Genetic Diversity
This target aims to preserve the genetic diversity of seeds, cultivated plants, farmed and domesticated animals, and related wild species.
Seed banks, community seed conservation, traditional farming knowledge, and livestock conservation programmes are important measures for protecting biodiversity. Genetic diversity also helps agriculture adapt to diseases, pests, and environmental changes.
Target 2.a: Increase Investment in Agriculture
This target focuses on increasing investment in rural infrastructure, agricultural research, technology development, and extension services.
Investments in irrigation, rural roads, storage facilities, agricultural education, and research institutions can improve productivity and connect farmers with markets. International cooperation can also support agricultural development in developing countries.
Target 2.b: Correct and Prevent Trade Restrictions
This target seeks to reduce trade restrictions, distortions, and harmful agricultural subsidies in international agricultural markets.
Fairer agricultural trade can help producers access markets, improve the movement of food across regions, and create more stable trading conditions for developing countries.
Target 2.c: Ensure Stable Food Commodity Markets
This target aims to improve the functioning of food commodity markets and provide timely access to market information.
Monitoring food prices, strengthening market information systems, and improving storage and distribution can help reduce extreme price fluctuations. Stable food markets make it easier for households to plan their food expenditure and for farmers to make production decisions.
3. Major Causes of Hunger and Food Insecurity
Hunger is caused by several interconnected economic, social, political, and environmental factors. Addressing it requires an understanding of the underlying problems affecting food production and distribution.
Poverty and income inequality: People with limited incomes may be unable to afford sufficient and nutritious food. Economic inequality can also limit access to land, agricultural resources, and livelihood opportunities.
Climate change and natural disasters: Droughts, floods, heatwaves, and irregular rainfall can reduce agricultural yields, damage crops, and disrupt food supply chains. These impacts are especially serious for farmers who depend on rainfall.
Conflict and political instability: Wars and displacement disrupt agricultural production, transportation, markets, and humanitarian assistance. Conflict can also force communities to leave their homes and lose their livelihoods.
Unsustainable agricultural practices: Soil degradation, excessive groundwater extraction, deforestation, and the loss of biodiversity reduce the long-term productivity of agricultural land.
Food loss and wastage: Food is lost during harvesting, processing, storage, and transportation. Additional food waste occurs at retail outlets, restaurants, and households, reducing the effective availability of food.
Inadequate infrastructure: Poor rural roads, insufficient warehouses, limited cold-storage facilities, and weak distribution networks make it difficult to transport food efficiently from producers to consumers.
Limited nutritional awareness: A lack of information about balanced diets, dietary diversity, and appropriate nutrition can contribute to poor nutritional outcomes, even where food is available.
These factors demonstrate that hunger is not simply a consequence of insufficient food production. It is also related to unequal access, poverty, infrastructure gaps, environmental degradation, and weaknesses in food distribution systems.
4. Importance of SDG 2
Achieving Zero Hunger is essential for sustainable development because food security influences public health, education, employment, poverty reduction, and economic growth.
Improved health and well-being: Adequate nutrition supports physical growth, strengthens immunity, and reduces the risk of nutrition-related health problems.
Better educational outcomes: Children who receive sufficient and nutritious food are better equipped to concentrate, participate in school activities, and support their learning.
Poverty reduction: Increasing agricultural productivity and supporting farmers can improve household incomes, create employment, and strengthen rural economies.
Gender equality: Improving women’s access to land, finance, agricultural training, and nutrition services can strengthen household food security and economic independence.
Environmental sustainability: Sustainable farming practices protect soil, water, and biodiversity while maintaining the productive capacity of agricultural land.
Economic development: A healthy and adequately nourished population can participate more effectively in education, employment, and productive activities.
Social stability: Reliable access to affordable food can reduce household vulnerability and help communities cope with economic and environmental shocks.
SDG 2 is closely connected with other Sustainable Development Goals, particularly SDG 1 (No Poverty), SDG 3 (Good Health and Well-being), SDG 5 (Gender Equality), SDG 6 (Clean Water and Sanitation), SDG 12 (Responsible Consumption and Production), and SDG 13 (Climate Action).
5. SDG 2 in India
India has made significant efforts to improve food security through agricultural development, public food distribution, and nutrition programmes. Agriculture remains important for rural livelihoods, employment, and the national food supply. However, challenges such as malnutrition, unequal access to nutritious diets, climate vulnerability, and low incomes among some farming households continue to require attention.
Major government initiatives contributing to SDG 2 include:
National Food Security Act, 2013
The National Food Security Act provides a legal framework for subsidized food grains to eligible households. It aims to improve food access for vulnerable populations and strengthen food security through the public distribution system.
Public Distribution System (PDS)
The Public Distribution System distributes essential food grains to eligible beneficiaries through fair-price shops. It helps improve the affordability and availability of staple food items, particularly for low-income households.
Pradhan Mantri Garib Kalyan Anna Yojana (PMGKAY)
This programme provides free food grains to eligible beneficiaries under the applicable government provisions. It supports household food security by reducing the financial burden associated with purchasing staple grains.
POSHAN Abhiyaan
POSHAN Abhiyaan focuses on improving nutritional outcomes, particularly among children, adolescent girls, pregnant women, and breastfeeding mothers. It emphasizes coordinated action, nutrition awareness, and the monitoring of nutrition-related services.
PM POSHAN Scheme
The PM POSHAN scheme provides cooked meals to eligible children in government and government-aided schools. It supports children’s nutritional intake and encourages school participation and attendance.
National Mission for Sustainable Agriculture
This mission promotes sustainable agricultural practices, efficient resource use, soil and water conservation, and improved resilience to climate variability. It supports the development of farming systems that can remain productive under changing environmental conditions.
Together, these programmes contribute to food availability, affordability, nutrition, and agricultural sustainability. However, effective implementation, improved service delivery, and regular monitoring remain important for achieving better outcomes.
6. Challenges in Achieving SDG 2
Despite global and national initiatives, several challenges continue to slow progress towards Zero Hunger.
Rising food prices: Increasing prices of essential food items can make nutritious diets unaffordable for low-income households.
Persistent malnutrition: Undernutrition, micronutrient deficiencies, and inadequate dietary diversity continue to affect vulnerable populations.
Climate vulnerability: Farmers who depend on rainfall face uncertainty because of changing precipitation patterns, droughts, floods, and extreme temperatures.
Limited agricultural resources: Small-scale farmers may face difficulties accessing affordable credit, modern equipment, irrigation, quality seeds, insurance, and reliable markets.
Food supply chain inefficiencies: Inadequate storage, refrigeration, transportation, and processing facilities contribute to food loss and higher distribution costs.
Unequal access to food: Differences in income, location, infrastructure, and social conditions can prevent some communities from obtaining sufficient and nutritious food.
Environmental degradation: Soil erosion, groundwater depletion, and biodiversity loss threaten long-term agricultural productivity.
Coordination and implementation gaps: Effective food security requires coordination among agriculture, health, education, transport, and social welfare departments.
The United Nations continues to report that global progress towards Zero Hunger is insufficient to achieve the 2030 target. This highlights the need for stronger policies, greater investment, improved food systems, and coordinated international action.
7. Strategies to Achieve SDG 2
Achieving Zero Hunger requires a combination of agricultural, economic, environmental, technological, and social interventions.
1. Promote Sustainable Agriculture
Encourage crop rotation, efficient irrigation, soil conservation, agroforestry, and climate-resilient crop varieties. These practices can improve productivity while reducing pressure on natural resources.
2. Strengthen Food Distribution Systems
Improve storage facilities, cold chains, rural roads, transportation networks, and public food distribution systems. Efficient supply chains can reduce food loss and help food reach underserved communities.
3. Support Small-Scale Farmers
Provide farmers with affordable credit, crop insurance, agricultural training, improved seeds, modern technology, and access to markets. Stronger farmer support systems can improve incomes and reduce vulnerability to crop failure.
4. Improve Nutrition Awareness
Promote balanced diets, dietary diversity, breastfeeding support, maternal nutrition, and child nutrition education. Schools, healthcare centres, and community organisations can play an important role in spreading awareness.
5. Reduce Food Waste
Encourage better harvesting techniques, improved storage, responsible consumption, food recovery, and redistribution of surplus food. These measures can increase the amount of food available for consumption without requiring equivalent increases in production.
6. Use Modern Technology
Apply weather forecasting, precision agriculture, remote sensing, and Geographic Information Systems (GIS) to monitor crop conditions, assess drought risks, identify agricultural land, and improve resource management.
7. Strengthen Social Protection
Improve access to food assistance, school meal programmes, nutrition services, and income support for vulnerable households. Such measures can help families maintain food security during economic downturns and natural disasters.
8. Encourage Community Participation
Involve local governments, farmers’ groups, self-help groups, schools, and civil society organisations in planning and implementing food security initiatives. Community participation can help identify local needs and improve the effectiveness of programmes.
9. Invest in Agricultural Research
Support research into climate-resilient crops, sustainable farming methods, soil health, water efficiency, and pest management. Scientific innovation can improve agricultural productivity while reducing environmental impacts.
10. Improve Monitoring and Evaluation
Use reliable data on hunger, nutrition, food prices, agricultural production, and household access to food to evaluate programmes. Regular monitoring helps governments identify gaps, allocate resources efficiently, and measure progress towards SDG 2.
8. Conclusion
SDG 2, Zero Hunger, represents the global commitment to ending hunger, improving nutrition, ensuring food security, and promoting sustainable agriculture by 2030. It recognises that access to sufficient and nutritious food is essential for human well-being, economic development, and social equality.
Achieving this goal requires more than increasing food production. It involves ensuring equitable food distribution, making nutritious diets affordable, supporting small-scale farmers, protecting agricultural land, reducing food waste, and developing climate-resilient farming systems.
In India, food security programmes and agricultural initiatives provide an important foundation for progress. However, persistent nutritional inequalities, environmental pressures, and difficulties faced by vulnerable households and farmers require continued attention.
Governments, communities, farmers, researchers, and planners must work together to develop food systems that are accessible, sustainable, and resilient. Urban and regional planning can make an important contribution by protecting productive agricultural land, improving food supply infrastructure, strengthening rural-urban connections, and ensuring that underserved communities have access to affordable food.
Ultimately, achieving Zero Hunger means ensuring that every person has reliable access to sufficient, safe, and nutritious food while protecting the natural resources on which future food production depends.
Track2Training Shares a Call for Papers: Envisioning Urban Development–2047
Track2Training invites researchers, urban planners, architects, educators, students and development professionals to explore the forthcoming 75th National Town & Country Planners International Conference, organised by the Institute of Town Planners India (ITPI). With the theme “Envisioning Urban Development–2047,” the conference offers an opportunity to contribute ideas and research addressing the future of cities, towns and regions.
Scheduled for 11–13 February 2027, the conference will take place at the Hyderabad International Convention Centre (HICC), Izzathnagar, Hyderabad, Telangana, India. Its eight sub-themes connect economic development with liveability, inclusion, technology, resilience, infrastructure and environmental renewal.
For the Track2Training community, this announcement is an invitation to examine how research can inform practical planning decisions and help shape urban development that serves people across generations.
Planning Towards 2047
The year 2047 provides a significant horizon for examining India’s urban future. Planning for that future requires attention to the choices being made today: where housing is developed, how transport networks connect communities, how infrastructure is financed and how environmental resources are protected.
A long-term urban vision must address both expanding metropolitan regions and smaller settlements experiencing change. It should also recognise differences in local economic conditions, institutional capacity and community priorities.
The conference theme encourages researchers to connect these everyday planning challenges with a broader development agenda. Strong contributions can move beyond identifying problems to explain which interventions work, under what conditions and for whom.
Productive Cities: Connecting Economic Opportunity and Urban Form
Productive cities depend on the relationship between employment, land use, infrastructure and accessibility. Businesses need reliable services, while workers need affordable housing and convenient connections to workplaces.
Research relevant to this sub-theme could examine employment centres, industrial development, logistics networks, informal livelihoods, mixed-use neighbourhoods or regional economic linkages. Studies might also investigate whether infrastructure investments distribute opportunities fairly across urban populations.
For researchers, the central challenge is to explain how planning can support economic activity while improving the conditions in which people live and work.
Livable Cities: Making Everyday Life Better
A city’s quality is experienced through daily routines: travelling to work, accessing healthcare, taking children to school or finding a safe place to rest outdoors.
The livable cities sub-theme creates space for research on housing, public spaces, walkability, public transport, sanitation, neighbourhood amenities and environmental quality. User surveys, spatial analysis and comparative case studies can help reveal gaps between planned provision and actual experience.
Track2Training encourages scholars to consider whose experiences are represented in their research. Children, older people, persons with disabilities and residents of underserved neighbourhoods can offer essential perspectives on urban liveability.
Gender Sensitive Planning: Designing for Different Needs
Urban spaces and services are experienced differently by different users. Travel associated with caregiving, access to public toilets, personal safety and the location of essential services all have implications for gender sensitive planning.
Potential contributions could explore women’s mobility, public transport design, street lighting, participation in planning or access to employment and public facilities.
Research becomes more useful when it translates these experiences into clear planning recommendations. Inclusive consultation, carefully designed surveys and attention to intersecting social circumstances can help planners understand needs that conventional approaches may overlook.
Digital Cities: Using Technology with Purpose
Digital tools can strengthen urban analysis, service delivery and public participation. Relevant research areas include geographic information systems, remote sensing, digital twins, urban data platforms and technology-supported infrastructure management.
However, a useful digital intervention should address a clearly defined urban problem. Researchers can examine data quality, accessibility, privacy, institutional readiness and the ability of residents to use digital services.
This sub-theme offers opportunities to assess both technological capabilities and implementation challenges. Studies grounded in actual applications can help clarify where digital tools improve decisions and where additional capacity is needed.
Youth in Planning: Bringing Emerging Voices into Decisions
Young people experience cities as students, workers, commuters, entrepreneurs and community members. Their perspectives can contribute to discussions about public spaces, housing, mobility and future employment.
The youth in planning sub-theme invites attention to meaningful participation, planning education, student engagement and opportunities for emerging professionals.
For students and early-career researchers, preparing a conference paper can also strengthen essential skills: defining a research question, reviewing evidence, explaining methods and communicating findings. A focused study with transparent analysis can make a valuable contribution without attempting to address every urban challenge.
Resilient Cities: Preparing for Disruption
Urban resilience involves preparing for hazards, reducing vulnerability and maintaining essential services during disruption. Research may address flooding, extreme heat, water insecurity, infrastructure failure or the capacity of institutions and communities to respond.
Useful studies can connect environmental conditions with land-use decisions, building patterns and service provision. They can also investigate how risks differ across neighbourhoods and social groups.
This sub-theme encourages approaches that link preparedness with long-term planning, including ecosystem protection, infrastructure maintenance and community participation.
Energy, Infrastructure and River Rejuvenation
The Energy & Infrastructure sub-theme provides scope to investigate energy efficiency, renewable energy integration, transport systems, water supply, sanitation and infrastructure financing. Contributions could assess how service networks support sustainable growth and equitable access.
The River Front Development & Rejuvenation sub-theme invites research on the relationship between cities and rivers. Relevant questions include water quality, floodplain management, sewage treatment, ecological restoration, public access and river-dependent livelihoods.
Researchers can contribute by examining environmental and social outcomes alongside physical improvements. Comparative evidence and clearly documented case studies can support more informed decisions about investment and management.
Submission Dates and Participation
According to the conference poster, the updated submission schedule is:
Abstract submission: 15 October 2026; maximum 250 words.
Confirmation of abstract acceptance: 20 October 2026.
Full paper submission: 30 November 2026; maximum 3,000 words.
Confirmation of paper acceptance: 15 December 2026.
Track2Training encourages interested contributors to select a relevant sub-theme, prepare an original abstract and follow the organisers’ submission instructions. Present a clear research problem, explain the method and show how the findings can inform planning practice.
Let us use this opportunity to advance thoughtful discussion about productive, livable, inclusive and resilient urban futures.
Madhya Pradesh is increasingly emerging as one of India’s important production, investment and economic growth centres. Located at the geographical heart of the country, the state has a unique combination of fertile agricultural land, extensive mineral resources, industrial potential, improving infrastructure and a strategic location connecting northern, western, southern and central India.
The economic strength of Madhya Pradesh is particularly visible in agriculture, minerals, manufacturing, food processing and emerging industries. At the same time, the state’s policy environment is becoming an important advantage. The NITI Aayog Investment Friendliness Index 2026 places Madhya Pradesh 5th among large states and 7th overall, with an overall score of 48.9. More significantly, Madhya Pradesh receives 5.4 out of 10 on the Government Policy pillar—the highest score among the large states in the index.
Agricultural Strength: A Major National Producer
Agriculture remains one of the most important pillars of Madhya Pradesh’s economy. NITI Aayog’s assessment shows that agriculture and allied activities have a much larger share in Madhya Pradesh’s Gross State Value Added than the average for Indian states. In 2022-23, agriculture and allied activities accounted for 44.7% of the state’s GSVA, compared with a states’ average of 22.5%.
Madhya Pradesh has established a particularly strong position in pulses, oilseeds, soybean, wheat, maize and several horticultural crops. The state is one of India’s major pulse-producing centres and has traditionally held a leading position in overall pulse production.
Its importance is especially clear in lentil production. According to the Government of India’s Agricultural Statistics at a Glance 2024-25, Madhya Pradesh accounted for 36.42% of India’s lentil production in 2024-25, placing it ahead of other major producing states.
Soybean is another major strength. Madhya Pradesh is popularly known as India’s “Soybean State” because of its large soybean cultivation and production base. The combination of soybean cultivation with edible-oil processing, food processing and agricultural markets creates significant opportunities for value addition.
The state’s agricultural strength also provides a foundation for expanding food-processing industries, cold chains, warehousing, agricultural logistics, dairy, oil extraction, pulse milling and agro-based manufacturing. The next stage of development is therefore not only to increase production but also to process more agricultural commodities within the state.
Mineral Wealth: A Distinctive National Advantage
Madhya Pradesh has one of India’s most diverse mineral-resource bases. The Indian Bureau of Mines (IBM) identifies Madhya Pradesh as the only diamond-producing state in India and a leading producer of several important minerals, including copper concentrate, diaspore, pyrophyllite, manganese ore, limestone and certain clays.
The state’s diamond resources make it particularly distinctive. Panna district is India’s principal diamond-producing region, and IBM reports estimated diamond resources of 8,47,559 carats in Madhya Pradesh.
Copper is another important mineral resource. Madhya Pradesh is home to the major Malanjkhand copper-mining area in Balaghat district. IBM reports that the state produced approximately 25.46 lakh tonnes of copper ore during 2023-24.
Madhya Pradesh also possesses substantial resources of manganese, limestone, dolomite, coal, rock phosphate, bauxite, pyrophyllite and other minerals. IBM reports that the state hosts significant shares of India’s mineral resources, including approximately 19% of the country’s copper-ore resources, 12% of manganese resources and 8% of rock-phosphate resources.
This mineral wealth offers a major opportunity for industrial development. Instead of concentrating only on mineral extraction, Madhya Pradesh can expand mineral processing, engineering, metal-based manufacturing, construction materials and downstream industries. Such value addition can generate greater employment and economic output.
Manufacturing and Industrial Potential
The industrial economy of Madhya Pradesh is becoming increasingly diversified. Major opportunities exist in pharmaceuticals, automobiles and auto components, food processing, textiles, cement, engineering, mineral-based industries, logistics, renewable energy and information technology.
Industrial areas around Pithampur, Indore, Dewas, Mandideep, Bhopal, Gwalior, Jabalpur and other cities provide a foundation for manufacturing and investment. The central location of the state is an additional competitive advantage because industries can serve markets across several major regions of India.
Madhya Pradesh’s economic structure is gradually changing. According to NITI Aayog’s state profile, agriculture accounted for 25.4% of GVA, industry 26.4% and services 48.2% in FY2023 when measured using the profile’s sector classification.
This diversification demonstrates that the state’s economy is not dependent solely on agriculture. Manufacturing and services are increasingly contributing to growth, creating opportunities for skilled employment, entrepreneurship and investment.
Policy Implementation: Madhya Pradesh Ranks First Among Large States
One of the most significant developments in Madhya Pradesh’s economic profile is its performance in government policy.
The NITI Aayog Investment Friendliness Index 2026 evaluates states across several pillars, including business climate, resources, government policy, infrastructure, financial health and institutional factors. Madhya Pradesh scored 5.4 out of 10 on the Government Policy pillar, the highest score among the large states shown in the index. Gujarat followed with 5.1, Rajasthan with 4.8, Odisha with 4.6 and Maharashtra with 3.8.
This is an important distinction: Madhya Pradesh can accurately be described as No. 1 among large states on the Government Policy pillar of NITI Aayog’s Investment Friendliness Index 2026. It should not, however, be described as No. 1 overall in investment friendliness.
On the composite index, Madhya Pradesh scored 48.9 and ranked fifth among 17 large states and seventh among all 36 states and Union Territories. NITI Aayog places it in the “Frontrunners” category.
The index also identifies government policy and resource availability as key enablers for Madhya Pradesh, while identifying business climate as an area requiring further improvement. The report highlights the consistency of state policies as one of the state’s positive indicators.
Comparing Madhya Pradesh with Other States
The comparison with other large states provides an important perspective. Gujarat, Maharashtra, Tamil Nadu and Odisha occupy higher positions in the overall Investment Friendliness Index, but Madhya Pradesh performs particularly strongly in the Government Policy pillar.
This means Madhya Pradesh has an opportunity to convert its policy strengths into stronger outcomes in investment, manufacturing, exports, employment and innovation.
The state’s challenge is therefore not simply to announce policies but to ensure effective implementation at the district and local levels. Faster approvals, reliable infrastructure, skilled labour, easier access to finance, stronger logistics and better connections between industry and research institutions can further improve the investment environment.
Future Possibilities
Madhya Pradesh’s greatest opportunity lies in connecting its different economic strengths.
Agricultural production can support food-processing industries. Soybean and pulses can supply edible-oil and pulse-processing units. Mineral resources can support downstream manufacturing. Industrial clusters can generate employment for skilled workers. Better roads, railways, logistics and warehousing can connect production centres with national and international markets.
The state can also strengthen research, innovation, startups, digital technology, renewable energy and skill development. These areas can help move the economy from resource-based production toward knowledge-based and value-added growth.
Conclusion
Madhya Pradesh has a strong foundation for becoming one of India’s major production and investment hubs. Its agricultural leadership, distinctive mineral resources, growing manufacturing sector, central geographical location and strong performance on the Government Policy pillar provide important advantages.
Its national position should nevertheless be described accurately. Madhya Pradesh is the only diamond-producing state in India, a leading producer of several important minerals, a major agricultural producer, and No. 1 among large states on NITI Aayog’s Government Policy pillar in the 2026 Investment Friendliness Index. Overall, it ranks 5th among large states and 7th across all states and Union Territories in that index.
The future potential of Madhya Pradesh lies in moving beyond the production of raw agricultural and mineral commodities toward value addition, processing, manufacturing, exports, innovation and skilled employment. With effective policy implementation and continued improvements in infrastructure and business conditions, Madhya Pradesh can strengthen its contribution to India’s economic development and establish itself as a major production powerhouse in the years ahead.
References
NITI Aayog – Investment Friendliness Index 2026 This is the key source for Madhya Pradesh’s 5th position among large states, 7th overall, and its Government Policy performance. NITI Aayog – Investment Friendliness Index 2026
NITI Aayog – A Macro and Fiscal Landscape of the State of Madhya Pradesh Useful for the state’s agriculture, industry, services, GSVA and overall economic structure. The report notes that agriculture and allied activities accounted for 44.7% of Madhya Pradesh’s GSVA in 2022-23, substantially above the states’ average. NITI Aayog – Madhya Pradesh Macro and Fiscal Landscape
Indian Bureau of Mines – Indian Minerals Yearbook 2024: Madhya Pradesh This is the main source for the article’s diamond, copper, manganese, limestone and other mineral information. It identifies Madhya Pradesh as India’s only diamond-producing state and a leading producer of several minerals. Indian Bureau of Mines – Indian Minerals Yearbook 2024
Department of Agriculture & Farmers Welfare, Government of India – Agricultural Statistics at a Glance 2024-25 This source supports the article’s agricultural production claims, including Madhya Pradesh’s 36.42% share of India’s lentil production in 2024-25. Agricultural Statistics at a Glance 2024-25
NITI Aayog – Madhya Pradesh State Profile / Investment Friendliness Index 2026 This provides the state’s sectoral GVA structure, key industries, resource advantages and policy consistency indicators, making it useful for the industrial and investment sections. NITI Aayog – Madhya Pradesh State Profile
NITI Aayog – Fiscal Health Index: Madhya Pradesh This can be used as an additional official reference for the state’s fiscal position, revenue performance, capital expenditure and infrastructure-related financial capacity. NITI Aayog – Fiscal Health Index: Madhya Pradesh
By Dileep Verma (Research Expert, Associate Editor of Track2Training, New Delhi, India)
For many PhD scholars, choosing statistical software becomes one of the first difficult decisions in quantitative research. A researcher may have collected hundreds of questionnaires or downloaded years of economic and institutional data, but the next question is often less clear: Which software should I use for data analysis?
SmartPLS, IBM SPSS Statistics, and Stata are three widely used options. However, there is no single “best” software for every PhD thesis. The right choice depends on the research questions, type of variables, theoretical model, statistical technique, and nature of the data.
A common mistake among early researchers is to choose software simply because their supervisor, friend, or department uses it. A better approach is to first identify what the study needs to estimate and then select the software that can perform that analysis appropriately.
Start with Your Research Design, Not the Software
Before comparing SmartPLS, SPSS, and Stata, researchers should understand the difference between data type and analytical method.
Primary data are collected directly for a particular study. Surveys, questionnaires, interviews, experiments, and observations are common examples. In quantitative social science research, questionnaires often measure concepts that researchers cannot observe directly, such as social inclusion, institutional trust, job satisfaction, perceived discrimination, human dignity, or consumer attitudes.
Researchers commonly call these concepts latent constructs. Multiple questionnaire items may measure each construct.
Secondary data, in contrast, already exist before the researcher begins the study. Government databases, Census records, National Sample Survey data, company financial statements, administrative records, and international development databases are examples.
But this distinction alone should not determine the software. A primary survey can be analysed using SPSS or Stata, while secondary datasets can sometimes form part of structural equation models. The central question is therefore: What statistical model does your research require?
SmartPLS: Useful for PLS-SEM Research
SmartPLS is particularly useful when a researcher wants to estimate Partial Least Squares Structural Equation Modeling (PLS-SEM).
PLS-SEM allows researchers to examine relationships among multiple constructs while also assessing how well observed indicators measure those constructs. Hair et al. (2022) explain that researchers using PLS-SEM need to evaluate both the measurement model and structural model.
This makes SmartPLS attractive for survey-based research in management, marketing, information systems, psychology, education, and other social sciences.
Suppose a researcher wants to examine whether institutional inclusion improves human dignity and whether human dignity subsequently influences perceived well-being. Each concept may have several questionnaire items. A simple regression using an average score cannot provide the same measurement-model assessment that SEM offers.
SmartPLS allows researchers to assess indicator loadings, internal consistency reliability, convergent validity, discriminant validity, structural path coefficients, indirect effects, and explanatory and predictive measures.
Another practical advantage is its graphical interface. Researchers can construct theoretical models visually and estimate relationships using procedures such as bootstrapping.
However, SmartPLS should not be selected simply because the researcher has Likert-scale data. The decision to use PLS-SEM requires a methodological justification based on the research objectives and model characteristics.
SPSS: Strong for General Statistical Analysis
IBM SPSS Statistics remains one of the most accessible statistical packages for students entering quantitative research.
Its main strength is usability. Researchers can conduct many analyses through menus without extensive programming knowledge. This makes SPSS particularly useful for data cleaning, descriptive statistics, reliability analysis, exploratory factor analysis, correlation, t-tests, ANOVA, and regression analysis.
For example, a PhD scholar conducting a questionnaire survey may initially use SPSS to examine missing observations, identify coding errors, calculate descriptive statistics, and understand the demographic characteristics of respondents.
SPSS is also valuable when the research questions do not require a complex structural model. If a study primarily asks whether groups differ or whether several observed predictors explain an outcome, SPSS may be entirely sufficient.
Therefore, researchers should not treat SPSS as merely an elementary package. The appropriateness of a statistical technique matters more than whether the software appears sophisticated.
Stata: Particularly Strong for Econometrics
Stata has a particularly strong position in economics, development studies, epidemiology, political science, sociology, and public policy research.
It becomes especially useful when researchers work with cross-sectional, panel, longitudinal, or time-series datasets and need econometric estimation.
For example, a researcher studying employment across Indian states over 15 years may need to account for differences between states and changes over time. Panel-data approaches such as fixed-effects or random-effects models may therefore be appropriate.
Stata provides strong support for these models and for methods dealing with issues such as heteroskedasticity, clustered observations, instrumental variables, treatment effects, and other econometric problems.
Another major advantage is reproducibility.
Researchers can save their commands in do-files. Instead of manually repeating every analytical step, they can rerun the same commands when data change or when reviewers request additional robustness tests. This creates a transparent record of how the researcher moved from raw data to final results.
For doctoral research and journal publication, such reproducibility is highly valuable.
SmartPLS vs SPSS vs Stata: How Should a PhD Scholar Decide?
The simplest way to choose is to begin with the methodological requirement.
If the study develops a theoretical model containing latent constructs measured by multiple indicators and the chosen methodology is PLS-SEM, SmartPLS is a natural option.
If the research requires descriptive statistics, group comparisons, conventional regression, exploratory factor analysis, or straightforward survey analysis, SPSS provides an accessible environment.
If the study focuses on econometric questions involving panel data, longitudinal observations, causal inference strategies, or advanced regression models, Stata may be more appropriate.
Importantly, these programs are not mutually exclusive.
A researcher may clean and describe survey data in SPSS and estimate a PLS-SEM model in SmartPLS. Another researcher may initially inspect data in SPSS before conducting econometric analysis in Stata.
The software should follow the methodology rather than determine it.
What Do Journals Actually Expect?
PhD scholars sometimes worry that journals prefer one particular software package. This concern can lead researchers to select fashionable software even when it does not match their research design.
In most cases, reviewers are more concerned with whether researchers selected an appropriate method, tested its assumptions, reported the analysis transparently, and interpreted the findings correctly.
A sophisticated software package cannot rescue a poorly specified research model.
Similarly, using a familiar program does not weaken a study when the analytical technique is appropriate.
Researchers should therefore be able to answer three questions clearly: Why was this statistical method selected? Why is it appropriate for the research questions and data? How were the results assessed for reliability and robustness?
These questions matter much more than the software logo appearing in the methodology section.
Final Advice for PhD Scholars
Choosing statistical software should be a methodological decision, not a popularity contest.
Use SmartPLS when PLS-SEM genuinely fits your theoretical model. Use SPSS when your study requires accessible general statistical analysis. Use Stata when econometric modelling, panel structures, longitudinal analysis, or related methods form the core of the research.
Most importantly, learn the statistical reasoning behind the software.
Knowing where to click can generate an output table. Understanding why a model is appropriate, what its assumptions mean, how to evaluate its results, and what conclusions the evidence permits is what turns statistical output into credible research.
For a PhD scholar, that distinction matters. Software is only a tool. The research question, theoretical framework, data structure, and methodological reasoning should always come first.
References
Baum, C. F. (2006). An Introduction to Modern Econometrics Using Stata. Stata Press.
Field, A. (2018). Discovering Statistics Using IBM SPSS Statistics (5th ed.). SAGE.
Hair, J. F., Hult, G. T. M., Ringle, C. M., & Sarstedt, M. (2022). A Primer on Partial Least Squares Structural Equation Modeling (PLS-SEM) (3rd ed.). SAGE.
Hair, J. F., Risher, J. J., Sarstedt, M., & Ringle, C. M. (2019). When to use and how to report the results of PLS-SEM. European Business Review, 31(1), 2–24.
Henseler, J., Ringle, C. M., & Sarstedt, M. (2015). A new criterion for assessing discriminant validity in variance-based structural equation modeling. Journal of the Academy of Marketing Science, 43(1), 115–135.
Wooldridge, J. M. (2020). Introductory Econometrics: A Modern Approach (7th ed.). Cengage Learning.
✍️ By Dileep Verma Research Expert and Associate Editor of Track2Training, New Delhi, India
We are living in one of the most exciting periods in human history.
Artificial intelligence can write, translate, analyse data and help scientists discover new medicines. Robots are working in factories and hospitals. Machines can learn from huge amounts of information. Private companies are sending people into space. Countries are investing billions in semiconductors, quantum computing, biotechnology, clean energy and advanced defence technologies.
Knowledge has become power.
Technology has become power.
Research has become power.
And in this fast-changing world, India has more than a billion people, millions of young students, engineers, researchers and entrepreneurs. We have enormous human potential.
Yet sometimes, when I open social media or watch our public debates, I ask myself a simple question:
Are we using enough of this potential in the right direction?
We have smartphones in our hands, high-speed internet in our homes and access to almost unlimited knowledge. But too much of our public conversation is still trapped in caste fights, Hindu-Muslim arguments, religious controversies, political abuse and social-media hatred.
This is one of the great contradictions of modern India.
A Modern Phone Does Not Automatically Make a Modern Society
Think about the smartphone in your hand.
It may contain technology developed across several countries. Its processor, operating system, display, camera sensors, software and applications are the result of decades of scientific research.
Through this small device, we can read books from the world’s best universities, learn programming, study mathematics, watch scientific lectures, use artificial intelligence, start a business or communicate with people thousands of kilometres away.
But what are we sometimes doing with this extraordinary technology?
We forward rumours.
We fight over caste.
We abuse people because of religion.
We share edited videos without checking whether they are true.
We insult strangers because they support a different political party.
There is something deeply ironic about using some of the world’s most advanced technology to fight some of society’s oldest battles.
Technology may be modern, but our thinking must also become modern.
Caste and Religion Are Real, But Hatred Is Not a Solution
India cannot simply pretend that caste and religion do not matter.
Caste discrimination is real. Social inequality is real. Religious freedom matters. Minority rights matter. Historical injustice matters.
These issues deserve serious discussion.
But discussing inequality is different from spreading hatred.
Protecting one’s religious freedom is different from insulting another person’s religion.
Being proud of one’s community is different from believing another community is inferior.
India’s diversity is not the problem.
The problem begins when diversity is converted into permanent hostility.
A country of more than a billion people cannot move forward if every community is continuously encouraged to fear or hate another community.
We Also Need to Change the Questions We Ask Politicians
Politicians respond to what voters reward.
If elections are discussed mainly through caste arithmetic, religious identity and community polarization, political parties naturally invest more energy in those issues.
But imagine if voters repeatedly asked different questions:
Where are the jobs?
How good are our government schools?
Why is the air in our city polluted?
How much are we spending on scientific research?
Where are the new universities and laboratories?
Why is public transport poor?
How many new industries have come to our district?
What are we doing in AI, robotics and semiconductor technology?
Why are talented researchers leaving our institutions?
These questions can change political priorities.
Voting is not only a right. It is also one of the ways citizens communicate what they expect from government.
India Is Making Progress, But We Should Aim Higher
It would also be unfair to say that India is doing nothing in technology.
India has built a major IT industry, a respected space programme and important digital public infrastructure. Electronics and mobile-phone manufacturing have expanded significantly. The country is investing in artificial intelligence and semiconductor capabilities.
These achievements should be recognized.
But recognizing progress does not mean that we should stop asking difficult questions.
India’s expenditure on research and development remains relatively low compared with several major technology-driven economies.
That matters.
Countries do not become scientific powers simply because millions of their citizens use smartphones.
They become scientific powers when they create knowledge.
They build laboratories.
They fund researchers.
They produce patents.
They develop technologies.
They manufacture sophisticated products.
They encourage experimentation.
They allow talented people to take risks.
We Must Move From Consumers to Creators
Most of us use global digital platforms every day.
We watch videos.
We upload photographs.
We send messages.
We use AI tools.
There is nothing wrong with using foreign technology. International trade and knowledge exchange are important parts of modern civilization.
But India should also ask:
What are we building for the world?
Can the next major AI platform come from India?
Can Indian companies become global leaders in robotics?
Can we design and manufacture advanced semiconductor chips?
Can our universities become destinations where researchers from other countries want to work?
Can an Indian company create a digital product used by billions of people?
Can India develop affordable technologies that solve problems in healthcare, agriculture, education and clean energy?
These are the conversations young Indians should be having.
Do Not Blame Young Engineers for Going Abroad
We often complain that India’s best engineers and researchers leave for the United States, Europe and other developed economies.
But we should be careful before blaming them.
Imagine a young researcher receiving two opportunities.
One offers a modern laboratory, strong research funding, professional freedom, a good salary and the opportunity to work with leading scientists.
The other offers limited equipment, uncertain funding and fewer research opportunities.
Which one would most people choose?
Instead of asking only:
“Why are our talented people leaving India?”
we should ask:
“How can we build an India where talented people want to stay, return and create?”
Patriotism is valuable, but patriotism cannot replace laboratories, research grants, professional opportunities and good institutions.
Give talented young people an environment in which they can succeed, and many will happily build their future here.
Civic Sense Matters Too
Technology alone cannot make a country developed.
Our everyday behaviour matters.
Do we stop at a red traffic light when no police officer is watching?
Do we throw garbage on the road?
Do we damage public property?
Do we unnecessarily honk?
Do we respect queues?
Do we verify information before forwarding it?
Can we disagree with someone without abusing them?
Can a Hindu respect a Muslim neighbour?
Can a Muslim respect a Hindu neighbour?
Can people from different castes study, work and live together with dignity?
These small behaviours tell us something important about a society.
Civic sense is also a form of national development.
A developed country is not only one with tall buildings, expensive cars and fast internet.
It is also a society where people respect public spaces, laws, institutions and one another.
Our Education System Must Build Citizens, Not Just Job Seekers
We spend years preparing children for examinations.
Marks matter.
Degrees matter.
Employment matters.
But education should do something more.
It should teach a young person how to think.
How to question information.
How to distinguish evidence from rumours.
How to respect another person’s dignity.
How to behave in public spaces.
How to understand the Constitution.
How to use technology responsibly.
How to disagree without hatred.
And how to solve problems.
Interestingly, India’s Constitution itself speaks about developing scientific temper, humanism and the spirit of inquiry and reform under Article 51A(h).
Those words feel especially important today.
Imagine a Different Competition
Imagine if our young people competed as passionately over innovation as people sometimes fight over identity online.
Which Indian university will produce the next major scientific discovery?
Which state will build the best government schools?
Which Indian startup will create a globally successful AI product?
Which city will become India’s cleanest and most liveable?
Which engineering college will produce the next breakthrough in robotics?
Which Indian company will develop affordable medical technology for the world?
Which research team will create better batteries, solar technologies or agricultural systems?
That is the kind of competition India needs.
The Smartphone in Our Hand Represents a Choice
Every morning, millions of Indians pick up a smartphone.
That device gives us a choice.
We can use it to learn.
Or we can use it to hate.
We can read research.
Or forward rumours.
We can learn artificial intelligence.
Or spend hours fighting strangers over religion.
We can build professional networks.
Or create communal divisions.
We can learn from the world.
Or remain trapped in arguments inherited from the past.
The technology does not make that decision.
We do.
What Kind of India Do We Want?
India does not need to abandon religion, caste identities, traditions or cultural diversity to become modern.
Modernity does not mean becoming Western.
It means developing the ability to use reason, evidence, science, education and good institutions to improve human life.
We can preserve our cultures while building laboratories.
We can practise our religions while respecting other religions.
We can recognize caste injustice without creating caste hatred.
We can disagree politically without treating fellow citizens as enemies.
And we can be proud Indians while remaining open to knowledge from the entire world.
The twenty-first century will not wait for us.
AI is advancing.
Robotics is advancing.
Biotechnology is advancing.
Space technology is advancing.
Clean-energy technology is advancing.
Other societies are investing heavily in the industries and knowledge systems that may define the next fifty years.
India has the population, talent and ambition to be part of that future.
But our greatest resource is not our population alone.
It is what we educate, enable and inspire that population to do.
So perhaps the question we should ask ourselves is not:
Which caste are you from?
Not:
Which religion do you follow?
But:
What are you learning?
What are you creating?
What problem are you solving?
And what kind of India are we building together?
Because the future will not be built by hatred.
It will be built by knowledge, character, scientific thinking, cooperation and human effort.
✍️ By Dileep Verma Research Expert and Associate Editor of Track2Training, New Delhi, India
Look up at the night sky at the right moment and you may see a bright point of light moving rapidly from one horizon to another.
That light is not a star or a planet.
It is one of the most remarkable machines humanity has ever constructed: the International Space Station (ISS).
Orbiting roughly 400 kilometres above Earth, the ISS travels at about 17,500 miles per hour, completing an orbit approximately every 90 minutes. NASA notes that the station circles Earth about 16 times every 24 hours. It has also been continuously occupied since November 2000. NASA
But the ISS is much more than an engineering achievement.
It is a working demonstration of what human beings can accomplish when science, international cooperation, disciplined administration, technological innovation, and long-term planning are brought together.
A Laboratory Above the Earth
The International Space Station is essentially a permanently crewed research laboratory in low Earth orbit.
Its scale is extraordinary. Yet what makes the ISS especially important is not simply its physical size. It is what happens inside it.
Thousands of experiments have been conducted aboard the station. NASA reports research across biology and biotechnology, human health, physical sciences, Earth and space science, technology development, and other areas. Its research database now encompasses more than 4,000 experiments over more than two decades of station science. NASA
In 2025 alone, researchers using the orbital laboratory conducted more than 750 investigations, according to NASA’s annual research highlights. NASA
Scientists are studying questions such as:
How does the human body respond to prolonged microgravity?
How do plants grow in space?
How do cells and tissues behave without normal gravity?
How can materials be developed differently in microgravity?
How can technologies be improved for future journeys to the Moon and Mars?
The ISS therefore functions not simply as a spacecraft, but as a continuously operating scientific institution.
Five Space Agencies, One Extraordinary Project
Perhaps the greatest lesson of the ISS is not technological at all.
It is institutional.
The station is operated through an international partnership involving five major space agencies: NASA of the United States, Roscosmos of Russia, the European Space Agency (ESA), the Japan Aerospace Exploration Agency (JAXA), and the Canadian Space Agency (CSA). NASA
These partners come from countries with different languages, histories, political systems, national interests, and geopolitical relationships.
Yet hundreds of kilometres above Earth, their technologies have been integrated into one functioning system.
NASA explicitly describes the station as interdependent. Different partners manage different hardware and capabilities, and no single partner currently has the capability to operate the entire station independently. NASA
That is a remarkable organizational achievement.
From Cold War Competition to Scientific Cooperation
The ISS also carries historical significance.
For decades, the United States and Soviet Union competed intensely in space as part of the broader Cold War rivalry.
Space exploration demonstrated technological capability and national power.
Yet the ISS emerged in a different era.
Former competitors became partners.
Engineers began integrating technologies.
Astronauts and cosmonauts trained together.
Mission-control centres coordinated operations.
Scientific institutions shared responsibilities.
This does not mean that geopolitical disagreements disappeared. They did not.
The lesson is more practical:
Countries do not need to agree on everything before they can cooperate on something important.
This principle deserves greater attention in the twenty-first century.
Lesson 1: Shared Problems Need Shared Objectives
Climate change does not recognize international borders.
Neither do pandemics, environmental degradation, ocean pollution, cyber threats, or many economic shocks.
These problems cannot be addressed effectively by one country acting entirely alone.
The ISS demonstrates that cooperation becomes possible when institutions define a sufficiently clear common objective.
Instead of beginning with:
“Where do we disagree?”
international cooperation can sometimes begin with:
“What problem must we solve together?”
This shift from ideological confrontation toward problem-solving is one of the strongest lessons of the space station.
Lesson 2: Science Gives Humanity a Common Language
An American engineer and a Japanese engineer may speak different languages.
Their countries may have different political institutions.
But the physical laws governing orbital mechanics do not change with nationality.
Gravity behaves consistently.
Mathematics works consistently.
Engineering tolerances cannot be negotiated politically.
This makes scientific reasoning a powerful framework for international cooperation.
When evidence changes, scientific understanding can change with it.
That principle is particularly important when societies confront complex problems such as climate change, public health, food security, energy transitions, and environmental protection.
Policy choices involve values and trade-offs, but the factual foundations of those choices should be informed by the best available evidence.
Lesson 3: Enormous Problems Become Manageable When Divided Into Modules
The ISS could not simply be built on Earth as one enormous structure and launched into orbit.
Instead, it was assembled progressively from modules and components.
Different countries and organizations could therefore contribute specialized capabilities to a larger system.
This offers a valuable management principle:
Do not try to solve every part of a complex problem simultaneously. Break it into manageable components.
The same principle applies to governments, universities, companies, infrastructure projects, and even individual research projects.
Climate change is enormous.
But renewable energy, public transport, energy efficiency, forest protection, adaptation, climate science, and industrial innovation can become defined areas of action.
Complexity becomes manageable when it is structured.
Lesson 4: Build Redundancy Before a Crisis Occurs
On Earth, a failed system may cause inconvenience.
In space, it can become life-threatening.
That is why spacecraft engineering places enormous importance on reliability, monitoring, backup capabilities, maintenance, and contingency planning.
This mindset has relevance far beyond aerospace engineering.
Hospitals need backup electricity.
Cities need emergency water systems.
Governments need disaster-response capacity.
Companies need data backups.
Countries need resilient food and energy systems.
The central principle is simple:
Resilience should be designed before the emergency, not improvised after it.
Lesson 5: Human Problems Require Human Action
One of the deeper philosophical lessons of the ISS is human agency.
People hold many different religious and philosophical beliefs, and science does not need to settle those personal questions in order to solve practical problems.
But when astronauts need oxygen, engineers must build functioning life-support systems.
When spacecraft must reach orbit, scientists must calculate trajectories.
When equipment fails, technicians must diagnose the problem.
When climate risks increase, societies must decide how to respond.
Whatever our personal beliefs, practical problems require practical action.
Prayer, hope, or belief may have personal meaning for individuals, but they cannot substitute for engineering calculations, medical evidence, environmental measurements, functioning institutions, or public policy.
Climate change will not be addressed by hope alone.
War will not end simply because humanity wishes it away.
Poverty will not disappear without institutions, resources, education, economic opportunities, and policy action.
Human beings must take responsibility for the problems human societies can address.
The ISS Is Still Making History
This is not merely a historical story.
On October 1, 2026, NASA’s SpaceX Crew-13 mission reached the International Space Station.
NASA astronauts Jessica Watkins and Luke Delaney, Canadian Space Agency astronaut Joshua Kutryk, and Roscosmos cosmonaut Sergey Teteryatnikov docked with the station and joined Expedition 75. NASA
The mission is continuing research that includes human health, plant growth, tissue research, and technologies relevant to future exploration. NASA
So, more than a quarter-century after continuous habitation began, the laboratory is still generating scientific knowledge.
A Blueprint for the Twenty-First Century
Humanity faces serious challenges.
🌍 Climate change and global warming ⚔️ Armed conflict and geopolitical rivalry 💧 Water scarcity 🌾 Food insecurity 🦠 Emerging diseases ⚡ Energy transitions 🤖 Rapid technological change 🌊 Environmental degradation
None has a magical solution.
They require research.
They require evidence.
They require institutions.
They require international cooperation.
They require political negotiation.
They require resources.
And, above all, they require human beings willing to organize and act.
The ISS shows that countries with different interests can still build something together when they recognize a shared objective.
When You See the ISS, Look at What Humanity Built
The International Space Station should therefore be understood as more than a spacecraft.
It is a laboratory.
It is an engineering system.
It is an international institution.
It is an experiment in cooperation.
And it is a demonstration of human agency.
When we see that bright object crossing the night sky, we are looking at thousands of scientists, engineers, astronauts, technicians, administrators, organizations, and institutions whose work has been combined into one extraordinary achievement.
The ISS was not created by chance.
It was studied, calculated, financed, negotiated, engineered, tested, launched, assembled, maintained, repaired, and continuously improved by human beings.
That may be its most valuable lesson for the twenty-first century.
When humanity replaces helplessness with inquiry, isolation with cooperation, and wishful thinking with informed action, seemingly impossible problems can become solvable projects.
The ISS does not prove that humanity can solve every problem.
It proves something more useful:
we already possess powerful tools for trying.
Science gives us evidence.
Reason helps us evaluate it.
Technology expands what we can do.
Cooperation expands who can contribute.
And organized human action turns knowledge into results.
That is the lesson orbiting above us every 90 minutes.
Suggested website categories: Science | Technology | International Cooperation | Management | Public Administration
Suggested tags: International Space Station, ISS, NASA, Space Science, Scientific Thinking, International Cooperation, Human Agency, Climate Change, Global Governance, Project Management, Technology, Space Exploration, Public Administration
✍️ By Dileep Verma Research Expert and Associate Editor of Track2Training, New Delhi, India
When we look at the Great Pyramid of Giza, we usually think about its enormous stones, extraordinary height, mysterious construction methods, and remarkable survival over thousands of years. It is one of the most recognizable monuments ever created by human civilization.
But there is another way to understand the Great Pyramid.
Beyond architecture and engineering, it represents an extraordinary example of planning, administration, logistics, workforce organization, and long-term project management.
Built for the Egyptian pharaoh Khufu during the Fourth Dynasty, around the 26th century BCE, the Great Pyramid originally stood about 146.5 metres high. According to Egypt’s Ministry of Tourism and Antiquities, it remained the world’s tallest building for approximately 3,800 years.
More than four millennia later, the question is not only how ancient Egyptians built such a monument, but also how they organized the enormous human and material system required to complete it.
More Than an Engineering Achievement
The Great Pyramid was constructed primarily from limestone. Higher-quality Tura limestone was used for its original outer casing, while granite was incorporated into important internal spaces.
Transporting these materials required an organized system extending far beyond the construction site.
Stone had to be quarried and prepared. Boats had to transport material. Workers needed food, water, shelter, equipment, and supervision. Tools had to be produced and maintained. Different teams had to perform specialized tasks while remaining connected to the larger construction programme.
In modern terminology, the project required elements of supply-chain management, human-resource management, procurement, logistics, transportation, supervision, and project coordination.
This was achieved without computers, trucks, cranes, spreadsheets, GPS, or modern communication systems.
That makes the administrative achievement behind the pyramid almost as fascinating as the structure itself.
The Diary of Merer: Evidence of Ancient Administration
One of the most interesting discoveries related to Khufu’s pyramid is the Diary of Merer, part of a collection of ancient papyri discovered at Wadi al-Jarf.
Merer was an official associated with a crew involved in transporting limestone. His records describe journeys connected with moving limestone from Tura toward the pyramid construction area during Khufu’s reign.
This is significant because it gives us a rare glimpse into the administrative machinery behind pyramid construction.
Someone had to organize crews.
Someone had to record activities.
Someone had to coordinate transportation.
Someone had to ensure materials reached their destination.
The pyramid was therefore not simply the product of physical labour. It depended on an administrative system capable of coordinating thousands of activities toward a common objective.
Were the Pyramid Builders Slaves?
Popular movies have often portrayed Egyptian pyramids as products of huge groups of enslaved workers being forced to work under brutal conditions.
Archaeological evidence presents a more complicated picture.
Excavations at Giza have uncovered a workers’ settlement associated with pyramid construction. Archaeologists have identified houses, streets, administrative facilities, storage areas, food-production facilities, and evidence of substantial food provisioning.
Egypt’s Ministry of Tourism and Antiquities describes a settlement south of the Sphinx where workers involved in pyramid construction lived, with evidence including administrative buildings and substantial quantities of animal remains.
This does not mean ancient Egyptian labour conditions should be romanticized. Our evidence is incomplete, and ancient labour systems differed greatly from modern employment.
What it does show is that pyramid construction required a far more organized labour system than the simplistic image of uncontrolled masses performing physical work.
Lesson 1: Large Projects Depend on Logistics
A project of this scale could not continue unless materials arrived when required.
Imagine a construction site where hundreds or thousands of people are ready to work, but the required stone does not arrive.
Or the stone arrives but tools are unavailable.
Or workers are present but food supplies fail.
Construction slows or stops.
Modern organizations face the same basic problem.
Large infrastructure projects, manufacturing plants, hospitals, universities, railways, and government programmes depend on interconnected systems.
The lesson from Giza is simple:
Do not manage only the final project. Manage the entire system that makes the project possible.
Lesson 2: People Are Part of the Infrastructure
The archaeological evidence of worker accommodation and food provisioning provides another important management lesson.
A large project cannot depend only on physical resources.
Workers must also be sustained.
In modern management, organizations often discuss technology, artificial intelligence, automation, finance, and infrastructure. Yet the success of almost every organization ultimately depends on people.
Human-resource management should therefore not be treated merely as an administrative department.
Employee health, training, working conditions, motivation, communication, and organizational clarity can directly influence performance.
The pyramid reminds us that human infrastructure matters alongside physical infrastructure.
Lesson 3: Break a Huge Goal into Smaller Tasks
“Build a pyramid” sounds almost impossible.
But “quarry this stone,” “transport this material,” “prepare these tools,” or “complete this section” is manageable.
This is one of the oldest and most powerful principles of project management.
Complex objectives become achievable when they are divided into smaller tasks and assigned to organized teams.
Different groups involved in pyramid construction would have required different responsibilities and skills.
The broader lesson applies equally well today.
Whether writing a PhD thesis, constructing a highway, implementing public policy, developing software, or running a national programme, a large objective must be transformed into specific, measurable, coordinated activities.
Lesson 4: Long-Term Projects Need Institutional Continuity
The exact construction timeline of the Great Pyramid remains uncertain, but Egypt’s antiquities authority gives an estimate of approximately 10 to 20 years.
This is particularly important for modern public administration.
Many of today’s biggest challenges cannot be solved within a single financial year or political cycle.
Major transport systems, educational reforms, climate adaptation, scientific programmes, urban development, and institutional reforms may require decades.
Long-term development therefore depends not only on leaders but also on institutions capable of preserving knowledge and maintaining direction over time.
Lesson 5: Administration Is a Form of Technology
We normally associate technology with machines.
But technology can also mean systems and methods that allow humans to accomplish tasks more efficiently.
From this perspective, administration itself can be considered an important organizational technology.
Record keeping, division of labour, supervision, resource allocation, transportation planning, standardization, and coordination enabled ancient societies to undertake projects far beyond the capacity of individuals.
Modern organizations possess dramatically more advanced tools, yet they still fail when coordination breaks down.
A sophisticated computer system cannot compensate indefinitely for unclear responsibilities, poor communication, weak planning, or disorganized leadership.
The ancient lesson remains surprisingly relevant:
Technology improves capability, but organization converts capability into results.
What the Great Pyramid Still Teaches Us
The Great Pyramid is the only surviving monument of the traditional Seven Wonders of the Ancient World.
Its physical survival is extraordinary.
But perhaps its intellectual legacy is equally valuable.
It demonstrates what human beings can achieve when knowledge, labour, resources, planning, and administration are brought together around a clearly defined objective.
Great achievements rarely emerge from one person working alone.
They depend on systems.
Vision without planning remains an idea.
Resources without coordination produce waste.
People without defined responsibilities create confusion.
Technology without organization has limited value.
But when vision, people, knowledge, resources, and administration work together, human beings can accomplish things that initially appear impossible.
More than 4,500 years after its construction, millions of people still look at the Great Pyramid and ask:
“How did they do it?”
Perhaps part of the answer lies not only in engineering.
It lies in the extraordinary power of organized human effort.
One vision. Thousands of workers. Millions of individual tasks. One monument that survived thousands of years.
Suggested website categories: History | Management | Public Administration | Leadership | Project Management | Ancient Civilizations
Suggested tags: Great Pyramid of Giza, Ancient Egypt, Khufu, Project Management, Public Administration, Human Resource Management, Supply Chain Management, Leadership, Organizational Management, Ancient Engineering, History
By Dileep Verma (Research Expert and Associate Editor of Track2training, New Delhi, India)
Writing your first research paper and targeting Scopus or ESCI (Emerging Sources Citation Index) journals feels like a daunting task when you start your PhD. Many early-career scholars make the mistake of jumping straight into writing without understanding how academic papers are structured and built.
Here is a step-by-step roadmap to guide you from a raw research idea to a polished paper ready for indexing.
1. Foundation: Framing a Publishable Idea
A paper published in Scopus or ESCI must contribute something distinct. It does not need to revolutionize the field, but it must offer a fresh lens, clear data, or a new context.
Identify a Specific Research Gap: Read 15 to 20 recent papers (published in the last three years) from top journals in your field. Look at their “Future Research Directions” or “Limitations” sections. That is where your paper begins.
Refine Your Objective: Avoid broad topics. Instead of writing about “Public Policy in India,” focus on a concrete, measured angle like “Perception Analysis of Reservation Policy Implementation among SC Communities in Central India.”
Choose the Right Paper Type: As a beginner, focus on either an empirical paper (based on primary data like surveys or interviews) or a systematic literature review (SLR) using PRISMA guidelines. Both are welcomed by Scopus/ESCI journals if done rigorously.
2. Standard Structure of a Research Paper (IMRaD)
High-impact journals follow a clear, predictable structure: Introduction, Methodology, Results, and Discussion (IMRaD).
Write these last. Your title should be direct and informative. The abstract (150–250 words) must summarize five things:
Context/Problem
Objective
Methodology used
Key findings
Broader implications
B. Introduction
Your introduction sets the hook for reviewers. Keep it clear and logical using a 4-paragraph model:
Paragraph 1: Context and importance of the topic.
Paragraph 2: The core problem and what previous studies missed (the gap).
Paragraph 3: Your study’s specific objective and research questions.
Paragraph 4: The value and originality of your contribution.
C. Literature Review
Do not just summarize paper by paper (“Author A said X, Author B said Y”). Instead, organize your review thematically. Group existing works around themes, spot contradictions in past research, and show how your study connects to established theories.
D. Methodology
Write this section with enough clarity that another researcher could replicate your study.
Explain your research design (quantitative, qualitative, or mixed-methods).
State your population, sample size, sampling technique, and instruments (e.g., Likert-scale surveys or semi-structured interviews).
Mention ethical considerations and data validation techniques (e.g., Cronbach’s alpha for quantitative reliability or thematic analysis for qualitative data).
E. Results
Present your data plainly. Use tables and figures to summarize large blocks of information. Walk the reader through the key patterns in your data without over-interpreting them yet. Keep your prose objective and direct.
F. Discussion (The Core of Scopus/ESCI Acceptance)
This is where many early papers fail. Do not just repeat your findings. Answer these questions:
Why did you get these results?
How do your findings compare with previous studies? Do they agree, contradict, or extend prior research?
What does this mean for theory and practice (e.g., policy implementation)?
G. Conclusion and Implications
Summarize the main contribution in simple terms. Clearly outline practical/policy implications (how practitioners or policymakers can use this work) and state the limitations of your study candidly.
3. Transitioning from Conference Papers to Journal Articles
Conferences are testing grounds; journals are permanent records.
Feature
Conference Paper
Scopus/ESCI Journal Paper
Length
3,000–5,000 words
6,000–9,000 words
Focus
Preliminary ideas, ongoing work
Completed research with deep analysis
Review Process
Rapid (2–6 weeks), broad feedback
Rigorous peer review (2–6 months)
Depth
Basic methodology and initial findings
Comprehensive literature and strong theoretical grounding
How to Convert a Conference Paper to a Journal Paper
Expand the Literature Review: Move beyond basic context to deep theoretical analysis.
Strengthen the Data: Add a larger sample size or deeper qualitative analysis.
Expand the Discussion: Elaborate heavily on why the findings matter.
Target a New Draft: Scopus journals typically require significant structural and content updates (at least 30–40% new material) compared to conference proceedings.
4. Academic Writing and Style Essentials
To reach Scopus/ESCI quality, your writing must meet clear academic standards:
Use Active Voice: Instead of writing “The data was analyzed by the researcher,” write “We analyzed the data using SPSS.” It makes your writing direct and clear.
Keep Sentences Short and Strong: Express one main idea per sentence. Complex ideas do not require long, convoluted sentences.
Avoid Fluff: Skip empty phrases like “it is widely acknowledged that” or “a pivotal moment.” Get straight to the point.
Cite Recent, High-Quality Sources: At least 60–70% of your references should come from indexed journals published in the last 5 years.
5. Submitting and Handling Reviews
Finding the right journal is half the battle.
Journal Selection: Use tools like Elsevier Journal Finder, Springer Journal Suggester, or Web of Science Master Journal List. Check if the journal is actively listed in Scopus or ESCI.
Follow Author Guidelines: Adjust formatting, citation style (APA, IEEE, Harvard), word count, and heading styles strictly according to the target journal’s template.
Handling Rejections and Revisions:
Desk Reject: Means the paper does not fit the journal scope or lacks basic formatting. Refine and target another journal.
Major/Minor Revision: A huge win. Address every single reviewer comment in a point-by-point response table, explaining clearly what changes you made.
Writing high-quality papers is a skill built through practice. Focus on clear logic, explicit methods, and strong evidence, and your work will find its place in reputed indexed journals.
The Anusandhan National Research Foundation (ANRF) has announced a significant research funding opportunity through the Inclusivity Research Grant (IRG) 2026. The programme is designed to support eligible researchers belonging to the Scheduled Caste (SC) and Scheduled Tribe (ST) communities in undertaking high-quality research in frontier areas of science and engineering. This initiative represents an important step toward strengthening inclusion, diversity, research capacity, and wider participation in India’s scientific and technological development.
Researchers, faculty members, scientists, and eligible investigators interested in applying for this opportunity can refer to the announcement and related information here:
According to the ANRF announcement, applications for the Inclusivity Research Grant open on 1 October 2026, with the last date for submission being 3 November 2026. Prospective applicants should therefore begin preparing their research concepts, project objectives, methodology, work plans, budget requirements, expected outcomes, and supporting documents well before the deadline.
What is the Inclusivity Research Grant?
The Inclusivity Research Grant is intended to facilitate greater participation of researchers from SC and ST communities in advanced scientific and engineering research. Access to adequate research funding can play a decisive role in helping investigators establish laboratories, recruit research personnel, conduct fieldwork and experiments, acquire essential resources, participate in collaborations, publish findings, and translate research outcomes into innovation.
Through initiatives such as the IRG, researchers may be able to pursue ambitious research questions while developing stronger academic and scientific networks.
The programme is particularly relevant in an environment where interdisciplinary and frontier research increasingly requires substantial financial, technical, and institutional support.
Funding Support of Up to ₹60 Lakh
One of the key features highlighted in the announcement is financial support of up to ₹60 lakh plus applicable overheads for a project duration of three years.
This level of support may provide researchers with the opportunity to design comprehensive projects involving experimental studies, computational research, field investigations, technology development, data collection, laboratory work, prototype development, or other eligible scientific and engineering activities.
A three-year project period also allows researchers to structure their work systematically through different phases, such as literature review, research design, data collection, experimentation, analysis, validation, dissemination, and publication.
Applicants should carefully prepare a realistic project budget that is directly connected to the proposed objectives and methodology.
Flexible Provisions for Research Manpower
Research projects often depend heavily on skilled manpower. The IRG announcement highlights flexible norms for manpower recruitment, which may help principal investigators build suitable research teams depending on the nature of their projects.
Research personnel can contribute to activities such as:
laboratory experiments and testing,
field surveys and data collection,
programming and computational modelling,
statistical analysis,
documentation,
literature reviews,
prototype development,
database preparation,
technical reporting, and
research dissemination.
Applicants should clearly explain the need for research personnel and their proposed responsibilities while preparing the project.
Support for Travel and Contingency Requirements
Research does not always take place within a single laboratory or institution. Researchers may need to conduct field investigations, visit research facilities, meet collaborators, attend academic events, collect samples, access specialised equipment, or participate in scientific discussions.
The IRG announcement indicates provisions relating to enhanced travel and contingency support.
Such provisions can be especially valuable for interdisciplinary projects requiring collaboration among institutions or field-based research in different geographical locations.
A well-prepared proposal should therefore explain why travel, fieldwork, specialised resources, or contingency expenditure is necessary for achieving the project’s research objectives.
International Travel Support
Another important aspect highlighted in the announcement is support for expenses associated with international travel.
International exposure can help researchers participate in global conferences, present findings, interact with experts, develop collaborations, learn emerging methodologies, and increase the visibility of Indian research.
Where international travel is proposed, applicants should demonstrate its relevance to the research project rather than treating it as an isolated activity. Participation in relevant conferences, research visits, specialised training programmes, or scientific collaborations may strengthen the long-term impact of a research project.
Support for Open Access Publications
Academic publishing has become increasingly important for research visibility and knowledge dissemination. At the same time, article processing charges associated with some open-access journals may be substantial.
The IRG announcement mentions support for expenses related to open-access publications.
This provision can help researchers disseminate project findings to a wider academic and professional audience. Researchers should nevertheless select journals carefully and prioritise legitimate, peer-reviewed publications that are appropriate for the scope and quality of the research.
Before submitting a paper, investigators should verify the journal’s editorial standards, indexing claims, peer-review process, publication policies, and ethical practices.
Patent Filing Support
Research projects in science and engineering frequently produce technologies, processes, products, systems, materials, designs, or methods with potential intellectual property value.
The Inclusivity Research Grant also highlights support related to patent filing charges.
Researchers developing potentially patentable innovations should consider intellectual property planning from an early stage. Institutional intellectual property or technology-transfer cells can provide guidance regarding prior-art searches, invention disclosures, patentability assessments, filing procedures, and commercialisation opportunities.
How Researchers Can Prepare a Strong Proposal
Applicants should avoid waiting until the final days before the submission deadline. A competitive research proposal generally requires a clear research problem, strong justification, appropriate methodology, measurable objectives, realistic timelines, and clearly defined outputs.
Before submitting an application, researchers should pay particular attention to the following areas:
Research Problem: Clearly identify the scientific or engineering challenge being addressed.
Literature Gap: Explain what existing research has established and what remains unresolved.
Objectives: Develop specific and achievable research objectives.
Methodology: Describe how data will be generated, analysed, validated, and interpreted.
Innovation: Clearly communicate what is new about the proposed research.
Work Plan: Divide activities into realistic stages across the three-year project period.
Budget: Ensure that requested expenditure is directly justified by project activities.
Expected Outcomes: Identify possible publications, technologies, databases, patents, prototypes, methods, policy applications, or other outputs.
Impact: Explain how the research can contribute to scientific knowledge, society, industry, technology, sustainability, or national research priorities.
An Opportunity to Strengthen Inclusive Research
Research excellence grows when talented researchers from diverse backgrounds have meaningful opportunities to participate, lead projects, develop laboratories, mentor students, and contribute to scientific advancement.
The ANRF Inclusivity Research Grant 2026 therefore has relevance beyond financial assistance. It can contribute to expanding research participation while enabling eligible investigators to pursue innovative and high-impact scientific work.
Track2Training encourages eligible researchers, faculty members, institutions, and research groups to study the official requirements carefully and begin proposal preparation as early as possible.
📅 Application Start Date: 1 October 2026 📅 Last Date: 3 November 2026 💰 Funding: Up to ₹60 lakh plus overheads ⏳ Project Duration: 3 years 🔗 More information / Application:https://lnkd.in/p/dBSYhmJp
Track2Training continues to share opportunities related to research grants, fellowships, academic publishing, research methodology, capacity building, conferences, and scholarly development for researchers and higher-education professionals.
The rapid growth of cities, increasing travel demand, congestion, environmental degradation, road-safety risks, and pressure on urban infrastructure have created a need for more intelligent and adaptive approaches to urban management. Artificial intelligence (AI), Internet of Things (IoT), digital twins, geospatial technologies, and intelligent transportation systems are increasingly transforming the way cities understand, plan, and manage mobility. Rather than treating transportation as an isolated infrastructure sector, smart-city planning increasingly requires integration between land use, transport, human behaviour, environmental conditions, infrastructure, and real-time data. This article examines the emerging role of AI, digital twins, and intelligent mobility in smart cities, with particular emphasis on transportation planning, transit-oriented development (TOD), travel behaviour, first- and last-mile accessibility, road safety, urban growth, and sustainable logistics. Drawing upon recent research on AI-based mobility modelling, digital twins, TOD, transportation planning, road safety, and urban sustainability, the article proposes an integrated conceptual framework in which sensing, data integration, AI-based prediction, digital-twin simulation, and intelligent decision-making form a continuous urban mobility intelligence cycle. The article also discusses challenges involving data quality, interoperability, privacy, explainability, institutional capacity, digital inequality, and implementation in developing and Tier-2 cities. It concludes that AI and digital twins should be understood not merely as technological tools but as components of a broader planning ecosystem linking physical infrastructure, human behaviour, environmental sustainability, and evidence-based urban governance.
Keywords: Artificial intelligence; digital twins; intelligent mobility; smart cities; urban transportation; transit-oriented development; travel behaviour; machine learning; urban planning; sustainable mobility; digital transformation; intelligent transportation systems
1. Introduction
Cities are increasingly complex socio-technical systems in which land use, transportation, infrastructure, economic activity, environmental conditions, and human behaviour interact continuously. Rapid urbanization has intensified congestion, automobile dependence, road-safety concerns, air pollution, infrastructure pressure, and unequal access to opportunities. Conventional planning approaches, which often rely on static datasets and periodic surveys, are increasingly challenged by the dynamic nature of contemporary urban systems.
The emergence of artificial intelligence (AI), Internet of Things (IoT), big-data analytics, geographic information systems (GIS), and digital twins provides new possibilities for understanding and managing this complexity. Recent systematic research demonstrates that the convergence of AI, AIoT, and urban digital twins is creating new possibilities for data-driven urban planning and sustainable smart-city development.
This transformation is particularly important in urban mobility. Transportation systems generate enormous volumes of spatial and temporal information through GPS devices, mobile phones, smart cards, traffic sensors, cameras, connected vehicles, public-transport systems, and increasingly connected infrastructure. AI can convert these heterogeneous data into predictions and recommendations, while digital twins can provide dynamic representations of urban transportation systems in which alternative scenarios can be simulated before interventions are implemented.
The relevance of these technologies is reflected in the growing body of research on intelligent mobility and urban transportation. Sharma and Dehalwar’s work on AI-based mobility modelling identifies the growing importance of intelligent modelling for smart-city transportation systems (Sharma & Dehalwar, 2026). Their research contributes to a broader transition from conventional transportation models towards data-driven and adaptive mobility analysis. The literature on digital twins similarly shows a shift from static digital representation towards dynamic systems capable of monitoring, prediction, simulation, and optimization. Recent reviews identify digital twins as increasingly important for transport planning, although challenges concerning interoperability, empirical validation, and institutional integration remain.
The objective of this article is therefore to examine how AI, digital twins, and intelligent mobility can be integrated within smart-city planning. Particular attention is given to the relationship between transportation and land use, travel behaviour, TOD, first- and last-mile accessibility, safety, sustainable logistics, and urban resilience.
2. From Smart Cities to Intelligent Mobility
The concept of the smart city has evolved substantially. Early smart-city initiatives frequently emphasized ICT infrastructure, connectivity, and digital service delivery. Contemporary approaches increasingly focus on the integration of technology with sustainability, resilience, inclusivity, and evidence-based governance.
Mobility is central to this transformation because transportation connects people to employment, education, healthcare, public services, housing, and other opportunities. Consequently, smart mobility should not simply mean deploying sensors or automating traffic signals. It should involve improving accessibility, reducing unnecessary travel, supporting sustainable modes, increasing safety, and enabling more equitable access to urban opportunities.
Research on transit-oriented development illustrates this broader perspective. Sharma and Dehalwar’s systematic literature review identifies TOD as an important planning approach for linking transportation investment with urban development and economic outcomes (Sharma & Dehalwar, 2025). Their earlier work on the precursors of TOD further emphasizes the historical and planning conditions that influence transit-oriented urban development (Sharma et al., 2024).
The relationship between land use and transportation is particularly important. Sharma and Dehalwar’s review of land-use transportation interaction models demonstrates the significance of integrated modelling for smart urban growth management (Sharma & Dehalwar, 2025). Rather than modelling transport independently from urban development, integrated systems can examine how changes in density, accessibility, employment distribution, infrastructure, and land use influence travel behaviour.
This integrated perspective is essential for AI-enabled smart cities. AI models can identify complex relationships within large datasets, but their effectiveness depends on the quality and contextual interpretation of the data. A technically accurate prediction that ignores urban morphology, socioeconomic conditions, infrastructure constraints, or behavioural responses may still produce poor planning outcomes.
3. Artificial Intelligence in Urban Mobility
AI is increasingly being applied across the transportation lifecycle, including demand prediction, mode-choice modelling, route optimization, congestion forecasting, traffic management, road-safety analysis, public-transport operations, and logistics.
Machine learning models can identify nonlinear relationships that may be difficult to capture using traditional statistical techniques. Sharma and Dehalwar’s work on AI-based mobility modelling highlights the potential of AI for intelligent transport infrastructure and smart-city applications (Sharma & Dehalwar, 2026). Similarly, recent research indicates that AI applications in urban transportation increasingly encompass congestion prediction, safety analytics, intelligent transportation systems, and sustainable mobility planning.
3.1 AI and travel behaviour
Travel behaviour is one of the most important components of intelligent mobility. Transportation infrastructure alone does not determine travel outcomes. Individuals make decisions concerning mode, route, destination, departure time, and trip frequency based on accessibility, cost, convenience, safety, weather, built environment, socioeconomic characteristics, and personal preferences.
Research on travel behaviour in TOD environments demonstrates the importance of understanding these behavioural dimensions. Sharma and Dehalwar’s work on travel behaviour modelling using Partial Least Squares Structural Equation Modelling provides evidence of the value of behavioural and perceptual variables in understanding TOD-based travel patterns (Sharma & Dehalwar, 2026). Their systematic review of travel-behaviour modelling further emphasizes the importance of methodological development in this field (Sharma et al., 2026).
AI can extend such approaches by combining behavioural surveys with large-scale mobility datasets. For example, machine-learning models can integrate demographic characteristics, land-use variables, transit accessibility, network characteristics, weather conditions, and observed travel patterns.
However, AI should complement rather than automatically replace behavioural theory. Black-box prediction can identify correlations without explaining why a particular behaviour occurs. Consequently, explainable AI (XAI), interpretable machine learning, and hybrid approaches combining behavioural theory with machine learning are increasingly relevant.
3.2 AI and mode choice
Mode choice is another critical application. The decision to use a private automobile, bus, metro, bicycle, walking, ride-hailing, or another mode influences congestion, energy consumption, emissions, and public-space requirements.
Research on bus-user satisfaction in Bhopal demonstrates the importance of user perceptions in public-transport planning (Lodhi et al., 2024). Such research can be complemented by AI models that analyse large volumes of passenger feedback, trip data, service frequency, travel times, and network accessibility.
The integration of discrete-choice models and machine learning is particularly promising. Traditional choice models provide interpretability and behavioural structure, whereas machine-learning approaches can capture nonlinear relationships. Combining both can create more useful decision-support systems for planners.
4. Digital Twins as the Intelligence Layer of Smart Mobility
A digital twin can be understood as a dynamic digital representation of a physical system that is continuously connected to data from its real-world counterpart. In transportation, a digital twin may represent a road network, public-transport system, intersection, corridor, vehicle fleet, neighbourhood, or entire metropolitan mobility system.
The distinction between a conventional digital model and a digital twin is important. A static model may represent a transportation system, whereas a digital twin is designed to maintain a dynamic relationship with the physical system. Recent transport research describes digital twins as increasingly capable of monitoring, prediction, simulation, optimization, decision support, and resilience management.
A recent review of public-bus digital twins similarly identifies real-time monitoring, simulation, optimization, AI integration, and human-computer interaction as major dimensions of digital-twin development in public transportation.
The potential of digital twins becomes particularly significant when combined with AI. AI can provide the analytical “brain” while the digital twin provides the dynamic environment in which predictions and scenarios can be evaluated. This combination allows planners to move from retrospective analysis towards predictive and potentially prescriptive planning.
5. AI–Digital Twin Integration
An integrated AI–digital twin architecture can be conceptualized through five interconnected layers:
Physical urban system: roads, transit stations, vehicles, pedestrians, buildings, land uses, and infrastructure.
Sensing and data layer: IoT sensors, GPS, smart cards, cameras, GIS, remote sensing, mobile data, and administrative datasets.
Digital-twin layer: dynamic representation of the transportation and urban system.
AI and analytics layer: machine learning, deep learning, optimization, forecasting, anomaly detection, and decision-support algorithms.
Planning and governance layer: interventions, policy evaluation, stakeholder engagement, monitoring, and feedback.
The system operates as a continuous feedback cycle rather than a one-way information pipeline.
For example, a city may detect increasing congestion near a transit station. Real-time data are transferred to the digital twin. AI predicts how congestion may develop under alternative conditions. The digital twin simulates interventions such as signal optimization, bus-priority lanes, pedestrian improvements, parking restrictions, or changes in transit frequency. Planners can compare the simulated consequences before implementation. After an intervention is implemented, new observations are fed back into the system.
Recent literature supports this integrated perspective. A systematic review of AI, AIoT, and urban digital twins found that their convergence can strengthen data-driven environmental planning and urban management, while also identifying major challenges involving interoperability, implementation, and governance.
6. Digital Twins and Transit-Oriented Development
TOD represents an especially promising application domain for digital twins because it requires simultaneous consideration of land use, transportation, accessibility, pedestrian movement, public transport, economic activity, and urban form.
Sharma and Dehalwar’s research on TOD and economic development emphasizes the relationship between transit-oriented development and broader urban-economic outcomes (Sharma & Dehalwar, 2025). Their work on first- and last-mile accessibility further demonstrates that access to transit cannot be assessed simply by measuring distance to a station. Accessibility depends on infrastructure, environmental conditions, network characteristics, safety, user characteristics, and available modes (Yadav et al., 2025).
A TOD digital twin could integrate:
transit routes and schedules;
pedestrian networks;
cycling infrastructure;
station catchment areas;
land-use patterns;
population and employment;
traffic flows;
first- and last-mile modes;
environmental conditions;
accessibility indicators; and
user behaviour.
This would allow planners to test alternative TOD scenarios before implementation.
For example, a planner could simulate whether increasing density around a transit station without improving pedestrian infrastructure would create accessibility problems. Similarly, alternative locations for pedestrian crossings, cycleways, feeder services, parking facilities, or bus stops could be evaluated.
Recent work by Yadav, Dehalwar, and Sharma on machine-learning-based multimodal accessibility in TOD zones demonstrates the growing potential for combining AI with accessibility assessment in Tier-2 Indian cities (Yadav et al., 2026). Their work on environmental determinants of first- and last-mile mode choice further highlights the need to account for climate and environmental conditions in mobility modelling (Yadav et al., 2026).
7. Intelligent Mobility and First- and Last-Mile Connectivity
The first and last mile remains one of the most important challenges in public transportation. A city may have an extensive rail or bus network, but poor access between residences, workplaces, public spaces, and stations can reduce the usefulness of the entire system.
Research by Yadav, Dehalwar, and Sharma systematically examines factors affecting first- and last-mile accessibility in TOD environments (Yadav et al., 2025). Related research investigates environmental determinants of mode choice and climate-sensitive user satisfaction in Tier-2 Indian cities (Yadav et al., 2026; Yadav et al., 2025).
AI can contribute by predicting first- and last-mile demand, identifying underserved areas, optimizing feeder services, and assessing pedestrian and cycling accessibility.
Digital twins can then simulate how improvements affect the wider system. A new feeder route, for example, could be tested against changes in transit demand, congestion, emissions, walking distance, and network accessibility.
This approach is particularly important in developing cities, where financial resources for infrastructure are limited and interventions must be carefully targeted.
8. AI and Road Safety
Road safety is another major domain for intelligent mobility. Conventional safety analysis frequently depends on historical crash data. Although crash records are essential, they provide information only after an unsafe event has occurred.
Sharma, Singh, and Dehalwar’s work on surrogate safety analysis demonstrates the potential of advanced technologies for moving towards more proactive approaches to road safety (Sharma et al., 2024). Surrogate safety measures can use near-miss events, vehicle trajectories, speed variations, conflicts, and other indicators to identify potentially hazardous situations.
AI can analyse video, sensor, and trajectory data to identify unsafe interactions between vehicles, pedestrians, and cyclists. Digital twins can then reproduce these conditions within a virtual environment and test potential interventions.
The combination of AI and digital twins therefore creates a pathway from:
Such a system could support safer intersection design, adaptive traffic control, pedestrian infrastructure planning, and proactive risk management.
Research on mid-block traffic analysis further illustrates the relevance of detailed traffic-system analysis for road safety (Sharma & Singh, 2023). These approaches can become more powerful when integrated into real-time digital-twin environments.
9. Intelligent Mobility and Sustainable Last-Mile Logistics
Urban logistics represents another major challenge for smart cities. E-commerce growth, delivery services, and changing consumer behaviour have increased the volume of last-mile freight movements.
Recent research by Sharma on generative AI and digital twins for sustainable last-mile logistics examines the potential of emerging digital technologies to support green operations and electric-vehicle integration (Sharma, 2026). Related work addresses digital-twin-driven optimization and sustainable last-mile logistics (Sharma, 2026).
AI can support delivery-demand prediction, vehicle-routing optimization, fleet management, charging coordination, and consolidation planning. Digital twins can simulate the consequences of alternative logistics strategies across an urban network.
For example, a city could evaluate the effects of delivery consolidation centres, electric delivery fleets, restricted delivery periods, cargo-bike systems, or dynamic routing. Rather than evaluating each intervention independently, a digital twin can model interactions between freight, passenger traffic, road capacity, emissions, and land use.
This is particularly important because freight and passenger mobility increasingly compete for the same limited urban road space.
10. AI, Digital Twins and Urban Growth
Intelligent mobility cannot be separated from urban growth. Urban expansion changes travel distances, accessibility patterns, infrastructure requirements, and transport demand.
Research using cellular automata and artificial neural networks for predicting urban growth in Indore demonstrates how spatial modelling and AI can contribute to planning-policy analysis (Kumar et al., 2025). Similarly, Sharma’s review of urban growth models identifies the importance of modelling approaches for understanding future urban development (Sharma, 2019).
The integration of urban-growth models with digital twins could enable planners to simulate alternative development trajectories. For example, different growth scenarios could be evaluated according to their consequences for:
transport demand;
infrastructure costs;
accessibility;
urban sprawl;
environmental quality;
public-transport viability;
housing;
energy consumption; and
road safety.
This represents an important shift from simply predicting urban growth to evaluating the consequences of alternative urban futures.
11. Environmental Sustainability and Intelligent Mobility
Transportation is closely linked to environmental sustainability. Congestion, vehicle emissions, energy consumption, urban heat, stormwater impacts, and land consumption are interconnected.
Research on sustainable urban development, green buildings, stormwater management, and urban environmental conditions demonstrates the importance of integrated planning. Sharma et al.’s work on green buildings and sustainable neighbourhoods, for example, links built-environment interventions with broader sustainability goals (Sharma et al., 2025). Research using SWMM and GIS for stormwater management demonstrates the potential of integrated spatial and computational approaches to urban environmental management (Patel et al., 2024).
Digital twins can integrate mobility with environmental information. Traffic emissions can be linked to road networks, land use, meteorological conditions, and population exposure. AI can predict pollution hotspots, while the digital twin can test alternative mobility scenarios.
The integration of AI, IoT, and urban digital twins has been identified in recent systematic literature as an important direction for data-driven environmental planning.
12. Digital Twins for Urban Resilience
Smart mobility systems must also be resilient to disruptions. Flooding, extreme weather, accidents, infrastructure failures, public-health emergencies, and other disruptions can affect transportation networks.
Recent systematic research indicates that digital twins can support resilience through real-time visibility, disruption anticipation, scenario simulation, dynamic optimization, decision support, service continuity, and post-disruption learning.
This has particular relevance for cities facing climate-related risks. Sharma and Dehalwar’s work on nature-based solutions and delta resilience highlights the importance of integrating environmental resilience with sustainable urban development (Sharma & Dehalwar, 2026). A mobility digital twin could incorporate flood-prone roads, evacuation routes, public-transport capacity, emergency services, and alternative travel paths.
Consequently, digital twins can become resilience-management platforms rather than merely visualization systems.
13. Challenges and Limitations
Despite their potential, AI and digital twins should not be considered automatic solutions to urban problems.
13.1 Data quality
AI models are highly dependent on the quality and representativeness of training data. Incomplete or biased datasets can generate unreliable predictions. This is particularly significant in developing and Tier-2 cities where continuous high-resolution datasets may not be available.
13.2 Interoperability
Urban data originate from multiple agencies and platforms. Transport, land-use, utilities, environmental monitoring, emergency management, and municipal systems may use different standards. Interoperability therefore represents a major requirement for city-scale digital twins.
Recent reviews consistently identify interoperability as a persistent challenge in smart-city digital-twin implementation.
13.3 Explainability
Transportation decisions can affect people’s everyday lives. AI systems that recommend changes to routes, traffic controls, accessibility, or resource allocation therefore require appropriate levels of transparency.
Explainable AI is particularly important where algorithmic recommendations influence public investment or mobility access.
13.4 Privacy and ethics
Mobility datasets can contain highly sensitive information about people’s movements. Location traces, smart-card records, mobile-phone data, and connected-vehicle information therefore require appropriate privacy protections.
13.5 Digital inequality
Smart-city technologies may unintentionally favour digitally connected populations. An intelligent mobility system should not equate digital participation with universal accessibility. Offline users, elderly people, persons with disabilities, low-income households, and people with limited digital literacy must remain part of the planning process.
Research examining inclusivity in India’s National Urban Transport Policy and universal design further reinforces the importance of equity within planning and mobility systems (Sharma & Dehalwar, 2025; Agarwal & Sharma, 2014).
13.6 Institutional capacity
Technology cannot substitute for institutional coordination. A sophisticated digital twin is of limited value if planning agencies cannot interpret its results or translate them into policy and investment decisions.
14. Towards an Integrated AI–Digital Twin Framework for Smart Cities
An effective smart-city mobility framework should therefore combine technology with planning theory, behavioural understanding, institutional coordination, and public participation.
A proposed framework can be represented as:
Urban system → Sensors and data → Data integration → AI analytics → Digital twin → Scenario simulation → Planning decision → Physical intervention → Monitoring → Feedback
The framework should operate at multiple spatial scales.
At the street scale, AI can analyse traffic conflicts, pedestrian behaviour, and intersection performance.
At the corridor scale, digital twins can evaluate traffic operations, transit priority, and multimodal accessibility.
At the neighbourhood scale, TOD, land use, pedestrian networks, public transport, and environmental conditions can be integrated.
At the city scale, the system can evaluate urban growth, infrastructure investment, mobility demand, emissions, and logistics.
At the metropolitan scale, regional commuting, land-use transformation, intercity connectivity, and large-scale infrastructure can be modelled.
Such an approach would align with emerging research that views digital twins as integrated decision-support mechanisms rather than merely technical visualization tools.
15. Future Research Directions
Several research directions deserve greater attention.
First, future studies should develop city-scale AI–digital twin platforms that integrate transportation, land use, environment, infrastructure, and socioeconomic information.
Second, greater attention should be given to Tier-2 and Tier-3 cities in developing countries. Much of the technological literature is developed around highly instrumented cities, whereas resource-constrained urban environments require different implementation strategies.
Third, research should advance explainable and trustworthy AI for transportation planning.
Fourth, digital twins should become more human-centred. Recent research on public-transport digital twins specifically identifies human-computer interaction as an underdeveloped dimension.
Fifth, future systems should incorporate climate sensitivity into mobility models. Heat, flooding, extreme rainfall, and air pollution influence travel behaviour and transportation-system performance.
Sixth, researchers should develop interoperability standards capable of connecting GIS, BIM, IoT, transportation models, AI platforms, and municipal information systems.
Finally, evaluation should move beyond technological performance. Digital twins and AI should be assessed according to measurable outcomes such as accessibility, safety, emissions, travel time, affordability, resilience, and equity.
16. Conclusion
AI, digital twins, and intelligent mobility represent an important transformation in smart-city planning. Their significance lies not in individual technologies but in their ability to create an integrated decision-support ecosystem connecting physical infrastructure, real-time data, predictive analytics, simulation, and urban governance.
AI can identify patterns and generate predictions; IoT can provide continuous observations; GIS can provide spatial intelligence; digital twins can connect physical and virtual systems; and intelligent transportation platforms can translate analytical results into operational decisions.
The research base represented in the uploaded publication portfolio demonstrates how these technologies intersect with broader questions of TOD, travel behaviour, first- and last-mile accessibility, road safety, urban growth, environmental sustainability, and sustainable logistics. Research on TOD and economic development, land-use transportation interaction, pedestrian safety, AI-based mobility modelling, digital twins, and sustainable last-mile logistics collectively points towards an increasingly integrated conception of smart urban mobility.
The future smart city should therefore not be understood simply as a city equipped with more sensors or algorithms. It should be understood as a city capable of learning from its physical environment, anticipating emerging challenges, testing alternative interventions, and adapting its policies and infrastructure through continuous evidence-based feedback.
The combination of AI and digital twins offers a pathway towards such adaptive planning. Yet technological sophistication must remain subordinate to broader urban objectives: accessibility, safety, sustainability, resilience, efficiency, and social inclusion. The most meaningful contribution of intelligent mobility will consequently emerge when digital innovation is embedded within sound planning principles and connected to the everyday experiences of urban residents.
References
Agarwal, S., & Sharma, S. N. (2014). Universal design to ensure equitable society. International Journal of Engineering and Technical Research, 2(1).
Bibri, S. E., Huang, J., Jagatheesaperumal, S. K., & Krogstie, J. (2024). The synergistic interplay of artificial intelligence and digital twin in environmentally planning sustainable smart cities: A comprehensive systematic review. Environmental Science and Ecotechnology, 20, 100433. https://doi.org/10.1016/j.ese.2024.100433
Dehalwar, K., & Sharma, S. N. (2024). Exploring the distinctions between quantitative and qualitative research methods. Think India Journal, 27(1), 7–15.
Kumar, G., Vyas, S., Sharma, S. N., & Dehalwar, K. (2025). Urban growth prediction using CA-ANN model and spatial analysis for planning policy in Indore city, India. GeoJournal, 90(3), 139.
Lodhi, A. S., Jaiswal, A., & Sharma, S. N. (2024). Assessing bus users satisfaction using discrete choice models: A case of Bhopal. Innovative Infrastructure Solutions, 9(11), 437.
Machkour, B., Rouky, N., Abriane, A., Fri, M., & Benmoussa, O. (2026). Digital twins in intelligent transport systems: A systematic review of resilience mechanisms and smart city implications. Smart Cities, 9(8), 123.
Nag, D., Brandel-Tanis, F., Pramestri, Z. A., Pitera, K., et al. (2025). Exploring digital twins for transport planning: A review. European Transport Research Review, 17, 15.
Ogbanga, M. M., Sharma, S. N., Pandey, A. K., & Singh, P. (2025). Artificial intelligence in social work to ensure environmental sustainability. In Artificial intelligence applications for a sustainable environment (pp. 491–508). Springer.
Patel, R. S., Taneja, S., Singh, J., & Sharma, S. N. (2024). Modelling of surface run-off using SWMM and GIS for efficient stormwater management.
Sharma, S. N. (2019). Review of most used urban growth models. International Journal of Advanced Research in Engineering and Technology.
Sharma, S. N. (2026). Advances in AI-based mobility modelling: Toward intelligent transport infrastructure in smart cities. In AI-based data mobility and intelligent modeling for smart cities (pp. 67–106).
Sharma, S. N. (2026). Digital twins and AI-driven optimisation for sustainable last-mile logistics in emerging economies. In Sustainable last-mile logistics: Challenges, innovations, and policy.
Sharma, S. N. (2026). Generative AI and digital twins for sustainable last-mile logistics: Enabling green operations and electric vehicle integration. In Accelerating logistics through generative AI, digital twins, and autonomous ….
Sharma, S. N. (2026). Urban spatial digital twin in sustainability: Spur economic growth in transit-oriented development-based development. In Tenable engineering for a sustainable future (pp. 257–300).
Sharma, S. N., & Dehalwar, K. (2025). A systematic literature review of transit-oriented development to assess its role in economic development of city. Transportation in Developing Economies, 11(2), 23.
Sharma, S. N., & Dehalwar, K. (2025). Review of landuse transportation interaction model in smart urban growth management. European Transport/Trasporti Europei, 103, 1–15.
Sharma, S. N., & Dehalwar, K. (2026). Investigating travel behaviour in TOD-based development from an expert perspective: Evidence from Partial Least Squares Structural Equation Modelling (PLS-SEM). Civil Engineering Infrastructures Journal.
Sharma, S. N., & Dehalwar, K. (2026). Urban spatial digital twin in sustainability: Spur economic growth in transit-oriented development-based development. In Tenable engineering for a sustainable future (pp. 257–300).
Sharma, S. N., & Singh, D. (2023). Understanding mid-block traffic analysis: A crucial tool for road safety. Think India Journal, 26(3), 5–9.
Sharma, S. N., Singh, D., & Dehalwar, K. (2024). Surrogate safety analysis—Leveraging advanced technologies for safer roads. Suranaree Journal of Science and Technology, 31(4).
Sharma, S. N., Dehalwar, K., & Yadav, K. (2026). Advancing travel behaviour modelling: A systematic literature review. Civil Engineering Infrastructures Journal, e108027.
Sharma, S. N., Dehalwar, K., Singh, J., & Kumar, G. (2024). Prefabrication building construction: A thematic analysis approach. International Conference on Advances in Concrete, Structural, & Geotechnical ….
Sharma, S. N., Kumar, A., & Dehalwar, K. (2024). The precursors of transit-oriented development. Economic and Political Weekly, 59(14), 16–20.
Sharma, S. N., Lodhi, A. S., Dehalwar, K., & Jaiswal, A. (2024). Life cycle assessment (LCA) of recycled & secondary materials in the construction of roads. IOP Conference Series: Earth and Environmental Science, 1326(1), 012102.
Sharma, S. N., Singh, S., Kumar, G., Pandey, A. K., & Dehalwar, K. (2025). Role of green buildings in creating sustainable neighbourhoods. IOP Conference Series: Earth and Environmental Science, 1519(1), 012018.
Yadav, K., Dehalwar, K., & Sharma, S. N. (2025). Assessing the factors affecting first and last mile accessibility in transit-oriented development: A literature review. GeoJournal, 90(6), 298.
Yadav, K., Dehalwar, K., & Sharma, S. N. (2026). A user-centric machine learning framework for predicting multi-modal accessibility in transit-oriented development zones for sustainable urban construction in Tier-2 Indian cities. Asian Journal of Civil Engineering, 27(5), 2447–2464.
Yadav, K., Dehalwar, K., & Sharma, S. N. (2026). Exploring the environmental determinants of mode choice in first and last mile connectivity: Evidence from a systematic review. Innovative Infrastructure Solutions, 11(4), 204.
Yadav, K., Dehalwar, K., Sharma, S. N., & Yadav, S. (2025). Understanding user satisfaction in last-mile connectivity under transit-oriented development in Tier 2 Indian cities: A climate-sensitive perspective. IOP Conference Series: Earth and Environmental Science, 1579(1), 012006.
Which relationship has taught you the most about yourself?
The global financial-services industry is increasingly being shaped by technology, digital accessibility and integrated financial ecosystems. One entrepreneur associated with this transformation is Timur Turlov, founder and Chief Executive Officer of Freedom Holding Corp. Through the continued development of brokerage, banking, insurance, payments and technology-oriented services, Turlov has helped build a financial group whose activities now extend across multiple international markets.
From Brokerage to a Diversified Financial Ecosystem
The development of Freedom Holding Corp. illustrates how a financial business can evolve beyond its original specialization. Freedom Finance, the brokerage business founded by Timur Turlov in Kazakhstan in 2011, became an important foundation for what would later develop into a much broader international financial-services group.
Today, Freedom Holding Corp. operates through business segments that include brokerage, banking, insurance and other complementary services. The company also has businesses connected with payments, information processing, telecommunications, media and lifestyle services.
An important milestone in the company’s international development was its listing on Nasdaq. Freedom Holding Corp. trades under the ticker symbol FRHC, giving the company greater visibility within international capital markets.
This development also reflects a broader philosophy behind the company: financial services increasingly work best when customers can access several interconnected products within the same digital environment.
Technology at the Centre of Financial Services
One of the most notable aspects of Freedom Holding Corp.’s development has been its emphasis on technology.
Modern customers expect financial transactions to be fast, convenient and accessible through digital platforms. Traditional distinctions between banking, investment, payments, insurance and everyday digital services are gradually becoming less rigid.
Freedom Holding has responded to this transformation by developing an ecosystem in which different financial and consumer services can complement one another.
Digitalisation can create several advantages for customers. It may simplify access to financial products, reduce administrative barriers, improve communication and allow individuals to manage multiple services from digital devices.
For financial companies, technology can also contribute to improved scalability and the ability to introduce new services more efficiently.
Continued Business Growth
Freedom Holding Corp.’s fiscal 2026 results provide an indication of the scale that the group has achieved.
For the fiscal year ended March 31, 2026, the company reported revenue of approximately $2.19 billion and net income of approximately $153.3 million. Its banking customer base increased substantially during the year, while the number of brokerage customers also continued to grow.
These figures demonstrate the expanding reach of the company’s financial ecosystem.
Growth in customer numbers is particularly relevant in the digital financial-services sector because it indicates that technology platforms are becoming an increasingly important connection between financial institutions and their users.
Rather than relying entirely on conventional financial-service models, companies such as Freedom Holding are increasingly developing digital infrastructure capable of serving customers across different financial requirements.
Building an International Presence
Another important dimension of Freedom Holding Corp.’s development is its international reach.
According to the company’s fiscal 2026 reporting, Freedom Holding Corp. had subsidiaries incorporated across numerous markets, including Kazakhstan, Cyprus, the United States, the United Kingdom, Armenia, the United Arab Emirates, Uzbekistan, Kyrgyzstan, Tajikistan, Azerbaijan, Türkiye and several European Union countries.
Managing operations across different jurisdictions requires organisations to adapt to different regulatory systems, customer expectations and market structures.
At the same time, international expansion can create opportunities for knowledge transfer and technological development across markets.
Freedom Holding’s evolution therefore represents not simply the expansion of an individual financial company but the development of an increasingly interconnected financial-services network.
Supporting Financial Accessibility
Technology-driven financial services can play an important role in expanding access to investment and banking products.
Historically, many sophisticated investment services were primarily associated with institutional investors or high-net-worth individuals. Digital brokerage platforms have contributed to making financial markets more accessible to ordinary investors.
Freedom Holding’s brokerage activities form an important part of this broader development.
Greater accessibility, however, should also be accompanied by financial education. Investors benefit from understanding market volatility, diversification, investment horizons and risk before making financial decisions.
As financial technology continues to evolve, the combination of accessibility and financial literacy is likely to become increasingly important.
Investment Beyond Financial Services
The activities associated with Timur Turlov also extend beyond conventional finance.
He has been involved with initiatives connected with chess, education, culture and sport. Turlov serves as President of the Kazakhstan Chess Federation, while Freedom Holding has supported chess-related initiatives and youth football programmes.
Such activities demonstrate how large businesses can contribute to social and educational ecosystems in addition to pursuing commercial development.
Chess is particularly relevant to education because it encourages strategic thinking, concentration and problem-solving. Supporting sporting and intellectual activities can therefore have benefits extending beyond traditional corporate sponsorship.
A Model Shaped by Integration
Perhaps the most interesting characteristic of Freedom Holding Corp.’s development is the emphasis on integration.
The future of financial services is unlikely to consist of isolated products operating independently. Instead, consumers increasingly expect banking, investing, insurance, payments and other digital services to function together conveniently.
Freedom Holding’s expansion from brokerage into banking, insurance, payments and complementary digital businesses reflects this larger transformation taking place across the global financial industry.
For Timur Turlov, the development of the company has involved combining entrepreneurship, technology and international expansion within a single evolving ecosystem.
Looking Toward the Future
Financial services are changing rapidly as artificial intelligence, digital banking, automated investing, data analytics and mobile technologies become increasingly sophisticated.
Companies capable of adapting to these developments while maintaining reliable financial infrastructure will have opportunities to introduce new products and reach broader groups of customers.
Freedom Holding Corp.’s journey from a brokerage-focused business to a diversified international financial-services organisation demonstrates the potential of long-term expansion combined with technological innovation.
Under Timur Turlov’s leadership, the organisation has continued to broaden its operations while developing connections among investment services, banking, insurance and digital platforms.
As technology continues to transform the way people interact with money and financial institutions, Freedom Holding’s development provides an interesting example of how an entrepreneurial financial company can evolve into a wider international ecosystem focused on accessibility, integration and innovation.
What’s a moment in your life that made you feel truly alive?
By Dileep Verma (Research Expert and Associate Editor of Track2training, New Delhi, India)
Social psychology often studies concepts that cannot be observed directly. Attitudes, perceived discrimination, social identity, trust, human dignity, prejudice, perceived inclusion, behavioural intentions, and psychological well-being are examples of latent constructs. Researchers usually measure these concepts through multiple questionnaire items rather than a single observed variable. Structural equation modelling (SEM) is particularly useful in such situations because it allows researchers to examine measurement quality and relationships among constructs within an integrated statistical framework.
SmartPLS 4 provides several SEM approaches in one graphical environment, including partial least squares structural equation modelling (PLS-SEM), consistent PLS (PLSc), confirmatory composite analysis (CCA), covariance-based SEM (CB-SEM), and confirmatory factor analysis (CFA) (Ringle et al., 2024). The choice among these methods should follow the theoretical conception of the constructs and the purpose of the analysis rather than software convenience.
CFA, CCA and PLS-SEM: An Important Distinction
Researchers should distinguish CFA from CCA. CFA belongs to the common-factor tradition and is normally associated with CB-SEM. SmartPLS now supports CFA through its CB-SEM functionality using maximum-likelihood estimation. CFA asks whether observed indicators adequately represent hypothesised latent factors and is commonly used before evaluating structural relationships in CB-SEM (Hair et al., 2018; Hair et al., 2025).
CCA serves a related confirmatory purpose within composite-based SEM, including PLS-SEM. Hair, Howard, and Nitzl (2020) proposed CCA as a systematic procedure for assessing measurement-model quality in PLS-SEM. Current SmartPLS documentation nevertheless notes continuing methodological debate about CCA and does not recommend treating it as the only approach to measurement-model assessment.
This distinction matters in social psychology. If a researcher conceptualises psychological attributes as common factors that generate observed responses, CFA may be appropriate. If the research model uses composite-based estimation and emphasises explanation or prediction of relationships among constructs, PLS-SEM may be suitable.
Confirmatory Assessment of the Measurement Model
Before interpreting relationships among psychological constructs, researchers need to establish that the measures have acceptable reliability and validity.
For reflective constructs, outer loadings provide an initial assessment of indicator reliability. A loading of approximately 0.708 or higher is desirable because 0.70820.708^2 is approximately 0.50, indicating that the construct explains about half of the indicator’s variance (Hair et al., 2022). Indicators with loadings between 0.40 and 0.708 should not be deleted automatically. Researchers should consider theoretical content and whether removing an item improves composite reliability and AVE. Very weak indicators, particularly those below 0.40, generally require closer scrutiny.
Internal consistency is then assessed. Cronbach’s alpha (α), rho_A, and composite reliability (rho_c) are commonly reported. Values of 0.70 or above generally indicate acceptable reliability in established research, while values between 0.70 and 0.95 are usually desirable for composite reliability. Values above approximately 0.95 may indicate that indicators are excessively similar or redundant (Hair et al., 2022).
Convergent validity is commonly evaluated using the Average Variance Extracted (AVE). An AVE ≥ 0.50 indicates that a construct explains at least half of the variance in its indicators on average.
A practical reporting guide is therefore:
Outer loadings: preferably ≥ 0.708 Cronbach’s α: generally ≥ 0.70 rho_A: generally ≥ 0.70 Composite reliability (rho_c): approximately 0.70–0.95 AVE: ≥ 0.50
These thresholds should guide judgement rather than operate as mechanical rules for deleting questionnaire items.
Discriminant Validity: Give Priority to HTMT
Social-psychological constructs are often conceptually related. Perceived discrimination may correlate with social exclusion; dignity may correlate with psychological well-being; and attitudes may correlate strongly with behavioural intentions. Researchers therefore need to demonstrate that supposedly different constructs are empirically distinguishable.
The Heterotrait-Monotrait ratio (HTMT) has become the preferred criterion for evaluating discriminant validity in PLS-SEM (Henseler et al., 2015). An HTMT value below 0.85 represents a conservative criterion, while 0.90 is frequently used when constructs are conceptually close.
Older PLS-SEM studies frequently report the Fornell-Larcker criterion and cross-loadings. These can still appear as supplementary information, but current SmartPLS guidance describes them as outdated for establishing discriminant validity because they may fail to identify validity problems that HTMT detects.
Thus, a modern PLS-SEM study should normally give greater weight to HTMT and, where appropriate, bootstrap-based HTMT inference.
From Measurement to the Structural Model
Once measurement quality has been established, researchers can assess the structural model. The analysis commonly considers collinearity, path coefficients (β), coefficient of determination (R²), effect size (f²), statistical significance, confidence intervals, and predictive assessment where relevant (Hair et al., 2019; Hair et al., 2022).
For example, a social psychologist might hypothesise:
Perceived discrimination → Social exclusion → Psychological well-being
or:
Institutional inclusion → Human dignity → Perceived policy impact
PLS-SEM allows researchers to estimate these relationships simultaneously while accounting for the measurement of each construct.
Why 5,000 Bootstrap Samples?
PLS-SEM commonly uses non-parametric bootstrapping to assess the statistical uncertainty of estimated relationships. A researcher can generate 5,000 bootstrap samples, repeatedly re-estimate the model, and obtain standard errors, t-values, p-values, and confidence intervals.
The analytical sequence can be expressed as:
Original sample → 5,000 bootstrap resamples → repeated model estimation → sampling distribution → confidence intervals and significance tests
Researchers should therefore report the path coefficient (β), bootstrap standard error, t-value or p-value, and confidence interval, rather than relying solely on whether p < .05.
Bootstrapping is particularly useful for indirect effects and mediation, where researchers need to assess the indirect pathway itself rather than infer mediation simply because separate component paths are statistically significant.
What About Model Fit?
This is an area where CFA and PLS-SEM should not be mixed.
For CFA conducted through CB-SEM, researchers may examine global fit statistics such as χ², CFI, TLI, RMSEA and SRMR. Common guidelines often regard CFI/TLI around 0.90 or higher, RMSEA below about 0.08, and SRMR below about 0.08 as indicative of acceptable fit, although interpretation depends on model characteristics and should not rely on a single cutoff (Kline, 2023).
These CB-SEM fit criteria should not simply be transferred to standard PLS-SEM. PLS-SEM has a different estimation objective, and measurement quality is primarily evaluated through reliability, convergent validity, discriminant validity, and appropriate assessment of formative measures when present.
Demographic Robustness Without Fishing for Moderators
Social-psychological findings may also be checked across characteristics such as gender, age, education, income, employment status, residence, or prior experience. Such analysis can establish whether the main conclusions remain reasonably stable after accounting for relevant demographic characteristics.
However, robustness analysis is not automatically moderation analysis.
Researchers should avoid adding numerous interaction terms simply because SmartPLS makes moderation technically easy. When theory does not specify demographic moderation, the more defensible approach is to retain the prespecified structural model and use demographics for clearly defined robustness checks. Where theoretically justified group comparisons are required, researchers should consider measurement invariance and appropriate multigroup analysis.
PLS-SEM Does Not Automatically Demonstrate Causality
Finally, arrows in a SmartPLS model do not themselves prove causal effects. This limitation is especially important for cross-sectional observational social-psychological surveys.
A significant coefficient from perceived discrimination to well-being establishes a statistical relationship conditional on the specified model. It does not independently rule out reverse relationships, omitted variables, selection processes, or other explanations.
Researchers should therefore write:
“Perceived discrimination was negatively associated with psychological well-being.”
Similarly, statistically significant mediation in cross-sectional data supports an indirect statistical relationship consistent with the theoretical mechanism, but it should not automatically be presented as evidence of a causal process.
Conclusion
SmartPLS offers social psychologists a flexible environment for studying complex relationships among attitudes, perceptions, identities, experiences, and behavioural outcomes. A rigorous application begins with theory and construct specification, followed by careful measurement assessment and only then structural-model evaluation.
For PLS-SEM, researchers should examine indicator loadings, reliability, AVE and especially HTMT before interpreting structural paths. Bootstrapping with 5,000 resamples provides inference for direct and indirect relationships. Demographic checks can assess robustness without turning the analysis into an exploratory search for moderators. Most importantly, researchers should distinguish CFA from CCA, CB-SEM fit from PLS-SEM assessment, statistical association from causation, and software capability from theoretical justification.
These distinctions make SmartPLS more than a path-diagram tool. They allow researchers to use SEM in a way that remains closely connected to measurement theory, substantive social-psychological questions, and defensible statistical interpretation.
References
Hair, J. F., Babin, B. J., Ringle, C. M., Sarstedt, M., & Becker, J.-M. (2025). Covariance-based structural equation modeling (CB-SEM): A SmartPLS 4 software tutorial. Journal of Marketing Analytics, 13, 709–724.
Hair, J. F., Black, W. C., Babin, B. J., & Anderson, R. E. (2018). Multivariate data analysis (8th ed.). Cengage.
Hair, J. F., Howard, M. C., & Nitzl, C. (2020). Assessing measurement model quality in PLS-SEM using confirmatory composite analysis. Journal of Business Research, 109, 101–110.
Hair, J. F., Hult, G. T. M., Ringle, C. M., & Sarstedt, M. (2022). A primer on partial least squares structural equation modeling (PLS-SEM) (3rd ed.). Sage.
Hair, J. F., Risher, J. J., Sarstedt, M., & Ringle, C. M. (2019). When to use and how to report the results of PLS-SEM. European Business Review, 31(1), 2–24.
Henseler, J., Ringle, C. M., & Sarstedt, M. (2015). A new criterion for assessing discriminant validity in variance-based structural equation modeling. Journal of the Academy of Marketing Science, 43, 115–135.
Kline, R. B. (2023). Principles and practice of structural equation modeling (5th ed.). Guilford Press.
Ringle, C. M., Wende, S., & Becker, J.-M. (2024). SmartPLS 4. SmartPLS.
If you could start a new business right now, what would it be?
Indian cities are undergoing rapid spatial, demographic, economic, and infrastructural transformation. This transformation is creating opportunities for economic development while simultaneously increasing exposure to heat, flooding, water scarcity, air pollution, mobility stress, infrastructure failure, and social inequality. Climate change intensifies these challenges because urban development frequently occurs through fragmented land-use decisions, increasing impervious surfaces, loss of natural drainage systems, inadequate public transport, encroachment on environmentally sensitive areas, and uneven access to services. Climate resilience therefore cannot be addressed through isolated engineering projects. It requires an integrated planning framework in which land use, housing, mobility, water management, green infrastructure, environmental quality, digital technologies, and social inclusion are considered as interconnected components of the urban system.
This article develops an integrated framework for climate-resilient and water-sensitive urban development in India. It examines the relationship between urban form and climate risk; the role of land-use planning in controlling exposure; water-sensitive urban design; urban green and blue infrastructure; climate-responsive housing; transit-oriented development; first- and last-mile accessibility; sustainable construction; artificial intelligence and spatial modelling; digital twins; participatory planning; and institutional and financial mechanisms for implementation. The discussion draws on research concerning transit-oriented development, land-use transportation interaction, urban growth modelling, green buildings, recycled construction materials, mobility behaviour, accessibility, urban water quality, artificial intelligence, digital twins, and social justice, together with international evidence from the IPCC, UN-Habitat, United Nations and World Bank.
The article argues that resilient urban development should move from a reactive disaster-management model toward a proactive spatial-development model. Rather than treating climate adaptation as an additional layer applied to conventional planning, resilience should become a fundamental criterion for decisions concerning where cities grow, how neighbourhoods are structured, how people move, how water is retained and reused, how buildings are designed, and how infrastructure investments are prioritized. Such an approach can help Indian cities pursue development while simultaneously reducing climate vulnerability, improving accessibility, strengthening ecological systems, and advancing social equity.
Keywords: climate resilience; water-sensitive urban design; Indian cities; urban planning; transit-oriented development; green infrastructure; digital twins; artificial intelligence; land-use transportation interaction; inclusive planning
1. Introduction
Urbanisation is one of the defining spatial processes of the twenty-first century. Cities concentrate employment, education, health services, infrastructure, innovation, markets, and cultural activity, but they also concentrate environmental pressures and social vulnerabilities. The challenge facing contemporary urban planning is therefore not simply to accommodate population growth but to determine how growth can occur without increasing exposure to climate hazards and environmental degradation.
The United Nations identifies inclusive, safe, resilient and sustainable cities as a central component of the Sustainable Development Goals. SDG 11 specifically links adequate housing, sustainable transport, participatory planning, disaster-risk reduction, environmental protection and access to public space.
The scale of the challenge is substantial. Recent United Nations reporting indicates that more than half of the world’s population lives in urban areas, while approximately 1.1 billion people live in slums or slum-like conditions. The same evidence highlights persistent challenges concerning public transport accessibility, urban sprawl, air pollution and inadequate public spaces.
Climate change makes these existing urban challenges more complex. The IPCC identifies increasing climate-related risks in cities and settlements and emphasizes that urbanisation, exposure and vulnerability interact with climate hazards. Rapid growth in vulnerability and exposure is particularly important in unplanned and informal settlements, low- and middle-income countries, and smaller and medium-sized urban centres.
The problem is particularly relevant for India. Indian cities are expanding horizontally and vertically, while infrastructure systems often struggle to keep pace with population growth. The World Bank’s recent assessment of Indian cities argues that the country has an important opportunity to shape future urban growth in a climate-resilient manner because a large proportion of the infrastructure required for future urbanisation has yet to be built.
This creates a critical planning opportunity. Climate resilience should not be understood only as the ability of an existing city to recover after floods, heatwaves or other disasters. It should also mean the ability to prevent the creation of future risk through better spatial planning. The location of new housing, the conversion of agricultural land, the preservation of wetlands, the alignment of transport corridors, the density of development, the design of streets and the management of stormwater can all influence future vulnerability.
Research on urban growth prediction demonstrates the importance of understanding the spatial consequences of development. Kumar et al. (2025), for example, examined urban growth prediction using a CA-ANN model and spatial analysis for planning policy in Indore. Such approaches demonstrate how spatial modelling can assist planners in anticipating patterns of urban expansion rather than responding only after development has occurred.
Similarly, Sharma and Dehalwar (2025) examined the role of land-use transportation interaction models in smart urban growth management. Land use and mobility are not independent systems: transport infrastructure influences development patterns, while development density and spatial distribution influence travel demand. This interaction is particularly important when planning climate-resilient cities because poorly coordinated development can increase automobile dependence, infrastructure costs, energy consumption and exposure to environmental hazards.
The central argument of this article is therefore that climate-resilient urban development requires integrated spatial planning. It must connect five major systems:
land and urban form;
water and ecological systems;
mobility and transport;
buildings and infrastructure; and
people, institutions and digital technologies.
The objective is not to prescribe a single model for all Indian cities. Rather, it is to develop a planning framework that can be adapted to different geographical and socio-economic contexts.
2. From Conventional Urban Planning to Climate-Resilient Development
Traditional urban planning has often separated land use, transportation, housing, infrastructure, environment and disaster management into different sectors. This administrative separation can produce technically competent projects that nevertheless create problems elsewhere in the urban system.
For example, widening a road may improve vehicular capacity in the short term but encourage development along the corridor, increase impervious surfaces and generate additional traffic. Constructing a flood wall may protect one locality while transferring water-related risk to another. Replacing natural drainage channels with underground stormwater infrastructure may increase development capacity in the short term while reducing ecological storage. Expanding low-density housing into peripheral areas may provide additional housing but increase commuting distances and infrastructure costs.
The IPCC emphasizes precisely this interconnectedness. Urban morphology, infrastructure, land use, building design, transport, water systems and ecosystem services interact in determining climate risk. Urban expansion and the loss of green infrastructure can reduce adaptive capacity and increase exposure.
UN-Habitat similarly describes urban resilience as an interconnected condition involving communities, markets, ecosystems, infrastructure and technology rather than a narrowly defined engineering characteristic.
This suggests a shift from project-based resilience to system-based resilience.
2.1 Project-based resilience
A project-based approach generally asks:
How can flooding be controlled?
How can roads be widened?
How can buildings be cooled?
How can drainage capacity be increased?
How can emergency response be improved?
These questions remain important, but they are often addressed independently.
2.2 System-based resilience
A system-based approach instead asks:
Why is development occurring in flood-prone areas?
Why is runoff increasing?
How does road construction change land use?
How does density affect water demand?
How does transport accessibility affect housing location?
Which groups are most exposed?
How can green infrastructure provide several benefits simultaneously?
How can digital systems support integrated decision-making?
This approach recognizes that resilience is produced through the cumulative interaction of planning decisions.
3. Urban Growth and the Spatial Production of Climate Risk
Urban climate risk is not simply a natural phenomenon. A rainfall event becomes a disaster partly because of how land has been developed, where people live, how drainage systems have been designed and how emergency access is organized.
The IPCC reports that urbanisation can generate vulnerability and exposure that combine with climate hazards to create risk. It further identifies unplanned expansion, including peri-urban development, as an important driver of risk.
This perspective is highly relevant to Indian cities, where peripheral development frequently occurs faster than infrastructure provision.
3.1 Urban sprawl
Urban sprawl can create several climate-related problems:
conversion of agricultural and ecological land;
increasing travel distances;
dependence on private vehicles;
higher infrastructure costs;
fragmentation of natural drainage;
greater stormwater runoff;
loss of vegetation;
increased energy consumption; and
uneven access to employment and services.
The problem is not simply that cities become larger. Rather, the spatial structure of growth determines whether expansion produces efficient and resilient urban systems.
3.2 Urban growth modelling
Spatial models can assist planning authorities in evaluating alternative growth scenarios. Cellular automata, artificial neural networks, remote sensing and GIS can identify patterns of development and simulate potential future expansion.
Kumar et al. (2025) demonstrated the relevance of CA-ANN modelling and spatial analysis for predicting urban growth and supporting planning policy in Indore. Such approaches can be expanded to include climate variables.
For example, a future urban-growth model could incorporate:
elevation;
slope;
flood susceptibility;
proximity to water bodies;
drainage networks;
vegetation;
road accessibility;
public transport;
employment centres;
population density;
land value; and
infrastructure capacity.
The resulting model would not merely predict where development is likely to occur. It could evaluate whether those locations are desirable from a climate-resilience perspective.
3.3 Land-use transportation interaction
The relationship between land use and transportation is equally important. Sharma and Dehalwar (2025) reviewed land-use transportation interaction models in the context of smart urban growth management. The key planning implication is that transport investments and land development should be coordinated.
A new high-capacity transport corridor can influence land values, density and development intensity. If planned appropriately, this can support compact, mixed-use and transit-oriented development. If poorly planned, it can encourage speculative development, congestion and uncontrolled peripheral expansion.
4. Water-Sensitive Urban Development
Water is one of the most important dimensions of climate-resilient urban planning. Indian cities face both extremes: intense rainfall and flooding in some periods and water scarcity in others.
A conventional urban drainage approach generally seeks to remove rainfall as rapidly as possible. A water-sensitive approach instead seeks to retain, infiltrate, treat, reuse and safely convey water within the urban system.
This represents a conceptual shift:
From “drain water away” to “manage water as an urban resource.”
4.1 Components of water-sensitive planning
A water-sensitive urban system can include:
rainwater harvesting;
permeable pavements;
bioswales;
rain gardens;
detention ponds;
retention ponds;
constructed wetlands;
urban forests;
restored streams;
green roofs;
wastewater reuse;
decentralized treatment;
groundwater recharge;
floodable public spaces; and
integrated stormwater management.
These measures should not be considered decorative environmental additions. They can become part of the city’s basic infrastructure.
4.2 Permeable surfaces
The replacement of conventional impermeable surfaces with permeable materials can reduce surface runoff and support groundwater recharge where soil and groundwater conditions permit.
Sharma et al. (2026) examined advanced materials for permeable paving, biocrete and piezoelectric materials in walkways to transit stations. Such research illustrates how infrastructure materials can be considered simultaneously in terms of environmental performance, mobility and technological innovation.
Similarly, Sharma et al. (2024) examined the life-cycle assessment of recycled and secondary materials in road construction. Life-cycle thinking is important because climate-resilient infrastructure should not be evaluated solely according to initial construction cost. Embodied energy, material extraction, durability, maintenance and end-of-life impacts also matter.
4.3 Urban wetlands and blue infrastructure
Urban water bodies, wetlands, streams and floodplains should be considered infrastructure.
Their functions can include:
flood storage;
groundwater recharge;
biodiversity conservation;
temperature regulation;
recreation;
landscape enhancement;
pollution reduction; and
ecological connectivity.
The destruction of these systems often creates long-term infrastructure liabilities. Once wetlands are filled or drainage channels are encroached upon, cities must compensate through increasingly expensive engineered systems.
4.4 Water quality and public health
Water resilience must also address water quality. Sharma, Dehalwar and Pandey (2026) examined measures for managing urban water quality for public health. This relationship is important because climate change can increase the risk of contamination during flooding and place additional pressure on water-treatment systems.
A water-sensitive city should therefore manage the complete water cycle:
5. Green and Blue Infrastructure as Urban Climate Infrastructure
Urban green infrastructure includes trees, parks, green corridors, wetlands, urban forests, green roofs and other vegetated systems. Blue infrastructure includes rivers, lakes, ponds, wetlands, canals and other water systems.
Together, these systems can form an ecological network.
The IPCC notes that urban expansion and degradation of green infrastructure can increase climate risk, while urban form can influence local temperatures and runoff.
5.1 Urban heat mitigation
Vegetation can provide shade and evapotranspiration, while appropriately designed green spaces can improve outdoor thermal conditions.
However, simply increasing the number of parks is insufficient. The location, accessibility, species selection, canopy structure, water availability and maintenance regime all influence performance.
A climate-resilient green infrastructure strategy should prioritize:
high heat-exposure areas;
pedestrian routes;
schools;
hospitals;
public transport stops;
informal settlements;
dense residential areas; and
areas with limited private open space.
5.2 Public open spaces and mobility
Lalramsangi et al. (2025) examined route choices for accessing public open spaces in hill cities. Their work reinforces the importance of accessibility in evaluating public spaces.
A park cannot provide equitable climate benefits if vulnerable populations cannot reach it safely.
Thus, green infrastructure planning should be integrated with pedestrian and public transport networks.
5.3 Green corridors
Green corridors can connect:
parks;
water bodies;
neighbourhoods;
transit stations;
institutional areas;
ecological habitats; and
pedestrian and cycling networks.
Such corridors can simultaneously support biodiversity, recreation, active mobility and climate adaptation.
6. Climate-Resilient Housing and Neighbourhood Design
Housing is a central component of climate resilience because exposure is determined partly by where and how people live.
The United Nations identifies adequate, safe and affordable housing as a fundamental component of SDG 11.
Climate-resilient housing should address:
heat;
flooding;
ventilation;
water availability;
sanitation;
energy demand;
structural safety;
accessibility;
affordability; and
social connectivity.
6.1 Passive design
Passive design can reduce dependence on mechanical cooling.
Important principles include:
orientation;
shading;
cross-ventilation;
appropriate window-to-wall ratios;
thermal insulation;
roof treatment;
courtyards;
vegetation;
daylighting; and
locally appropriate materials.
The most appropriate combination differs by climate zone.
6.2 Neighbourhood-scale resilience
Buildings should not be evaluated independently from their surroundings.
A climate-resilient neighbourhood requires:
shaded streets;
accessible public spaces;
drainage;
safe pedestrian routes;
emergency access;
nearby services;
public transport;
water infrastructure; and
community facilities.
This makes neighbourhood planning as important as building design.
6.3 Informal settlements
Informal settlements frequently face overlapping vulnerabilities: insecure tenure, inadequate drainage, poor-quality housing, limited water supply and limited access to emergency services.
The IPCC identifies informal and unplanned settlements as important locations of increasing climate vulnerability, particularly where adaptive capacity is limited.
Consequently, climate adaptation should not rely exclusively on relocation. Depending on local conditions, upgrading may include:
drainage improvement;
water and sanitation;
street paving;
tree planting;
heat reduction;
housing improvement;
emergency access;
tenure security; and
improved public transport.
Dehalwar and Sharma (2023), in their analysis of slums in Bhopal, highlight the importance of understanding informal settlements through the combined dimensions of struggle, vulnerability and resilience rather than viewing them solely as spatial problems.
7. Transit-Oriented Development as a Climate Strategy
Transportation is simultaneously a mobility system, a land-use system and an environmental system.
Transit-oriented development (TOD) can contribute to climate-resilient urban development when it combines:
compact development;
mixed land uses;
public transport;
walking;
cycling;
reduced automobile dependence;
accessible public spaces; and
efficient infrastructure.
Sharma, Kumar and Dehalwar (2024) discussed the precursors of transit-oriented development, while Sharma and Dehalwar (2025) reviewed the relationship between TOD and economic development.
The climate significance of TOD is not limited to emissions reduction. Compact development can also reduce infrastructure duplication and shorten travel distances.
7.1 Density and accessibility
Density by itself is not a sufficient planning objective. High density without infrastructure can increase heat, congestion and environmental pressure.
The relevant concept is accessible density: density supported by transport, public space, water, sanitation, energy and social infrastructure.
7.2 Mixed land use
Mixed-use neighbourhoods can reduce the need for long-distance travel by bringing employment, retail, education and services closer to residents.
This can support:
walking;
cycling;
public transport;
shorter trips; and
more efficient use of infrastructure.
7.3 Transit stations as climate-resilient nodes
Transit stations can become multifunctional resilience nodes.
A station area may integrate:
public transport;
shaded pedestrian infrastructure;
bicycle facilities;
green space;
rainwater management;
public services;
emergency communication; and
commercial activity.
This creates a more integrated relationship between transport infrastructure and climate adaptation.
8. First- and Last-Mile Connectivity
A major weakness of many transit systems is the gap between the station and the traveller’s actual origin or destination.
Yadav, Dehalwar and Sharma (2025) reviewed factors affecting first- and last-mile accessibility in TOD. Their research highlights that transit accessibility depends on more than the presence of a station.
Relevant factors include:
walking distance;
street connectivity;
safety;
weather;
land use;
pedestrian infrastructure;
cycling;
feeder services;
affordability;
accessibility for older persons and persons with disabilities; and
perceived comfort.
Yadav et al. (2025) further examined user satisfaction with last-mile connectivity in Tier-2 Indian cities from a climate-sensitive perspective.
This is especially important in Indian cities because extreme heat, intense rainfall and poor pedestrian infrastructure can discourage walking even when distances are theoretically short.
8.1 Climate-sensitive accessibility
Accessibility planning should therefore incorporate environmental exposure.
A 700-metre walking route is not equivalent under:
shaded and tree-lined conditions;
exposed concrete pavement;
intense summer heat;
heavy rainfall;
poor drainage; or
unsafe pedestrian conditions.
Accessibility metrics should consequently move beyond distance and include thermal comfort, shade, drainage, safety and route quality.
9. Public Transport User Satisfaction and Inclusive Mobility
Transport resilience is also social resilience.
Lodhi, Jaiswal and Sharma (2024) examined bus-user satisfaction using discrete choice models in Bhopal. Such research demonstrates the importance of understanding mobility from the user’s perspective rather than evaluating transport systems solely through infrastructure indicators.
A resilient transport system should be:
affordable;
reliable;
safe;
accessible;
comfortable;
legible;
connected; and
adaptable to extreme weather.
Sharma and Dehalwar (2025) also examined the inclusivity of India’s National Urban Transport Policy for senior citizens. This highlights the need to recognize different user groups in transport planning.
Women, children, older persons, persons with disabilities, low-income workers and informal-sector workers may experience the same transport network differently.
Consequently, resilience indicators should be disaggregated by social group wherever appropriate.
10. Road Safety and Climate Resilience
Road safety is sometimes treated separately from climate adaptation, but the two systems interact.
Extreme rainfall can reduce visibility and traction. Flooding can obstruct roads. Heat can affect pavement conditions. Poorly planned emergency routes can delay evacuation.
Sharma, Singh and Dehalwar (2024) examined surrogate safety analysis and the use of advanced technologies for safer roads. Such approaches can complement traditional crash-based safety analysis by identifying potentially hazardous interactions.
Climate-resilient mobility planning should therefore integrate:
road safety;
flood susceptibility;
emergency accessibility;
pedestrian safety;
public transport;
traffic management; and
real-time information.
Automatic traffic counters, speed radar systems, GPS devices and traffic simulation platforms can support this process. PTV VISSIM and VISUM, for example, can be used to examine traffic and network scenarios where appropriate.
11. Green Buildings and Sustainable Neighbourhoods
Buildings represent a major component of urban energy demand and material consumption.
Sharma et al. (2025) examined the role of green buildings in creating sustainable neighbourhoods. The neighbourhood perspective is particularly important because building performance is influenced by surrounding urban form.
A green building surrounded by poorly designed streets and infrastructure may still produce significant environmental impacts.
11.1 Building-level strategies
Climate-responsive buildings can incorporate:
passive cooling;
natural ventilation;
solar energy;
energy-efficient appliances;
rainwater harvesting;
wastewater reuse;
low-carbon materials;
thermal insulation;
green roofs; and
efficient lighting.
11.2 Neighbourhood-level strategies
At the neighbourhood scale, planning can coordinate:
building orientation;
street geometry;
tree canopy;
open spaces;
water infrastructure;
renewable energy;
public transport; and
waste management.
This can generate cumulative benefits that individual building certification cannot achieve alone.
12. Circular Construction and Low-Carbon Infrastructure
Climate-resilient urban development must consider not only operational emissions but also construction materials.
The construction sector consumes substantial quantities of raw materials. Roads, buildings, drainage systems and public spaces therefore create long-term material footprints.
Sharma et al. (2024) examined life-cycle assessment of recycled and secondary materials in road construction. Life-cycle assessment can help planners compare alternatives according to environmental impacts over the entire material cycle.
A circular urban infrastructure strategy can prioritize:
recycled aggregates;
secondary construction materials;
material reuse;
design for disassembly;
local materials;
low-carbon concrete alternatives;
construction waste recovery; and
long-life infrastructure.
The principle should be:
build less wastefully, maintain better, reuse more, and replace only when necessary.
13. Artificial Intelligence for Climate-Resilient Urban Planning
Artificial intelligence can enhance urban planning by processing large and complex datasets.
Potential applications include:
urban growth prediction;
flood-risk mapping;
traffic forecasting;
travel-demand modelling;
infrastructure monitoring;
land-use classification;
heat-risk mapping;
water-demand prediction;
energy forecasting;
waste management; and
emergency response.
Sharma, Dehalwar, Jain and Pandey (2025) examined applications and prospects of AI tools in solid waste management. Ogbanga et al. (2025) explored artificial intelligence in social work and environmental sustainability. These studies demonstrate that AI applications increasingly extend beyond conventional engineering into social and environmental systems.
13.1 AI and urban growth
CA-ANN models can combine spatial relationships and machine-learning techniques to predict urban expansion. Such models could be extended by integrating climate-risk layers.
This can help planners identify locations where development is both economically feasible and environmentally appropriate.
13.2 AI and mobility
Yadav, Dehalwar and Sharma (2025/2026) proposed a user-centric machine-learning framework for predicting multimodal accessibility in TOD zones in Tier-2 Indian cities.
Such approaches can help shift mobility planning from infrastructure supply toward user-centred accessibility.
Sharma, Dehalwar and Yadav (2026) also examined advances in AI-based mobility modelling, demonstrating the growing potential for intelligent transport infrastructure.
14. Digital Twins and Urban Resilience
Digital twins represent another emerging opportunity.
A digital twin can integrate spatial, infrastructure, environmental and operational data to create a dynamic digital representation of an urban system.
Potential applications include:
flood simulation;
traffic management;
infrastructure monitoring;
energy modelling;
land-use scenario analysis;
emergency planning;
asset management; and
climate adaptation.
Sharma, Dehalwar and Yadav (2026) examined urban spatial digital twins in relation to sustainability and economic growth in TOD-based development.
The importance of digital twins lies not merely in creating a sophisticated visual model. Their value comes from connecting data to decisions.
14.1 From static GIS to dynamic urban intelligence
Traditional GIS may answer:
Where is the drainage network?
A digital twin could support a more complex question:
What happens to traffic, drainage, pedestrian movement and emergency accessibility if a particular rainfall event occurs while a major transport corridor is disrupted?
This represents a transition from descriptive mapping to scenario-based planning.
14.2 Digital twins and participatory planning
Digital twins should not be restricted to technical experts. Simplified visual interfaces can help communities understand proposed changes.
For example, residents could compare:
current development;
high-density development;
green infrastructure scenarios;
flood-risk scenarios; and
alternative transport networks.
This could make technical planning information more accessible.
15. People-Centred Smart Cities
Smart-city development should not equate technological sophistication with urban quality.
UN-Habitat’s World Smart Cities Outlook 2024 explicitly approaches smart-city development through a people-centred framework, examining technology in relation to sustainability, resilience, equity, social inclusion, accessibility and quality of life.
This is important because digital technologies can also create exclusion.
Potential problems include:
digital divides;
unequal access to smartphones and internet services;
algorithmic bias;
lack of digital skills;
privacy concerns;
exclusion of digitally marginalized groups; and
dependence on proprietary systems.
A resilient smart city therefore needs both technological infrastructure and social capacity.
16. Participatory Planning and Local Knowledge
Climate resilience cannot be designed exclusively through top-down technical planning.
Residents possess knowledge about:
recurring flooding;
water shortages;
unsafe streets;
inaccessible transport;
local drainage;
heat exposure;
vulnerable households; and
informal coping systems.
Sharma (2012) examined participatory planning in plan preparation, highlighting the role of participation in planning processes.
Jain, Dehalwar and Sharma (2024) discussed Delphi research and expert-opinion surveys, demonstrating another mechanism through which expert knowledge can contribute to planning decisions.
A robust planning process can combine:
scientific data + professional expertise + local knowledge + community participation.
16.1 Participatory climate mapping
Community members can contribute to mapping:
flood locations;
waterlogging;
heat exposure;
unsafe routes;
inaccessible facilities;
damaged infrastructure; and
areas lacking shade.
This information can complement satellite imagery and municipal datasets.
16.2 Social justice
Climate resilience must also consider who receives protection and who bears costs.
Dehalwar and Sharma (2024) examined social injustice associated with spatial changes in vernacular settings. Their work reinforces the broader point that spatial transformation can produce uneven social consequences.
A resilience project should therefore ask:
Who benefits?
Who pays?
Who is displaced?
Who gains access?
Who loses access?
Which neighbourhoods receive investment?
Which groups participate in decision-making?
These are planning questions, not merely social-policy questions.
17. Gender, Social Inclusion and Resilience
Climate risks are socially differentiated.
Women, older persons, children, persons with disabilities, low-income residents, migrants and residents of informal settlements may experience climate hazards differently.
The World Cities Report 2024 emphasizes that climate change can exacerbate existing inequalities and that marginalized groups often have fewer resources with which to respond to impacts.
This suggests that climate-resilient planning should incorporate social vulnerability mapping.
Possible indicators include:
age;
income;
disability;
housing quality;
access to transport;
access to healthcare;
access to water;
distance to emergency facilities; and
tenure conditions.
The objective should not be to label communities as vulnerable but to identify where public investment can reduce structural exposure.
18. Rural–Urban and Peri-Urban Resilience
Urban resilience cannot stop at municipal boundaries.
Peri-urban areas often contain:
agricultural land;
wetlands;
forests;
water bodies;
villages;
new housing;
industrial development; and
transport infrastructure.
Urban expansion can therefore create conflicts between development and ecological functions.
Chatterjee and Sharma (2020), in their review of Pradhan Mantri Gram Sadak Yojana, and Sharma et al. (2023), in their discussion of MGNREGA, illustrate the importance of infrastructure and development interventions beyond the conventional urban core.
An integrated resilience framework should connect:
village → peri-urban zone → urban core → metropolitan region.
This is especially important for water because watersheds do not follow administrative boundaries.
19. Climate-Resilient Infrastructure Financing
Even the most sophisticated plan cannot be implemented without finance.
UN-Habitat notes that cities frequently struggle to access adequate resources for climate action because of institutional, legal and financial constraints. It emphasizes the importance of long-term integrated planning and collaboration between local, regional and national governments and financial institutions.
The urban climate-finance challenge is also visible at the national level. UN-Habitat’s analysis of 194 NDCs found that while many countries identified the need for finance for climate implementation, only a much smaller number specified urban-level financing requests.
19.1 Financing mechanisms
Indian cities can potentially combine:
municipal revenues;
state government programmes;
national urban schemes;
climate funds;
development finance;
public-private partnerships;
land-value capture;
green bonds;
infrastructure funds; and
user charges.
However, financing mechanisms must be connected to measurable resilience outcomes.
19.2 Resilience budgeting
A resilience budget could classify investments according to outcomes such as:
Investment
Primary resilience outcome
Urban trees
Heat reduction
Wetland restoration
Flood storage
Public transport
Mobility resilience
Drainage improvement
Flood-risk reduction
Rainwater harvesting
Water security
Cool roofs
Heat reduction
Pedestrian infrastructure
Accessible mobility
Digital early-warning systems
Disaster preparedness
Green buildings
Energy and thermal resilience
Informal-settlement upgrading
Social resilience
Such a framework could help municipalities demonstrate the multiple benefits of investments.
20. Integrating Climate Action into Urban Plans
UN-Habitat’s analysis of Nationally Determined Contributions demonstrates the importance of connecting national climate commitments with local urban action. The 2024 assessment found that 44 percent of the reviewed NDCs emphasized both adaptation and mitigation in urban contexts, with transport, mobility and waste prominent in mitigation discussions and infrastructure and water prominent in adaptation.
The planning implication is that climate objectives should not exist only within separate climate action plans.
They should be integrated into:
master plans;
development plans;
mobility plans;
local area plans;
housing strategies;
infrastructure plans;
water plans;
disaster-management plans; and
capital investment programmes.
20.1 Climate-sensitive land-use zoning
Land-use plans can identify:
no-development ecological zones;
flood-sensitive areas;
areas suitable for densification;
transit-oriented development zones;
green corridors;
water-recharge zones;
urban agriculture areas; and
locations for critical infrastructure.
20.2 Scenario planning
Instead of preparing a single future land-use plan, planners can develop scenarios:
These scenarios can then be compared using indicators such as:
land consumption;
travel distance;
emissions;
flood exposure;
water demand;
infrastructure cost;
accessibility; and
social inclusion.
21. A Proposed Integrated Framework for Indian Cities
Based on the preceding discussion, an integrated framework can be organized into eight interconnected layers.
Layer 1: Climate and hazard assessment
Map:
heat;
floods;
drought;
landslides;
extreme rainfall;
water stress;
air pollution; and
other relevant hazards.
Layer 2: Ecological structure
Identify:
rivers;
wetlands;
lakes;
forests;
green corridors;
agricultural land;
recharge zones; and
biodiversity areas.
Layer 3: Urban growth
Analyse:
existing density;
growth trends;
vacant land;
development pressure;
land values;
informal growth; and
peri-urban expansion.
Layer 4: Mobility
Map:
public transport;
walking;
cycling;
road networks;
first- and last-mile connectivity;
traffic congestion; and
accessibility to employment and services.
Layer 5: Built environment
Evaluate:
building density;
building age;
roof characteristics;
thermal performance;
construction materials;
energy use; and
housing vulnerability.
Layer 6: Social vulnerability
Identify:
low-income communities;
informal settlements;
elderly populations;
children;
persons with disabilities;
socially marginalized groups; and
communities with limited access to services.
Layer 7: Digital intelligence
Integrate:
GIS;
remote sensing;
IoT;
AI;
machine learning;
digital twins;
sensor networks; and
real-time dashboards.
Layer 8: Governance and finance
Connect:
municipal agencies;
state departments;
national programmes;
communities;
private sector;
academic institutions;
civil society; and
financing institutions.
The key principle is that none of these layers should be planned independently.
22. Indicators for Measuring Climate-Resilient Urban Development
A practical framework requires measurable indicators.
Environmental indicators
percentage of green cover;
tree-canopy coverage;
wetland area;
impervious-surface ratio;
stormwater retention capacity;
groundwater recharge potential;
water reuse percentage;
urban heat exposure; and
air-quality indicators.
Mobility indicators
public transport accessibility;
average first-mile distance;
average last-mile distance;
pedestrian-network coverage;
cycling-network coverage;
travel time;
transport affordability; and
road-safety indicators.
Housing indicators
percentage of housing with adequate ventilation;
heat exposure;
flood exposure;
water access;
sanitation;
housing affordability; and
structural safety.
Social indicators
accessibility of vulnerable populations;
participation in planning;
access to public spaces;
access to emergency facilities;
service inequality; and
displacement risk.
Governance indicators
climate-sensitive capital expenditure;
inter-agency coordination;
public participation;
data availability;
monitoring frequency; and
implementation progress.
23. Role of Universities and Research Institutions
Universities can play an important role in developing evidence-based urban resilience.
Research institutions can support municipalities through:
spatial analysis;
urban growth modelling;
transport modelling;
climate modelling;
material life-cycle assessment;
community surveys;
participatory planning;
AI applications;
digital twins; and
policy evaluation.
The combination of academic expertise and municipal datasets can produce locally relevant solutions rather than generic planning templates.
For example, a university–municipality partnership could establish a City Resilience Observatory that annually monitors:
land-use change;
tree cover;
flood locations;
urban heat;
public transport;
housing;
water demand;
infrastructure conditions; and
social vulnerability.
Such an observatory could support evidence-based plan revision.
24. Implementation Roadmap
A realistic implementation strategy can be organized into five phases.
Phase I: Baseline assessment
Prepare a citywide spatial database containing:
land use;
population;
infrastructure;
mobility;
water;
ecological assets;
climate hazards; and
social vulnerability.
Phase II: Risk and opportunity mapping
Identify:
high-risk areas;
climate refuges;
ecological assets;
redevelopment areas;
transit corridors;
potential green corridors; and
priority neighbourhoods.
Phase III: Integrated scenarios
Develop alternative spatial scenarios using GIS, urban-growth models, transport models and climate-risk analysis.
Phase IV: Investment prioritization
Rank projects according to transparent criteria such as:
population benefiting;
vulnerability reduction;
environmental benefits;
cost;
feasibility;
implementation period; and
co-benefits.
Importantly, such prioritization should remain transparent and context-specific rather than assuming that a single technical indicator can determine planning outcomes.
Phase V: Monitoring and adaptive management
Urban resilience is not a one-time project. Plans should be periodically updated using new:
Without coordination, integrated planning becomes difficult.
25.2 Data fragmentation
Data may exist in incompatible formats or at different spatial and temporal scales.
A city digital platform therefore requires:
common standards;
interoperable datasets;
metadata;
data governance; and
institutional ownership.
25.3 Financial limitations
Resilience projects often generate long-term benefits while requiring immediate investment.
Municipalities therefore need financial instruments that recognize long-term avoided losses and co-benefits.
25.4 Technical capacity
AI, digital twins and advanced modelling require skilled personnel. Technology without institutional capacity can produce systems that are difficult to maintain.
25.5 Social acceptance
Projects involving land-use regulation, redevelopment or infrastructure relocation may generate opposition. Participatory processes should therefore occur before major decisions become irreversible.
26. Discussion: From Resilient Projects to Resilient Urban Systems
The central lesson from the literature is that resilience is fundamentally spatial.
Where people live determines their exposure. How neighbourhoods are connected determines accessibility. How land is paved determines runoff. How streets are shaded determines thermal comfort. How wetlands are protected determines flood storage. How transport and land use interact determines travel demand. How buildings are designed determines energy demand. How institutions share data determines the quality of decision-making.
The World Bank’s recent work on Indian cities reinforces this opportunity. It emphasizes that a substantial share of future urban infrastructure is yet to be constructed, meaning that current planning decisions can influence long-term resilience rather than merely retrofitting existing systems later.
Similarly, the IPCC emphasizes that building for resilience and lower emissions is generally easier than retrofitting later because urban development can lock in vulnerabilities and emissions.
This makes the next decades especially important for Indian planning.
The objective should not be to create cities that are completely protected from every hazard. Such a goal is unrealistic. Instead, cities should reduce avoidable exposure, strengthen adaptive capacity, improve ecological systems and ensure that vulnerable communities have greater access to protection and opportunity.
27. Conclusion
Climate-resilient and water-sensitive urban development requires a fundamental reconsideration of how Indian cities are planned. Climate change should not be treated as an environmental issue added to an otherwise conventional development framework. It should become a central criterion for decisions about land, infrastructure, transport, housing, water, public space and investment.
The evidence from the IPCC demonstrates that urban form, infrastructure and social vulnerability interact with climate hazards. UN-Habitat similarly emphasizes that urban resilience depends on interconnected relationships among communities, ecosystems, infrastructure, markets and technologies.
For India, the challenge is also an opportunity. Rapid urban expansion means that many future buildings, roads, neighbourhoods and infrastructure systems have not yet been constructed. The World Bank therefore identifies a significant opportunity to shape future urban growth through resilient infrastructure, housing, transport and municipal services.
A resilient city should consequently be planned as an integrated system.
Its land-use system should reduce exposure.
Its water system should retain, reuse and safely manage water.
Its green infrastructure should reduce heat, manage runoff and improve ecological quality.
Its transport system should provide safe, affordable and climate-sensitive accessibility.
Its buildings should reduce energy demand and improve thermal comfort.
Its construction sector should increasingly adopt life-cycle and circular principles.
Its digital infrastructure should support evidence-based decisions without creating new forms of exclusion.
Its governance system should connect institutions, communities, researchers and financial actors.
Most importantly, resilience should be understood as a matter of people and place, not merely infrastructure. A technically sophisticated city is not necessarily a resilient city if vulnerable residents remain exposed to heat, flooding, inadequate housing, inaccessible transport or unsafe environments.
The future of Indian urban planning therefore lies in moving from fragmented sectoral interventions toward integrated, spatially informed and socially inclusive climate-resilient development. The combination of land-use planning, water-sensitive design, transit-oriented development, green infrastructure, life-cycle assessment, AI, digital twins, participatory planning and inclusive governance provides a pathway through which Indian cities can accommodate growth while reducing future environmental and social risks.
The ultimate objective is not simply to make cities capable of surviving climate shocks. It is to create urban systems that are adaptive, accessible, ecologically functional, economically productive and socially inclusive before the next shock occurs.
References
Chatterjee, S., & Sharma, S. N. (2020). Review of Pradhan Mantri Gram Sadak Yojana. Think India Journal, 23(1), 33–42.
Dehalwar, K., & Sharma, S. N. (2023). Fate of slums of Bhopal—a tale of struggle and resilience. Think India Journal, 26(4), 4.
Dehalwar, K., & Sharma, S. N. (2024a). Exploring the distinctions between quantitative and qualitative research methods. Think India Journal, 27(1), 7–15.
Dehalwar, K., & Sharma, S. N. (2024b). Social injustice inflicted by spatial changes in vernacular settings: An analysis of published literature. ISVS e-journal, 11(9), 93–113.
Intergovernmental Panel on Climate Change. (2022). Climate change 2022: Impacts, adaptation and vulnerability. Chapter 6: Cities, settlements and key infrastructure. IPCC.
Jain, S., Dehalwar, K., & Sharma, S. N. (2024). Explanation of Delphi research method and expert opinion surveys. Think India, 27(4), 37–48.
Kumar, G., Vyas, S., Sharma, S. N., & Dehalwar, K. (2023). Planning and development of housing in urban fringe area: Case of Bhopal (MP). GIS Business, 18(1), 1–14.
Kumar, G., Vyas, S., Sharma, S. N., & Dehalwar, K. (2025). Urban growth prediction using CA-ANN model and spatial analysis for planning policy in Indore city, India. GeoJournal, 90(3), 139.
Lalramsangi, V., Garg, Y. K., & Sharma, S. N. (2025). Route choices to access public open spaces in hill cities. Environment and Urbanization ASIA, 16(2), 283–299. https://doi.org/10.1177/09754253251388721
Lodhi, A. S., Jaiswal, A., & Sharma, S. N. (2024). Assessing bus users’ satisfaction using discrete choice models: A case of Bhopal. Innovative Infrastructure Solutions, 9(11), 437. https://doi.org/10.1007/s41062-024-01652-w
Ogbanga, M. M., Sharma, S. N., Pandey, A. K., & Singh, P. (2025). Artificial intelligence in social work to ensure environmental sustainability. In M. Nasr, A. Negm, & L. Peng (Eds.), Artificial intelligence applications for a sustainable environment. Springer. https://doi.org/10.1007/978-3-031-91199-6
Sharma, S. N. (2012). Participatory planning in plan preparation: A case of Delhi. EduPedia Publications (P) Ltd.
Sharma, S. N. (2019). Review of most used urban growth models. International Journal of Advanced Research in Engineering and Technology, 10.
Sharma, S. N., & Dehalwar, K. (2025a). A systematic literature review of transit-oriented development to assess its role in economic development of city. Transportation in Developing Economies, 11(2), 23. https://doi.org/10.1007/s40890-025-00245-1
Sharma, S. N., & Dehalwar, K. (2025b). Examining the inclusivity of India’s National Urban Transport Policy for senior citizens. In D. S.-K. Ting & J. A. Stagner (Eds.), Transforming healthcare infrastructure (pp. 115–134). CRC Press. https://doi.org/10.1201/9781003513834-5
Sharma, S. N., & Dehalwar, K. (2025c). Review of landuse transportation interaction model in smart urban growth management. European Transport, (103), 1–15.
Sharma, S. N., Chatterjee, S., & Dehalwar, K. (2023). Mahatma Gandhi National Rural Employment Guarantee Scheme: Challenges and opportunities. Think India Journal, 26(1), 7–15.
Sharma, S. N., Dehalwar, K., Jain, S., & Pandey, A. K. (2025). An assessment of the applications and prospects of AI tools in solid waste management. In Artificial intelligence applications for a sustainable environment (pp. 97–118). Springer.
Sharma, S. N., Dehalwar, K., & Pandey, A. K. (2026). Measures to manage the urban water quality for public health. In Environmentalism in healthcare (pp. 339–371).
Sharma, S. N., Dehalwar, K., & Yadav, K. (2026a). Advances in AI-based mobility modelling: Toward intelligent transport infrastructure in smart cities. In AI-Based data mobility and intelligent modeling for smart cities (pp. 67–106).
Sharma, S. N., Dehalwar, K., & Yadav, K. (2026b). Advancing travel behaviour modelling: A systematic literature review. Civil Engineering Infrastructures Journal, e108027.
Sharma, S. N., Dehalwar, K., & Yadav, K. (2026c). Urban spatial digital twin in sustainability to spur economic growth in transit-oriented development-based development. In Tenable engineering for a sustainable future (pp. 257–300).
Sharma, S. N., Kumar, A., & Dehalwar, K. (2024). The precursors of transit-oriented development. Economic and Political Weekly, 59(14), 16–20. https://doi.org/10.5281/zenodo.10939448
Sharma, S. N., Lodhi, A. S., Dehalwar, K., & Jaiswal, A. (2024). Life cycle assessment (LCA) of recycled & secondary materials in the construction of roads. IOP Conference Series: Earth and Environmental Science, 1326(1), 012102.
Sharma, S. N., Singh, D., & Dehalwar, K. (2024). Surrogate safety analysis: Leveraging advanced technologies for safer roads. Suranaree Journal of Science and Technology, 31(4), 010320, 1–14. https://doi.org/10.55766/sujst-2024-04-e03837
Sharma, S. N., Singh, S., Kumar, G., Pandey, A. K., & Dehalwar, K. (2025). Role of green buildings in creating sustainable neighbourhoods. IOP Conference Series: Earth and Environmental Science, 1519(1), 012018.
Sharma, S. N., Dehalwar, K., Kumar, G., Yadav, K., & Verma, D. (2026). Utilization of advanced materials for permeable paving, biocrete, and piezoelectric materials in walkways to transit stations. In Engineering sustainability goals: UNSDG 12 (p. 209).
United Nations. (2015). Transforming our world: The 2030 Agenda for Sustainable Development. United Nations.
United Nations Department of Economic and Social Affairs. (2023). Goal 11: Make cities and human settlements inclusive, safe, resilient and sustainable. United Nations.
UN-Habitat. (2024a). World Cities Report 2024: Cities and climate action. United Nations Human Settlements Programme.
UN-Habitat. (2024b). Urban content of NDCs: Local climate action explored through in-depth country analyses. United Nations Human Settlements Programme.
UN-Habitat. (2024c). World Smart Cities Outlook 2024. United Nations Human Settlements Programme.
UN-Habitat. (2024d). World Cities Report 2024: Financing interventions for climate change in cities. United Nations Human Settlements Programme.
World Bank. (2025a). Towards resilient and prosperous cities in India. World Bank.
World Bank. (2025b). India has a critical opportunity to drive resilient urban development. World Bank.
Yadav, K., Dehalwar, K., & Sharma, S. N. (2025a). Assessing the factors affecting first and last mile accessibility in transit-oriented development: A literature review. GeoJournal, 90, 298. https://doi.org/10.1007/s10708-025-11546-8
Yadav, K., Dehalwar, K., Sharma, S. N., & Yadav, S. (2025b). Understanding user satisfaction in last-mile connectivity under transit-oriented development in Tier 2 Indian cities: A climate-sensitive perspective. IOP Conference Series: Earth and Environmental Science, 1579(1), 012006. https://doi.org/10.1088/1755-1315/1579/1/012006
Yadav, K., Dehalwar, K., & Sharma, S. N. (2025c). A user-centric machine learning framework for predicting multi-modal accessibility in transit-oriented development zones for sustainable urban construction in Tier-2 Indian cities. Asian Journal of Civil Engineering. https://doi.org/10.1007/s42107-025-01625-z
Yadav, K., Dehalwar, K., & Sharma, S. N. (2026). Exploring the environmental determinants of mode choice in first and last mile connectivity: Evidence from a systematic review. Innovative Infrastructure Solutions, 11(4), 204.
India’s human settlements are undergoing profound transformation as a result of urbanisation, metropolitan expansion, migration, infrastructure investment, changing housing markets, environmental pressures and technological development. These transformations have generated substantial opportunities for economic growth and improved connectivity, but their benefits and costs are not distributed equally. Inequalities persist in access to housing, sanitation, transportation, public spaces, employment, environmental resources and decision-making. Social justice must therefore become a central objective of spatial planning rather than a supplementary concern addressed after physical development has occurred. This article examines inclusive human settlement planning in India through an integrated review of housing, informal settlements, urban-fringe development, sanitation, universal design, public transportation, first- and last-mile connectivity, transit-oriented development, public-space accessibility, gender, caste, rural development, participatory planning, environmental justice and emerging digital technologies. It draws extensively on the supplied research literature, including studies by Dehalwar, Sharma and their collaborators on social injustice, slums, housing, research methodology, women’s reservation, transport, urban growth, green buildings, life-cycle assessment, artificial intelligence, digital twins, rural employment, sanitation and accessibility. The article argues that social justice has distributive, recognitional, procedural and representational dimensions. It proposes an integrated framework in which housing, mobility, infrastructure, environment and participation are planned as interconnected systems. The article further argues that artificial intelligence, GIS, machine learning and digital twins can strengthen planning only when accompanied by representative data, community participation and institutional accountability. The future of Indian planning should therefore move from infrastructure-centred development towards people-centred, context-sensitive and evidence-based human settlement planning.
Keywords: social justice; inclusive human settlements; spatial inequality; housing; informal settlements; transport accessibility; universal design; participatory planning; environmental justice; artificial intelligence; India
1. Introduction
Human settlements are not merely collections of buildings, roads and infrastructure. They are complex spatial systems in which economic activity, social relationships, cultural practices, environmental processes and institutional structures interact. A neighbourhood provides not only shelter but also access to employment, education, healthcare, transportation, public spaces and social networks. Consequently, decisions about land use, housing, roads, public facilities and environmental infrastructure are simultaneously decisions about opportunity and inclusion.
The importance of inclusive settlement planning has become increasingly visible as urbanisation accelerates. The United Nations identifies inclusive, safe, resilient and sustainable cities as a central global development objective under Sustainable Development Goal 11. Current UN reporting emphasises that rapid urbanisation can outpace the provision of housing, infrastructure and services, while urban sprawl, informal settlements and unequal access to public transport remain major challenges. United Nations
These challenges are especially significant in India. Large metropolitan regions are expanding beyond conventional municipal boundaries; smaller cities are experiencing increasing development pressure; villages are becoming functionally integrated with urban economies; and peri-urban areas are being transformed by residential, commercial and infrastructure development. At the same time, informal settlements remain important sources of affordable housing and employment access for economically vulnerable populations.
Climate change adds another layer of complexity. UN-Habitat’s World Cities Report 2024 notes that climate impacts interact with existing inequalities and that poorer and marginalised urban groups frequently have fewer resources with which to respond to climate risks. The report also stresses that poorly designed climate interventions can themselves create exclusionary outcomes, particularly where informal settlements and vulnerable communities are overlooked. UN-Habitat The IPCC similarly identifies unplanned and informal settlements and smaller and medium-sized cities in low- and middle-income countries as important areas of increasing climate vulnerability and exposure. IPCC
The research supplied for this article provides a valuable India-specific basis for examining these questions. It includes research on social injustice caused by spatial changes in vernacular settings, the fate of slums in Bhopal, housing development in urban fringe areas, rural sanitation, universal design, women’s reservation, Dalit representation, rural employment, public transport, first- and last-mile accessibility, public-space access, green buildings, life-cycle assessment, urban growth modelling, artificial intelligence and digital twins. The bibliography supplied by the user records these works across the period 2012–2027. Pasted text Pasted text
The central proposition of this article is that social justice should be embedded in the entire planning process. It should influence how problems are diagnosed, how alternatives are developed, how infrastructure is located, how investments are prioritised, how communities participate and how outcomes are evaluated.
The objective should not simply be to build more infrastructure or create more technologically advanced cities. It should be to create human settlements in which people with different incomes, ages, genders, abilities, occupations and social backgrounds can access opportunities and participate meaningfully in shaping the places where they live.
2. Social Justice as a Foundation of Human Settlement Planning
Social justice in spatial planning can be understood through four interconnected dimensions: distribution, recognition, participation and representation.
2.1 Distributive justice
Distributive justice concerns the allocation of resources and opportunities. In spatial planning, these include:
housing;
roads;
public transport;
schools;
healthcare;
sanitation;
parks;
water;
employment opportunities; and
environmental amenities.
A settlement can be physically developed while remaining socially unequal if infrastructure and opportunities are concentrated in selected areas.
2.2 Recognitional justice
Recognitional justice requires planners to recognise differences between social groups. Older adults, women, children, persons with disabilities, migrants, informal workers and socially marginalised communities may experience the same urban environment differently.
A staircase, for example, may represent convenient circulation for one person but a major barrier for another.
2.3 Procedural justice
Procedural justice concerns who participates in decisions. Residents should have opportunities to contribute to planning rather than merely being informed after decisions are finalised.
2.4 Representational justice
Representational justice concerns institutional power. Dehalwar and Sharma’s work on women’s reservation and the research of Verma, Yadav, and Sharma on Dalit representation demonstrate that social inclusion is also a question of access to institutions and decision-making power. Pasted text Pasted text
These dimensions cannot be separated. Poor distribution may result from weak representation. Lack of recognition may lead to inappropriate infrastructure. Limited participation can result in plans that fail to understand local needs.
Consequently, an inclusive planning framework should address all four.
3. Spatial Transformation and Social Injustice
Physical transformation is an essential characteristic of urban development, but it is not socially neutral.
Dehalwar and Sharma (2024), in their study “Social injustice inflicted by spatial changes in vernacular settings: An analysis of published literature,” examine how changes in spatial environments can produce social consequences. The study is particularly relevant to settlements where traditional forms, social networks and cultural relationships are altered by development. Pasted text
Traditional neighbourhoods often contain forms of social infrastructure that are difficult to quantify. Streets may function as social spaces. Courtyards may support community interaction. Local markets may support informal employment. Religious or cultural spaces may contribute to collective identity.
When redevelopment replaces these systems, the physical quality of the new environment does not necessarily compensate for the loss of social relationships.
This creates a fundamental planning question:
Should successful redevelopment be measured only by what replaces the existing physical environment, or also by what happens to the community that occupied it?
A socially just approach requires the second question to be considered.
Spatial transformation should therefore be evaluated in terms of:
displacement;
affordability;
cultural continuity;
access to social networks;
livelihood impacts;
accessibility;
public-space changes; and
community participation.
4. Urbanisation and Uneven Development
Urbanisation generates economic opportunities, but its benefits are spatially uneven.
Areas with better transportation, employment and infrastructure tend to attract investment. Property values may increase, commercial activities may intensify and development may accelerate. At the same time, communities with lower incomes may face affordability pressures.
This produces a paradox: improved infrastructure can simultaneously improve accessibility and increase displacement pressure.
Planning must therefore consider the distributional consequences of infrastructure investment.
Kumar, Vyas, Sharma, and Dehalwar (2023) examined planning and development of housing in the urban fringe area of Bhopal, providing an example of the complexity of peripheral urban development. Pasted text
Urban fringes are particularly important because they often contain:
agricultural land;
villages;
informal settlements;
plotted developments;
institutional uses;
industrial areas;
new housing projects; and
emerging transport corridors.
These areas require planning at a scale larger than individual municipal jurisdictions.
5. The Urban Fringe as a Zone of Social Transformation
The urban fringe is not simply an undeveloped area waiting for urban expansion.
It is often an existing social and economic landscape.
Agricultural households may depend on land for livelihood. Villages may possess established community institutions. Informal settlements may provide affordable housing to workers employed in nearby cities.
When development occurs, some landowners may benefit from rising land values, while agricultural labourers may lose employment opportunities. Existing residents may gain access to infrastructure but face increased costs.
The transition from rural to urban land use can therefore produce differentiated outcomes.
A socially just metropolitan strategy should include:
protection of essential agricultural land;
recognition of existing villages;
infrastructure provision for peripheral communities;
affordable housing;
public-transport connectivity;
protection of livelihoods;
environmental management; and
community participation.
6. Predicting Urban Growth: From Modelling to Inclusive Planning
Urban growth modelling can help planners anticipate development.
Kumar, Vyas, Sharma, and Dehalwar (2025) examined urban growth prediction using a CA–ANN model and spatial analysis for planning policy in Indore city. The supplied bibliography records the article in GeoJournal. Pasted text
CA–ANN approaches combine spatial transition modelling with artificial neural-network techniques. Such approaches can support identification of potential growth areas and relationships among land-use variables.
However, predictive modelling should not be treated as an automatic substitute for planning.
A model may indicate that development is likely in a particular location. It does not determine:
whether development should occur there;
who will benefit;
who may be displaced;
whether infrastructure is adequate;
whether the land is environmentally suitable; or
whether the development is socially equitable.
The next generation of urban-growth modelling should therefore incorporate social indicators alongside physical variables.
Possible social variables include:
income;
housing affordability;
accessibility;
service coverage;
tenure;
population vulnerability;
environmental exposure; and
displacement risk.
This would transform urban growth modelling from a prediction tool into a more comprehensive equity-aware planning tool.
7. Informal Settlements: Vulnerability and Resilience
Informal settlements are often located where formal housing markets fail to meet demand.
They can provide proximity to employment at costs that are accessible to low-income households. At the same time, they may lack formal tenure, sanitation, drainage, road infrastructure and adequate housing.
Dehalwar and Sharma (2023), in “Fate of slums of Bhopal—a tale of struggle and resilience,” emphasise the complexity of these communities. Pasted text
The concept of resilience is important.
Residents frequently create:
informal economic networks;
mutual-support systems;
local associations;
shared services;
flexible housing arrangements; and
informal transportation systems.
These should not automatically be viewed as failures of planning. They can also represent adaptive responses to formal-system limitations.
Consequently, planning interventions should seek to understand existing community capacities before replacing them.
8. In-Situ Upgrading Versus Relocation
Relocation is sometimes necessary when settlements occupy locations exposed to severe hazards or when essential infrastructure cannot safely be provided.
However, relocation can have unintended effects.
A household may receive improved physical housing but lose:
proximity to employment;
access to schools;
social networks;
local markets;
childcare support;
familiar transportation routes.
Thus, housing improvement should not be assessed only by the physical quality of the dwelling.
Where feasible, in-situ upgrading may provide an alternative.
Upgrading can include:
water supply;
sanitation;
drainage;
street improvements;
lighting;
waste management;
housing improvement;
public spaces; and
tenure regularisation.
The most appropriate strategy depends on local conditions and environmental risk.
9. Housing as a Spatial Right
Housing is frequently treated as a construction problem: how many houses should be built and at what cost?
A social-justice perspective asks a broader question:
Where should housing be located, for whom, and with what access to opportunity?
Housing located far from employment may be inexpensive but generate substantial transportation costs.
A household’s real housing burden can therefore be expressed conceptually as:
Total household spatial burden = housing cost + transport cost + service cost + time cost.
The time component is particularly important.
Long commutes reduce time available for:
childcare;
education;
recreation;
community participation; and
rest.
Housing planning should therefore be coordinated with transportation planning.
10. Housing Diversity
Indian households have diverse structures.
They include:
nuclear families;
joint families;
elderly households;
single-person households;
women-headed households;
migrants;
students;
informal workers; and
temporary workers.
Housing policies based on a single household model can therefore exclude important groups.
Flexible housing design can provide adaptability over time.
Universal design can further ensure that housing remains usable as household circumstances change.
The principle should be housing adaptability rather than housing uniformity.
11. Sanitation and Dignity
Sanitation is a fundamental component of human settlement quality.
Sharma’s work on rural sanitation and his earlier work on best practices for total sanitation demonstrate that sanitation is not simply an infrastructure issue. Pasted text Pasted text
A complete sanitation system requires:
toilets;
water;
wastewater collection;
treatment;
safe disposal;
maintenance;
monitoring; and
behavioural support.
The absence of any component can compromise the entire system.
Sanitation is also connected to social dignity.
Inadequate sanitation can affect women, children, older adults and people with disabilities differently.
Therefore, sanitation planning should incorporate:
safety;
privacy;
accessibility;
gender;
location; and
maintenance.
12. Water Quality and Public Health
Water-quality management represents another dimension of social justice.
Sharma, Dehalwar, and Pandey (2026) examine measures to manage urban water quality for public health. The supplied publication list identifies the work within Environmentalism in Healthcare. Pasted text
Water pollution can create unequal health burdens because communities with fewer resources may have fewer alternatives when local water quality deteriorates.
Urban water planning should therefore integrate:
source protection;
drainage;
wastewater treatment;
monitoring;
public-health surveillance; and
community awareness.
Water quality should be understood as a settlement-level issue rather than solely as a technical utility function.
13. Universal Design and Inclusive Environments
Agarwal and Sharma (2014) examined universal design to ensure an equitable society. Pasted text
Universal design is essential because accessibility barriers are often embedded in ordinary physical systems.
Examples include:
stairs without ramps;
narrow footpaths;
inaccessible bus stops;
high kerbs;
insufficient seating;
poorly designed crossings;
inadequate signage.
Universal design should be integrated into planning from the beginning.
It should apply to:
buildings;
housing;
streets;
parks;
transport;
government facilities;
schools; and
healthcare.
14. Ageing and Transport Inclusion
Older adults often face declining mobility, increased sensitivity to environmental conditions and greater dependence on accessible transport.
Sharma and Dehalwar (2025) examined the inclusivity of India’s National Urban Transport Policy for senior citizens. Pasted text
Age-friendly mobility requires:
accessible vehicles;
low-floor boarding;
safe crossings;
appropriate seating;
shorter walking distances;
clear information;
adequate lighting; and
reliable services.
Planning for older adults also benefits other groups.
A footpath designed for an elderly pedestrian can also improve mobility for children, persons with disabilities and people carrying goods.
15. Public Transport and User Experience
Lodhi, Jaiswal, and Sharma (2024) examined bus-user satisfaction using discrete choice models in Bhopal. Pasted text
The study highlights the value of user-oriented transport research.
Transport systems should not be evaluated only according to:
traffic speed;
road capacity;
vehicle throughput.
They should also be assessed through:
waiting time;
comfort;
affordability;
reliability;
safety;
accessibility;
information; and
connectivity.
A system that moves vehicles efficiently but fails to meet user needs is not necessarily successful from a human-mobility perspective.
16. First- and Last-Mile Connectivity
Yadav, Dehalwar, and Sharma (2025) examined the factors affecting first- and last-mile accessibility in transit-oriented development. Pasted text
The first and last mile is often where the accessibility of public transport succeeds or fails.
A major transit station may be located within a neighbourhood, but residents may still be unable to use it because of:
missing sidewalks;
unsafe roads;
excessive distance;
poor crossings;
steep terrain;
extreme heat;
lack of feeder services.
Yadav et al. (2025) also studied user satisfaction in last-mile connectivity in Tier-2 Indian cities from a climate-sensitive perspective. Pasted text
This perspective is particularly valuable because climate conditions influence walking and cycling.
17. Climate-Sensitive Accessibility
Transportation planning increasingly needs to consider environmental comfort.
Extreme heat, rainfall and flooding can make walking and cycling difficult even when the physical network exists.
Yadav, Dehalwar, and Sharma (2026) examined environmental determinants of mode choice in first- and last-mile connectivity. Pasted text
This work suggests that accessibility is not purely a spatial variable.
A route can be physically available but functionally inaccessible during certain environmental conditions.
Therefore, climate-sensitive transport planning should consider:
shade;
vegetation;
drainage;
sheltered waiting areas;
surface quality;
heat exposure;
flood risk.
This is particularly important in Indian cities experiencing increasing heat stress.
18. Public Open Spaces and Social Inclusion
Public spaces are essential for recreation, social interaction and public life.
Lalramsangi, Garg, and Sharma (2025) studied route choices to access public open spaces in hill cities. Pasted text
Their work illustrates that access is influenced by spatial configuration and route characteristics.
In hilly cities, actual walking effort can differ substantially from straight-line distance.
Therefore, public-space accessibility assessment should include:
slope;
stairs;
route directness;
pedestrian safety;
lighting;
seating;
shade;
connectivity.
Public-space provision should thus move beyond the simple calculation of area per capita.
19. Transit-Oriented Development and Equity
Transit-oriented development integrates transport and land use around transit corridors.
Sharma and Dehalwar (2025) reviewed the role of TOD in economic development, while Yadav et al. (2025) examined first- and last-mile accessibility within TOD environments.
TOD can improve:
accessibility;
public transport use;
pedestrian movement;
mixed land use;
development efficiency.
However, increased accessibility can also increase land values.
This creates an important social-justice concern.
If existing low-income residents cannot afford rising rents or property taxes, they may be displaced from areas that have received public investment.
Therefore, inclusive TOD should consider:
affordable housing;
tenant protection;
local employment;
public-space access;
universal design;
community participation.
Transit-oriented development should not be understood solely as a density strategy.
20. Land Use–Transport Interaction
Sharma and Dehalwar (2025) reviewed land-use transportation interaction models in smart urban growth management. Pasted text
Land use and transportation form a feedback system.
Transportation infrastructure influences land values and development patterns.
Land-use patterns influence travel demand.
This interaction has important implications for social equity.
If affordable housing is located far from employment, transport demand increases.
If transport investment is concentrated in wealthy areas, existing inequalities may be reinforced.
Integrated land-use–transport planning can instead support more balanced spatial development.
21. Travel Behaviour and Social Inclusion
Travel behaviour is influenced by more than individual preference.
It can reflect:
income;
gender;
age;
employment;
household structure;
accessibility;
safety;
environmental conditions.
Sharma and Dehalwar’s research on travel behaviour and TOD, together with Yadav et al.’s work on multimodal accessibility, indicates the importance of understanding travel as part of a broader spatial system.
The user-centric machine-learning framework developed by Yadav, Dehalwar, and Sharma (2026) further explores prediction of multimodal accessibility in TOD zones. Pasted text
Such methods can help identify populations facing poor accessibility.
However, machine learning should be complemented by qualitative evidence to understand why accessibility is low.
22. Gender and the Spatial Experience of the City
Women and men may experience the same urban space differently.
Women’s mobility can be influenced by:
safety;
childcare;
household responsibilities;
employment;
social norms;
public transport conditions.
Dehalwar and Sharma’s (2024) work on politics in the name of women’s reservation introduces an institutional dimension to this discussion. Pasted text
Gender inclusion requires both:
spatial inclusion, through safer and more accessible environments,
and
institutional inclusion, through meaningful participation in decision-making.
Women should therefore not be viewed solely as beneficiaries of planning. They should be recognised as active participants in shaping plans.
23. Caste, Representation and Access to Power
Social justice in India cannot be adequately discussed without considering caste-based inequality.
Verma, Yadav, and Sharma (2026) examined Dalit representation deficits across state, market and cultural institutions. Pasted text
The relevance to planning is that access to space and access to institutions are interconnected.
A community may physically live near a public institution but still lack effective influence over decisions.
This suggests that spatial planning should consider:
representation;
institutional access;
participation;
social exclusion;
resource distribution.
Planning processes should actively seek participation from groups that have historically had limited institutional power.
24. Rural Employment and Spatial Justice
Human settlement planning must include rural areas.
Sharma, Chatterjee, and Dehalwar (2023) examined the Mahatma Gandhi National Rural Employment Guarantee Scheme, highlighting challenges and opportunities in rural employment. Pasted text
Similarly, research on rural road connectivity examines how infrastructure can reduce spatial isolation.
Rural roads can improve:
access to markets;
education;
healthcare;
employment;
government services.
However, connectivity should be accompanied by services and economic opportunities.
25. Rural–Urban Integration
Urban and rural areas increasingly form interconnected systems.
People may:
live in villages and work in cities;
produce agricultural goods for urban markets;
commute between settlements;
access urban healthcare;
migrate temporarily for employment.
Metropolitan expansion can therefore transform rural livelihoods.
Regional planning should coordinate:
land use;
agriculture;
transportation;
housing;
environmental protection;
employment;
public services.
This approach can reduce fragmented development.
26. Participatory Planning
Sharma’s work on participatory planning in plan preparation provides an important basis for community-centred planning.
Participation can reveal information that conventional datasets cannot capture.
Residents can identify:
unsafe areas;
informal paths;
seasonal flooding;
local markets;
community assets;
transport problems;
inaccessible services.
Participation should therefore be considered a form of planning knowledge.
However, participation must be meaningful.
A process in which decisions have already been made before public consultation is limited.
Effective participation requires early involvement and feedback mechanisms.
27. Quantitative and Qualitative Evidence
Dehalwar and Sharma (2024) examined the distinction between quantitative and qualitative research methods. Pasted text
Quantitative methods can answer:
How many?
Where?
How often?
What relationship exists?
What pattern is visible?
Qualitative methods can answer:
Why?
How is the problem experienced?
What does a space mean to residents?
Why does a service remain inaccessible?
Both forms of knowledge are valuable.
For example, GIS may identify a neighbourhood with poor access to healthcare. Interviews may reveal that the actual barrier is not physical distance but unaffordable transportation.
Mixed-method research can therefore provide a more complete understanding of social inequality.
28. Delphi Research and Expert Knowledge
Jain, Dehalwar, and Sharma (2024) discussed the Delphi research method and expert opinion surveys. Pasted text
Delphi methods can be useful when planning involves uncertainty or competing priorities.
Potential applications include:
prioritising social-justice indicators;
identifying accessibility criteria;
evaluating planning scenarios;
developing resilience frameworks;
assessing policy alternatives.
Expert judgement should complement rather than replace community knowledge.
Environmental benefits and environmental risks are not equally distributed.
Low-income communities may experience:
greater flood exposure;
poor drainage;
pollution;
inadequate waste management;
limited green space.
UN-Habitat’s World Cities Report 2024 specifically highlights the interaction between climate change and pre-existing inequalities and notes that vulnerable populations can face disproportionate impacts. UN-Habitat
The report also cautions that climate infrastructure can have exclusionary consequences when informal settlements and poorer households are not incorporated into planning. UN-Habitat
This reinforces the importance of social-impact assessment.
Environmental interventions should therefore be evaluated according to:
who benefits;
who bears costs;
who is displaced;
who participates; and
whether vulnerable groups are protected.
30. Climate Change and Inclusive Human Settlements
Climate change is increasingly transforming the planning context.
Flooding, heatwaves, drought and extreme rainfall can affect infrastructure and public health.
The IPCC identifies urbanisation, exposure and climate hazards as interacting drivers of urban risk, with vulnerability particularly significant in informal and unplanned settlements and in smaller and medium-sized urban areas. IPCC
This is highly relevant to India.
A climate-resilient settlement requires:
drainage;
heat mitigation;
resilient infrastructure;
emergency access;
green infrastructure;
water management;
safe housing.
But resilience should also be socially distributed.
A settlement cannot be considered resilient if only affluent neighbourhoods have access to protective infrastructure.
UN-Habitat’s 2024 report explicitly connects climate action with poverty reduction, resilient infrastructure, public health and social inclusion. UN-Habitat
31. Green Buildings and Neighbourhood Sustainability
Sharma, Singh, Kumar, Pandey, and Dehalwar (2025) examined the role of green buildings in creating sustainable neighbourhoods. Pasted text
Green buildings can improve:
energy efficiency;
water efficiency;
indoor environmental quality;
resource conservation.
However, a green building is not necessarily a socially inclusive building.
A socially sustainable building should also be:
affordable;
accessible;
connected to public transport;
integrated with public space;
suitable for diverse users.
The neighbourhood context is therefore essential.
32. Life-Cycle Thinking in Infrastructure
Sharma, Lodhi, Dehalwar, and Jaiswal (2024) examined life-cycle assessment of recycled and secondary materials in road construction. Pasted text
Such a framework encourages long-term rather than short-term decision-making.
33. Solid Waste Management and Social Equity
Solid waste management is a basic urban service.
Sharma, Dehalwar, Jain, and Pandey (2025) examined AI applications and prospects in solid waste management. Pasted text
AI can potentially improve:
collection routes;
scheduling;
waste classification;
recycling;
monitoring.
However, waste management is also a social system involving workers and communities.
Planning should therefore consider:
occupational health;
worker safety;
dignity;
protective equipment;
location of waste facilities;
community exposure.
Technological optimisation should not replace attention to human conditions.
34. Artificial Intelligence and Socially Responsible Planning
AI is increasingly used for prediction, classification and optimisation.
The supplied research includes work on:
AI and social work;
AI and solid waste;
machine learning and accessibility;
urban growth prediction;
digital twins;
mobility modelling.
Ogbanga et al. (2025) discuss AI in social work for environmental sustainability, illustrating the broader potential of AI to connect technological systems with social and environmental objectives. Pasted text
However, AI systems inherit limitations from their data.
If informal settlements are underrepresented in datasets, AI may underestimate their needs.
If mobility datasets primarily represent smartphone users, travel patterns among digitally excluded populations may be missed.
Socially responsible AI therefore requires:
representative datasets;
transparency;
validation;
human oversight;
explainability;
continuous evaluation.
35. Digital Twins and Urban Equity
Sharma and Dehalwar’s work on urban spatial digital twins and sustainability in TOD-based development demonstrates the growing role of digital representation in urban planning. Pasted text
Digital twins can potentially integrate:
land use;
buildings;
transportation;
infrastructure;
environmental data;
population;
energy;
water.
They can support scenario testing.
For example, planners could examine how a new transport corridor might affect accessibility and land-use development.
But digital twins should also represent social realities.
A settlement that is poorly represented in the digital model can become poorly represented in the planning process.
Thus, the principle should be:
No digital representation without social representation.
36. People-Centred Smart Cities
UN-Habitat’s World Smart Cities Outlook 2024 explicitly frames smart-city development around people-centred approaches and examines technology through the lenses of sustainability, resilience, equity, social inclusion, accessibility and quality of life. UN-Habitat
This perspective is important because smart-city programmes can otherwise become technology-centred.
A smart city should not simply contain:
sensors;
cameras;
digital platforms;
AI;
automated systems.
It should also improve:
accessibility;
public services;
transparency;
safety;
environmental quality;
participation;
quality of life.
Technology should therefore be judged according to social outcomes.
37. Infrastructure and Social Resilience
Infrastructure is often discussed in engineering terms, but infrastructure also shapes social resilience.
Roads determine emergency access.
Drainage influences flood vulnerability.
Public transport influences employment access.
Water systems influence public health.
Public spaces influence social interaction.
Digital networks influence access to information.
Consequently, infrastructure should be understood as social infrastructure as well as physical infrastructure.
UN-Habitat’s World Cities Report 2024 emphasises that infrastructure deficits increase climate vulnerability and that infrastructure planning should incorporate underlying social and environmental conditions. UN-Habitat
This supports an integrated infrastructure-planning approach.
38. A Comprehensive Framework for Socially Just Human Settlements
The research reviewed in this article can be synthesised into an integrated framework with ten dimensions.
38.1 Housing justice
Adequate, affordable and secure housing.
38.2 Mobility justice
Affordable, safe and reliable mobility.
38.3 Accessibility justice
Universal access to buildings, streets and public spaces.
38.4 Infrastructure justice
Equitable distribution of essential services.
38.5 Environmental justice
Fair distribution of environmental benefits and risks.
38.6 Gender justice
Safe mobility, sanitation, public spaces and representation.
38.7 Social representation
Inclusion of historically marginalised communities.
38.8 Participatory justice
Meaningful community participation.
38.9 Rural–urban justice
Balanced access to development opportunities across regions.
38.10 Digital justice
Inclusive data and accountable technological systems.
These dimensions should be assessed together rather than independently.
39. Measuring Inclusive Human Settlements
A socially just settlement requires measurable indicators.
Dimension
Indicators
Housing
Affordability, tenure, overcrowding
Mobility
Transit access, travel time, fare burden
Walking
Footpath coverage, crossing safety
Universal design
Accessible buildings and streets
Sanitation
Toilet, water and wastewater access
Public space
Park access, distribution and safety
Gender
Safety, mobility, participation
Social inclusion
Service accessibility by social group
Environment
Flood exposure, heat, air quality
Employment
Job accessibility
Participation
Community involvement
Representation
Participation of marginalised groups
Digital inclusion
Data and service accessibility
Governance
Transparency and accountability
Such indicators can be mapped using GIS and combined with household surveys and participatory research.
40. Spatial Accessibility as a Unifying Concept
Accessibility provides a useful bridge between housing, transport, land use and social justice.
A household’s quality of life depends not only on where it lives but on what it can reach.
Accessibility can be measured in terms of:
employment;
education;
healthcare;
public transport;
public spaces;
markets;
recreation.
This suggests a shift from location-based planning to access-based planning.
Instead of asking:
How many facilities exist?
planners should also ask:
How many people can reach these facilities conveniently, affordably and safely?
This is particularly relevant to the research on multimodal accessibility, first- and last-mile connectivity and public-space route choices.
41. From Equality to Equity
Equality and equity are not identical.
If every neighbourhood receives one park of the same size, this represents equality of provision.
But if one neighbourhood has a much larger population and no existing green space, identical provision may not be equitable.
Similarly, identical bus frequencies may not produce equal accessibility if some areas have large elderly populations or difficult terrain.
Equity requires context-sensitive allocation.
This principle should guide:
housing;
public transport;
parks;
sanitation;
healthcare;
infrastructure investment.
42. Vulnerability as a Multidimensional Concept
Vulnerability is rarely caused by one characteristic.
It can emerge from combinations of:
poverty;
age;
disability;
gender;
insecure housing;
environmental exposure;
lack of transport;
social exclusion.
A low-income elderly person living in an informal settlement on a flood-prone site may face multiple overlapping vulnerabilities.
Such assessments can combine demographic, spatial, environmental and accessibility data.
43. The Importance of Local Context
There is no universal model of an inclusive settlement.
Planning approaches should respond to:
climate;
topography;
settlement morphology;
economic conditions;
social structure;
cultural practices;
governance;
infrastructure.
The research on hill-city public-space access demonstrates the significance of topography. The Bhopal studies illustrate the importance of local housing and informal-settlement conditions. The Tier-2-city transport studies demonstrate the need for context-sensitive mobility planning.
Therefore, context-sensitive planning should be considered a core principle.
44. Governance and Multi-Level Planning
Human settlement problems frequently cross administrative boundaries.
Housing, transport, water, waste and environmental systems often operate across municipal jurisdictions.
UN-Habitat’s World Cities Report 2024 highlights the importance of multi-level governance and stronger collaboration among national, regional and local governments, communities and civil-society actors. UN-Habitat
This is particularly important in metropolitan regions.
A fragmented governance structure can produce:
disconnected transportation;
uneven infrastructure;
uncontrolled fringe development;
inconsistent environmental management.
Metropolitan planning mechanisms can help coordinate these systems.
45. Planning Education and Professional Practice
The changing complexity of human settlements requires a broader planning skill set.
Future planners need competence in:
GIS;
spatial modelling;
statistics;
qualitative research;
transport planning;
housing;
environmental planning;
universal design;
participatory planning;
AI;
digital twins.
However, technical competence must be accompanied by ethical and social awareness.
A planner should be capable of asking:
Who benefits?
Who bears the cost?
Who is missing from the data?
Who participates?
Who may be displaced?
What happens over the long term?
These questions should become integral to professional planning practice.
46. Future Research Agenda
The literature points towards several important research directions.
46.1 Equity-sensitive urban-growth modelling
CA–ANN and other predictive models should incorporate social vulnerability and accessibility.
46.2 Housing–transport affordability
Future studies should examine housing and transportation costs together.
46.3 Informal settlement resilience
More longitudinal research is needed on upgrading and relocation outcomes.
46.4 Gender-sensitive transport
Research should examine women’s mobility patterns in smaller Indian cities.
46.5 Age-friendly planning
Older adults should be incorporated into transport and public-space planning research.
46.6 Climate-sensitive accessibility
Heat, flooding and extreme rainfall should be incorporated into accessibility models.
46.7 Socially responsible AI
Researchers should assess data gaps, bias and representation.
46.8 Digital twins and participation
Digital twins should incorporate community-generated information.
46.9 Environmental justice
Green infrastructure should be evaluated for distributional consequences.
46.10 Rural–urban transformation
More integrated studies should examine how metropolitan expansion affects rural communities.
47. Policy Implications
Several policy directions emerge from the analysis.
47.1 Integrate housing and transport planning
Affordable housing should be located with consideration of employment and public transportation.
47.2 Protect vulnerable communities during redevelopment
Redevelopment should assess displacement and livelihood impacts.
47.3 Strengthen in-situ upgrading
Where environmental and structural conditions permit, settlement improvement should be considered alongside relocation.
47.4 Mainstream universal design
Accessibility should be integrated into all infrastructure planning.
47.5 Strengthen public participation
Participation should occur before major decisions are finalised.
47.6 Improve representation
Planning institutions should incorporate the perspectives of marginalised communities.
47.7 Integrate climate and social planning
Climate adaptation should not unintentionally exclude vulnerable residents.
47.8 Use technology responsibly
AI and digital twins should improve planning without replacing community knowledge or institutional accountability.
47.9 Strengthen metropolitan governance
Urban and peri-urban development should be coordinated across administrative boundaries.
47.10 Develop social-justice indicators
Planning agencies should monitor distributional outcomes rather than only project completion.
48. Conclusion
The future of India’s human settlements will be shaped by the interaction of urbanisation, housing, transportation, environmental change, infrastructure investment, demographic transformation and technology. These processes cannot be planned independently.
The extensive body of research considered in this article demonstrates the multidimensional character of social justice.
Research on spatial injustice demonstrates that physical transformation can alter social relationships and cultural identity. Research on Bhopal’s slums demonstrates that informal settlements contain both vulnerability and resilience. Housing research demonstrates the importance of urban-fringe development. Sanitation research demonstrates the connection between infrastructure, health and dignity. Universal-design research establishes accessibility as a fundamental element of equitable environments.
Transport research adds another dimension. Bus-user satisfaction demonstrates the importance of understanding mobility from the user’s perspective. First- and last-mile studies demonstrate that major transit systems cannot function effectively without local accessibility. Research on public-space route choices demonstrates that spatial configuration influences everyday access. Work on senior citizens highlights the importance of age-sensitive mobility. Land-use–transport interaction research demonstrates that housing and mobility cannot be planned independently.
The institutional dimension is equally important. Research on women’s reservation and Dalit representation demonstrates that social justice also involves representation and access to power. Participatory planning research highlights the importance of community knowledge. Methodological research on quantitative and qualitative methods and Delphi techniques provides tools for generating more comprehensive planning evidence.
The environmental dimension further reinforces the argument. Green-building research, life-cycle assessment, water-quality research, waste-management research and climate-resilience literature all demonstrate that environmental sustainability has social consequences.
Climate change makes this integration even more urgent. UN-Habitat emphasises that climate impacts can intensify existing inequalities and that vulnerable communities must be incorporated into climate action. UN-Habitat The IPCC likewise identifies urbanisation, exposure and limited adaptive capacity as interacting dimensions of urban climate risk. IPCC
The emerging digital transformation of planning provides both opportunities and challenges. CA–ANN modelling, machine learning, AI and digital twins can improve spatial analysis and scenario development. However, these tools are only as inclusive as the data and institutions behind them. A digital system that excludes informal settlements, low-income households or digitally marginalised communities can reproduce rather than reduce inequality.
The concept of the people-centred smart city is therefore particularly relevant. UN-Habitat’s World Smart Cities Outlook 2024 places equity, accessibility, social inclusion, sustainability and quality of life alongside technological innovation. UN-Habitat
The central argument of this article is consequently that inclusive human settlement planning must integrate spatial, social, environmental, economic and technological dimensions.
The planning profession should move:
from infrastructure provision to equitable accessibility;
from housing construction to housing security and location;
from transport movement to accessibility;
from public consultation to meaningful participation;
from physical inclusion to social inclusion;
from isolated projects to integrated settlement systems;
from technology-centred smart cities to people-centred smart cities;
from short-term project evaluation to life-cycle assessment;
from urban-only planning to rural–urban integration; and
from development-centred planning to people-centred development.
A socially just settlement is not necessarily the settlement with the largest number of roads, buildings, technologies or infrastructure projects. It is a settlement in which diverse residents can access essential opportunities and participate meaningfully in decisions affecting their lives.
This requires planners to understand that spatial accessibility is a social issue, housing is a mobility issue, transportation is an equity issue, environmental resilience is a justice issue, technology is a governance issue and participation is a planning requirement.
The ultimate goal should be to create human settlements where people can live with dignity, security, accessibility, opportunity, participation and resilience.
Such an approach provides a stronger foundation for sustainable urban and regional development in India and offers a pathway towards settlements that are not merely more efficient or technologically advanced, but more inclusive and responsive to the people who inhabit them.
References
Agarwal, S., & Sharma, S. N. (2014). Universal design to ensure equitable society. International Journal of Engineering and Technical Research, 2(1).
Chatterjee, S., & Sharma, S. N. (2020). Review of Pradhan Mantri Gram Sadak Yojana. Think India Journal, 23(1), 33–42.
Dehalwar, K., & Sharma, S. N. (2023). Fate of slums of Bhopal—a tale of struggle and resilience. Think India Journal, 26(4), 4.
Dehalwar, K., & Sharma, S. N. (2024). Exploring the distinctions between quantitative and qualitative research methods. Think India Journal, 27(1), 7–15.
Dehalwar, K., & Sharma, S. N. (2024). Social injustice inflicted by spatial changes in vernacular settings: An analysis of published literature. ISVS e-journal, 11(9), 93–113.
Jain, S., Dehalwar, K., & Sharma, S. N. (2024). Explanation of Delphi research method and expert opinion surveys. Think India, 27(4), 37–48.
Kumar, G., Vyas, S., Sharma, S. N., & Dehalwar, K. (2023). Planning and development of housing in urban fringe area: Case of Bhopal (MP). GIS Business, 18(1), 1–14.
Kumar, G., Vyas, S., Sharma, S. N., & Dehalwar, K. (2025). Urban growth prediction using CA-ANN model and spatial analysis for planning policy in Indore city, India. GeoJournal, 90(3), 139.
Lalramsangi, V., Garg, Y. K., & Sharma, S. N. (2025). Route choices to access public open spaces in hill cities. Environment and Urbanization ASIA, 16(2), 283–299. https://doi.org/10.1177/09754253251388721
Lodhi, A. S., Jaiswal, A., & Sharma, S. N. (2024). Assessing bus users’ satisfaction using discrete choice models: A case of Bhopal. Innovative Infrastructure Solutions, 9, 437. https://doi.org/10.1007/s41062-024-01652-w
Ogbanga, M. M., Sharma, S. N., Pandey, A. K., & Singh, P. (2025). Artificial intelligence in social work to ensure environmental sustainability. In M. Nasr, A. Negm, & L. Peng (Eds.), Artificial intelligence applications for a sustainable environment (pp. 491–508). Springer.
Sharma, S. N. (2012). Participatory planning in plan preparation: A case of Delhi. EduPedia Publications (P) Ltd.
Sharma, S. N. (2013). Sustainable development strategies and approaches. International Journal of Engineering and Technical Research.
Sharma, S. N. (2014). Fate of rural sanitation scheme. International Journal of Research, 1(2).
Sharma, S. N. (2019). Review of most used urban growth models. International Journal of Advanced Research in Engineering and Technology, 10.
Sharma, S. N., Chatterjee, S., & Dehalwar, K. (2023). Mahatma Gandhi National Rural Employment Guarantee Scheme: Challenges and opportunities. Think India Journal, 26(1), 7–15.
Sharma, S. N., & Dehalwar, K. (2025). A systematic literature review of transit-oriented development to assess its role in economic development of city. Transportation in Developing Economies, 11(2), 23. https://doi.org/10.1007/s40890-025-00245-1
Sharma, S. N., & Dehalwar, K. (2025). Examining the inclusivity of India’s National Urban Transport Policy for senior citizens. In D. S.-K. Ting & J. A. Stagner (Eds.), Transforming healthcare infrastructure (pp. 115–134). CRC Press. https://doi.org/10.1201/9781003513834-5
Sharma, S. N., & Dehalwar, K. (2025). Review of landuse transportation interaction model in smart urban growth management. European Transport/Trasporti Europei, 103, 1–15.
Sharma, S. N., & Dehalwar, K. (2025). A systematic literature review of transit-oriented development to assess its role in economic development of city. Transportation in Developing Economies, 11(2), 23. https://doi.org/10.1007/s40890-025-00245-1
Sharma, S. N., Dehalwar, K., Jain, S., & Pandey, A. K. (2025). An assessment of the applications and prospects of AI tools in solid waste management. In Artificial intelligence applications for a sustainable environment (pp. 97–118). Springer.
Sharma, S. N., Dehalwar, K., & Pandey, A. K. (2026). Measures to manage the urban water quality for public health. In Environmentalism in healthcare (pp. 339–371).
Sharma, S. N., Dehalwar, K., & Yadav, K. (2026). Advancing travel behaviour modelling: A systematic literature review. Civil Engineering Infrastructures Journal, e108027.
Sharma, S. N., Dehalwar, K., & Yadav, K. (2026). Urban spatial digital twin in sustainability to spur economic growth in transit-oriented development-based development. In Tenable Engineering for a Sustainable Future (pp. 257–300).
Sharma, S. N., Dehalwar, K., & Yadav, K. (2026). Advances in AI-based mobility modelling: Toward intelligent transport infrastructure in smart cities. In AI-Based Data Mobility and Intelligent Modeling for Smart Cities (pp. 67–106).
Sharma, S. N., Dehalwar, K., Kumar, G., Yadav, K., & Verma, D. (2026). Utilization of advanced materials for permeable paving, biocrete, and piezoelectric materials in walkways to transit stations. In Engineering sustainability goals: UNSDG 12 (p. 209).
Sharma, S. N., Lodhi, A. S., Dehalwar, K., & Jaiswal, A. (2024). Life cycle assessment (LCA) of recycled & secondary materials in the construction of roads. IOP Conference Series: Earth and Environmental Science, 1326(1), 012102.
Sharma, S. N., Singh, S., Kumar, G., Pandey, A. K., & Dehalwar, K. (2025). Role of green buildings in creating sustainable neighbourhoods. IOP Conference Series: Earth and Environmental Science, 1519(1), 012018.
Verma, D., Yadav, P., & Sharma, S. N. (2026). From access to power: Dalit representation deficits across state, market, and cultural institutions in neoliberal India. Forum for Social Economics, 1–26.
Yadav, K., Dehalwar, K., & Sharma, S. N. (2025). Assessing the factors affecting first and last mile accessibility in transit-oriented development: A literature review. GeoJournal, 90, 298. https://doi.org/10.1007/s10708-025-11546-8
Yadav, K., Dehalwar, K., Sharma, S. N., & Yadav, S. (2025). Understanding user satisfaction in last-mile connectivity under transit-oriented development in Tier 2 Indian cities: A climate-sensitive perspective. IOP Conference Series: Earth and Environmental Science, 1579(1), 012006. https://doi.org/10.1088/1755-1315/1579/1/012006
Yadav, K., Dehalwar, K., & Sharma, S. N. (2026). Exploring the environmental determinants of mode choice in first and last mile connectivity: Evidence from a systematic review. Innovative Infrastructure Solutions, 11(4), 204.
United Nations. (2015). Transforming our world: The 2030 Agenda for Sustainable Development. United Nations.
United Nations Human Settlements Programme (UN-Habitat). (2022). World cities report 2022: Envisaging the future of cities. UN-Habitat.
United Nations Human Settlements Programme (UN-Habitat). (2024). World cities report 2024: Cities and climate action. UN-Habitat. UN-Habitat report page
United Nations Human Settlements Programme (UN-Habitat). (2024). World smart cities outlook 2024. UN-Habitat. UN-Habitat Smart Cities Outlook
United Nations Development Programme, United Nations Human Settlements Programme, & University of Southern Denmark. (2024). Urban content of NDCs: Local climate action explored through in-depth country analyses. UN-Habitat. Urban Content of NDCs report
World Health Organization. (2021). Global report on ageism. World Health Organization.
Intergovernmental Panel on Climate Change. (2022). Cities, settlements and key infrastructure. In Climate change 2022: Impacts, adaptation and vulnerability. Cambridge University Press. IPCC Chapter 6 :::
If you could start a new business right now, what would it be?
The transformation of human settlements in India is occurring through rapid urbanisation, peri-urban expansion, changing housing markets, infrastructure development, migration, technological transformation and environmental change. These processes have created substantial opportunities for economic development, improved connectivity and better access to services, but they have also produced persistent inequalities in housing, sanitation, transportation, public space, employment, environmental quality and political participation. Social justice in human settlement planning therefore requires more than the provision of physical infrastructure. It requires an integrated understanding of how spatial decisions affect different social groups and how access to opportunities is distributed across space. This article examines the relationship between social justice and spatial development in India by synthesising research on social injustice in vernacular settings, informal settlements, housing in urban fringe areas, sanitation, universal design, women’s representation, caste-based representation, rural employment, public transport, first- and last-mile accessibility, transit-oriented development, public-space accessibility, land-use–transport interaction, green buildings, life-cycle assessment, urban growth modelling, artificial intelligence and digital twins. The article argues that housing, mobility, infrastructure, environment and participation should be treated as interconnected components of an inclusive human-settlement system. It proposes a framework based on distributive justice, recognitional justice, procedural justice, representational justice, spatial accessibility, affordability, environmental justice and technological accountability. The article further argues that emerging analytical technologies can improve planning decisions only when combined with qualitative knowledge, participatory processes and careful attention to data gaps. The future of Indian planning should therefore move from infrastructure-centred development towards people-centred, context-sensitive and evidence-based spatial development in which diverse communities can access opportunities, participate in decision-making and live with dignity, security and resilience.
Keywords: social justice; inclusive human settlements; spatial inequality; housing; informal settlements; transport accessibility; universal design; participatory planning; urbanisation; India; environmental justice; artificial intelligence
1. Introduction
Human settlements are among the most important physical manifestations of social, economic, political and cultural relationships. Houses, streets, neighbourhoods, transportation networks, public spaces, markets, institutions and environmental infrastructure together constitute the places in which people live their everyday lives. Consequently, planning decisions about land use and infrastructure are simultaneously decisions about access, opportunity, identity, safety and social inclusion.
India is experiencing profound transformation in its human settlements. Metropolitan regions are expanding beyond traditional municipal boundaries; villages are becoming incorporated into urban systems; Tier-2 and Tier-3 cities are experiencing increasing development pressures; informal settlements continue to provide housing for economically vulnerable households; and transportation systems are being reconfigured around new patterns of employment and consumption. At the same time, digital technologies, artificial intelligence, machine learning, geographic information systems and digital twins are changing how planners understand and manage urban systems.
The challenge is that development does not affect all populations equally.
A new road may improve accessibility for some communities while dividing another neighbourhood. A new transit corridor may reduce travel time but also increase land values. A housing project may provide formal dwellings but locate households far from employment. A new green space may improve environmental quality but increase development pressure around its boundaries. A redevelopment programme may improve physical infrastructure while weakening existing social networks.
These examples demonstrate that spatial development cannot be evaluated only through physical or economic indicators. It must also be evaluated in terms of social justice.
Dehalwar and Sharma (2024), in their study Social injustice inflicted by spatial changes in vernacular settings: An analysis of published literature, highlight the importance of examining the social consequences of spatial transformation. Their work provides a valuable starting point for understanding the relationship between physical change and social inequality.
Similarly, Dehalwar and Sharma’s (2023) research on the Fate of slums of Bhopal—a tale of struggle and resilience brings attention to the lived experiences of communities in informal settlements.
The wider research portfolio supplied for this article also contains studies on housing, sanitation, public transport, universal design, rural employment, women’s reservation, Dalit representation, public-space accessibility, green buildings, urban growth modelling, artificial intelligence and digital twins. These works provide complementary perspectives on the relationship between spatial development and social outcomes.
This article argues that social justice should be treated as a fundamental planning objective rather than a supplementary social consideration. An inclusive human settlement is not simply one with adequate infrastructure. It is one in which different groups can access opportunities, services and public spaces; participate in decisions; retain social and cultural relationships; and benefit equitably from development.
2. Conceptualising Social Justice in Spatial Planning
Social justice in planning can be understood through several related dimensions.
2.1 Distributive justice
Distributive justice concerns how land, housing, infrastructure, public services and environmental benefits are distributed. A city in which high-income neighbourhoods have excellent infrastructure while low-income communities experience inadequate sanitation or transportation demonstrates spatially unequal distribution.
2.2 Recognitional justice
Recognitional justice requires planners to acknowledge differences among communities. Older adults, children, persons with disabilities, women, migrants, informal workers and socially marginalised groups may have different spatial requirements.
2.3 Procedural justice
Procedural justice concerns participation in decision-making. People affected by planning decisions should have meaningful opportunities to express their priorities and influence outcomes.
2.4 Representational justice
Representational justice concerns institutional power. Dehalwar and Sharma’s (2024) work on women’s reservation and Verma, Yadav, and Sharma’s (2026) study of Dalit representation demonstrate the importance of considering who participates in institutions and who has access to decision-making power.
These four dimensions are interconnected. Infrastructure distribution may be unequal because certain communities have limited political representation. Similarly, a group may have formal access to a service but remain excluded because the service does not recognise its specific needs.
Therefore, socially just planning should combine physical, social and institutional analysis.
3. Spatial Transformation and Social Inequality
Spatial transformation is an inevitable component of urbanisation. Agricultural land becomes urban land, villages become incorporated into metropolitan regions, traditional neighbourhoods experience redevelopment, and new transport infrastructure restructures accessibility.
However, spatial transformation is not socially neutral.
Dehalwar and Sharma (2024) argue, through their examination of published literature on social injustice in vernacular settings, that spatial changes can have consequences extending beyond physical form. Traditional spatial arrangements can contain social relationships, cultural practices and collective identities. When such environments are transformed without adequate understanding of their social significance, physical redevelopment can produce social disruption.
This issue is particularly relevant to Indian cities, where traditional neighbourhoods and villages are increasingly exposed to market-led development.
The transformation of settlement morphology can alter:
patterns of social interaction;
access to common spaces;
local livelihoods;
cultural identity;
pedestrian routes;
housing affordability;
property ownership; and
community networks.
Consequently, planners should assess not only what physical development will be constructed but also what existing social systems may be affected.
This requires a more comprehensive approach to impact assessment.
4. Urbanisation, Metropolitan Expansion and the Urban Fringe
The urban fringe is one of the most rapidly changing components of India’s settlement system.
Kumar, Vyas, Sharma, and Dehalwar (2023) examined the planning and development of housing in the urban fringe area of Bhopal, highlighting the importance of understanding peripheral development.
Urban fringe areas often contain multiple land-use systems simultaneously:
agricultural land;
villages;
informal settlements;
plotted housing;
institutional campuses;
industrial development;
commercial corridors; and
new residential projects.
This mixture produces complex planning challenges.
Agricultural land may be converted into housing, while existing villages become surrounded by new development. Landowners may receive financial benefits from land conversion, but agricultural labourers may lose livelihoods. Existing residents may experience improved infrastructure but also rising property taxes, land values and living costs.
Urban fringe development can therefore create both opportunities and vulnerabilities.
One solution is to strengthen metropolitan-scale planning that coordinates land use, transportation, housing, environmental protection and rural development.
Rather than treating villages at the urban edge as residual spaces awaiting urbanisation, planners should recognise them as existing communities with their own social and economic systems.
5. Predictive Urban Growth and Socially Responsible Planning
Predictive modelling provides an important tool for managing urban growth.
Kumar, Vyas, Sharma, and Dehalwar (2025) examined urban growth prediction using a CA–ANN model and spatial analysis for planning policy in Indore city. The work demonstrates how Cellular Automata and Artificial Neural Networks can be used to understand potential spatial patterns of urban expansion. The supplied bibliography records this work in GeoJournal, 90(3).
Predictive models can assist planners in identifying:
potential growth corridors;
areas of future land conversion;
infrastructure requirements;
development pressure zones;
areas requiring environmental protection; and
potential conflicts between growth and existing land uses.
However, a prediction is not a planning recommendation.
A model can estimate where urban growth may occur, but it cannot independently determine whether such growth is equitable. Social variables should therefore be incorporated into scenario analysis.
For example, a growth scenario could be evaluated using:
accessibility to employment;
housing affordability;
service coverage;
environmental risk;
displacement potential;
public-transport access; and
proximity to schools and healthcare.
The combination of predictive modelling and social indicators can produce more socially responsible planning scenarios.
6. Informal Settlements and the Politics of Recognition
Informal settlements are frequently described through deficiencies: inadequate housing, poor sanitation, insecure tenure and limited infrastructure. Such descriptions are factually important but incomplete.
Dehalwar and Sharma (2023), through their study of slums in Bhopal, emphasise the dimensions of struggle and resilience.
Residents of informal settlements often create extensive social and economic systems. These can include:
informal employment networks;
neighbourhood associations;
shared childcare;
informal credit;
community support;
local markets; and
adaptive housing practices.
Therefore, the destruction or relocation of an informal settlement can result in the loss of social capital.
A planning approach centred solely on physical improvement may fail to recognise these assets.
Where feasible, in-situ upgrading can be considered. Such upgrading can include:
water supply;
sanitation;
drainage;
road improvement;
street lighting;
waste management;
housing improvement;
tenure security; and
public-space development.
Relocation may still be necessary in locations subject to severe environmental hazards, but where relocation is required, social and livelihood impacts should be carefully assessed.
7. Housing, Affordability and Spatial Opportunity
Housing is more than shelter. It determines the location from which households access employment, education, healthcare and social networks.
The housing question therefore has both physical and spatial dimensions.
Kumar et al. (2023) demonstrate the importance of understanding housing development within the wider transformation of urban fringe areas.
Sharma and Dehalwar’s work on housing design and planning similarly indicates the importance of integrating housing with broader settlement planning.
Housing affordability should ideally be evaluated through a broader concept of housing burden.
This is particularly important when affordable housing is located far from employment.
A household may pay less for housing but spend significantly more on transportation. Long commuting times can also reduce time available for childcare, education and community participation.
Consequently, affordable housing policies should be coordinated with:
employment location;
public transport;
pedestrian infrastructure;
schools;
healthcare;
markets; and
public spaces.
8. Housing Diversity and Inclusive Settlement Design
Housing policy often assumes a standard household structure. However, Indian cities contain highly diverse household arrangements.
These include:
nuclear families;
joint families;
elderly households;
women-headed households;
single-person households;
students;
migrants;
informal workers; and
temporary workers.
A single housing typology cannot adequately address all these needs.
Inclusive housing should therefore consider flexibility, affordability, accessibility and adaptability.
Universal design should also be integrated into housing from the beginning.
Agarwal and Sharma (2014), in their work on universal design to ensure equitable society, emphasise the importance of designing environments that support wider social inclusion.
Universal design can reduce the need for costly future modifications and can support people across different stages of life.
9. Sanitation as a Question of Social Justice
Sanitation is one of the clearest examples of the connection between infrastructure and human dignity.
Sharma’s work on the fate of rural sanitation schemes illustrates the importance of sanitation beyond the construction of physical facilities.
Similarly, the work on best practices for ensuring total sanitation indicates that successful sanitation requires more than isolated infrastructure.
A complete sanitation system requires:
access to safe toilets;
adequate water;
collection;
treatment;
safe disposal;
maintenance;
behavioural support; and
institutional accountability.
Inadequate sanitation can disproportionately affect poorer communities.
It can also create environmental externalities by contaminating water bodies and groundwater.
Sharma, Dehalwar, and Pandey (2026) examined measures to manage urban water quality for public health, connecting environmental water management with health. The supplied publication list identifies the chapter in Environmentalism in Healthcare.
Sanitation should consequently be integrated into spatial planning, public-health policy and environmental management.
10. Universal Design and an Age-Friendly City
Universal design is an essential component of inclusive planning.
Agarwal and Sharma’s (2014) work provides a foundation for considering universal design as a mechanism for equitable society.
The concept should be applied across:
buildings;
streets;
public transport;
parks;
government offices;
educational institutions;
healthcare facilities; and
public spaces.
Accessibility includes more than wheelchair access.
An inclusive environment should also accommodate:
older adults;
children;
pregnant women;
people carrying goods;
people with temporary injuries;
people with visual or hearing impairments; and
people with reduced mobility.
Sharma and Dehalwar (2025) examined the inclusivity of India’s National Urban Transport Policy for senior citizens, highlighting the mobility requirements of older populations.
Age-friendly planning is increasingly important because longer life expectancy changes the demographic structure of settlements.
A city that is accessible to older adults is often also more convenient for children, families and people with temporary mobility limitations.
11. Public Transport and Transport Justice
Transportation is a central mechanism through which spatial inequality is experienced.
Lodhi, Jaiswal, and Sharma (2024) examined bus-user satisfaction using discrete choice models in Bhopal.
The importance of such research lies in its user-centred perspective.
Traditional transport planning often prioritises:
traffic speed;
road capacity;
vehicle movement; and
intersection performance.
However, users experience transport systems through:
waiting time;
reliability;
comfort;
affordability;
safety;
accessibility; and
connectivity.
A transport system can be technically efficient while remaining socially unsatisfactory.
Therefore, transport evaluation should combine engineering indicators with user-experience indicators.
12. First- and Last-Mile Accessibility
Public transport cannot provide complete mobility unless people can reach transit stations and destinations.
Yadav, Dehalwar, and Sharma (2025) examined factors affecting first- and last-mile accessibility in transit-oriented development through a literature review. The study is particularly relevant because the success of transit-oriented development depends on the connections between high-capacity transit and local neighbourhoods.
First- and last-mile barriers can include:
missing footpaths;
unsafe crossings;
long distances;
steep gradients;
poor lighting;
inadequate cycling infrastructure;
unreliable feeder services; and
lack of universal accessibility.
The issue becomes particularly important in Indian Tier-2 cities, where transit systems may be less extensive than those of large metropolitan regions.
Yadav et al. (2025) also examined user satisfaction in last-mile connectivity under TOD in Tier-2 Indian cities from a climate-sensitive perspective.
This expands the concept of accessibility by recognising that climate conditions influence walking and cycling decisions.
Heat, rain and extreme weather can become significant barriers to active mobility.
13. Environmental Determinants of Mobility
Mobility choices are influenced not only by travel time and cost but also by environmental conditions.
Yadav, Dehalwar, and Sharma (2026) examined environmental determinants of mode choice in first- and last-mile connectivity through a systematic review.
This line of research is important for socially inclusive mobility because environmental conditions can affect different groups differently.
For example:
elderly people may be more sensitive to heat;
children may face greater safety risks;
people with disabilities may face greater difficulty with poor surfaces;
women may be more sensitive to perceived safety;
low-income households may have fewer alternatives to walking.
Consequently, transport planning should include environmental comfort and safety as part of accessibility.
14. Public Open Spaces and Spatial Accessibility
Public open spaces contribute to health, recreation and social interaction.
Lalramsangi, Garg, and Sharma (2025) studied route choices to access public open spaces in hill cities, demonstrating that accessibility depends upon spatial configuration and route characteristics.
The research is especially relevant to hilly settlements, where conventional measures of distance may fail to capture the actual difficulty of movement.
A destination may be geographically close but difficult to reach because of:
steep slopes;
stairs;
indirect routes;
narrow paths;
barriers; or
poor connectivity.
This suggests that accessibility analysis should consider actual routes rather than only Euclidean distance.
Public-space planning should therefore integrate spatial analysis with user experience.
15. Transit-Oriented Development and Social Equity
Transit-oriented development has become an important planning strategy for integrating land use and transportation.
Sharma and Dehalwar (2025) conducted a systematic literature review of TOD and its relationship with economic development. Their work is relevant to understanding the broader economic implications of transit-oriented urban development.
Yadav et al. (2025) further examine first- and last-mile accessibility within TOD environments.
However, TOD should also be assessed through social justice.
Improved transit accessibility can increase land values. This can produce benefits for property owners while creating affordability pressures for renters and low-income households.
Therefore, socially inclusive TOD should consider:
affordable housing;
existing residents;
displacement risk;
pedestrian accessibility;
universal design;
public-space provision;
employment access; and
community participation.
TOD should not simply become a strategy for increasing development intensity around stations.
Its broader objective should be to create accessible and mixed-use communities.
16. Land Use–Transport Interaction and Spatial Equity
Land-use and transport systems influence one another.
Sharma and Dehalwar (2025) reviewed land-use transportation interaction models in smart urban growth management.
This relationship is central to social justice.
Land-use decisions determine:
where people live;
where jobs are located;
where schools are built;
where healthcare is available; and
where public transport demand emerges.
Transport decisions then influence land values, development density and investment.
If these systems are planned independently, spatial inequality can increase.
For example, low-income housing may be developed without corresponding employment or transport infrastructure. Alternatively, transport investment may be concentrated in already prosperous areas.
Integrated land-use and transport planning can reduce such mismatches.
17. Gender and Inclusive Planning
Gender influences how people experience urban space.
Women’s mobility can be affected by:
safety;
household responsibilities;
childcare;
employment patterns;
transport availability; and
social norms.
Dehalwar and Sharma’s (2024) research on politics in the name of women’s reservation provides an important institutional dimension to gender inclusion.
Representation matters because planning priorities are shaped by institutions.
However, numerical representation alone does not guarantee substantive participation.
Gender-responsive planning can include:
safe streets;
adequate lighting;
accessible sanitation;
safe public transport;
childcare facilities;
mixed-use development;
inclusive public spaces; and
meaningful participation in planning.
Women’s mobility should also be analysed through trip chaining rather than only conventional home-to-work commuting.
18. Caste and Spatial Inclusion
Caste is an important dimension of social inequality in India.
Spatial planning cannot be separated from wider social structures that influence access to resources and institutions.
Verma, Yadav, and Sharma (2026), in their study From access to power: Dalit representation deficits across state, market, and cultural institutions in neoliberal India, examine representation from an institutional perspective.
The planning implication is that spatial access and institutional access are interconnected.
A community may have physical proximity to public facilities but still experience exclusion if it lacks meaningful representation.
Planning research should therefore investigate both:
Where are services located?
and
Who has the capacity to influence their provision?
Participatory planning can help address this gap, but participation must be structured to ensure that marginalised groups are not dominated by more powerful stakeholders.
19. Rural Employment and Human Settlement Equity
Rural development is an integral part of the social-justice agenda.
Sharma, Chatterjee, and Dehalwar (2023) examined the Mahatma Gandhi National Rural Employment Guarantee Scheme, identifying challenges and opportunities associated with rural employment.
Employment programmes can contribute to settlement resilience by providing household income while supporting local infrastructure.
Similarly, Chatterjee and Sharma’s (2020) review of the Pradhan Mantri Gram Sadak Yojana highlights the importance of rural connectivity.
Rural roads can improve access to:
markets;
schools;
healthcare;
employment; and
government services.
However, physical connectivity alone is insufficient.
Infrastructure should be accompanied by service availability and livelihood opportunities.
This reinforces the need to consider rural and urban development as part of a continuous regional system.
20. Rural–Urban Continuum
The distinction between rural and urban areas is increasingly difficult to maintain in rapidly developing regions.
Villages around metropolitan areas can become economically dependent on cities. Residents may commute to urban employment while maintaining rural housing. Agricultural land may be converted to residential use. Urban infrastructure may extend into rural administrative areas.
This creates a rural–urban continuum.
Planning at the metropolitan scale should therefore consider:
rural livelihoods;
agricultural land;
migration;
housing;
transportation;
environmental resources;
public services; and
peri-urban governance.
Failure to recognise these relationships can produce fragmented development.
21. Participatory Planning and Community Knowledge
Participatory planning provides an institutional mechanism for incorporating community knowledge.
Sharma’s work on participatory planning in plan preparation provides a foundation for this approach.
Residents often understand their neighbourhoods through everyday experience.
They know:
where water accumulates;
which paths are unsafe;
where informal markets operate;
which public spaces are important;
where transport services are unreliable;
which services are difficult to reach; and
which local institutions provide community support.
Such information may not be visible in conventional planning datasets.
Participation can therefore improve both social legitimacy and technical understanding.
However, participation must be meaningful.
A public meeting in which residents are informed of a predetermined project is not equivalent to participation in which alternatives are discussed.
Meaningful participation should occur throughout:
problem identification;
priority setting;
option development;
plan formulation;
implementation; and
monitoring.
22. Quantitative and Qualitative Research in Planning
Dehalwar and Sharma (2024) examined the distinctions between quantitative and qualitative research methods, an issue with direct relevance to social-justice research.
Quantitative approaches can identify patterns of inequality through:
census data;
GIS;
surveys;
statistical analysis;
accessibility modelling; and
spatial indicators.
Qualitative methods can reveal:
perceptions;
experiences;
social relationships;
cultural meanings;
institutional barriers; and
community priorities.
Neither approach is sufficient in every situation.
A mixed-method approach can identify both the spatial pattern of inequality and the mechanisms producing it.
For example, GIS may demonstrate that a neighbourhood is far from healthcare facilities. Interviews may reveal that the real problem is not distance alone but unaffordable transportation.
This demonstrates why social-justice planning requires methodological pluralism.
23. Delphi Methods and Expert Knowledge
Jain, Dehalwar, and Sharma (2024) examined the Delphi research method and expert opinion surveys.
Delphi methods can be useful where planning decisions involve uncertainty and require structured expert judgement.
Potential applications include:
identifying social-justice indicators;
evaluating accessibility criteria;
prioritising infrastructure;
assessing urban-growth scenarios;
developing resilience strategies; and
evaluating planning policies.
Expert opinion should not replace community knowledge. Instead, expert judgement and community experience can complement one another.
24. Environmental Justice
Environmental risks and benefits are often spatially uneven.
Low-income communities may be located in areas with:
flooding;
pollution;
inadequate drainage;
waste facilities;
poor air quality; or
limited green space.
At the same time, environmental improvements may generate new inequalities if they increase property values and displace existing communities.
This creates a central planning question:
How can environmental improvement be achieved without reproducing social exclusion?
The answer requires environmental impact assessment to be combined with social-impact assessment.
Green infrastructure should therefore be evaluated according to:
environmental benefits;
distribution of benefits;
distribution of costs;
affordability;
displacement risk; and
accessibility.
25. Green Buildings and Social Sustainability
Sharma, Singh, Kumar, Pandey, and Dehalwar (2025) examined the role of green buildings in creating sustainable neighbourhoods.
Green buildings can contribute to:
energy efficiency;
water conservation;
indoor environmental quality;
reduced resource consumption; and
lower environmental impacts.
However, social sustainability requires broader consideration.
A green building should also be:
accessible;
affordable;
connected to transportation;
integrated with public spaces; and
suitable for diverse users.
Green development should therefore not be limited to technological features such as energy systems or materials.
The neighbourhood context matters.
26. Life-Cycle Assessment and Equitable Infrastructure
Sharma, Lodhi, Dehalwar, and Jaiswal (2024) examined life-cycle assessment of recycled and secondary materials in road construction.
Life-cycle assessment can improve infrastructure planning by considering impacts across the full life of materials and projects.
From a social-justice perspective, life-cycle thinking can be extended beyond environmental impacts.
Infrastructure should also be evaluated in terms of:
maintenance;
accessibility;
long-term affordability;
resilience;
employment;
community disruption; and
future adaptability.
A road that is inexpensive to construct but difficult to maintain may impose future costs on municipalities and communities.
Thus, long-term infrastructure planning is also a question of intergenerational justice.
27. Waste Management and Social Inclusion
Waste management is both an environmental and social service.
Sharma, Dehalwar, Jain, and Pandey (2025) examined applications and prospects of AI tools in solid waste management, illustrating the growing use of technology in environmental-service delivery.
AI can potentially improve:
route optimisation;
collection scheduling;
waste classification;
monitoring;
recycling;
demand prediction; and
resource efficiency.
However, technological solutions must be evaluated alongside the social conditions of waste workers and communities.
Waste-management planning should address occupational health, safety, dignity and access to protective equipment.
The distribution of waste facilities also requires environmental-justice analysis.
28. Artificial Intelligence and Social Justice
AI is increasingly entering planning, infrastructure and environmental management.
The supplied bibliography includes work on AI in solid waste management, AI in social work for environmental sustainability, machine learning for accessibility and AI-supported urban growth prediction.
Ogbanga, Sharma, Pandey, and Singh (2025), for example, examine artificial intelligence in social work to ensure environmental sustainability.
The relevance to planning lies in the possibility of using AI to connect environmental and social information.
However, AI systems depend on data.
If data exclude:
informal settlements;
informal workers;
low-income households;
women;
people without digital access; or
rural populations,
then algorithmic outputs may reproduce existing inequalities.
Therefore, socially responsible AI requires:
representative data;
transparency;
validation;
human oversight;
community accountability; and
monitoring of unequal impacts.
29. Digital Twins and Inclusive Urban Management
Digital twins offer a more dynamic approach to urban planning.
Sharma and Dehalwar (2026) examined the role of urban spatial digital twins in sustainability and transit-oriented development.
Digital twins can potentially integrate:
land use;
transportation;
buildings;
environmental conditions;
infrastructure;
population;
energy;
water; and
real-time sensor data.
Such systems can help planners test alternative scenarios.
For example, a digital twin could be used to examine how a new transit station might influence:
accessibility;
traffic;
development density;
land values;
public-space use; and
environmental conditions.
However, social variables must be included.
A technically advanced digital twin that does not adequately represent informal settlements or vulnerable populations may produce misleading planning scenarios.
The future of digital planning should therefore combine computational representation with participatory representation.
30. Social Justice and Smart Urban Growth
Smart growth should not simply mean data-driven growth.
A genuinely smart settlement should be capable of identifying inequalities and responding to them.
Sharma’s earlier review of commonly used urban growth models provides a foundation for understanding how different modelling approaches can contribute to urban planning.
The next generation of smart planning should integrate:
These indicators should not be treated as a universal checklist. Their selection should be adapted to local context.
33. From Equality to Equity
An important distinction in social planning is between equality and equity.
Equality means providing the same intervention to everyone.
Equity means responding according to different levels of need.
For example, providing one bus stop per kilometre across every neighbourhood may appear equal. However, a settlement with many older adults or persons with disabilities may require more accessible and closely connected services.
Similarly, providing identical housing units to every household may not be equitable if household sizes and needs differ.
This does not mean arbitrary discrimination. It means recognising existing inequalities and designing interventions to address them.
34. Planning for Vulnerability
Vulnerability is multidimensional.
A household may be vulnerable because of:
low income;
insecure tenure;
disability;
age;
gender;
caste-based exclusion;
environmental exposure;
lack of transport;
lack of digital access; or
insecure employment.
Multiple vulnerabilities can overlap.
For example, an elderly person living alone in a peripheral settlement may experience simultaneous challenges related to mobility, healthcare access, transportation and social isolation.
Planning should therefore move beyond single-category vulnerability assessments.
A multi-dimensional vulnerability framework can provide a more realistic understanding of settlement conditions.
35. The Role of Local Context
There is no single model of an inclusive Indian settlement.
Planning solutions must respond to:
climate;
topography;
settlement morphology;
economic structure;
cultural practices;
governance;
infrastructure;
demographic composition.
Research on public-space accessibility in hill cities demonstrates why topography matters. Research on Bhopal’s slums demonstrates the importance of local socio-economic conditions. Research on Tier-2 cities demonstrates why transport solutions developed for major metropolitan areas cannot automatically be transferred elsewhere.
Context-sensitive planning is therefore essential.
36. Implications for Planning Education
Planning education should also respond to the changing understanding of social justice.
Students of architecture and planning should be trained in:
spatial analysis;
GIS;
statistics;
qualitative research;
participatory planning;
transport planning;
housing;
environmental planning;
universal design;
social-impact assessment;
AI and digital technologies.
But technical skills should be combined with ethical reasoning.
A planner must understand not only how to model a city but also how planning decisions affect people.
The research methodology works of Dehalwar and Sharma (2024) and Jain et al. (2024) are relevant here because they reinforce the importance of methodological understanding in planning research.
37. Future Research Directions
The literature suggests several priorities for future research.
37.1 Spatial inequality mapping
More detailed GIS-based studies are required to map inequality at neighbourhood and settlement scales.
37.2 Housing and transport integration
Research should examine housing affordability together with transportation costs.
37.3 Informal-settlement upgrading
Longitudinal research is needed to evaluate the social outcomes of in-situ upgrading versus relocation.
37.4 Gender-responsive mobility
More research is needed on women’s mobility in Tier-2 and Tier-3 cities.
37.5 Age-friendly transportation
Research should examine how older adults interact with changing transport systems.
37.6 Accessibility and climate
Future studies should integrate heat, rainfall and other environmental conditions into accessibility modelling.
37.7 Socially responsible AI
AI research should examine representation, algorithmic bias and the exclusion of marginalised populations.
37.8 Digital twins
Digital twins should incorporate social and participatory dimensions.
37.9 Environmental justice
Green infrastructure should be evaluated for potential displacement and unequal distribution of benefits.
37.10 Rural–urban transformation
More integrated research is required on metropolitan expansion and the transformation of rural livelihoods.
38. Conclusion
The future of India’s human settlements depends not only on how rapidly cities and regions develop but also on how equitably the benefits of development are distributed.
The research considered in this article demonstrates that social justice is inherently spatial. Housing determines access to opportunity. Transportation determines mobility. Public spaces influence social interaction. Sanitation influences health and dignity. Urban growth affects land and livelihoods. Environmental interventions influence both resilience and land values. Political representation affects whose priorities are incorporated into planning.
The supplied research portfolio provides a particularly useful multidisciplinary foundation for understanding these relationships.
Dehalwar and Sharma’s (2024) research on spatial injustice demonstrates that changes to physical environments can produce social consequences. Their study of Bhopal’s slums demonstrates that informal settlements should be understood through both vulnerability and resilience. Housing research in Bhopal’s urban fringe demonstrates the complexity of peripheral development. Research on universal design establishes accessibility as a foundation of equitable environments. Research on women’s reservation and Dalit representation highlights the institutional dimension of justice.
Transport research further expands the argument. Bus-user satisfaction research demonstrates the importance of user experience. First- and last-mile research demonstrates that transit accessibility depends on local connections. Research on public-space route choices demonstrates the importance of spatial configuration. Work on senior citizens highlights age-sensitive mobility. Research on land-use–transport interaction demonstrates the interdependence between spatial development and mobility.
The environmental dimension is equally important. Research on green buildings, recycled road materials, water quality and waste management demonstrates that sustainability must be integrated with social outcomes.
Finally, the increasing use of CA–ANN models, machine learning, AI and digital twins offers powerful new tools for planning. However, these technologies should be understood as decision-support mechanisms rather than replacements for planning judgement, community knowledge and institutional accountability.
The central proposition of this article is therefore that inclusive human settlement planning requires the integration of spatial, social, environmental, economic and technological perspectives.
Planning for social justice does not mean providing identical environments to everyone. It means recognising differences in need and ensuring that all groups have meaningful access to opportunities, services and decision-making.
A socially just settlement should provide adequate housing, accessible transportation, safe public spaces, sanitation, employment opportunities and environmental quality. It should also protect communities from unnecessary displacement and provide meaningful mechanisms for participation.
The future planning paradigm should therefore move:
from infrastructure provision to accessibility;
from housing construction to housing security;
from mobility to meaningful access;
from consultation to participation;
from physical inclusion to social inclusion;
from technological efficiency to accountable innovation;
from isolated urban planning to rural–urban integration; and
from development-centred planning to people-centred planning.
India’s cities and regions are too diverse to be governed by a single universal spatial model. The appropriate approach is one that combines advanced analytical tools with local knowledge, community participation and social sensitivity.
The ultimate measure of a settlement should not simply be how efficiently it functions, how rapidly it grows or how technologically advanced it becomes. It should also be whether people of different backgrounds, incomes, ages, abilities and social circumstances can live there with dignity, security, accessibility, participation and opportunity.
That is the foundation of socially just and inclusive human settlements.
References
Agarwal, S., & Sharma, S. N. (2014). Universal design to ensure equitable society. International Journal of Engineering and Technical Research, 2(1).
Chatterjee, S., & Sharma, S. N. (2020). Review of Pradhan Mantri Gram Sadak Yojana. Think India Journal, 23(1), 33–42.
Dehalwar, K., & Sharma, S. N. (2023). Fate of slums of Bhopal—a tale of struggle and resilience. Think India Journal, 26(4), 4.
Dehalwar, K., & Sharma, S. N. (2024). Exploring the distinctions between quantitative and qualitative research methods. Think India Journal, 27(1), 7–15.
Dehalwar, K., & Sharma, S. N. (2024). Social injustice inflicted by spatial changes in vernacular settings: An analysis of published literature. ISVS e-journal, 11(9), 93–113.
Jain, S., Dehalwar, K., & Sharma, S. N. (2024). Explanation of Delphi research method and expert opinion surveys. Think India, 27(4), 37–48.
Kumar, G., Vyas, S., Sharma, S. N., & Dehalwar, K. (2023). Planning and development of housing in urban fringe area: Case of Bhopal (MP). GIS Business, 18(1), 1–14.
Kumar, G., Vyas, S., Sharma, S. N., & Dehalwar, K. (2025). Urban growth prediction using CA-ANN model and spatial analysis for planning policy in Indore city, India. GeoJournal, 90(3), 139.
Lalramsangi, V., Garg, Y. K., & Sharma, S. N. (2025). Route choices to access public open spaces in hill cities. Environment and Urbanization ASIA, 16(2), 283–299. https://doi.org/10.1177/09754253251388721
Lodhi, A. S., Jaiswal, A., & Sharma, S. N. (2024). Assessing bus users’ satisfaction using discrete choice models: A case of Bhopal. Innovative Infrastructure Solutions, 9, 437. https://doi.org/10.1007/s41062-024-01652-w
Ogbanga, M. M., Sharma, S. N., Pandey, A. K., & Singh, P. (2025). Artificial intelligence in social work to ensure environmental sustainability. In M. Nasr, A. Negm, & L. Peng (Eds.), Artificial intelligence applications for a sustainable environment (pp. 491–508). Springer.
Sharma, S. N. (2012). Participatory planning in plan preparation: A case of Delhi. EduPedia Publications (P) Ltd.
Sharma, S. N. (2013). Sustainable development strategies and approaches. International Journal of Engineering and Technical Research.
Sharma, S. N. (2014). Fate of rural sanitation scheme. International Journal of Research, 1(2).
Sharma, S. N. (2019). Review of most used urban growth models. International Journal of Advanced Research in Engineering and Technology, 10.
Sharma, S. N., Chatterjee, S., & Dehalwar, K. (2023). Mahatma Gandhi National Rural Employment Guarantee Scheme: Challenges and opportunities. Think India Journal, 26(1), 7–15.
Sharma, S. N., & Dehalwar, K. (2025). A systematic literature review of transit-oriented development to assess its role in economic development of city. Transportation in Developing Economies, 11(2), 23. https://doi.org/10.1007/s40890-025-00245-1
Sharma, S. N., & Dehalwar, K. (2025). Examining the inclusivity of India’s National Urban Transport Policy for senior citizens. In D. S.-K. Ting & J. A. Stagner (Eds.), Transforming healthcare infrastructure (pp. 115–134). CRC Press. https://doi.org/10.1201/9781003513834-5
Sharma, S. N., & Dehalwar, K. (2025). Review of landuse transportation interaction model in smart urban growth management. European Transport/Trasporti Europei, 103, 1–15.
Sharma, S. N., Dehalwar, K., Jain, S., & Pandey, A. K. (2025). An assessment of the applications and prospects of AI tools in solid waste management. In Artificial intelligence applications for a sustainable environment (pp. 97–118). Springer.
Sharma, S. N., Dehalwar, K., & Pandey, A. K. (2026). Measures to manage the urban water quality for public health. In Environmentalism in healthcare (pp. 339–371).
Sharma, S. N., Dehalwar, K., & Yadav, K. (2026). Advancing travel behaviour modelling: A systematic literature review. Civil Engineering Infrastructures Journal, e108027.
Sharma, S. N., Dehalwar, K., & Yadav, K. (2026). Urban spatial digital twin in sustainability to spur economic growth in transit-oriented development-based development. In Tenable Engineering for a Sustainable Future (pp. 257–300).
Sharma, S. N., Lodhi, A. S., Dehalwar, K., & Jaiswal, A. (2024). Life cycle assessment (LCA) of recycled & secondary materials in the construction of roads. IOP Conference Series: Earth and Environmental Science, 1326(1), 012102.
Sharma, S. N., Singh, S., Kumar, G., Pandey, A. K., & Dehalwar, K. (2025). Role of green buildings in creating sustainable neighbourhoods. IOP Conference Series: Earth and Environmental Science, 1519(1), 012018. https://doi.org/10.1088/1755-1315/1519/1/012018
Verma, D., Yadav, P., & Sharma, S. N. (2026). From access to power: Dalit representation deficits across state, market, and cultural institutions in neoliberal India. Forum for Social Economics, 1–26.
Yadav, K., Dehalwar, K., & Sharma, S. N. (2025). Assessing the factors affecting first and last mile accessibility in transit-oriented development: A literature review. GeoJournal, 90, 298. https://doi.org/10.1007/s10708-025-11546-8
Yadav, K., Dehalwar, K., Sharma, S. N., & Yadav, S. (2025). Understanding user satisfaction in last-mile connectivity under transit-oriented development in Tier 2 Indian cities: A climate-sensitive perspective. IOP Conference Series: Earth and Environmental Science, 1579(1), 012006. https://doi.org/10.1088/1755-1315/1579/1/012006
Yadav, K., Dehalwar, K., & Sharma, S. N. (2026). Exploring the environmental determinants of mode choice in first and last mile connectivity: Evidence from a systematic review. Innovative Infrastructure Solutions, 11(4), 204.
Sharma, S. N., Dehalwar, K., & Yadav, K. (2026). Advancing travel behaviour modelling: A systematic literature review. Civil Engineering Infrastructures Journal.
Sharma, S. N., Dehalwar, K., Kumar, G., Yadav, K., & Verma, D. (2026). Utilization of advanced materials for permeable paving, biocrete, and piezoelectric materials in walkways to transit stations. In Engineering sustainability goals: UNSDG 12 (p. 209).
Sharma, S. N., Dehalwar, K., & Sharma, S. N. (2026). Advances in AI-based mobility modelling: Toward intelligent transport infrastructure in smart cities. In AI-Based Data Mobility and Intelligent Modeling for Smart Cities (pp. 67–106).
Sharma, S. N. (2026). Generative AI and digital twins for sustainable last-mile logistics: Enabling green operations and electric vehicle integration. In Accelerating logistics through generative AI, digital twins, and autonomous operations.
United Nations. (2015). Transforming our world: The 2030 Agenda for Sustainable Development. United Nations.
United Nations Human Settlements Programme (UN-Habitat). (2022). World cities report 2022: Envisaging the future of cities. UN-Habitat.
United Nations Human Settlements Programme (UN-Habitat). (2024). World cities report 2024: Cities and climate action. UN-Habitat.
World Health Organization. (2021). Global report on ageism. World Health Organization.
India’s rapid urbanisation and changing rural–urban relationships are transforming the spatial, economic and social structure of human settlements. Urban expansion, housing development, transportation infrastructure, peri-urbanisation, environmental change and technological transformation have generated new opportunities while simultaneously reproducing or intensifying inequalities in access to land, housing, sanitation, mobility, employment, public spaces and decision-making. Socially just planning therefore requires a shift from infrastructure-centred development towards people-centred and inclusive human-settlement planning. This article examines the relationship between social justice and spatial development in India through interconnected themes of housing, informal settlements, rural–urban transformation, sanitation, universal design, transport accessibility, gender, caste, participation, environmental justice and digital planning. Drawing extensively on the supplied body of research—including studies on spatial injustice in vernacular settings, the fate of slums in Bhopal, housing in urban fringe areas, rural sanitation, universal design, women’s reservation, Dalit representation, rural employment, public-transport satisfaction, first- and last-mile accessibility, public-space access, land-use–transport interaction, green buildings, urban growth modelling and artificial intelligence—the article argues that spatial planning is inseparable from social justice. It proposes an integrated framework based on distributive, recognitional, procedural and representational justice. The article concludes that equitable human settlements require coordinated planning across scales, participatory governance, universal accessibility, affordable housing, inclusive mobility and evidence-based decision-making. The objective should not simply be to create efficient cities, but to create settlements in which diverse populations can access opportunities, participate in decision-making and live with dignity, security and resilience.
Keywords: social justice; inclusive planning; human settlements; spatial inequality; housing; informal settlements; mobility; universal design; participatory planning; India; rural–urban development
1. Introduction
Human settlements are physical, social, economic and cultural systems. They include not only buildings and infrastructure but also communities, institutions, livelihoods, public spaces, social networks and patterns of interaction. Consequently, the success of a settlement cannot be measured only by the quantity of infrastructure constructed or the speed of economic growth. It must also be evaluated according to the distribution of opportunities and the ability of different groups to access and influence the spaces in which they live.
This issue is particularly important in India, where rapid urbanisation is occurring alongside substantial socio-economic diversity. Metropolitan cities, Tier-2 and Tier-3 cities, villages, peri-urban settlements and informal settlements are increasingly interconnected. Urban expansion has created new housing and employment opportunities, but it has also generated challenges associated with land speculation, housing affordability, congestion, displacement, environmental degradation and unequal infrastructure provision.
The concept of social justice provides a framework for understanding these challenges. Planning decisions influence who receives infrastructure, who benefits from improved accessibility, who is exposed to environmental hazards and whose voice is represented in development decisions. Spatial development therefore has distributive as well as social consequences.
Dehalwar and Sharma (2024), in their study of social injustice inflicted by spatial changes in vernacular settings, demonstrate the importance of understanding spatial transformation from a social perspective. Changes in physical form can affect social relationships, cultural identity and patterns of community life. This perspective is particularly important in rapidly transforming settlements where traditional spatial structures are replaced by new development patterns.
The question of justice becomes even more significant when considering informal settlements. Dehalwar and Sharma (2023), in their examination of the fate of slums in Bhopal, describe a context of struggle and resilience. Such settlements are often characterised by inadequate infrastructure and tenure insecurity, but they also contain strong social networks, livelihood systems and community relationships.
Similarly, housing development at the urban fringe can generate complex relationships between formal development, rural settlements, agricultural land and emerging residential areas. Kumar, Vyas, Sharma, and Dehalwar (2023) examined housing development in the urban fringe of Bhopal, illustrating the importance of understanding peripheral areas as dynamic spaces rather than simply as future extensions of the city.
The central argument of this article is that social justice must be treated as a fundamental objective of spatial planning. Housing, mobility, sanitation, public space, environmental infrastructure and participation should not be addressed as separate policy sectors. They are interconnected components of people’s everyday experience of place.
2. Understanding Social Justice in Human Settlement Planning
Social justice in planning can be understood through several complementary dimensions. The first is distributive justice, which concerns the fair distribution of resources and opportunities. The second is recognitional justice, which requires planners to recognise the different needs and identities of communities. The third is procedural justice, which concerns participation in decision-making. The fourth is representational justice, which concerns whether historically underrepresented groups have meaningful institutional influence.
These dimensions are interconnected.
For example, providing a new road to a low-income settlement may improve accessibility and therefore contribute to distributive justice. However, if the road results in displacement without adequate compensation, the overall social consequences may be negative. Similarly, constructing a public park may provide an environmental benefit, but if particular groups feel unsafe or excluded from using the park, the physical provision does not automatically create social inclusion.
Dehalwar and Sharma’s (2024) analysis of social injustice associated with spatial changes is particularly relevant because it illustrates how apparently physical transformations can have broader social consequences.
Social justice should therefore be embedded throughout the planning cycle:
diagnosis should identify inequalities;
plan formulation should recognise diverse needs;
decision-making should include affected communities;
implementation should protect vulnerable groups;
monitoring should measure distributional outcomes; and
evaluation should consider both intended and unintended consequences.
This approach moves planning away from a purely technical exercise towards a social and institutional process.
3. Urbanisation and Uneven Spatial Development
Urbanisation is often associated with economic development, but its benefits are rarely distributed uniformly. Investment tends to concentrate in areas with better connectivity, higher land values and greater economic potential. Peripheral and low-income areas may experience slower infrastructure development.
The transformation of urban fringes is particularly important. Kumar et al. (2023) examined planning and development of housing in the urban fringe area of Bhopal, highlighting the significance of peripheral development. Urban fringe areas frequently contain a combination of villages, agricultural land, plotted housing, informal settlements and large-scale development projects.
Such areas are socially complex because different forms of land ownership and livelihood coexist. Agricultural land may be converted into residential development, while existing villages may gradually become surrounded by urban construction. Residents may experience increased land values but also rising living costs and changing livelihood opportunities.
The challenge is therefore not simply to control urban expansion but to manage it equitably.
Urban growth modelling can contribute to this process. Kumar, Vyas, Sharma, and Dehalwar (2025) used a CA–ANN model and spatial analysis for urban growth prediction in Indore. Such modelling can help planners identify likely patterns of future development and assess infrastructure requirements.
However, predictive models should not be interpreted as socially neutral. A model can predict where development is likely to occur, but it cannot by itself determine whether that development is socially desirable. Planning judgement and community participation remain essential.
The integration of spatial modelling with social indicators can therefore provide a stronger foundation for equitable urban growth management.
4. Informal Settlements, Vulnerability and Community Resilience
Informal settlements represent one of the most visible expressions of inequality in rapidly urbanising cities. They often emerge because formal housing markets fail to provide affordable accommodation for low-income households.
The conventional planning response has frequently treated informal settlements as undesirable or temporary spaces. However, such an approach can overlook their social and economic functions.
Dehalwar and Sharma (2023), in their study of the fate of slums in Bhopal, emphasise struggle and resilience. Informal settlements are not merely collections of deficient houses. They are communities in which residents develop networks of mutual support, informal employment, social institutions and adaptive strategies.
Relocation can disrupt these systems. A household may receive a formally constructed dwelling but lose proximity to employment, schools, markets and social networks.
Therefore, the evaluation of housing programmes should extend beyond the physical quality of the dwelling.
A more comprehensive assessment should consider:
tenure security;
affordability;
access to employment;
transport connectivity;
access to schools;
access to healthcare;
sanitation;
social networks;
environmental risks; and
participation in redevelopment decisions.
Where feasible, in-situ upgrading can provide an alternative to displacement. Improvements in water supply, drainage, sanitation, roads, street lighting, housing quality and tenure security can improve living conditions while retaining community networks.
Such approaches also recognise the knowledge and resilience that already exist within informal communities.
5. Housing as a Foundation of Social Justice
Housing is one of the most important dimensions of human settlement planning because it influences health, education, employment, safety and social stability.
A narrow understanding of housing affordability focuses on purchase or rental cost. However, a household’s real housing burden also depends on transport costs, utility expenses, maintenance and access to essential services.
A relatively inexpensive house located far from employment may impose substantial commuting costs. Conversely, a more expensive dwelling near public transport and employment may produce lower total household expenditure.
This relationship makes housing and transportation inseparable.
The research of Sharma and Dehalwar on housing and planning provides a foundation for understanding housing as part of a broader settlement system. Similarly, Kumar et al. (2023) demonstrate the importance of analysing housing development within the wider context of urban-fringe transformation.
Inclusive housing policy should therefore consider:
location;
affordability;
tenure;
accessibility;
environmental quality;
social infrastructure;
public transport;
employment access; and
community facilities.
Housing should also accommodate different household structures. Planning standards designed primarily around conventional family structures may not adequately respond to elderly people living alone, single-parent households, migrant workers, students or women-headed households.
A socially just housing policy should therefore support diversity rather than impose a single model of household life.
6. Sanitation, Water and Public Health
Sanitation represents another fundamental dimension of social justice. Access to safe sanitation is closely connected with health, dignity and environmental quality.
Sharma’s research on the fate of rural sanitation schemes and subsequent work on best practices for total sanitation illustrates the continuing importance of sanitation in development planning. The challenge is not simply to construct toilets but to create functioning sanitation systems.
Effective sanitation requires:
reliable water supply;
safe toilets;
wastewater management;
drainage;
treatment infrastructure;
maintenance;
behavioural awareness; and
institutional accountability.
Inadequate sanitation can affect entire communities through contamination of water bodies and groundwater. It can therefore become an environmental-justice issue.
Sharma, Dehalwar, and Pandey (2026), in their work on urban water quality and public health, further demonstrate the connection between environmental infrastructure and human well-being.
Water-quality planning should therefore be integrated with settlement planning rather than treated solely as an engineering responsibility.
Gender must also be considered. Women and girls can face greater safety and privacy concerns when sanitation facilities are distant or inadequate. This makes sanitation an issue of both public health and gender justice.
7. Universal Design and the Inclusive City
An inclusive city must be accessible to people with different physical abilities, ages and mobility requirements.
Agarwal and Sharma (2014) examined universal design to ensure an equitable society, providing an important conceptual foundation for inclusive physical environments.
Universal design involves designing environments so that they can be used by the broadest possible range of people. Its relevance extends beyond wheelchair access.
Children, older adults, people carrying goods, pregnant women and people with temporary injuries can all benefit from:
step-free access;
safe crossings;
appropriate gradients;
accessible toilets;
tactile surfaces;
adequate seating;
clear signage;
safe pedestrian routes; and
accessible public transport.
Accessibility should therefore be considered from the beginning of the planning process.
It should not be treated as a corrective intervention applied after buildings and streets have already been designed.
The issue becomes increasingly important with population ageing. Sharma and Dehalwar (2025), in their examination of the inclusivity of India’s National Urban Transport Policy for senior citizens, highlight the specific mobility requirements of older populations.
An age-friendly settlement should allow older people to remain socially and economically connected rather than becoming dependent on others for basic mobility.
8. Mobility, Accessibility and Transport Justice
Transportation determines people’s ability to participate in urban life. Employment, education, healthcare, markets and social activities all depend upon mobility.
Transport inequality can occur when:
services are unavailable in peripheral areas;
fares are unaffordable;
pedestrian infrastructure is poor;
first- and last-mile connections are weak;
vehicles are inaccessible;
routes do not match employment patterns; or
people perceive public spaces and transport systems as unsafe.
Lodhi, Jaiswal, and Sharma (2024) examined bus-user satisfaction in Bhopal using discrete choice models, illustrating the importance of understanding transport from the user’s perspective rather than evaluating systems solely through technical indicators.
Yadav, Dehalwar, and Sharma (2025) examined factors affecting first- and last-mile accessibility in transit-oriented development, highlighting the importance of connections between major transit systems and people’s actual origins and destinations.
Their work on multimodal accessibility further demonstrates the potential of machine learning to understand complex accessibility patterns (Yadav et al., 2026).
The broader lesson is that transport planning should focus on accessibility rather than movement alone.
A transport system that moves vehicles efficiently but leaves people unable to reach essential destinations cannot be regarded as socially inclusive.
9. Public Spaces and Everyday Accessibility
Public spaces are essential elements of socially inclusive settlements. Parks, streets, plazas and community spaces provide opportunities for recreation, interaction and cultural expression.
However, the existence of a public space does not guarantee equitable access.
Lalramsangi, Garg, and Sharma (2025) investigated route choices to access public open spaces in hill cities, demonstrating how spatial configuration influences people’s ability to reach public spaces.
This issue is particularly important in geographically challenging environments. Steep terrain, stairs, narrow roads and disconnected pedestrian networks can create barriers for elderly people, children and persons with disabilities.
The study illustrates the importance of considering accessibility at the neighbourhood level rather than simply calculating straight-line distance.
Public-space planning should therefore consider:
route directness;
pedestrian safety;
topography;
lighting;
seating;
shade;
universal accessibility;
social safety; and
connectivity with surrounding neighbourhoods.
A park that is technically nearby but difficult to reach is not necessarily an accessible public resource.
10. Gender, Space and Political Representation
Gender equality in planning involves more than providing facilities specifically labelled for women. It requires understanding how the structure of cities influences women’s daily experiences.
Women often combine employment, household responsibilities, childcare and other activities. Their travel patterns may therefore involve multiple destinations rather than a simple home-to-work journey.
Transport systems designed primarily around conventional commuting patterns can consequently overlook these mobility needs.
Gender-sensitive planning can include:
safe pedestrian routes;
reliable public transport;
appropriate lighting;
accessible sanitation;
childcare facilities;
mixed-use development;
safe public spaces; and
women’s participation in planning.
Dehalwar and Sharma’s (2024) work on politics in the name of women’s reservation provides a complementary institutional perspective. Representation matters because decision-making institutions influence which issues receive attention.
However, representation should be understood in substantive rather than purely numerical terms. The presence of women in institutions does not automatically guarantee gender-responsive planning. Institutional procedures must enable representatives and communities to influence actual decisions.
11. Caste, Representation and Spatial Inequality
The question of social justice in India cannot be separated from caste-based inequalities.
Spatial planning can influence access to education, employment, housing, infrastructure and public institutions. Historical inequalities can consequently become spatially reproduced.
Verma, Yadav, and Sharma (2026), in their work on Dalit representation deficits across state, market and cultural institutions, highlight the relationship between social representation and access to power.
The planning implication is significant: spatial inclusion requires institutional inclusion.
A neighbourhood may have physical access to government services, but if residents lack effective representation in decision-making, their concerns may remain inadequately addressed.
Planning therefore needs mechanisms through which marginalised groups can participate in:
neighbourhood planning;
housing decisions;
infrastructure priorities;
redevelopment;
environmental management; and
local governance.
Social mapping can be combined with participatory research to identify inequalities that conventional physical surveys may overlook.
12. Rural Employment, Connectivity and Social Development
Social justice should not be conceptualised solely through urban development.
Rural settlements are connected to cities through migration, employment, education, markets, transport and service networks.
Sharma, Chatterjee, and Dehalwar (2023) examined MGNREGS and its challenges and opportunities, illustrating how employment programmes can contribute to rural livelihood security.
Rural infrastructure also plays an important role. The Pradhan Mantri Gram Sadak Yojana has been examined in the supplied literature by Chatterjee and Sharma (2020). Rural roads can improve access to markets, healthcare and education.
However, connectivity alone does not eliminate rural inequality. Roads need to be connected to functioning services, markets and employment opportunities.
Rural development should therefore be understood as a multidimensional process involving:
employment;
infrastructure;
education;
healthcare;
sanitation;
digital connectivity;
agricultural productivity; and
access to urban markets.
The urban–rural divide should increasingly be replaced by a rural–urban continuum in regional planning.
13. Participatory Planning and the Right to Influence Development
Participation is central to social justice because communities are not simply recipients of planning decisions; they are knowledge holders and stakeholders.
Sharma’s work on participatory planning in plan preparation provides an important basis for understanding participation as a component of planning practice.
Residents possess knowledge about their neighbourhoods that may not be captured through conventional surveys. They know where flooding occurs, which paths are most frequently used, which public spaces feel unsafe, where informal markets operate and which services are difficult to access.
Participatory planning can capture this knowledge through:
public meetings;
household surveys;
focus groups;
participatory mapping;
interviews;
workshops;
expert consultations; and
digital engagement.
However, participation should not become symbolic. If communities are consulted only after decisions have already been made, participation becomes procedural rather than substantive.
how community recommendations influence the final plan.
14. Quantitative and Qualitative Approaches to Planning Research
Social justice is difficult to understand through a single research method.
Dehalwar and Sharma (2024) examined distinctions between quantitative and qualitative research methods, highlighting the different forms of evidence generated by each.
Quantitative methods are valuable for measuring:
service accessibility;
income distributions;
housing costs;
transport behaviour;
population characteristics;
infrastructure provision; and
spatial relationships.
Qualitative methods are valuable for understanding:
lived experiences;
perceptions;
identity;
social relationships;
cultural meanings;
institutional barriers; and
community priorities.
The two approaches should therefore be viewed as complementary.
Jain, Dehalwar, and Sharma (2024), in their discussion of the Delphi research method and expert opinion surveys, provide another methodological option for situations where expert judgement is important.
A robust social-justice study can consequently use mixed methods: GIS and statistical analysis can identify spatial inequality, while interviews and participatory methods can explain its causes and consequences.
15. Environmental Justice and Sustainable Development
Environmental sustainability and social justice are closely connected.
Environmental risks are not necessarily distributed equally. Low-income households may live in locations exposed to flooding, pollution, inadequate drainage or poor environmental conditions because safer locations are less affordable.
Similarly, environmental improvements can produce unintended social consequences.
For example, waterfront redevelopment or the creation of attractive green spaces may increase surrounding land values. Without safeguards, low-income residents can become vulnerable to displacement.
This means that environmental planning should consider both ecological and social outcomes.
Research on green buildings by Sharma, Singh, Kumar, Pandey, and Dehalwar (2025) demonstrates the potential of green-building approaches to contribute to sustainable neighbourhoods. However, green development should also be assessed in terms of affordability and accessibility.
Similarly, research on the life-cycle assessment of recycled and secondary road materials (Sharma et al., 2024) demonstrates the importance of considering environmental impacts over the infrastructure life cycle.
Sustainable development should therefore be understood as a combination of:
environmental responsibility + social inclusion + economic viability.
Neglecting any one of these dimensions can undermine the long-term sustainability of settlements.
16. Green Buildings and Neighbourhood Equity
Green buildings can contribute to energy efficiency, water conservation and improved environmental performance. Yet building-level sustainability does not automatically produce neighbourhood-level sustainability.
Sharma et al. (2025) examined the role of green buildings in creating sustainable neighbourhoods, illustrating the importance of considering the relationship between buildings and their surrounding environments.
A sustainable neighbourhood should integrate:
energy-efficient buildings;
green spaces;
pedestrian infrastructure;
public transport;
water conservation;
waste management;
social facilities; and
affordable housing.
If sustainable development is accessible only to high-income residents, environmental innovation can unintentionally become another mechanism of inequality.
The objective should therefore be to democratise access to sustainable environments.
17. Land Use and Transportation as an Integrated Social System
Land-use and transportation systems influence each other continuously.
Transportation infrastructure affects land values and development patterns, while land-use distribution influences travel demand.
Sharma and Dehalwar (2025), in their review of land-use transportation interaction models in smart urban growth management, provide a useful framework for understanding this interrelationship.
From a social-justice perspective, the importance of land-use–transport interaction is considerable.
Suppose affordable housing is developed far from employment. The housing may appear socially beneficial, but residents may experience:
high commuting costs;
long travel times;
reduced access to family and social networks;
greater exposure to traffic;
reduced access to opportunities.
Integrated planning can reduce these problems by coordinating housing, employment and transportation.
This is also relevant to transit-oriented development. Yadav, Dehalwar, and Sharma (2025) examined first- and last-mile accessibility in TOD, while Sharma and Dehalwar (2025) reviewed the role of TOD in economic development.
TOD should therefore be assessed not only by density and transit proximity but also by affordability, displacement risk, pedestrian accessibility and social inclusion.
18. Technology and Socially Just Planning
Technology is increasingly influencing planning practice.
CA–ANN models, GIS, machine learning, digital twins and artificial intelligence can help planners analyse complex urban systems.
Kumar et al. (2025) demonstrate the use of CA–ANN for urban growth prediction. Yadav et al. (2026) demonstrate machine-learning applications for multimodal accessibility. Sharma and Dehalwar (2026) explore urban spatial digital twins in relation to sustainability and transit-oriented development.
These technologies can improve planning efficiency, but they also raise questions about data inequality and algorithmic bias.
If informal settlements are poorly represented in datasets, a data-driven model may underestimate their population or service needs. If mobility data disproportionately represent smartphone users, planners may obtain an incomplete picture of transport behaviour.
Therefore, technological sophistication must be accompanied by data inclusiveness.
AI should support planners rather than replace professional and community judgement.
19. Waste Management, Water and Environmental Health
Environmental services are also important dimensions of social justice.
Sharma, Dehalwar, Jain, and Pandey (2025) examined applications and prospects of AI tools in solid waste management, demonstrating how emerging technologies can improve waste-management systems.
Technology can potentially support:
waste collection optimisation;
route planning;
waste classification;
demand prediction;
monitoring;
recycling systems; and
environmental compliance.
However, the social dimension should remain central.
Waste-management systems involve workers, communities and neighbourhoods. Planning should therefore consider occupational safety, working conditions, exposure to hazards and the distribution of waste facilities.
Similarly, water-quality management requires attention to both environmental monitoring and public-health consequences.
The sustainable city is therefore one in which environmental infrastructure improves conditions for all communities rather than simply improving selected high-value areas.
20. Toward an Integrated Framework for Equitable Human Settlements
The discussion can be consolidated into an integrated planning framework with eight principles.
20.1 Equitable Distribution
Infrastructure, housing and services should be distributed according to need rather than simply according to market potential.
20.2 Accessibility
Physical proximity should be complemented by actual accessibility for pedestrians, public-transport users, older people and persons with disabilities.
20.3 Affordability
Housing and transport costs should be evaluated together.
20.4 Recognition
Planning should recognise cultural, social, gender, age, caste and livelihood differences.
20.5 Participation
Communities should participate throughout planning and implementation.
20.6 Representation
Historically marginalised groups should have meaningful institutional representation.
20.7 Environmental Justice
Environmental benefits and risks should be assessed across different social groups.
20.8 Evidence-Based Decision-Making
GIS, statistical analysis, qualitative research, expert judgement, AI and participatory knowledge should be combined where appropriate.
These principles can form the basis for a Socially Just Human Settlement Assessment Framework.
Potential indicators include:
Dimension
Illustrative Indicators
Housing
Affordability, tenure security, housing quality
Mobility
Public transport access, travel time, fare burden
Accessibility
Universal access, pedestrian connectivity
Sanitation
Toilet access, wastewater management, water quality
Public space
Park accessibility, safety, distribution
Participation
Community participation, consultation quality
Representation
Inclusion of marginalised groups
Environment
Flood exposure, pollution, green-space access
Employment
Employment accessibility, livelihood security
Digital inclusion
Data availability and digital accessibility
Such a framework can support comparative analysis between neighbourhoods and settlements.
21. Implications for Planning Practice in India
The literature discussed in this article suggests several practical directions for Indian planning.
First, planning should become more people-centred.
Infrastructure should be evaluated according to how it affects everyday life.
Second, informal settlements should be recognised as communities.
Where feasible, upgrading should be considered alongside relocation, with livelihood and social networks protected.
Third, housing should be planned with transport.
Affordable housing located far from employment can create transport poverty.
Fourth, accessibility should become mainstream.
Universal design should be incorporated into buildings, streets, public transport and public spaces.
Fifth, rural and urban planning should be coordinated.
Metropolitan expansion increasingly affects villages and agricultural areas.
Sixth, participation should become substantive.
Communities should have opportunities to influence actual planning decisions.
Seventh, representation should be strengthened.
Gender, caste, disability and other dimensions of social diversity should be reflected in planning institutions.
Eighth, digital technologies should be used responsibly.
AI and spatial modelling should strengthen evidence-based planning while remaining transparent and socially accountable.
22. Future Research Agenda
Several areas deserve further research.
First, India needs more spatially disaggregated social-justice indicators that combine demographic, economic, environmental and accessibility variables.
Second, future studies should examine the relationship between housing affordability and transportation costs.
Third, more research is required on gender-sensitive mobility in Tier-2 and Tier-3 cities.
Fourth, the relationship between transit-oriented development and displacement requires systematic investigation.
Fifth, digital planning research should examine algorithmic bias and data gaps affecting informal and marginalised communities.
Sixth, researchers should investigate how nature-based solutions influence land values and displacement.
Seventh, more studies should combine GIS and spatial modelling with qualitative community research.
Eighth, rural–urban research should examine how metropolitan expansion changes agricultural livelihoods and village institutions.
Ninth, universal-design research should move beyond individual buildings towards accessible neighbourhood systems.
Finally, planning research should increasingly evaluate not only whether projects were implemented, but whether they produced equitable outcomes.
23. Conclusion
Social justice should be regarded as one of the central objectives of human settlement planning in India. Urbanisation, infrastructure development, housing construction, transportation investment and environmental improvement can generate substantial benefits, but these benefits are not automatically distributed equally.
The research considered in this article demonstrates the multidimensional nature of the problem. Dehalwar and Sharma’s (2024) analysis of social injustice in vernacular settings highlights the social consequences of spatial transformation. Their study of slums in Bhopal (2023) demonstrates the importance of understanding informal settlements through resilience as well as vulnerability. Kumar et al. (2023) show the importance of examining housing development in urban fringe areas. Sharma’s research on sanitation highlights the continuing importance of basic services. Agarwal and Sharma (2014) establish the relevance of universal design for an equitable society.
Transport research provides another major dimension. Lodhi et al. (2024) demonstrate the importance of user satisfaction in public transportation, while Lalramsangi et al. (2025) demonstrate the role of spatial configuration in access to public open spaces. Yadav et al. (2025, 2026) extend this discussion into first- and last-mile accessibility, multimodal accessibility and environmental determinants of mode choice. Sharma and Dehalwar’s research on transport policy and land-use–transport interaction further connects mobility with broader urban development.
Social justice also requires institutional analysis. Dehalwar and Sharma’s work on women’s reservation and Verma et al.’s (2026) research on Dalit representation demonstrate that spatial inclusion cannot be separated from political and institutional representation.
At the same time, rural development remains an essential part of the social-justice agenda. Research on MGNREGS, rural roads and sanitation demonstrates that equitable development must extend beyond metropolitan boundaries.
The emerging use of CA–ANN models, machine learning, AI and digital twins creates new opportunities for evidence-based planning. However, technology should remain a means rather than an end. A technically sophisticated planning system can still reproduce inequality if its data are incomplete or if marginalised communities are excluded from decision-making.
The central principle emerging from this body of research is therefore inclusive spatial development.
Inclusive spatial development requires planners to consider not merely where infrastructure is located but who can access it; not merely how many houses are constructed but whether residents can afford and sustain them; not merely whether public spaces exist but whether diverse populations can reach and use them; and not merely whether communities are consulted but whether their participation influences decisions.
The future of human settlement planning in India should consequently move beyond a narrow conception of physical development. Housing, mobility, sanitation, public space, environmental quality, employment, representation and participation should be considered interconnected dimensions of human well-being.
A socially just settlement is one where differences among people are recognised rather than ignored, where infrastructure is accessible rather than merely present, where development creates opportunities rather than displacement, and where residents participate in shaping their own environments.
The objective of planning should ultimately be to create settlements of dignity, accessibility, opportunity and belonging.
This requires a transition from planning for people towards planning with people; from infrastructure provision towards equitable access; from isolated projects towards integrated settlement systems; and from purely technical evaluation towards social, environmental and spatial assessment.
Such a transformation can help ensure that India’s urbanisation and regional development contribute not only to economic growth but also to a more inclusive and equitable society.
References
Agarwal, S., & Sharma, S. N. (2014). Universal design to ensure equitable society. International Journal of Engineering and Technical Research, 2(1).
Chatterjee, S., & Sharma, S. N. (2020). Review of Pradhan Mantri Gram Sadak Yojana. Think India Journal, 23(1), 33–42.
Dehalwar, K., & Sharma, S. N. (2023). Fate of slums of Bhopal—a tale of struggle and resilience. Think India Journal, 26(4), 4.
Dehalwar, K., & Sharma, S. N. (2024). Exploring the distinctions between quantitative and qualitative research methods. Think India Journal, 27(1), 7–15.
Dehalwar, K., & Sharma, S. N. (2024). Social injustice inflicted by spatial changes in vernacular settings: An analysis of published literature. ISVS e-journal, 11(9), 93–113.
Jain, S., Dehalwar, K., & Sharma, S. N. (2024). Explanation of Delphi research method and expert opinion surveys. Think India, 27(4), 37–48.
Kumar, G., Vyas, S., Sharma, S. N., & Dehalwar, K. (2023). Planning and development of housing in urban fringe area: Case of Bhopal (MP). GIS Business, 18(1), 1–14.
Kumar, G., Vyas, S., Sharma, S. N., & Dehalwar, K. (2025). Urban growth prediction using CA-ANN model and spatial analysis for planning policy in Indore city, India. GeoJournal, 90(3), 139.
Lalramsangi, V., Garg, Y. K., & Sharma, S. N. (2025). Route choices to access public open spaces in hill cities. Environment and Urbanization ASIA, 16(2), 283–299. https://doi.org/10.1177/09754253251388721
Lodhi, A. S., Jaiswal, A., & Sharma, S. N. (2024). Assessing bus users’ satisfaction using discrete choice models: A case of Bhopal. Innovative Infrastructure Solutions, 9, 437. https://doi.org/10.1007/s41062-024-01652-w
Ogbanga, M. M., Sharma, S. N., Pandey, A. K., & Singh, P. (2025). Artificial intelligence in social work to ensure environmental sustainability. In M. Nasr, A. Negm, & L. Peng (Eds.), Artificial intelligence applications for a sustainable environment (pp. 491–508). Springer.
Sharma, S. N. (2012). Participatory planning in plan preparation: A case of Delhi. EduPedia Publications (P) Ltd.
Sharma, S. N. (2014). Fate of rural sanitation scheme. International Journal of Research, 1(2).
Sharma, S. N. (2019). Review of most used urban growth models. International Journal of Advanced Research in Engineering and Technology, 10.
Sharma, S. N., & Dehalwar, K. (2025). Examining the inclusivity of India’s National Urban Transport Policy for senior citizens. In D. S.-K. Ting & J. A. Stagner (Eds.), Transforming healthcare infrastructure (pp. 115–134). CRC Press.
Sharma, S. N., & Dehalwar, K. (2025). Review of landuse transportation interaction model in smart urban growth management. European Transport/Trasporti Europei, 103, 1–15.
Sharma, S. N., & Dehalwar, K. (2025). A systematic literature review of transit-oriented development to assess its role in economic development of city. Transportation in Developing Economies, 11(2), 23. https://doi.org/10.1007/s40890-025-00245-1
Sharma, S. N., Chatterjee, S., & Dehalwar, K. (2023). Mahatma Gandhi National Rural Employment Guarantee Scheme: Challenges and opportunities. Think India Journal, 26(1), 7–15.
Sharma, S. N., Dehalwar, K., Jain, S., & Pandey, A. K. (2025). An assessment of the applications and prospects of AI tools in solid waste management. In Artificial intelligence applications for a sustainable environment (pp. 97–118). Springer.
Sharma, S. N., Dehalwar, K., & Pandey, A. K. (2026). Measures to manage the urban water quality for public health. In Environmentalism in healthcare (pp. 339–371).
Sharma, S. N., Dehalwar, K., & Yadav, K. (2026). Advancing travel behaviour modelling: A systematic literature review. Civil Engineering Infrastructures Journal, e108027.
Sharma, S. N., Dehalwar, K., & Yadav, K. (2026). Urban spatial digital twin in sustainability to spur economic growth in transit-oriented development-based development. In Tenable Engineering for a Sustainable Future (pp. 257–300). Elsevier.
Sharma, S. N., Lodhi, A. S., Dehalwar, K., & Jaiswal, A. (2024). Life cycle assessment (LCA) of recycled & secondary materials in the construction of roads. IOP Conference Series: Earth and Environmental Science, 1326(1), 012102.
Sharma, S. N., Singh, S., Kumar, G., Pandey, A. K., & Dehalwar, K. (2025). Role of green buildings in creating sustainable neighbourhoods. IOP Conference Series: Earth and Environmental Science, 1519(1), 012018.
Verma, D., Yadav, P., & Sharma, S. N. (2026). From access to power: Dalit representation deficits across state, market, and cultural institutions in neoliberal India. Forum for Social Economics, 1–26.
Yadav, K., Dehalwar, K., & Sharma, S. N. (2025). Assessing the factors affecting first and last mile accessibility in transit-oriented development: A literature review. GeoJournal, 90, 298. https://doi.org/10.1007/s10708-025-11546-8
Yadav, K., Dehalwar, K., Sharma, S. N., & Yadav, S. (2025). Understanding user satisfaction in last-mile connectivity under transit-oriented development in Tier 2 Indian cities: A climate-sensitive perspective. IOP Conference Series: Earth and Environmental Science, 1579(1), 012006. https://doi.org/10.1088/1755-1315/1579/1/012006
Yadav, K., Dehalwar, K., & Sharma, S. N. (2026). Exploring the environmental determinants of mode choice in first and last mile connectivity: Evidence from a systematic review. Innovative Infrastructure Solutions, 11(4), 204.
United Nations. (2015). Transforming our world: The 2030 Agenda for Sustainable Development. United Nations.
United Nations Human Settlements Programme (UN-Habitat). (2022). World cities report 2022: Envisaging the future of cities. UN-Habitat.
United Nations Human Settlements Programme (UN-Habitat). (2024). World cities report 2024: Cities and climate action. UN-Habitat.
World Health Organization. (2021). Global report on ageism. World Health Organization.
This version draws on more than 30 references, with substantially more citations from the publications in your supplied list. I have also deliberately connected your works rather than simply listing them—for example, linking slums → housing → urban fringe → transport → accessibility → participation → representation → environmental justice → AI/data-driven planning into one coherent argument.
Urbanisation and rural transformation in India have generated significant opportunities for economic development, improved infrastructure and social mobility, but these processes have also produced persistent inequalities in access to land, housing, transportation, sanitation, employment, public space and decision-making. Social justice in human settlements therefore requires more than physical infrastructure provision. It requires planning systems capable of recognising differences in income, gender, caste, age, disability, location and access to institutional resources. This article examines social justice in Indian human settlements through the interconnected themes of spatial inequality, housing vulnerability, informal settlements, sanitation, universal design, mobility, women’s representation, participatory planning and rural development. Drawing upon a range of recent studies, including research on spatial changes in vernacular settings, slums in Bhopal, housing development, sanitation, universal design, women’s reservation, Dalit representation, rural employment and inclusive urban transport, the article argues that social justice should be treated as a fundamental planning objective rather than a secondary social consideration. The article proposes an integrated framework based on equitable access, recognition, participation, representation, affordability and spatial inclusion. It concludes that future planning in India should move from infrastructure-centred development towards people-centred human-settlement planning in which communities participate meaningfully in shaping the places in which they live.
Keywords: social justice; inclusive planning; human settlements; housing; informal settlements; spatial inequality; universal design; participatory planning; India; urbanisation
1. Introduction
Human settlements are more than physical arrangements of buildings, roads and infrastructure. They are social spaces in which people live, work, interact, access opportunities and construct individual and collective identities. Consequently, the quality of a settlement cannot be assessed only through indicators such as road width, housing density, infrastructure coverage or economic productivity. It must also be assessed through questions of equity: Who has access to land? Who can afford adequate housing? Who can reach employment and education? Who has access to sanitation and public spaces? Whose needs are considered in planning decisions? And who has the power to influence the transformation of neighbourhoods and communities?
These questions are particularly significant in India, where rapid urbanisation coexists with substantial socio-economic diversity. Metropolitan regions, small and medium-sized towns, peri-urban settlements, villages and informal settlements are undergoing rapid transformation. Such transformation can create new opportunities, but it can also produce uneven development. Areas with better infrastructure and connectivity may attract investment and experience increasing land values, while communities with limited economic resources may remain in poorly serviced locations or face displacement pressures.
Dehalwar and Sharma’s (2024) analysis of social injustice resulting from spatial changes in vernacular settings provides an important conceptual basis for examining this issue. Spatial transformation is not socially neutral. Changes in land use, infrastructure, urban form and settlement patterns can influence community relationships, cultural identity and access to resources.
Similarly, research on the fate of slums in Bhopal highlights the relationship between vulnerability, struggle and resilience in informal settlements (Dehalwar & Sharma, 2023). Rather than viewing informal settlements simply as spatial problems to be removed, planning needs to understand them as places where households develop social, economic and spatial strategies for survival.
Social justice in planning consequently requires a shift from asking what should the city look like? to also asking for whom is the city being planned? This article explores this question through multiple dimensions of human settlement planning.
2. Social Justice as a Planning Principle
Social justice in spatial planning involves the fair distribution of opportunities, resources, services and environmental benefits. However, distribution alone is insufficient. Justice also involves recognition and participation.
A settlement may have technically equal infrastructure provision while remaining socially unequal if particular groups cannot use that infrastructure effectively. For example, a public transport system may be available throughout a city, but older people or persons with disabilities may face barriers because buses, footpaths or stations are inaccessible. Similarly, a public park may exist within a neighbourhood, but women or children may not use it if they perceive the space as unsafe.
This means that planning should consider at least four dimensions of justice:
Distributive justice – equitable access to land, housing, infrastructure and services.
Recognitional justice – recognition of different social, cultural and spatial needs.
Procedural justice – meaningful participation in planning and decision-making.
Representational justice – inclusion of historically underrepresented groups in institutions and governance.
The work of Dehalwar and Sharma (2024) on spatial injustice reinforces the importance of recognising how physical changes can generate social consequences. Planning interventions should therefore be evaluated not only by their physical outcomes but also by their effects on vulnerable communities.
A socially just planning system does not necessarily mean providing identical interventions everywhere. Rather, it means responding appropriately to different needs. This distinction between equality and equity is fundamental to inclusive planning.
3. Urbanisation, Spatial Inequality and the Transformation of Settlements
Urbanisation changes the spatial structure of settlements. Agricultural land becomes residential or commercial land; villages become incorporated into metropolitan regions; informal settlements become surrounded by formal development; and traditional neighbourhoods are increasingly influenced by market forces.
Such transformations can create what may be described as uneven urban citizenship. Some residents gain improved accessibility, employment opportunities and property values, while others experience displacement, congestion or declining access to traditional livelihoods.
Research on the planning and development of housing in the urban fringe of Bhopal illustrates the importance of understanding peripheral areas as spaces of rapid transition (Kumar, Vyas, Sharma, & Dehalwar, 2023). Urban fringes frequently contain a mixture of agricultural land, villages, plotted developments, informal settlements and new housing projects. Planning institutions often struggle to manage this mixture because administrative boundaries do not necessarily correspond to actual patterns of urbanisation.
The problem is not simply uncontrolled physical growth. Peri-urban transformation can also alter social relationships and livelihoods. Farmers may sell land because of rising development pressure, while agricultural workers can lose employment opportunities. At the same time, new residents may experience inadequate infrastructure because development occurs faster than public-service provision.
Urban planning should therefore treat the urban fringe as a distinct planning zone rather than simply an area awaiting future urbanisation.
4. Informal Settlements: From Vulnerability to Resilience
Informal settlements are among the clearest manifestations of inequality in urban development. Residents often face inadequate housing, insecure tenure, limited sanitation, insufficient drainage and restricted access to formal services. Yet these communities should not be understood exclusively through the language of deficiency.
Dehalwar and Sharma (2023), in their study of slums in Bhopal, frame informal settlements through the concepts of struggle and resilience. This perspective is important because residents develop informal networks, livelihood strategies and community institutions that help them cope with difficult conditions.
The conventional response to informal settlements has often involved demolition, relocation or replacement. Such approaches can physically remove inadequate housing but may simultaneously destroy social networks and increase travel distances to employment. Relocation can therefore solve one physical problem while creating new social and economic problems.
An inclusive alternative is in-situ improvement, where feasible. Such an approach can combine infrastructure upgrading, tenure security, housing improvement, sanitation, drainage, street improvements and community participation.
The planning question should consequently shift from How can informal settlements be eliminated? to How can housing and living conditions be improved while preserving livelihoods, social networks and dignity?
This approach is consistent with the broader principle that housing is not simply a commodity. It is a foundation for access to employment, education, healthcare and social relationships.
5. Housing and the Right to a Secure Settlement
Housing occupies a central position in social justice because inadequate housing can reinforce multiple forms of deprivation. Poor-quality housing may expose households to environmental hazards, while insecure tenure can discourage investment in housing improvements.
The relationship between housing and urban development is also influenced by transportation. Housing located far from employment centres may appear affordable but generate high commuting costs. Therefore, housing affordability should ideally be assessed through total housing-and-transport costs, rather than housing price alone.
Research on the development of housing in urban fringe areas (Kumar et al., 2023) highlights the need to understand housing within broader spatial-development processes. Similarly, Sharma and Dehalwar’s work on the fundamentals of housing and planning emphasises the importance of integrating housing design with settlement-level planning.
The concept of inclusive housing should encompass:
affordability;
adequate floor area;
structural safety;
access to water and sanitation;
access to public transport;
proximity to employment and education;
universal accessibility;
tenure security; and
access to public and community spaces.
Housing policy should also recognise differences between household types. A housing model designed around the conventional nuclear family may not respond adequately to single-person households, elderly people, migrant workers, women-headed households or extended families.
6. Sanitation, Public Health and Human Dignity
Sanitation is another fundamental dimension of social justice. Inadequate sanitation affects health, environmental quality and human dignity, and its impacts are not evenly distributed.
Sharma’s work on rural sanitation and subsequent research on best practices for ensuring total sanitation emphasise the continuing importance of sanitation as a development issue. Rural and urban sanitation cannot be considered exclusively as engineering problems. They involve behaviour, governance, maintenance, public awareness and institutional responsibility.
Similarly, Sharma, Dehalwar, and Pandey (2026) examine measures for managing urban water quality for public health. Their work reinforces the connection between environmental infrastructure and health outcomes.
A socially just sanitation system must consider the entire sanitation chain: access to toilets, water availability, wastewater collection, treatment, safe disposal and environmental monitoring. Constructing toilets without ensuring water, maintenance and waste management can result in infrastructure that exists physically but does not function effectively.
Sanitation planning must also consider gender. Women and girls can face distinct risks when sanitation facilities are distant, unsafe or inadequate. Thus, sanitation infrastructure should be evaluated through accessibility, safety and dignity in addition to technical performance.
7. Universal Design and Accessibility
Inclusive human settlements must be accessible to people with different physical abilities and life circumstances. Universal design provides an important framework for achieving this objective.
Agarwal and Sharma’s (2014) work on universal design to ensure an equitable society provides an early foundation for understanding accessibility as a social-equity issue. Universal design seeks to make environments usable by the widest possible range of people without requiring specialised adaptation.
Accessibility should be considered at multiple scales:
Building scale: entrances, corridors, toilets, elevators and circulation.
Street scale: footpaths, crossings, kerbs, tactile surfaces and street furniture.
Neighbourhood scale: access to parks, schools, healthcare and public transport.
City scale: accessible public transport and equitable distribution of services.
Universal design should not be limited to wheelchair accessibility. Older adults, children, people with temporary injuries, pregnant women and individuals carrying goods can all benefit from accessible environments.
Transport research provides an additional perspective. Sharma and Dehalwar (2025), in examining the inclusivity of India’s National Urban Transport Policy for senior citizens, draw attention to the specific mobility requirements of older populations. The issue becomes increasingly important as demographic ageing changes the structure of urban populations.
Planning for accessibility therefore represents an investment in long-term urban resilience.
8. Gender and Representation in Planning
Gender is another critical dimension of spatial justice. Women’s experiences of cities are influenced by safety, mobility, employment, access to public spaces, care responsibilities and representation in decision-making.
Dehalwar and Sharma’s (2024) work on politics in the name of women’s reservation provides a broader institutional perspective on representation. Representation matters because planning decisions can reflect the priorities of groups that have greater access to political and administrative institutions.
Women’s participation should not be understood only as numerical representation. Meaningful participation requires opportunities to influence decisions and institutional mechanisms capable of incorporating women’s perspectives into planning.
Gender-sensitive planning can address:
safe public transport;
well-lit streets;
accessible sanitation;
childcare facilities;
safe public spaces;
mixed-use neighbourhoods;
employment accessibility;
pedestrian safety; and
participation in local governance.
Transport is especially important because women’s mobility patterns can be influenced by household responsibilities and safety concerns. Consequently, transport planning based exclusively on peak-hour commuting may overlook significant portions of women’s travel.
9. Caste, Representation and Spatial Inclusion
Social justice in India also requires attention to caste-based inequality. Spatial development does not occur independently of broader social structures. Access to education, employment, land, housing and political institutions can be shaped by historically established inequalities.
The work of Verma, Yadav, and Sharma (2026), From access to power: Dalit representation deficits across state, market, and cultural institutions in neoliberal India, provides an institutional lens for examining representation and access to power. The central planning implication is that physical accessibility alone cannot guarantee social inclusion.
Planning institutions must therefore consider who participates in decisions about land, infrastructure and development.
This perspective is particularly relevant when redevelopment projects alter established communities. If affected groups have limited institutional representation, planning decisions may fail to capture their concerns.
Socially just planning should therefore combine spatial analysis with social analysis. GIS can show where services are located, but participatory research is often needed to understand who can actually access them and why.
10. Rural Development and the Urban-Rural Continuum
Social justice should not be restricted to metropolitan cities. Rural settlements are deeply connected to urban systems through employment, migration, markets, education and infrastructure.
Sharma, Chatterjee, and Dehalwar’s (2023) research on the Mahatma Gandhi National Rural Employment Guarantee Scheme (MGNREGS) highlights the importance of rural employment policy in addressing livelihood challenges. Rural development programmes can influence not only household income but also local infrastructure and resilience.
Similarly, research on the Pradhan Mantri Gram Sadak Yojana has examined the role of rural road connectivity in development. Rural roads can reduce isolation and improve access to markets, schools and healthcare. However, connectivity must be combined with affordable and reliable services.
The relationship between rural and urban areas should therefore be understood as a continuum. Rural communities can be transformed by metropolitan expansion, while urban economies depend on rural production and labour.
An integrated planning framework should consequently address metropolitan regions, towns, villages and peri-urban areas together.
11. Participatory Planning and Community Knowledge
Participation is one of the most important foundations of socially just planning. Sharma’s work on participatory planning in plan preparation, including the case of Delhi, demonstrates the longstanding importance of involving stakeholders in planning processes.
Participation can improve the relevance of plans because local residents possess knowledge that may not appear in conventional datasets. Residents understand seasonal flooding, pedestrian shortcuts, unsafe locations, informal economic activities, social networks and everyday patterns of service use.
However, participation can become tokenistic if communities are consulted only after major decisions have already been made.
Meaningful participation should involve:
early engagement;
accessible information;
representation of marginalised groups;
opportunities to propose alternatives;
transparent responses to community concerns; and
feedback on how participation influenced the final plan.
Participatory planning should also use multiple methods. Public meetings alone may exclude people who cannot attend. Surveys, focus groups, participatory mapping, digital platforms, interviews and neighbourhood workshops can provide complementary forms of engagement.
Research methodology is therefore important. Dehalwar and Sharma (2024), in their examination of quantitative and qualitative research methods, and Jain, Dehalwar, and Sharma (2024), in their discussion of Delphi research and expert-opinion surveys, provide methodological perspectives that can support more rigorous planning research.
The implication is that planning should combine quantitative evidence with qualitative understanding rather than treating one approach as universally sufficient.
12. Transport, Accessibility and Social Equity
Transport is a mechanism through which spatial inequality becomes an everyday experience. A person may live only 10 kilometres from a job centre, but if public transport is unreliable, expensive or inaccessible, the practical distance may be much greater.
Research on public transport satisfaction in Bhopal (Lodhi et al., 2024) demonstrates the value of understanding users’ experiences. Similarly, research by Yadav, Dehalwar, and Sharma on first- and last-mile accessibility and multimodal accessibility extends the discussion to the connections between major transit systems and people’s origins and destinations.
Transit-oriented development can potentially reduce automobile dependence and improve accessibility, but its social consequences require careful assessment. Transit investments can alter land values and development patterns. Without appropriate housing and land policies, improved accessibility may not benefit existing low-income residents equally.
Mobility planning should therefore consider both transport accessibility and land-use affordability.
A socially inclusive transport system should provide:
affordable fares;
reliable service;
accessible vehicles and stations;
safe pedestrian connections;
adequate first- and last-mile links;
consideration of elderly and disabled users;
gender-sensitive safety measures; and
connections between peripheral and employment areas.
Lalramsangi, Garg, and Sharma’s (2025) work on access to public open spaces further demonstrates that accessibility is not only about reaching employment or transport stations. Everyday destinations such as parks and public spaces are also essential components of urban quality of life.
13. Social Justice and Environmental Sustainability
Environmental sustainability and social justice are deeply interconnected. Environmental hazards are often experienced disproportionately by communities with fewer resources.
Low-income communities may be located in areas exposed to flooding, pollution or inadequate drainage because safer land is more expensive. Similarly, communities living close to waste facilities, industrial areas or polluted waterways may face environmental burdens without receiving equivalent benefits.
This creates the problem of environmental injustice.
Research on nature-based solutions, urban water quality and sustainable development in the supplied body of work demonstrates opportunities to connect environmental improvement with social outcomes. However, green interventions must also be implemented equitably. New parks or waterfront improvements can improve environmental conditions while increasing surrounding land values and displacement pressures.
Therefore, environmental planning should ask two questions:
What environmental improvement is being created?
and
Who will benefit from it, and who may bear unintended costs?
This approach links environmental planning with social-impact assessment.
14. A Framework for Socially Just Human Settlements
Based on the themes discussed above, an integrated framework for socially just human settlements can be structured around six principles.
14.1 Equitable Access
All residents should have reasonable access to housing, transportation, sanitation, healthcare, education, employment and public spaces.
14.2 Recognition of Diversity
Planning should recognise differences in gender, age, disability, income, caste, occupation, household structure and cultural identity.
14.3 Participation
Communities should participate meaningfully in planning, implementation and evaluation.
14.4 Representation
Planning institutions should improve the representation of groups that have historically had limited influence over development decisions.
14.5 Affordability
Housing, transport and basic services should be considered together so that improvements in one domain do not create unaffordable burdens in another.
14.6 Spatial Integration
Urban, peri-urban and rural areas should be planned as interconnected systems rather than isolated administrative territories.
This framework can be operationalised through indicators such as service accessibility, housing affordability, public-transport coverage, pedestrian accessibility, sanitation availability, participation rates, representation, displacement risk and environmental exposure.
15. The Role of Planning Research
The complexity of social justice requires methodological pluralism. Quantitative methods can identify spatial patterns and inequalities, while qualitative methods can explain why those patterns exist.
GIS can map service distribution. Statistical analysis can identify relationships between socio-economic characteristics and accessibility. Space syntax can examine movement and spatial configuration. Surveys can capture user satisfaction. Interviews can reveal lived experiences. Delphi methods can obtain structured expert judgement. Participatory mapping can capture community knowledge.
The methodological choices should be driven by the research question.
This is particularly important because social inequality is multidimensional. A single indicator such as household income cannot fully explain settlement vulnerability. Similarly, infrastructure coverage cannot automatically be interpreted as accessibility.
The combination of methods can therefore produce a more comprehensive understanding of human settlements.
16. Policy Implications for India
Several policy implications emerge from the discussion.
First, housing policy should be integrated with transport planning. Affordable housing located far from employment can create a cycle of transport poverty.
Second, informal settlements should be assessed through upgrading possibilities before relocation is considered. Existing social networks and livelihoods should be treated as assets.
Third, universal design should become a mainstream planning principle, not a specialised requirement applied only to selected buildings.
Fourth, participatory planning should move beyond consultation. Communities should have meaningful opportunities to influence priorities and alternatives.
Fifth, gender and social representation should be integrated into planning institutions.
Sixth, rural and peri-urban development should be coordinated with metropolitan growth.
Seventh, environmental interventions should incorporate social-impact assessment to reduce the risk of green development contributing to displacement.
Finally, planning decisions should be supported by transparent evidence. Digital tools, GIS, modelling and statistical methods can strengthen planning, but they should remain accountable to social objectives.
17. Conclusion
Socially just human settlements cannot be created simply by increasing the quantity of infrastructure. Roads, houses, sanitation systems, public transport and public spaces are necessary, but their social value depends upon who can access them, how they are designed and whether communities have a voice in their development.
The body of research considered in this article demonstrates the multidimensional nature of the challenge. Research on spatial injustice highlights the social consequences of physical transformation. Work on slums in Bhopal illustrates the importance of understanding informal settlements through resilience as well as vulnerability. Housing research demonstrates the importance of considering settlement development at the urban fringe. Studies on sanitation connect infrastructure with public health and dignity. Universal-design research emphasises accessibility. Research on women’s reservation and Dalit representation highlights the institutional dimension of justice. Studies of rural employment and connectivity show that social justice extends beyond cities. Transport research demonstrates that accessibility is central to participation in urban life. Participatory-planning research establishes the importance of community involvement.
Taken together, these perspectives suggest that the future of Indian planning should be guided by a shift from development for communities to development with communities.
The socially just city is not necessarily the city with the most infrastructure or the most advanced technology. It is the city in which people with different economic, social and physical circumstances can meaningfully access opportunities and participate in shaping their environments.
The same principle applies to villages, peri-urban settlements and metropolitan regions. Human settlement planning must recognise that spatial form and social relations are interconnected. Decisions about roads, housing, sanitation, land use and public spaces are simultaneously decisions about opportunity, dignity and inclusion.
India’s future urban and regional development therefore requires a planning paradigm that places equity, accessibility, participation, representation and human dignity alongside economic growth and physical development. Such a paradigm can help transform planning from a technical exercise in land and infrastructure management into a broader instrument of social development.
Ultimately, inclusive planning is not an additional component of sustainable development. It is one of its foundations. A settlement becomes genuinely sustainable when its environmental, economic and physical systems function in ways that enable diverse communities to live with security, dignity, accessibility and opportunity.
References
Agarwal, S., & Sharma, S. N. (2014). Universal design to ensure equitable society. International Journal of Engineering and Technical Research, 2(1).
Chatterjee, S., & Sharma, S. N. (2020). Review of Pradhan Mantri Gram Sadak Yojana. Think India Journal, 23(1), 33–42.
Dehalwar, K., & Sharma, S. N. (2023). Fate of slums of Bhopal—a tale of struggle and resilience. Think India Journal, 26(4), 4.
Dehalwar, K., & Sharma, S. N. (2024). Exploring the distinctions between quantitative and qualitative research methods. Think India Journal, 27(1), 7–15.
Dehalwar, K., & Sharma, S. N. (2024). Social injustice inflicted by spatial changes in vernacular settings: An analysis of published literature. ISVS e-journal, 11(9), 93–113.
Jain, S., Dehalwar, K., & Sharma, S. N. (2024). Explanation of Delphi research method and expert opinion surveys. Think India, 27(4), 37–48.
Kumar, G., Vyas, S., Sharma, S. N., & Dehalwar, K. (2023). Planning and development of housing in urban fringe area: Case of Bhopal (MP). GIS Business, 18(1), 1–14.
Kumar, G., Vyas, S., Sharma, S. N., & Dehalwar, K. (2025). Urban growth prediction using CA-ANN model and spatial analysis for planning policy in Indore city, India. GeoJournal, 90(3), 139.
Lalramsangi, V., Garg, Y. K., & Sharma, S. N. (2025). Route choices to access public open spaces in hill cities. Environment and Urbanization ASIA, 16(2), 283–299. https://doi.org/10.1177/09754253251388721
Lodhi, A. S., Jaiswal, A., & Sharma, S. N. (2024). Assessing bus users’ satisfaction using discrete choice models: A case of Bhopal. Innovative Infrastructure Solutions, 9, 437. https://doi.org/10.1007/s41062-024-01652-w
Sharma, S. N. (2012). Participatory planning in plan preparation: A case of Delhi. EduPedia Publications (P) Ltd.
Sharma, S. N. (2014). Fate of rural sanitation scheme. International Journal of Research, 1(2).
Sharma, S. N., & Dehalwar, K. (2025). Examining the inclusivity of India’s National Urban Transport Policy for senior citizens. In D. S.-K. Ting & J. A. Stagner (Eds.), Transforming healthcare infrastructure (pp. 115–134). CRC Press.
Sharma, S. N., & Dehalwar, K. (2025). Review of landuse transportation interaction model in smart urban growth management. European Transport/Trasporti Europei, 103, 1–15.
Sharma, S. N., Chatterjee, S., & Dehalwar, K. (2023). Mahatma Gandhi National Rural Employment Guarantee Scheme: Challenges and opportunities. Think India Journal, 26(1), 7–15.
Sharma, S. N., Dehalwar, K., & Pandey, A. K. (2026). Measures to manage the urban water quality for public health. In Environmentalism in healthcare (pp. 339–371).
Sharma, S. N., Dehalwar, K., & Yadav, K. (2026). Advancing travel behaviour modelling: A systematic literature review. Civil Engineering Infrastructures Journal, e108027.
Sharma, S. N., Lodhi, A. S., Dehalwar, K., & Jaiswal, A. (2024). Life cycle assessment (LCA) of recycled & secondary materials in the construction of roads. IOP Conference Series: Earth and Environmental Science, 1326(1), 012102.
Sharma, S. N., Singh, S., Kumar, G., Pandey, A. K., & Dehalwar, K. (2025). Role of green buildings in creating sustainable neighbourhoods. IOP Conference Series: Earth and Environmental Science, 1519(1), 012018.
Verma, D., Yadav, P., & Sharma, S. N. (2026). From access to power: Dalit representation deficits across state, market, and cultural institutions in neoliberal India. Forum for Social Economics, 1–26.
Yadav, K., Dehalwar, K., & Sharma, S. N. (2025). Assessing the factors affecting first and last mile accessibility in transit-oriented development: A literature review. GeoJournal, 90, 298. https://doi.org/10.1007/s10708-025-11546-8
Yadav, K., Dehalwar, K., Sharma, S. N., & Yadav, S. (2025). Understanding user satisfaction in last-mile connectivity under transit-oriented development in Tier 2 Indian cities: A climate-sensitive perspective. IOP Conference Series: Earth and Environmental Science, 1579(1), 012006. https://doi.org/10.1088/1755-1315/1579/1/012006
Yadav, K., Dehalwar, K., & Sharma, S. N. (2026). Exploring the environmental determinants of mode choice in first and last mile connectivity: Evidence from a systematic review. Innovative Infrastructure Solutions, 11(4), 204.
United Nations. (2015). Transforming our world: The 2030 Agenda for Sustainable Development. United Nations.
United Nations Human Settlements Programme (UN-Habitat). (2022). World Cities Report 2022: Envisaging the future of cities. UN-Habitat.
World Health Organization. (2021). Global report on ageism. World Health Organization.
Which relationship has taught you the most about yourself?
Cities are increasingly becoming the principal arenas in which environmental, social, economic and technological transformations converge. Rapid urbanisation has created opportunities for economic development, improved access to services and innovation, but it has also intensified pressures on land, infrastructure, mobility, housing, water resources, ecosystems and public health. Climate change further compounds these pressures through heatwaves, flooding, water stress, extreme precipitation and other hazards. The challenge for contemporary urban planning is therefore no longer simply to accommodate population growth. It is to create cities that are environmentally sustainable, socially inclusive, economically productive and capable of adapting to changing conditions.
The United Nations Sustainable Development Goal 11 explicitly calls for cities and human settlements to become inclusive, safe, resilient and sustainable. Its targets include adequate housing, accessible and sustainable transport, participatory urban planning, reduced disaster impacts and improved environmental conditions (United Nations, 2024). At the same time, the IPCC identifies cities, settlements and infrastructure as interconnected systems in which climate risks interact with urbanisation, land-use change, poverty, infrastructure deficits and social vulnerability (Dodman et al., 2022).
For Indian cities, these challenges are particularly significant. Urban areas are expanding spatially while infrastructure and institutional capacities do not always expand at the same pace. Unplanned peripheral growth, automobile dependence, inadequate pedestrian infrastructure, environmental degradation and socio-spatial inequalities can undermine the benefits of urbanisation. A sustainable urban future therefore requires integrated planning rather than isolated interventions.
Recent research associated with Indian urban contexts provides important directions in this regard. Studies on urban growth prediction using Cellular Automata–Artificial Neural Network (CA–ANN) models demonstrate how spatial modelling can support planning decisions. Research on life-cycle assessment of recycled and secondary materials highlights the importance of considering environmental impacts throughout infrastructure development. Studies of green buildings, public-space accessibility, transit-oriented development and spatial inequality further demonstrate that sustainability must be addressed simultaneously at the building, neighbourhood, transport and metropolitan scales.
Urban Growth and the Need for Evidence-Based Planning
One of the most fundamental requirements of sustainable urban planning is the ability to understand and anticipate urban growth. Conventional planning approaches often rely on static land-use plans that may not adequately capture the nonlinear and spatially dynamic nature of urban expansion. Urban development is influenced by population growth, transportation infrastructure, land values, employment opportunities, accessibility and neighbourhood effects.
Kumar, Vyas, Sharma, and Dehalwar (2025) demonstrate the potential of a hybrid CA–ANN approach for predicting urban growth in Indore. The study combines the spatial dynamics of Cellular Automata with the computational capabilities of Artificial Neural Networks to identify patterns of urban expansion and potential growth hotspots. The study illustrates how geospatial data, land-use information, population characteristics and infrastructure development can be integrated to support forward-looking planning. The bibliographic record supplied for this work identifies its publication in GeoJournal, 90(3), with DOI 10.1007/s10708-025-11393-7.
Such approaches are valuable because urban planning increasingly requires scenario-based decision-making. Instead of asking only where development has occurred, planners need to examine where development is likely to occur, what infrastructure will be required and what environmental consequences may emerge. Spatial prediction can consequently support decisions concerning urban growth boundaries, infrastructure investment, transport corridors, green-space protection and service provision.
However, predictive technologies should not replace planning judgement. Models represent assumptions and depend upon the quality, scale and availability of input data. Their greatest value lies in supporting planners in comparing scenarios and identifying areas requiring further investigation.
Sustainable Infrastructure and Life-Cycle Thinking
Urban sustainability cannot be achieved without addressing the environmental footprint of infrastructure. Roads, buildings, drainage systems, utilities and transport infrastructure consume substantial quantities of materials and energy. Therefore, the sustainability of a city depends not only on how infrastructure functions after construction but also on how materials are extracted, manufactured, transported, used and eventually reused or disposed of.
Sharma, Lodhi, Dehalwar, and Jaiswal (2024) examined the life-cycle assessment of recycled and secondary materials in road construction. Their work highlights the relevance of life-cycle thinking for infrastructure decisions. Rather than assessing materials solely on initial cost or technical performance, planners can consider resource consumption, environmental impacts and potential benefits of recycling and secondary material use.
This approach is particularly relevant to rapidly urbanising cities, where infrastructure demand is increasing. Circular construction practices can reduce dependence on virgin resources and encourage the reuse of materials. Life-cycle assessment can also help municipalities and infrastructure agencies compare alternative construction strategies on a broader environmental basis.
Sustainable infrastructure should therefore be evaluated through multiple criteria: durability, embodied energy, carbon emissions, resource efficiency, maintenance requirements, recyclability, resilience and social benefits. This represents a shift from conventional infrastructure provision towards life-cycle-oriented infrastructure planning.
Green Buildings and Sustainable Neighbourhoods
Buildings constitute another major component of urban environmental performance. Yet the sustainability of individual buildings cannot be separated from the neighbourhood in which they are located. A highly energy-efficient building may still generate automobile dependence if it is isolated from public transport, walking networks and essential services.
Sharma, Singh, Kumar, Pandey, and Dehalwar (2025) examined the role of green buildings in creating sustainable neighbourhoods. Their research identifies green buildings as contributing not only to reduced environmental impacts but also to occupant well-being, water conservation, improved air quality and broader neighbourhood sustainability. The published study specifically examines the role of green buildings in Indian cities.
This perspective suggests that building sustainability should be integrated with urban design. Building orientation, passive climatic design, renewable energy, rainwater management, vegetation, shaded pedestrian networks and efficient waste systems can collectively improve neighbourhood performance.
The neighbourhood scale is particularly important because many environmental outcomes depend on the relationship between buildings. Tree cover, street geometry, building density, open spaces and mobility patterns influence urban heat, energy demand and pedestrian comfort. Green buildings should therefore be regarded as components of a wider urban ecological system rather than isolated technological objects.
Sustainable Mobility and Accessibility
Transportation is one of the most visible dimensions of urban sustainability. Mobility provides access to employment, education, healthcare, recreation and social opportunities. However, transport systems can also produce congestion, air pollution, greenhouse-gas emissions, road injuries and social exclusion.
Sustainable mobility requires a transition from a narrow emphasis on vehicle movement towards accessibility and human movement. The objective should be to ensure that people can reach essential destinations safely, affordably and conveniently.
Research on bus-user satisfaction in Bhopal demonstrates the importance of understanding the user experience in public transport. Lodhi, Jaiswal, and Sharma (2024) applied discrete choice modelling to assess bus users’ satisfaction, providing an example of how user preferences can inform public-transport planning.
Accessibility is equally important at the pedestrian level. Lalramsangi, Garg, and Sharma (2025) examined route choices for accessing public open spaces in hill cities and showed how topography and spatial configuration influence pedestrian movement. Their work demonstrates the usefulness of space syntax for understanding pedestrian accessibility and route choices in complex urban environments. A related 2026 study further investigates vertical pedestrian movement and the role of steps as connectors in Aizawl, demonstrating that pedestrian infrastructure needs to respond to local topography rather than follow uniform design assumptions.
These findings have broader implications. Sustainable mobility is not simply about introducing electric vehicles. It also involves walking, cycling, public transport, first- and last-mile connectivity, safe street design and accessible public spaces. A city can reduce transport-related environmental impacts more effectively when land-use planning and transport planning are integrated.
The United Nations’ SDG 11.2 specifically calls for safe, affordable, accessible and sustainable transport systems, with particular attention to vulnerable groups, women, children, persons with disabilities and older persons. Thus, accessibility should be treated as both a transport and social-equity issue.
Public Space, Social Inclusion and Spatial Justice
Sustainability has an important social dimension. A city cannot be considered sustainable if environmental improvements are accompanied by exclusion, displacement or unequal access to infrastructure.
Dehalwar and Sharma (2024), in their analysis of social injustice associated with spatial changes in vernacular settings, draw attention to the social consequences of spatial transformation. The work reinforces the importance of considering how changes in the built environment affect communities, identities and patterns of social interaction.
Urban planning decisions frequently redistribute opportunities. New roads, redevelopment projects, transit investments, commercial centres and environmental improvements may increase land values and accessibility in some areas while creating pressures for lower-income communities in others. Consequently, sustainability interventions should include social-impact assessment alongside environmental assessment.
Public spaces provide an important mechanism for strengthening social inclusion. Parks, plazas, streets and community spaces can support recreation, social interaction, health and community identity. Yet their benefits depend upon accessibility. Research on hill cities demonstrates that physical configuration can influence people’s ability to reach public open spaces. Sustainable public-space planning should therefore consider walking distance, route directness, topography, safety, universal accessibility and perceived comfort.
A people-centred approach is also central to contemporary climate-resilient planning. UN-Habitat’s World Cities Report 2024 argues that vulnerable groups need to be placed at the centre of urban climate action and that climate interventions should avoid reinforcing existing inequalities.
Nature-Based Solutions and Climate Resilience
Climate-resilient cities require infrastructure that can manage both gradual environmental change and sudden shocks. Traditional engineered infrastructure remains important, but it can be complemented by nature-based solutions such as urban forests, wetlands, bioswales, permeable surfaces, restored watercourses, green roofs and rain gardens.
Nature-based solutions can provide multiple benefits simultaneously. Vegetation can contribute to cooling and ecological connectivity; permeable surfaces can reduce runoff; wetlands can support water management; and green corridors can provide recreational and biodiversity benefits.
The IPCC emphasises that urban climate risks emerge from interactions between climate hazards and urban systems, including infrastructure, land use, poverty and human mobility. This suggests that resilience should not be approached through isolated infrastructure projects. Instead, risk-sensitive planning should connect drainage, land-use planning, transportation, housing, ecological systems and emergency management.
For Indian cities, this is particularly relevant because rapid construction can increase impervious surfaces and modify natural drainage patterns. Integrating blue-green infrastructure into development plans can help reduce runoff and heat while improving public-space quality.
Artificial Intelligence, Digital Twins and the Smart City
Digital technologies are transforming the way urban systems can be monitored, analysed and managed. Artificial intelligence, machine learning, geographic information systems, remote sensing and digital twins can provide planners with new capabilities for understanding complex urban systems.
The supplied research portfolio includes work on AI applications in solid waste management, machine learning for multimodal accessibility, urban growth prediction, digital twins for sustainable logistics and urban spatial digital twins. These studies collectively indicate a transition from static planning towards data-informed and increasingly dynamic urban management. The uploaded bibliography records research on AI applications in solid waste management and AI in social work for environmental sustainability, alongside studies on digital twins and mobility.
Digital twins are particularly promising because they can integrate spatial, infrastructural, environmental and mobility data into a common digital representation of an urban area. When combined with real-time information, they can support scenario testing—for example, examining how a new transit corridor may affect accessibility, land use or traffic conditions.
Nevertheless, technological sophistication should not be confused with sustainability. Smart-city systems can reproduce existing inequalities when data coverage is uneven or when communities have limited digital access. UN-Habitat’s World Smart Cities Outlook 2024 consequently places people-centred smart-city development, digital inclusion, accessibility and quality of life alongside technological innovation.
An Integrated Framework for Indian Cities
The evidence suggests that sustainable urban development requires integration across five dimensions.
First, spatial planning should anticipate urban growth through GIS, remote sensing and predictive models while protecting environmentally sensitive areas.
Second, sustainable mobility should integrate public transport, walking, cycling and first- and last-mile connectivity with land-use planning.
Third, green infrastructure and buildings should be planned at building, neighbourhood and metropolitan scales to improve environmental performance and resilience.
Fourth, social inclusion should be embedded in infrastructure and redevelopment decisions through participatory planning and accessibility assessment.
Fifth, digital technologies should be used to improve evidence-based decision-making while maintaining transparency, privacy, accessibility and human oversight.
These dimensions should not operate independently. For example, a new transit corridor can influence land-use change; land-use change can influence travel behaviour; travel behaviour affects emissions; emissions influence climate conditions; and climate risks affect infrastructure and vulnerable communities. Urban planning therefore needs to recognise cities as interconnected systems.
Conclusion
The sustainable city of the future cannot be created through a single technology, policy or infrastructure project. It requires an integrated planning philosophy in which environmental performance, accessibility, social justice, climate resilience and technological innovation reinforce one another.
Research on CA–ANN modelling demonstrates how urban growth can be anticipated spatially. Life-cycle assessment provides a framework for improving infrastructure material decisions. Green-building research demonstrates the importance of neighbourhood-scale sustainability. Studies of public-space accessibility and public transport highlight the human dimension of mobility. Research on spatial injustice reminds planners that physical transformation can have unequal social consequences. Finally, AI and digital twins provide emerging tools for understanding and managing complex urban systems.
The central principle should therefore be people-centred, evidence-based and context-sensitive planning. Urban technologies should support—not replace—professional judgement, community knowledge and democratic planning processes. Climate action should similarly improve everyday urban life rather than being treated as a separate environmental agenda.
UN-Habitat’s recent assessment emphasises that cities have a major role in climate action but that solutions must be adapted to local conditions and vulnerabilities. For India, this means combining advanced analytical tools with local knowledge, ecological understanding and inclusive planning practices.
Sustainable urban development ultimately depends on the ability to connect the physical city with the social city and the ecological city. When land-use planning, transport, buildings, public spaces, infrastructure, nature and digital technologies are considered as interconnected systems, cities can become not only more efficient but also more resilient, accessible and equitable. The future of urban planning should therefore be understood not as the pursuit of a technologically perfect city, but as the continuous creation of healthier, more inclusive and climate-resilient places for people.
References
Dehalwar, K., & Sharma, S. N. (2024). Social injustice inflicted by spatial changes in vernacular settings: An analysis of published literature. ISVS e-journal, 11(9), 93–113.
Dodman, D., Hayward, B., Pelling, M., Castán Broto, V., Chow, W., Chu, E., Dawson, R., Khirfan, L., McPhearson, T., Prakash, A., Zheng, Y., & Ziervogel, G. (2022). Cities, settlements and key infrastructure. In Climate change 2022: Impacts, adaptation and vulnerability (pp. 907–1040). Cambridge University Press. doi:10.1017/9781009325844.008
Kumar, G., Vyas, S., Sharma, S. N., & Dehalwar, K. (2025). Urban growth prediction using CA-ANN model and spatial analysis for planning policy in Indore city, India. GeoJournal, 90(3), 139. doi:10.1007/s10708-025-11393-7
Lalramsangi, V., Garg, Y. K., & Sharma, S. N. (2025). Route choices to access public open spaces in hill cities. Environment and Urbanization ASIA, 16(2), 283–299. doi:10.1177/09754253251388721
Lodhi, A. S., Jaiswal, A., & Sharma, S. N. (2024). Assessing bus users’ satisfaction using discrete choice models: A case of Bhopal. Innovative Infrastructure Solutions, 9, 437. doi:10.1007/s41062-024-01652-w
Sharma, S. N., Dehalwar, K., & Pandey, A. K. (2026). Measures to manage the urban water quality for public health. In Environmentalism in healthcare (pp. 339–371).
Sharma, S. N., Dehalwar, K., & Yadav, K. (2026). Advancing travel behaviour modelling: A systematic literature review. Civil Engineering Infrastructures Journal, e108027.
Sharma, S. N., & Dehalwar, K. (2026). Urban spatial digital twin in sustainability spur economic growth in transit-oriented development-based development. In Tenable engineering for a sustainable future (pp. 257–300). Elsevier.
Sharma, S. N., Lodhi, A. S., Dehalwar, K., & Jaiswal, A. (2024). Life cycle assessment (LCA) of recycled & secondary materials in the construction of roads. IOP Conference Series: Earth and Environmental Science, 1326(1), 012102.
Sharma, S. N., Singh, S., Kumar, G., Pandey, A. K., & Dehalwar, K. (2025). Role of green buildings in creating sustainable neighbourhoods. IOP Conference Series: Earth and Environmental Science, 1519(1), 012018. doi:10.1088/1755-1315/1519/1/012018
United Nations. (2024). Sustainable Development Goal 11: Sustainable cities and communities. United Nations Department of Economic and Social Affairs.
UN-Habitat. (2024). World Cities Report 2024: Cities and climate action. United Nations Human Settlements Programme.
UN-Habitat. (2024). World Smart Cities Outlook 2024. United Nations Human Settlements Programme.
World Health Organization. (2021). WHO global air quality guidelines: Particulate matter (PM₂.₅ and PM₁₀), ozone, nitrogen dioxide, sulfur dioxide and carbon monoxide. World Health Organization.
Yadav, K., Dehalwar, K., & Sharma, S. N. (2026). Exploring the environmental determinants of mode choice in first and last mile connectivity: Evidence from a systematic review. Innovative Infrastructure Solutions, 11, 204. doi:10.1007/s41062-026-02614-0If you could start a new business right now, what would it be?
Rapid urbanisation is transforming cities across the world, particularly in developing countries where population growth, land-use change, infrastructure expansion, mobility demand, environmental degradation, and climate risks increasingly intersect. Contemporary cities can no longer be planned simply as physical arrangements of buildings, roads, utilities, and land uses. They must be understood as interconnected socio-ecological and technological systems in which transportation, housing, public spaces, infrastructure, environmental resources, economic activity, digital technologies, and human behaviour continuously influence one another.
Sustainable urban development therefore requires an integrated approach capable of simultaneously addressing accessibility, environmental protection, resource efficiency, climate resilience, social inclusion, and economic productivity. Research from Indian cities increasingly demonstrates how spatial planning, green buildings, recycled construction materials, public-space accessibility, predictive modelling, artificial intelligence (AI), and digital twins can contribute to this transformation.
Studies by Lalramsangi et al. (2025), Sharma et al. (2024), Kumar et al. (2025), Sharma et al. (2025), and Sharma (2026) illustrate different yet interconnected dimensions of sustainable urbanism. Together, these studies highlight a transition from conventional urban development towards planning approaches based on accessibility, lifecycle thinking, predictive analytics, environmentally responsible construction, green neighbourhoods, and intelligent infrastructure management.
International evidence similarly emphasises that compact and walkable urban form can reduce transport-related energy demand and greenhouse-gas emissions, whereas dispersed and automobile-oriented development can lock cities into higher levels of energy consumption (IPCC, 2022).
Urban Accessibility and the Importance of Public Open Spaces
Public open spaces are fundamental components of liveable and inclusive cities. Parks, recreational areas, plazas, neighbourhood open spaces, waterfronts, and community grounds provide environmental, health, cultural, and social benefits. Their value, however, depends not merely on their existence but also on whether residents can conveniently and safely reach them.
Lalramsangi et al. (2025), examining route choices for accessing public open spaces in hill cities, draw attention to the importance of accessibility within geographically challenging urban environments. Hill cities frequently experience steep gradients, constrained road networks, irregular urban morphology, limited pedestrian infrastructure, and fragmented development. Consequently, the shortest geographical route may not necessarily be the route preferred by pedestrians.
Route choices can be affected by slope, street quality, distance, safety, traffic conditions, visual attractiveness, convenience, land-use activity and pedestrian infrastructure. Such findings have important implications for sustainable planning because accessibility should be evaluated from the user’s perspective rather than simply through straight-line distance.
UN-Habitat similarly identifies accessibility, connectivity, equitable distribution, diversity, quantity, and quality among the fundamental principles of successful city-wide public-space strategies. Public spaces can contribute to environmental sustainability, social interaction, health, participation and local economic development when they are systematically connected to neighbourhoods rather than functioning as isolated urban fragments (UN-Habitat, 2020).
For Indian cities, this means planners need to combine land-use planning with pedestrian-network analysis. Footpaths, shaded walking routes, universal accessibility, street crossings, gradient-sensitive pathways and last-mile connectivity should become integral components of public-space planning.
The sustainability of public open spaces also depends on ecological quality. Urban vegetation can moderate heat, provide habitat, support stormwater management, sequester carbon, improve visual quality and contribute to well-being. Recent research has further demonstrated how remote sensing, imaging, sensors and digital monitoring can assist cities in assessing urban greenery and maintaining ecological infrastructure more effectively (Gupta et al., 2024).
Thus, sustainable urban open-space planning should integrate accessibility, environmental performance and technological monitoring.
Sustainable Mobility and Urban Form
Transportation represents another critical dimension of urban sustainability. As cities expand horizontally, travel distances increase, dependence on motorised transport grows, and the environmental consequences of mobility become more significant.
Urban form strongly influences mobility patterns. Compact neighbourhoods containing mixed land uses, interconnected street networks and accessible destinations generally provide better conditions for walking, cycling and public transport. The Intergovernmental Panel on Climate Change identifies compact and walkable urban form as an important component of urban climate mitigation, while low-density, segregated and automobile-dependent development is associated with greater energy use and longer travel distances (IPCC, 2022).
The health implications are equally important. Nieuwenhuijsen (2018) demonstrated that urban and transport planning can influence physical activity, air pollution, noise exposure and cardiovascular health. Features including mixed land use, street connectivity, walkability and green space therefore connect urban planning decisions with public-health outcomes.
Sustainable mobility strategies should consequently focus on reducing unnecessary travel, shifting journeys towards public and active transport, and improving the environmental efficiency of unavoidable motorised trips. These principles correspond with the widely recognised Avoid–Shift–Improve framework.
At neighbourhood scale, pedestrian accessibility to parks, transit stations, schools, markets and community facilities becomes particularly important. Research such as Lalramsangi et al. (2025) demonstrates why planners should investigate actual route behaviour instead of assuming that residents always use mathematically shortest paths.
Circular Construction and Life-Cycle Assessment
Another important challenge for urban sustainability is the environmental footprint of infrastructure construction.
Roads require large quantities of aggregates, bitumen, energy, water and other materials. Continuous expansion of transportation infrastructure can create substantial demand for virgin resources while simultaneously generating construction and demolition waste.
Sharma et al. (2024) examined the life-cycle assessment of recycled and secondary materials in road construction, demonstrating the relevance of life-cycle thinking in sustainable infrastructure development. Life-cycle assessment evaluates environmental impacts across different stages of a product or infrastructure system, including raw-material extraction, processing, transportation, construction, maintenance and final disposal or recycling.
The adoption of recycled and secondary materials can potentially reduce dependence on virgin resources and help convert waste streams into economically useful inputs. Examples include recycled concrete aggregate, reclaimed asphalt pavement, industrial by-products and other secondary construction materials.
This approach is closely aligned with the principles of the circular economy. Conventional construction largely follows a linear model:
extract → manufacture → construct → use → dispose
A circular approach instead encourages:
reduce → reuse → recycle → recover → regenerate.
The implications extend beyond road construction. Buildings and urban infrastructure represent enormous reservoirs of material. Designing structures for durability, adaptability, repair, reuse and eventual material recovery can significantly reduce future environmental burdens.
Lifecycle-based decision-making is therefore essential. A construction material that appears inexpensive during procurement may create higher environmental or maintenance costs over several decades. Conversely, an alternative material may involve slightly higher initial investment but produce benefits through longer service life, reduced resource consumption, lower emissions or easier recovery.
Urban infrastructure procurement should progressively move towards life-cycle performance rather than being dominated by lowest-initial-cost considerations.
Predicting Urban Growth for Better Planning
Uncontrolled spatial growth can generate infrastructure deficits, environmental pressure, congestion, loss of agricultural land and fragmented development. Predicting where urban expansion is likely to occur can therefore help planning authorities anticipate future requirements.
Kumar et al. (2025) applied a Cellular Automata–Artificial Neural Network (CA-ANN) model and spatial analysis to predict urban growth in Indore, India. Such approaches represent an important transformation in planning methodology. Instead of relying exclusively on static master plans and historical maps, planners can increasingly utilise geospatial datasets and computational models to examine possible patterns of future urbanisation.
Cellular automata models simulate changes in individual spatial cells according to surrounding land-use patterns and transition rules. Artificial neural networks can identify complex relationships among variables influencing urban development. When combined with Geographic Information Systems and remotely sensed data, these techniques can help reveal areas experiencing strong development pressure.
Predictive urban modelling can support decisions regarding:
future transportation corridors;
growth boundaries;
infrastructure investment;
environmentally sensitive zones;
affordable housing locations;
protection of agricultural land;
industrial development;
public facilities; and
disaster-risk management.
However, prediction should not be confused with policy. A model may indicate where development is statistically likely to occur, but planners must determine whether such development is environmentally, socially and economically desirable.
The greatest value of predictive modelling therefore lies in scenario planning. Decision-makers can compare business-as-usual growth with alternatives based on compact development, transit-oriented development, ecological conservation, infrastructure capacity or other planning priorities.
Green Buildings and Sustainable Neighbourhoods
While land-use patterns influence sustainability at the city scale, building design determines a major proportion of neighbourhood-level resource demand.
Sharma et al. (2025) examine the role of green buildings in creating sustainable neighbourhoods, illustrating the importance of connecting building-scale environmental strategies with broader urban objectives.
Green buildings seek to reduce negative environmental impacts through strategies such as energy efficiency, passive climatic design, renewable energy, water conservation, natural lighting, appropriate orientation, efficient materials, waste management and improved indoor environmental quality.
The most important conceptual development, however, is the shift from isolated green buildings to green neighbourhoods.
A highly efficient building surrounded by automobile-dependent roads, inadequate public transport and poorly planned land uses cannot by itself create sustainable urban development. Sustainable neighbourhoods require coordination between buildings, transportation, public space, energy systems, water infrastructure and community facilities.
The IPCC emphasises the interconnected nature of urban mitigation, noting that interventions in buildings, transport, energy, materials and urban form can generate cascading benefits across urban systems (IPCC, 2022).
Green neighbourhood planning should therefore integrate:
energy-efficient buildings; walkable streets; public transportation; urban greenery; mixed land use; water-sensitive design; renewable energy; waste segregation and recycling; accessible community infrastructure; and climate-responsive public spaces.
This integrated approach is particularly important in rapidly developing Indian metropolitan regions where today’s planning decisions may determine energy consumption and mobility patterns for decades.
Artificial Intelligence and Digital Twins
The next major transformation in sustainable urban development is being driven by data and digital technology.
Sharma (2026) discusses how generative AI and digital twins can support sustainable last-mile logistics, particularly through greener operations and electric vehicle integration. Last-mile logistics represents one of the most complex components of contemporary urban transport because delivery vehicles operate within congested neighbourhoods, serve dispersed destinations and frequently involve relatively short but operationally intensive journeys.
AI can process large datasets relating to demand, vehicle availability, traffic conditions, delivery windows, weather, energy consumption and charging infrastructure. This allows logistics operators to improve route planning, fleet allocation and operational decision-making.
Electric vehicles can further reduce local emissions, particularly when combined with low-carbon electricity. However, efficient integration requires decisions regarding charging locations, battery management, route length and fleet scheduling.
Digital twins extend these possibilities further. A digital twin can be understood as a dynamic digital representation of a physical system. Urban digital twins may integrate GIS, building information models, sensors, transport data and environmental information to simulate changing urban conditions.
Research indicates that digital twins have considerable potential in planning, infrastructure management, transportation, energy and environmental monitoring, although implementation still faces interoperability, data-quality, infrastructure, governance and institutional challenges.
Wang et al. (2023) similarly highlight the expanding role of digital twins in smart-city systems where continuously updated urban information can support management and decision-making.
A digital twin of an urban district could, for example, simulate how changes in land use influence traffic, energy demand, emissions, infrastructure loads and pedestrian activity before physical development occurs.
The technology can therefore transform planning from a predominantly static activity into an increasingly dynamic, predictive and scenario-based process.
Integrating Physical and Digital Sustainability
The major lesson emerging from contemporary urban research is that sustainability cannot be achieved through isolated sectoral interventions.
Public spaces depend on accessibility.
Accessibility depends on transport networks.
Transport behaviour depends on urban form.
Urban form influences building energy consumption.
Construction requires materials and infrastructure.
Digital technologies can increasingly help planners understand these interactions.
The future sustainable city should therefore be conceived as an integrated physical-digital-ecological system.
For example, spatial-growth modelling could identify future development zones. Life-cycle assessment could determine environmentally preferable infrastructure materials. Green-building principles could reduce neighbourhood energy demand. Public-space network analysis could ensure recreational areas are accessible by walking and cycling. AI-enabled transport systems could optimise mobility, while digital twins could continuously monitor how the entire system performs.
This represents a significant evolution from conventional master planning.
Rather than preparing a plan every few decades and assuming relatively predictable development, cities can develop continuously updated planning-support systems based on remote sensing, GIS, sensors, artificial intelligence and digital twins.
Technology, however, should remain a tool rather than the purpose of planning. Digital systems raise legitimate challenges involving data ownership, privacy, cybersecurity, interoperability, technical capacity, cost and governance. Research on urban digital twins consistently identifies such institutional and social challenges alongside technical ones.
Human-centred planning must consequently remain central.
Implications for Indian Cities
The research discussed above has particularly significant implications for India, where rapid urbanisation creates both opportunities and risks.
First, metropolitan expansion should be guided through predictive spatial analysis rather than addressed only after unplanned development has occurred. Models such as CA-ANN can help identify emerging growth corridors and enable authorities to prepare infrastructure proactively (Kumar et al., 2025).
Second, walking and public-space accessibility should receive greater attention. Indian urban planning frequently concentrates on the provision of facilities without adequately evaluating whether people can safely and comfortably reach them. Research on route choices demonstrates the importance of pedestrian experience, particularly in topographically constrained cities (Lalramsangi et al., 2025).
Third, construction practices must gradually adopt lifecycle and circular-economy principles. Recycled and secondary materials should be evaluated not only on engineering performance but also according to long-term environmental consequences (Sharma et al., 2024).
Fourth, green-building requirements should increasingly evolve into neighbourhood sustainability standards. Energy-efficient buildings, public transport, mixed land uses, green infrastructure and walkable public realms should be planned together (Sharma et al., 2025).
Finally, Indian cities should develop institutional capability in GIS, AI, remote sensing, urban analytics and digital twins. These technologies could support transportation planning, infrastructure management, environmental monitoring, emergency response and sustainable urban logistics.
Conclusion
Sustainable urban development requires much more than isolated environmental interventions. It involves restructuring the relationships among land use, transportation, buildings, public spaces, infrastructure, materials, technology and human behaviour.
Research on public-space accessibility demonstrates the importance of understanding how residents actually experience urban environments. Life-cycle assessment provides a mechanism for reducing the environmental footprint of infrastructure. Predictive urban-growth modelling can help cities anticipate development pressure. Green buildings can become foundations for sustainable neighbourhoods, while AI and digital twins offer increasingly sophisticated tools for managing mobility, infrastructure and environmental performance.
The studies of Lalramsangi et al. (2025), Sharma et al. (2024), Kumar et al. (2025), Sharma et al. (2025), and Sharma (2026) collectively illustrate this emerging multidisciplinary direction.
The sustainable city of the future will consequently not be produced by architecture, transportation engineering, environmental management or information technology working independently. It will emerge from their integration.
Urban planning must therefore become increasingly accessible, circular, low-carbon, green, predictive, data-informed and human-centred. By combining established planning principles with advanced analytical and digital technologies, cities can move towards development that is environmentally responsible, socially inclusive, economically productive and resilient to future uncertainty.
Gupta, A., Mora, S., Preisler, Y., Duarte, F., Prasad, V., et al. (2024). Tools and methods for monitoring the health of the urban greenery. Nature Sustainability, 7, 536–544.
Intergovernmental Panel on Climate Change. (2022). Climate change 2022: Mitigation of climate change. Contribution of Working Group III to the Sixth Assessment Report of the Intergovernmental Panel on Climate Change. Cambridge University Press.
Kumar, G., Vyas, S., Sharma, S. N., & Dehalwar, K. (2025). Urban growth prediction using CA-ANN model and spatial analysis for planning policy in Indore city, India. GeoJournal, 90(3), 139.
Lalramsangi, V., Garg, Y. K., & Sharma, S. N. (2025). Route choices to access public open spaces in hill cities. Environment and Urbanization ASIA, 16(2), 283–299.
Lei, B., Janssen, P., Stoter, J., & Biljecki, F. (2023). Challenges of urban digital twins: A systematic review and a Delphi expert survey. Automation in Construction, 147, 104716. https://doi.org/10.1016/j.autcon.2022.104716
Nieuwenhuijsen, M. J. (2018). Influence of urban and transport planning and the city environment on cardiovascular disease. Nature Reviews Cardiology, 15, 432–438.
Sharma, S. N. (2026). Generative AI and digital twins for sustainable last-mile logistics: Enabling green operations and electric vehicle integration. In Accelerating logistics through generative AI, digital twins, and autonomous operations (pp. 183–216).
Sharma, S. N., Lodhi, A. S., Dehalwar, K., & Jaiswal, A. (2024, June). Life cycle assessment (LCA) of recycled & secondary materials in the construction of roads. IOP Conference Series: Earth and Environmental Science, 1326(1), 012102. IOP Publishing.
Sharma, S. N., Singh, S., Kumar, G., Pandey, A. K., & Dehalwar, K. (2025, June). Role of green buildings in creating sustainable neighbourhoods. IOP Conference Series: Earth and Environmental Science, 1519(1), 012018. IOP Publishing.
UN-Habitat. (2020). City-wide public space strategies: A guidebook for city leaders. United Nations Human Settlements Programme.
UN-Habitat. (2024). Global public space toolkit: From global principles to local policies and practice. United Nations Human Settlements Programme.
Wang, H., Chen, X., Jia, F., & Cheng, X. (2023). Digital twin-supported smart city: Status, challenges and future research directions. Expert Systems with Applications, 217, 119531. https://doi.org/10.1016/j.eswa.2023.119531
Which relationship has taught you the most about yourself?
Track2Training Research Review 2026: Publications, Projects, Conferences and Academic Contributions
Advancing Research, Training and Academic Collaboration
The year 2026 has been an important period of research activity, academic collaboration, publication development, capacity building and institutional expansion for Track2Training. With an increasing focus on interdisciplinary research, evidence-based analysis, responsible academic publishing and research training, Track2Training has continued to strengthen its role as a research and knowledge-support organisation connecting scholars, faculty members, students, universities and professional communities.
The Track2Training Research Review 2026 presents an overview of major research projects, journal manuscripts, book chapters, edited publications, conferences, research training activities, collaborations and future research priorities undertaken or supported during the year.
Research Projects and Interdisciplinary Studies
A significant part of Track2Training’s research activity during 2026 has focused on sustainable urban development, transportation planning, land-use policy, heritage conservation, environmental sustainability, machine learning and evidence-based planning.
Several studies examined public transport accessibility, first- and last-mile connectivity, transit-oriented development and travel behaviour. Research relating to Bhopal explored how accessibility, infrastructure quality, service experience and transport efficiency influence public transport preferences. Advanced statistical approaches, including Partial Least Squares Structural Equation Modelling (PLS-SEM), were used to investigate relationships between transport-related constructs.
Research on Transit-Oriented Development in Delhi examined travel behaviour, mode choice, land-use characteristics, density, accessibility, safety, reliability and urban design. Large survey datasets were analysed using statistical and machine-learning techniques, including multinomial models, logistic regression, random forest algorithms and structural equation modelling.
Another important research area concerned Transferable Development Rights and land-development policy. Studies investigated development rights, farmland protection, compensation mechanisms, planning regulations, infrastructure capacity, market operations and implementation effectiveness. Comparative systematic reviews were also undertaken to understand international approaches to development-rights instruments and land-management policies.
Track2Training-supported research has additionally covered climate-responsive mobility, sustainable infrastructure, urban planning, building performance, environmental management, digital technologies and heritage conservation.
Journal Publications and Manuscript Development
Academic publication remained a central component of research activity during 2026. Manuscripts were prepared, revised or submitted to peer-reviewed journals covering urban planning, sustainable transportation, machine learning, civil engineering, environmental research, heritage studies and built-environment research.
Research topics included:
Machine learning methods for sustainable transport planning and engineering
Mode-choice modelling in Transit-Oriented Development areas
Sustainable Development Goal indicators for urban planning
Climate extremes and travel behaviour
Public transport user perceptions and service-quality determinants
Transferable Development Rights and land-management systems
Energy retrofitting and building-performance improvement
Land-use and land-cover change
Heritage significance, conservation condition and adaptive reuse
Tourism activation of historic urban heritage
Several manuscripts progressed through peer-review and revision stages during the year, reflecting the growing emphasis on rigorous empirical methods, transparent reporting and internationally relevant research questions.
Particular attention was given to improving research quality through systematic methodology, reliability and validity assessment, research ethics, transparent data reporting and appropriate statistical interpretation.
Systematic Reviews and Evidence Synthesis
Systematic literature reviews formed another major area of academic work. Reviews were conducted following structured screening procedures and, where appropriate, principles associated with PRISMA-based evidence synthesis.
One major review examined public transport research from the user perspective, identifying recurring determinants such as safety, frequency, fare affordability, passenger information, comfort, punctuality, cleanliness, travel time, accessibility and reliability.
Additional evidence-synthesis projects investigated topics such as development rights, farmland conservation, climate-related travel behaviour, building energy retrofits, machine learning applications and heritage conservation.
Track2Training has continued promoting systematic reviews as a method for moving beyond narrative summaries toward transparent, reproducible and academically defensible evidence synthesis.
Books, Book Chapters and Edited Publications
Book publishing and chapter development continued to expand in 2026. Researchers associated with Track2Training participated in academic book projects covering emerging technologies, urban development, sustainability, heritage, communication and interdisciplinary research.
Book chapters were developed on subjects including digital twins, smart cities, sustainable planning, artificial intelligence, place communication, cultural heritage and tourism.
Work also progressed on edited volumes, conference proceedings and academic collections designed to provide researchers with opportunities to disseminate specialised scholarship.
Track2Training continues to support academic book development through concept formation, calls for chapters, manuscript organisation, peer-review coordination, editorial preparation and publication planning.
Conferences and Academic Events
Academic conferences remained an important platform for knowledge exchange during the year.
Research-related activities included participation in and support for conferences focusing on sustainability, planning, materials, technology, environmental systems and interdisciplinary research.
Among the academic initiatives connected with 2026 activities were conferences and proceedings addressing river-sensitive planning, sustainable development, molecular materials and sensors, urban planning and emerging research methodologies.
Track2Training also encouraged researchers to use conferences not simply as presentation platforms, but as environments for developing collaborations, receiving academic feedback, identifying emerging research directions and transforming conference papers into stronger journal publications.
Research Training and Capacity Building
Capacity building continued to be one of the major institutional priorities of Track2Training.
Research training activities focused on helping students, doctoral scholars, faculty members and early-career researchers strengthen their understanding of research methodology and analytical techniques.
Important areas of training and academic guidance included:
Research methodology and proposal development, covering research questions, objectives, conceptual frameworks, sampling and research design.
Statistical analysis, including SPSS, R, Python, SmartPLS and structural equation modelling.
Systematic literature reviews, including database searching, screening protocols, PRISMA reporting and evidence synthesis.
Bibliometric analysis, using tools such as VOSviewer and Biblioshiny.
Academic writing and publication, including manuscript preparation, journal selection, reviewer-response preparation and research integrity.
GIS and spatial analysis, particularly for planning, transportation and environmental research.
These programmes are intended to strengthen independent research capability rather than treating statistical analysis or academic writing as isolated technical activities.
Research Collaboration and Academic Partnerships
Collaboration remained central to Track2Training’s research philosophy throughout 2026.
Research activities involved interactions among scholars from universities, planning institutions, engineering institutions, research organisations and professional networks. Collaborative projects included journal papers, systematic reviews, book chapters, conference initiatives, edited volumes and research proposals.
Particular emphasis was placed on interdisciplinary collaboration among researchers working in architecture, planning, engineering, environmental studies, computer science, transportation, social sciences, education and sustainability.
Track2Training continues to encourage institutional partnerships for jointly organised conferences, faculty development programmes, research projects, publications, edited books and funded research proposals.
Research Ethics, Transparency and Responsible Publishing
The expansion of artificial intelligence and digital research tools has made research integrity increasingly important.
During 2026, Track2Training strengthened its focus on ethical research practices, transparent methodology, appropriate citation, responsible use of generative AI, plagiarism prevention, data transparency and accurate reporting of results.
Researchers were encouraged to maintain clear documentation concerning authorship, conflicts of interest, funding, ethical approval, data availability and the role of digital or AI-assisted tools in research preparation.
Responsible publication practices remain essential for protecting both researchers and institutions from predatory journals, fabricated research, unethical authorship and unreliable analytical practices.
Future Research Priorities
Looking beyond 2026, Track2Training intends to further develop research programmes in several strategic areas.
Priority themes include sustainable cities and communities, artificial intelligence and machine learning, climate-resilient infrastructure, urban mobility, digital twins, GIS and spatial analytics, heritage conservation, sustainable buildings, land policy, environmental planning, public health, education technology and interdisciplinary applications of data science.
Greater attention will also be placed on collaborative international research, externally funded projects, high-quality systematic reviews, Scopus- and Web of Science-indexed publications, academic books, policy-oriented research and research training programmes.
Building an Institutional Research Ecosystem
The activities undertaken during 2026 reflect Track2Training’s evolving role as more than a publication-support platform. The organisation is increasingly developing an integrated research ecosystem combining research, training, publishing, collaboration and knowledge dissemination.
Through research projects, publications, conferences, academic partnerships, methodological training and interdisciplinary collaboration, Track2Training aims to contribute to stronger research capacity and more meaningful knowledge production.
The Track2Training Research Review 2026 therefore represents not only a summary of one year’s activities but also a foundation for future institutional growth.
As research becomes increasingly interdisciplinary, data-intensive and globally connected, Track2Training will continue working with scholars, universities, research organisations and professional communities to support credible, ethical and socially relevant research.
Track2Training – Research, Training, Collaboration and Knowledge for Sustainable Development.
Which relationship has taught you the most about yourself?
WhicFrom Field Survey to Research Publication: How Empirical Research Is Conducted
Empirical research is one of the most important foundations of academic knowledge. It involves the systematic collection and analysis of evidence derived from observations, surveys, experiments, interviews, measurements, or real-world datasets. Unlike purely theoretical work, empirical research seeks to answer research questions by examining what actually occurs in a population, community, institution, organisation, environment, or physical setting.
At Track2Training, empirical research is viewed as a complete research process rather than a sequence of isolated activities. A good field survey is not sufficient if the questionnaire is poorly designed. A large dataset is not useful if the sampling procedure is weak. Sophisticated statistical analysis cannot compensate for unreliable measurement. Similarly, a technically correct analysis may have limited scholarly value if the findings are poorly interpreted or inadequately communicated.
The quality of empirical research therefore depends on careful planning from the beginning of the study to the final publication.
1. Defining the Research Problem
Every empirical study begins with a clearly defined research problem.
A research problem should identify a specific issue that requires investigation and explain why the issue matters. It may emerge from a gap in previous literature, a practical challenge, a policy problem, contradictory findings, or a newly emerging social, technological, or environmental condition.
For example, rather than studying “public transport” broadly, an empirical researcher may investigate how accessibility, reliability, safety, and service quality influence public transport preference among urban commuters.
Similarly, a study on higher education may examine how digital learning tools affect student engagement or research productivity.
Once the problem is defined, the researcher formulates research questions, objectives, and, where appropriate, hypotheses.
These elements guide the entire empirical process.
2. Developing the Research Design
Research design provides the overall structure of the investigation.
It defines how evidence will be collected and analysed to answer the research questions.
Common designs include:
cross-sectional surveys,
longitudinal studies,
case studies,
experiments,
quasi-experiments,
comparative studies,
mixed-method designs, and
observational field studies.
The choice of design depends on the nature of the research problem.
A cross-sectional survey may be appropriate for examining attitudes at a particular point in time, while a longitudinal design may be required to examine how behaviour changes across several months or years.
A comparative study may analyse differences between cities, institutions, groups, or policies.
Researchers should decide the research design before beginning data collection because the design influences sampling, questionnaire development, analytical methods, and interpretation.
3. Reviewing Existing Literature
Before fieldwork begins, researchers need to understand existing knowledge.
A literature review helps identify relevant theories, concepts, variables, measurement scales, findings, and methodological approaches.
It also helps avoid unnecessary duplication.
Researchers may discover that a variable they intend to measure has already been validated in previous studies. They may also identify methodological weaknesses in earlier research that their own study can address.
The literature review should lead to a clear research gap.
This gap establishes why the empirical study is needed and how it can contribute to existing scholarship.
4. Developing the Conceptual Framework
A conceptual framework connects the research problem with measurable variables.
It represents the relationships that the researcher expects to investigate.
For example, a study may propose that:
Accessibility → Travel Satisfaction → Public Transport Preference
Another study might examine:
Teaching Quality + Digital Resources + Student Support → Academic Engagement
The conceptual framework helps researchers determine what information should be collected and what statistical relationships will later be tested.
Where hypotheses are used, they should be derived logically from theory and previous research.
5. Questionnaire Development
Questionnaire design is one of the most critical stages in survey-based empirical research.
Every question should serve a clear research purpose.
Questionnaires often contain several sections, such as:
demographic characteristics,
behavioural information,
socioeconomic variables,
perceptions,
attitudes,
satisfaction measures, and
outcome variables.
Likert-scale questions are commonly used to measure perceptions and attitudes. Respondents may indicate their level of agreement from “strongly disagree” to “strongly agree.”
However, researchers should avoid unnecessarily complicated wording, leading questions, vague concepts, and questions that contain multiple issues at once.
Where possible, validated items from previous studies should be adapted carefully rather than developing entirely new measures without justification.
The order of questions also matters. A questionnaire should progress logically and should not place excessive cognitive burden on respondents.
6. Conducting a Pilot Survey
A questionnaire should not normally be administered to the full sample immediately after development.
A pilot survey allows researchers to test the instrument with a smaller group before formal data collection.
Pilot testing can reveal problems such as:
confusing wording,
missing response categories,
repetitive questions,
excessive survey length,
technical errors,
misunderstood terms, or
unreliable measurement items.
Participants may also be asked whether any questions were difficult to understand or answer.
The pilot stage provides an opportunity to revise the questionnaire before larger resources are committed to full-scale fieldwork.
In some studies, preliminary reliability analysis may also be conducted using pilot data.
7. Determining the Target Population
Researchers must clearly define who or what the study intends to represent.
This is known as the target population.
For example, a transportation study might focus on daily commuters using public transport in a particular metropolitan area.
An education study might target postgraduate students enrolled in selected universities.
A planning study may focus on households located within a specified distance from transit stations.
The population definition should be sufficiently specific so that sampling and interpretation remain meaningful.
8. Selecting a Sampling Strategy
Sampling determines which members of the target population will participate in the study.
Probability sampling approaches include:
simple random sampling,
systematic sampling,
stratified random sampling, and
cluster sampling.
These methods can improve representativeness when a sampling frame is available.
Non-probability methods include:
purposive sampling,
convenience sampling,
quota sampling, and
snowball sampling.
These approaches may be suitable when the population is difficult to identify, when expert participants are required, or when practical constraints limit random selection.
Researchers should explain why their chosen sampling strategy is appropriate and acknowledge its limitations.
9. Determining Sample Size
Sample size affects the reliability and statistical power of a study.
A very small sample may fail to identify meaningful relationships, while an unnecessarily large sample may consume resources without substantial analytical benefit.
Sample-size determination may consider:
population size,
confidence level,
margin of error,
expected variability,
number of predictors,
statistical model,
effect size, and
desired statistical power.
Advanced techniques such as structural equation modelling may have additional sample requirements depending on model complexity.
Researchers should justify their sample rather than selecting an arbitrary number.
10. Field Survey Planning
Good field research requires systematic preparation.
Before data collection, researchers should finalise:
study locations,
survey dates,
field investigator instructions,
respondent eligibility,
consent procedures,
data-recording formats,
quality-control checks, and
backup procedures.
Field investigators should receive proper training.
They should understand how to approach participants, explain the study, obtain consent, administer questions consistently, and avoid influencing responses.
Digital survey platforms can support real-time data entry, GPS recording, timestamps, validation rules, and automated skip patterns.
However, technology does not eliminate the need for careful field supervision.
11. Questionnaire Administration
Questionnaires may be administered face-to-face, online, by telephone, through email, or using mixed methods.
Each approach has advantages and limitations.
Face-to-face surveys can improve response completeness but may be costly and time-consuming.
Online surveys can reach large groups efficiently but may exclude people with limited internet access.
Researchers should select a mode appropriate to the study population.
The administration process should remain consistent.
Participants should receive the same essential information, and researchers should avoid explaining questions in ways that may influence answers.
12. Research Ethics During Fieldwork
Ethical responsibility is central to empirical research.
Participants should understand the purpose of the study and what participation involves.
Where appropriate, informed consent should be obtained.
Participation should be voluntary, and personal information should be protected.
Researchers should minimise collection of personally identifiable information unless it is necessary.
Sensitive data should be stored securely, and published findings should avoid unnecessary identification of individuals or vulnerable groups.
Ethical research improves trust and protects both participants and researchers.
13. Data Entry and Data Management
Once data collection is completed, responses need to be organised systematically.
Paper questionnaires may need to be entered into digital software, while electronic surveys may already provide downloadable datasets.
Variables should be coded consistently.
For example:
Male = 1 Female = 2 Other/Prefer not to say = 3
However, codes should be accompanied by a clear data dictionary so that researchers understand what each value represents.
Data files should be backed up and securely stored.
Version control is also useful when multiple researchers are working on the same dataset.
14. Data Cleaning
Raw survey data nearly always require cleaning.
Common problems include:
missing responses,
duplicate entries,
impossible values,
inconsistent coding,
outliers,
incomplete questionnaires, and
data-entry errors.
Researchers should inspect frequency distributions and descriptive statistics before conducting advanced analyses.
For example, if an age variable contains a value of 350, this is likely an entry error.
If a respondent has selected exactly the same response for every item, the researcher may need to examine whether the response is credible.
Any data exclusion should follow predefined and defensible criteria.
Researchers should never remove observations simply because they produce inconvenient results.
15. Assessing Reliability
Reliability refers to the consistency of a measurement instrument.
When several questionnaire items are intended to measure the same concept, researchers often evaluate internal consistency.
Cronbach’s alpha is commonly used for this purpose.
Composite reliability may also be examined in structural equation modelling.
Reliability should not be interpreted mechanically. A high coefficient does not automatically prove that a construct is valid.
Researchers should consider whether the items are conceptually coherent and whether redundancy may artificially increase reliability.
16. Assessing Validity
Validity addresses whether the instrument measures what it is intended to measure.
Different forms of validity may be considered.
Content validity examines whether the indicators adequately represent the concept.
Construct validity evaluates whether the measures behave consistently with theoretical expectations.
Convergent validity examines whether indicators expected to measure the same construct show sufficient agreement.
Discriminant validity assesses whether theoretically distinct constructs are sufficiently different from one another.
In factor analysis or SEM, statistics such as indicator loadings, average variance extracted, and discriminant validity measures may be examined.
The specific criteria depend on the analytical method used.
17. Descriptive Statistical Analysis
Descriptive analysis provides the first systematic understanding of the dataset.
Researchers may calculate:
frequencies,
percentages,
means,
medians,
standard deviations,
ranges, and
distributions.
Demographic variables can help describe the study sample.
Behavioural indicators can show dominant patterns.
Descriptive statistics may also reveal unexpected trends that require further investigation.
Tables and graphs should be used carefully to communicate findings without duplicating information unnecessarily.
18. Inferential Statistical Analysis
Inferential statistics allow researchers to test relationships, differences, or hypotheses.
Depending on the research design, methods may include:
correlation,
t-tests,
chi-square tests,
ANOVA,
linear regression,
logistic regression,
multinomial regression,
factor analysis,
multivariate analysis, or
structural equation modelling.
The choice of method should depend on variable type, research objectives, assumptions, and theoretical expectations.
Researchers should report more than p-values.
Effect sizes, confidence intervals, model fit, explanatory power, and practical relevance can provide a fuller understanding of results.
19. Structural Equation Modelling and Advanced Analysis
When research involves multiple latent constructs and interconnected relationships, structural equation modelling may be appropriate.
SEM allows researchers to test both measurement quality and structural relationships.
The measurement model may evaluate:
factor or outer loadings,
internal consistency,
composite reliability,
convergent validity, and
discriminant validity.
The structural model may assess:
path coefficients,
significance levels,
effect sizes,
coefficients of determination,
predictive relevance, and
model performance.
Software such as SmartPLS, AMOS, R, or other platforms may be used.
Again, model complexity should be justified by the research problem rather than by the availability of software.
20. Interpreting the Findings
Statistical output is not the final result of research.
Interpretation is required.
Researchers should explain what each important finding means in relation to the research question.
For example, instead of reporting only that a coefficient is statistically significant, the discussion should explain the substantive meaning of the relationship.
Researchers should compare findings with earlier literature.
Where results are consistent with previous studies, this should be explained.
Where results differ, possible reasons may include differences in population, geography, methods, timing, measurement, or social context.
Interpretation should remain cautious.
Correlation does not necessarily establish causation, and statistically significant findings are not automatically important in practice.
21. Acknowledging Limitations
Every empirical study has limitations.
These may relate to:
sample size,
geographic coverage,
survey design,
self-reported data,
cross-sectional design,
measurement error,
missing variables, or
generalisability.
Acknowledging limitations does not weaken a research paper.
On the contrary, transparent discussion of limitations helps readers understand the boundaries of the conclusions.
It also creates opportunities for future research.
22. Developing the Research Manuscript
Once analysis is complete, the research must be transformed into a coherent manuscript.
A typical empirical paper includes:
Title
Abstract
Keywords
Introduction
Literature Review
Research Methodology
Results
Discussion
Conclusion
Implications
Limitations and Future Research
References
The methodology section should provide sufficient information for readers to understand how the study was conducted.
The results section should present evidence clearly without excessive interpretation.
The discussion section should interpret the findings and connect them with theory and previous research.
23. Selecting Tables, Figures and Visualisations
Tables and figures should support understanding.
A table is useful when readers need precise values.
A graph may be better for showing trends, comparisons, or distributions.
Maps may be appropriate for geographically based studies.
Researchers should avoid presenting the same information in several formats without a clear reason.
Every table and figure should have a clear title and should be discussed in the text.
24. Choosing an Appropriate Publication Outlet
Journal selection should be based on the relevance of the manuscript to the journal’s scope.
Researchers should examine:
aims and scope,
recently published papers,
readership,
indexing,
publication model,
editorial policies,
review process, and
ethical standards.
The objective should be to identify a legitimate journal whose academic audience is likely to value the research.
Researchers should be cautious of deceptive publication platforms that make misleading promises of guaranteed or extremely rapid acceptance.
25. Peer Review and Revision
Submission is rarely the end of the research process.
Peer reviewers may request additional analysis, clarification, theoretical improvement, restructuring, or methodological explanation.
Authors should evaluate each comment carefully.
A revision letter can explain how every reviewer comment has been addressed.
Where authors disagree with a recommendation, they should provide a respectful and evidence-based explanation.
Peer review can significantly improve the final quality of a manuscript when authors engage with it constructively.
26. Research Dissemination Beyond Journal Publication
Research should reach the audiences that can benefit from it.
Journal publication is important, but it is not the only form of dissemination.
Research findings can also be communicated through:
conference presentations,
institutional reports,
policy briefs,
working papers,
research seminars,
workshops,
datasets,
professional networks,
academic repositories, and
public-facing research summaries.
Different outputs may be appropriate for different audiences.
Policymakers may prefer concise recommendations, while researchers may require detailed methodological information.
From Field Evidence to Scholarly Knowledge
Empirical research is a continuous process that begins long before the first questionnaire is distributed and continues after the statistical analysis has been completed.
Every stage influences the credibility of the final findings.
A strong study requires a clear research problem, appropriate design, rigorous sampling, carefully tested instruments, ethical fieldwork, clean data, reliable measurement, appropriate statistical analysis, cautious interpretation, transparent reporting, and responsible dissemination.
At Track2Training, empirical research is approached as an integrated academic process in which methodological rigour and practical relevance work together.
From pilot surveys and field observations to reliability testing, statistical modelling, manuscript preparation, and knowledge dissemination, each stage contributes to the transformation of raw information into credible evidence.
The ultimate objective of empirical research is not simply to generate datasets or publish papers. It is to produce knowledge that is systematic, transparent, reproducible, ethically responsible, and capable of contributing to academic understanding, policy, professional practice, and society. relationship has taught you the most about yourself?
Research Training and Capacity Building for Scholars, Faculty and Students
A strong research ecosystem depends not only on infrastructure, funding, and publications, but also on the knowledge, skills, and confidence of the people who conduct research. Scholars, faculty members, postgraduate students, doctoral researchers, and professionals increasingly work in an academic environment that requires competence in research design, data analysis, academic writing, digital tools, evidence synthesis, and ethical scholarly communication.
At Track2Training, research training and capacity building are viewed as core academic functions. The objective is to help researchers develop the methodological, analytical, technological, and communication skills needed to undertake high-quality research independently and responsibly.
Rather than treating research training as a collection of isolated technical services, Track2Training approaches capacity building as a structured institutional programme that supports researchers across the complete research lifecycle—from identifying a research problem to designing a study, analysing data, interpreting findings, and communicating results.
Building Research Capacity Across Career Stages
Researchers at different stages of their academic journey require different forms of support.
A postgraduate student may need guidance in understanding research design and questionnaire development. A doctoral scholar may require advanced statistical or qualitative training. A faculty member may want to learn bibliometric analysis, structural equation modelling, machine learning, or GIS. An experienced researcher may need methodological updating as new analytical tools emerge.
Track2Training therefore promotes a layered model of research capacity building.
Programmes may be designed at introductory, intermediate, and advanced levels so that participants can develop progressively rather than being exposed to complex software before understanding the underlying concepts.
The emphasis remains on developing methodological literacy, not simply software familiarity.
Research Methodology Programmes
Research methodology forms the foundation of academic capacity building.
Track2Training’s research methodology programmes are designed to help participants understand how a research idea is transformed into a rigorous and feasible study.
Key areas may include:
identification of research problems,
formulation of research questions,
development of objectives and hypotheses,
literature review,
theoretical and conceptual frameworks,
research design,
qualitative and quantitative methods,
mixed-method research,
sampling,
questionnaire design,
validity and reliability,
data collection,
interpretation of findings, and
research ethics.
Participants are encouraged to understand why a method is appropriate before learning how to apply it.
This distinction is important because research quality depends more on methodological reasoning than on the complexity of the analytical technique used.
Statistical Training for Researchers
Statistical literacy is increasingly important across the social sciences, engineering, planning, education, management, health research, and many other disciplines.
Track2Training promotes statistical training that begins with conceptual understanding and progresses toward application.
Introductory programmes may cover descriptive statistics, distributions, data types, measures of central tendency, variability, cross-tabulation, and graphical interpretation.
Intermediate programmes may include hypothesis testing, correlation, regression, t-tests, chi-square tests, analysis of variance, and non-parametric methods.
Advanced programmes may focus on multivariate analysis, factor analysis, logistic regression, structural equation modelling, predictive modelling, and other specialised techniques.
The aim is to help participants select statistical methods appropriate to their research questions and data rather than applying techniques mechanically.
SPSS Training
SPSS remains widely used in academic research because of its accessibility and range of statistical procedures.
Track2Training’s SPSS-oriented programmes may introduce participants to data entry, coding, variable management, missing values, descriptive analysis, reliability analysis, correlation, regression, ANOVA, factor analysis, and related statistical procedures.
Participants can also learn how to interpret outputs correctly.
This is particularly important because statistical software can generate results very quickly, but incorrect interpretation can lead to unreliable conclusions.
Training therefore focuses on understanding assumptions, significance levels, confidence intervals, effect sizes, coefficients, model fit, and practical meaning.
R for Academic Research
R has become an important platform for statistics, data science, visualisation, reproducible research, and advanced modelling.
Track2Training encourages researchers to develop R skills because it supports both conventional statistical analysis and more advanced computational methods.
Capacity-building programmes may cover:
introduction to R and RStudio,
importing and cleaning data,
data manipulation,
descriptive statistics,
statistical testing,
regression,
data visualisation,
reproducible scripts,
bibliometric analysis,
spatial analysis, and
advanced modelling.
One of the major academic advantages of R is reproducibility.
Researchers can maintain scripts documenting each analytical step, making it easier to verify, revise, and reproduce their work.
Python for Research and Data Analysis
Python is increasingly valuable for researchers working with data analytics, automation, machine learning, text analysis, and computational research.
Track2Training’s Python-based academic training may begin with programming fundamentals and progress toward research applications.
Possible modules include data handling with pandas, numerical analysis, data cleaning, visualisation, statistical analysis, machine learning, natural language processing, automation, and research workflow development.
Python is particularly useful when researchers are working with large datasets or need to integrate multiple forms of data.
The training approach should remain research-oriented. Participants are encouraged to understand how programming contributes to answering research questions rather than learning coding in isolation from academic inquiry.
SmartPLS and Structural Equation Modelling
Structural Equation Modelling has become widely used in management, social sciences, transportation, planning, education, consumer research, and behavioural studies.
Track2Training supports capacity building in SEM and Partial Least Squares Structural Equation Modelling using platforms such as SmartPLS.
Programmes may include:
development of conceptual models,
reflective and formative constructs,
measurement-model assessment,
indicator loadings,
Cronbach’s alpha,
composite reliability,
average variance extracted,
discriminant validity,
variance inflation factors,
path coefficients,
bootstrapping,
effect sizes,
explanatory power, and
model interpretation.
The emphasis is placed on understanding the conceptual logic behind SEM.
Researchers should not select structural equation modelling simply because it appears sophisticated. The method should follow from the research question, measurement structure, theoretical framework, and data.
Systematic Literature Review Training
Systematic reviews are becoming increasingly important across disciplines because researchers need transparent ways of synthesising rapidly expanding bodies of literature.
Track2Training promotes systematic literature review training that goes beyond conventional narrative summaries.
Participants may learn how to:
formulate review questions,
identify appropriate databases,
design search strategies,
develop inclusion and exclusion criteria,
remove duplicates,
screen titles and abstracts,
undertake full-text assessment,
extract data,
assess study quality,
synthesise evidence, and
report the review transparently.
Programmes may also introduce recognised reporting frameworks where appropriate.
The objective is to help researchers develop reviews that are systematic, reproducible, and analytically meaningful.
Bibliometric Analysis and Science Mapping
Bibliometric analysis provides researchers with tools to examine large bodies of scholarly literature quantitatively.
Track2Training’s capacity-building activities may include bibliometric methods using tools such as VOSviewer, Biblioshiny, Bibliometrix, and related analytical platforms.
Researchers can learn to examine:
publication trends,
citation patterns,
influential authors,
institutions,
countries,
journals,
keyword networks,
co-authorship,
co-citation,
bibliographic coupling, and
thematic evolution.
Training should also address interpretation.
A visually attractive network map is not, by itself, a strong academic contribution. Researchers need to understand what the network represents, how parameters affect results, and how bibliometric findings connect with substantive research questions.
GIS and Spatial Research Training
Many research questions contain a spatial dimension.
Track2Training supports GIS-based capacity building for researchers working in planning, geography, transportation, environment, public health, infrastructure, and regional development.
Training modules may introduce:
spatial data types,
coordinate systems,
georeferencing,
digitisation,
spatial databases,
thematic mapping,
buffer analysis,
proximity analysis,
overlay analysis,
network analysis,
accessibility analysis,
land-use mapping, and
spatial interpretation.
Advanced programmes may include remote sensing, spatial statistics, change detection, and integration with statistical or machine-learning techniques.
GIS training is particularly valuable because maps can reveal patterns and inequalities that may remain hidden in conventional tabular datasets.
Academic Writing and Scholarly Communication
Research findings have limited impact if they cannot be communicated clearly.
Academic writing is therefore a major component of research capacity building at Track2Training.
Programmes may address the complete process of developing a scholarly manuscript, including:
structuring a research paper,
writing effective titles and abstracts,
developing introductions,
organising literature reviews,
reporting methodology,
presenting results,
writing discussions,
preparing conclusions,
managing citations,
preparing tables and figures,
avoiding plagiarism, and
responding to reviewer comments.
Researchers are encouraged to distinguish academic clarity from unnecessarily complicated language.
Strong scholarly writing communicates complex ideas accurately and efficiently.
Research Proposal Development
Developing a research proposal requires researchers to demonstrate that their question is important, theoretically grounded, methodologically feasible, and capable of generating useful knowledge.
Track2Training’s proposal-development programmes may help scholars work through:
research problem identification, research gaps, objectives, literature review, conceptual frameworks, methodology, timelines, expected outcomes, budgets, ethics, and dissemination.
Such programmes can support doctoral proposals, institutional research projects, grant applications, collaborative projects, and externally funded research.
Proposal training also helps participants think more systematically about research planning before data collection begins.
Qualitative Research Capacity Building
Quantitative methods represent only one part of academic inquiry.
Track2Training also promotes capacity building in qualitative research.
Training may cover:
interview design,
focus group discussions,
observation,
case-study methods,
purposive sampling,
transcription,
coding,
thematic analysis,
content analysis,
reflexivity,
saturation, and
qualitative interpretation.
Researchers may also be introduced to qualitative data-analysis software where appropriate.
The objective is to help participants understand the rigour required in qualitative research and avoid the misconception that qualitative analysis is simply informal description.
Mixed-Method Research
Many complex research problems benefit from combining quantitative and qualitative approaches.
Track2Training’s mixed-method capacity-building programmes may explain how different types of evidence can be integrated within a coherent research design.
Participants can learn about sequential, concurrent, exploratory, and explanatory approaches and how to connect data collected through surveys, interviews, field observations, statistical models, and spatial analysis.
The central principle is integration.
Using multiple methods does not automatically create a strong mixed-method study. Researchers should explain how different forms of evidence complement, confirm, or challenge each other.
Machine Learning for Academic Research
Machine learning is increasingly being incorporated into research in transportation, planning, education, engineering, environmental science, and social analytics.
Track2Training supports training programmes that introduce researchers to the responsible use of machine-learning methods.
Topics may include:
data preparation,
training and testing datasets,
feature selection,
regression and classification,
decision trees,
random forests,
support vector machines,
clustering,
model evaluation,
overfitting,
validation, and
explainability.
Participants should understand both the strengths and limitations of machine-learning models.
Predictive accuracy alone does not guarantee meaningful research. Interpretation, data quality, bias, reproducibility, and theoretical relevance remain essential.
Research Ethics and Responsible Scholarship Training
Research capacity building must include ethical capacity.
Track2Training encourages programmes covering informed consent, participant confidentiality, data integrity, plagiarism, authorship, conflicts of interest, publication ethics, AI-assisted research, and responsible scholarly communication.
Researchers should understand their responsibilities before beginning data collection rather than treating ethics as an administrative formality.
As digital platforms and artificial intelligence become increasingly integrated into research, ethical awareness will become even more important.
Workshops, Faculty Development Programmes and Research Schools
Institutional capacity building can take different forms.
Track2Training may organise:
short-term workshops,
faculty development programmes,
research methodology courses,
doctoral research clinics,
summer or winter research schools,
statistical bootcamps,
software-based laboratory sessions,
writing workshops,
systematic-review programmes,
research seminars, and
interdisciplinary training programmes.
Some activities may focus on a single method, while others can provide integrated training across the complete research lifecycle.
Programmes may be offered in collaboration with universities, departments, research centres, professional organisations, and academic networks.
Learning Through Research Projects
One of the most effective ways to build research capacity is through active participation in research.
Track2Training therefore supports project-based learning in which participants develop skills while working on actual research problems.
A training cohort might develop a questionnaire, conduct pilot testing, collect field data, clean datasets, undertake statistical analysis, interpret findings, and prepare a research report.
Similarly, a systematic-review programme could guide participants from search strategy development to evidence synthesis.
This approach helps bridge the gap between theoretical methodological knowledge and actual research practice.
Building Institutional Research Culture
Capacity building has effects beyond individual researchers.
When faculty members, scholars, and students develop stronger research skills, institutions become better equipped to initiate collaborative projects, prepare funding proposals, produce high-quality publications, mentor younger researchers, and contribute to public knowledge.
Track2Training therefore views research training as part of institutional development.
Training can help departments establish common methodological standards, strengthen supervision, improve research documentation, and encourage interdisciplinary collaboration.
It can also create networks among participants who continue to collaborate after a programme has ended.
From Software Training to Research Competence
A central principle of Track2Training’s capacity-building philosophy is that software is a tool, not a research methodology.
Learning SPSS does not automatically make a researcher a statistician. Learning SmartPLS does not replace understanding measurement theory. Learning GIS does not replace spatial reasoning. Learning Python does not eliminate the need for research design.
For this reason, institutional training programmes should connect technical skills with conceptual understanding.
Participants should be able to explain:
why a method was selected, what assumptions it requires, what its outputs mean, what limitations apply, and how its results answer the research question.
This is the difference between technical software operation and genuine research competence.
Supporting Lifelong Academic Learning
Research methods continue to evolve.
New analytical techniques, data sources, software, reporting standards, and ethical questions emerge regularly.
Researchers therefore need opportunities for continuous professional development throughout their careers.
Track2Training aims to contribute to a culture of lifelong academic learning in which researchers continue updating their skills rather than viewing research methodology as something learned only during postgraduate education.
Such continuous development is particularly important as artificial intelligence, computational methods, open science, and digital research environments reshape academic practice.
Toward an Institutional Research Capacity-Building Ecosystem
The long-term objective of Track2Training’s Research Training and Capacity Building Programme is to create an academic environment in which scholars can progressively develop the skills required for independent and responsible research.
Research methodology, academic writing, SPSS, R, Python, SmartPLS, SEM, systematic reviews, bibliometric analysis, GIS, machine learning, qualitative methods, and research ethics should not operate as disconnected offerings.
Together, they form an integrated research-learning ecosystem.
By organising these activities as academic programmes, workshops, research schools, faculty development initiatives, methodological laboratories, and collaborative learning opportunities, Track2Training seeks to position research training as a central part of its institutional mission.
The ultimate objective is not simply to teach researchers how to operate analytical tools. It is to help them become capable of asking stronger questions, selecting appropriate methods, analysing evidence responsibly, interpreting findings critically, and communicating knowledge effectively.
Through sustained capacity building, Track2Training aims to strengthen researchers, academic institutions, and the broader culture of evidence-based scholarship.
Which relationship has taught you the most about yourself?
Which reInterdisciplinary Research for Sustainable Development: Connecting Research with the SDGs
Sustainable development is one of the defining research challenges of the twenty-first century. Climate change, rapid urbanisation, environmental degradation, inequality, public health challenges, technological disruption, pressure on natural resources, and unequal access to education and infrastructure cannot be effectively addressed through a single discipline.
At Track2Training, sustainable development is approached as an interdisciplinary research agenda connecting planning, engineering, education, environment, health, technology, social sciences, governance, and public policy.
The organisation recognises the importance of the United Nations Sustainable Development Goals (SDGs) as a broad framework for understanding interconnected development challenges. Research can contribute to these goals by producing evidence, identifying problems, evaluating interventions, developing technologies, strengthening institutions, and translating academic knowledge into solutions relevant to communities and decision-makers.
Track2Training therefore seeks to encourage research that moves beyond disciplinary boundaries and connects academic inquiry with meaningful societal outcomes.
Research and the Sustainable Development Goals
The Sustainable Development Goals provide a global framework covering social, economic, environmental, and institutional dimensions of development.
For research institutions, the SDGs provide an opportunity to connect academic work with wider societal priorities.
A transportation study, for example, may contribute to SDG 11: Sustainable Cities and Communities, while also addressing climate action, infrastructure, accessibility, and social inclusion.
Similarly, research on water infrastructure can simultaneously relate to health, sustainable settlements, climate resilience, environmental protection, and institutional governance.
The interconnected nature of the SDGs reflects an important principle of Track2Training’s research philosophy: complex development challenges require integrated knowledge.
Rather than treating each SDG as an isolated subject, interdisciplinary research can investigate relationships between them.
Urban Planning and Sustainable Cities
Urbanisation creates opportunities for economic and social development, but it also places enormous pressure on infrastructure, housing, transportation, public services, land, and the environment.
Research in urban planning, architecture, regional planning, and the built environment can make significant contributions to sustainable development.
Track2Training encourages research related to:
sustainable urban development,
transit-oriented development,
affordable and inclusive housing,
land-use planning,
public spaces,
infrastructure accessibility,
heritage conservation,
urban resilience,
informal settlements,
pedestrian-friendly environments, and
climate-responsive urban design.
These research areas are closely connected with SDG 11: Sustainable Cities and Communities.
However, their significance extends further.
Improved urban transport can support climate action. Accessible public spaces can promote social inclusion. Better water and sanitation infrastructure can contribute to public health. Energy-efficient buildings can reduce resource consumption.
Urban research therefore demonstrates how one area of academic investigation can simultaneously contribute to several sustainable-development objectives.
Engineering for Sustainable Infrastructure
Engineering plays a fundamental role in translating sustainable-development principles into physical systems and technologies.
Civil, environmental, transportation, electrical, mechanical, and computational engineering research can contribute to safer, more efficient, and more resilient infrastructure.
Track2Training encourages engineering research concerning areas such as:
sustainable construction, renewable energy, water systems, transportation infrastructure, structural resilience, waste management, energy efficiency, intelligent infrastructure, materials technology, and disaster-resistant development.
These fields have strong connections with SDG 6: Clean Water and Sanitation, SDG 7: Affordable and Clean Energy, SDG 9: Industry, Innovation and Infrastructure, and SDG 11: Sustainable Cities and Communities.
Sustainable engineering requires more than technical optimisation.
Infrastructure must also be affordable, accessible, socially appropriate, environmentally responsible, and resilient to changing conditions.
This makes collaboration between engineers, planners, economists, environmental researchers, and social scientists increasingly important.
Education as a Foundation for Sustainable Development
Education influences virtually every dimension of sustainable development.
SDG 4: Quality Education emphasises inclusive and equitable education and opportunities for lifelong learning. For research institutions, this creates a broad agenda involving teaching practices, research training, digital education, educational technology, curriculum design, accessibility, and skill development.
Track2Training promotes research on higher education, academic capacity building, digital learning, research methodology, scholarly communication, and technology-supported education.
A particular area of interest is the development of research capabilities among students, doctoral scholars, faculty members, and early-career researchers.
Sustainable development requires professionals who can understand complex problems, analyse evidence, collaborate across disciplines, and communicate findings effectively.
Research training is therefore itself a contribution to sustainable development.
Researchers trained in statistics, qualitative inquiry, GIS, systematic reviews, artificial intelligence, and evidence-based decision-making are better equipped to investigate societal challenges.
Environmental Research and Climate Action
Environmental sustainability forms a central pillar of sustainable development.
Climate change, biodiversity decline, pollution, water stress, land degradation, and ecosystem loss affect both natural and human systems.
Track2Training encourages environmental research relating to:
climate change, urban heat, water systems, air quality, environmental impact assessment, green infrastructure, ecosystem management, land-use change, waste management, energy consumption, biodiversity, and climate adaptation.
Such research contributes particularly to SDG 6, SDG 12: Responsible Consumption and Production, SDG 13: Climate Action, SDG 14: Life Below Water, and SDG 15: Life on Land.
Environmental challenges also demonstrate why interdisciplinary research is necessary.
For example, urban heat is not purely an environmental issue. It may be influenced by land use, building materials, vegetation, transportation systems, socioeconomic conditions, energy consumption, and planning regulations.
Understanding the problem therefore requires contributions from environmental scientists, architects, planners, engineers, public-health researchers, data scientists, and policymakers.
Transportation and Sustainable Mobility
Mobility is essential for access to employment, education, healthcare, markets, and social opportunities.
Yet transportation systems can also create congestion, pollution, road-safety risks, inequality, and high energy consumption.
Research into public transport, first- and last-mile connectivity, walking, cycling, accessibility, transit-oriented development, travel behaviour, and intelligent transportation systems can contribute to more sustainable mobility.
Track2Training’s transportation research agenda recognises that mobility should not be assessed only by speed or road capacity.
Accessibility, affordability, reliability, safety, environmental impact, and social inclusion are equally important.
A sustainable transport system should enable people to reach essential opportunities without creating unnecessary environmental or social costs.
Research in this area can contribute to sustainable cities, climate action, infrastructure development, reduced inequalities, and improved quality of life.
Health, Environment and Human Well-Being
Human health is closely connected with the environments in which people live, work, learn, and travel.
Environmental pollution, inadequate sanitation, unsafe mobility, extreme heat, poor housing, insufficient physical activity, and unequal access to services can all affect health outcomes.
Interdisciplinary research connecting health, urban planning, environment, engineering, and social sciences can help identify these relationships.
Track2Training encourages research examining areas such as healthy cities, environmental health, water and sanitation, climate-related health risks, active mobility, occupational environments, community well-being, and access to public services.
These themes connect particularly with SDG 3: Good Health and Well-Being while also intersecting with sustainable cities, clean water, climate action, and reduced inequalities.
Health-oriented research also highlights the importance of equity.
Development interventions should be assessed not simply according to their average benefits but also according to whether different groups can access those benefits.
Artificial Intelligence and Technology for Sustainable Development
Digital technologies are creating new possibilities for understanding and responding to sustainable-development challenges.
Artificial intelligence, machine learning, GIS, remote sensing, digital twins, sensors, data analytics, and automation can help researchers monitor systems, predict outcomes, identify patterns, and evaluate alternative interventions.
Track2Training supports research exploring the responsible application of technology in areas such as:
transport planning,
environmental monitoring,
smart cities,
education,
infrastructure management,
climate analysis,
land-use mapping,
resource optimisation, and
decision-support systems.
Technology can contribute significantly to SDG 9: Industry, Innovation and Infrastructure and support many other goals.
However, technological innovation should not automatically be assumed to be sustainable.
Questions of affordability, accessibility, privacy, bias, digital inequality, energy use, transparency, and governance must also be considered.
For this reason, Track2Training promotes responsible and human-centred technological research rather than technological advancement for its own sake.
Social Sciences, Equity and Inclusion
Sustainable development is fundamentally about people.
Economic growth, infrastructure, and technological innovation have limited value if their benefits are distributed unfairly or if vulnerable groups are excluded.
Social-science research provides tools for understanding inequality, livelihoods, institutions, behaviour, culture, participation, and community experiences.
Track2Training encourages research concerning:
social inclusion, informal economies, gender, livelihoods, community development, social justice, vulnerable populations, migration, citizen participation, accessibility, and institutional relationships.
These areas are particularly relevant to SDG 5: Gender Equality, SDG 8: Decent Work and Economic Growth, SDG 10: Reduced Inequalities, and SDG 16: Peace, Justice and Strong Institutions.
Social research can also reveal unintended consequences of development policies.
A technically successful urban project, for example, may still create displacement or livelihood difficulties for certain communities.
Including social-science perspectives helps researchers understand such impacts.
Public Policy, Governance and Institutions
Sustainable development depends not only on good ideas but also on institutions capable of implementing them.
Policies may be well designed on paper yet achieve limited results because of administrative capacity, fragmented responsibilities, financial constraints, poor coordination, weak monitoring, or limited public participation.
Track2Training therefore promotes research into public policy, governance, regulatory systems, institutional performance, planning legislation, implementation mechanisms, and public participation.
This work has particular relevance to SDG 16, which emphasises effective, accountable, and inclusive institutions.
Policy research can examine the difference between policy intention and actual implementation.
It can also help decision-makers understand which interventions work, under what conditions, for whom, and why.
Evidence-based governance is therefore an important part of the sustainable-development research agenda.
Water, Sanitation and Resource Management
Access to safe water and sanitation remains fundamental to public health and sustainable settlements.
Research in this area requires collaboration across engineering, planning, environmental science, health, governance, and community studies.
Track2Training encourages research relating to water supply, sanitation systems, wastewater management, river systems, water quality, urban drainage, community practices, resource conservation, and infrastructure governance.
Such work directly supports SDG 6: Clean Water and Sanitation but can also contribute to health, sustainable communities, environmental protection, and climate resilience.
In particular, research in small and medium-sized towns can help address contexts that sometimes receive less scholarly attention than major metropolitan areas.
Sustainable Consumption, Buildings and Energy
Buildings and urban infrastructure consume significant quantities of energy and materials.
Research on building performance, construction materials, lifecycle assessment, energy retrofits, passive design, renewable-energy integration, and resource efficiency can contribute to more sustainable built environments.
Track2Training supports investigations examining how buildings can reduce resource consumption while maintaining comfort, affordability, and functionality.
This work connects architecture and engineering with SDG 7, SDG 11, SDG 12, and SDG 13.
Lifecycle thinking is particularly important.
Sustainability should not be assessed solely during building operation. Researchers may examine environmental impacts associated with material extraction, construction, maintenance, adaptation, and eventual demolition or reuse.
Interdisciplinary Methods for Complex Problems
Research for sustainable development requires methodological diversity.
Track2Training encourages the integration of:
field surveys, interviews, focus groups, statistical analysis, structural equation modelling, machine learning, GIS, remote sensing, systematic reviews, bibliometric analysis, policy analysis, case studies, and mixed-method research.
Different methods answer different questions.
Quantitative analysis may identify relationships between variables. Qualitative interviews may explain why those relationships exist. GIS can identify spatial inequalities. Machine learning can detect complex predictive patterns. Policy analysis can examine institutional barriers.
Combining methods can therefore produce a more complete understanding of sustainable-development challenges.
From Research Findings to Societal Impact
Research contributes to sustainable development only when knowledge can inform understanding, decisions, or future inquiry.
Track2Training encourages researchers to communicate their findings through multiple channels.
These may include:
journal articles, working papers, policy briefs, research reports, datasets, conferences, workshops, training programmes, technical guidance, and public-facing research communication.
A journal article may advance academic theory, while a policy brief may help policymakers understand the practical implications of the same findings.
Similarly, a research dataset may enable other scholars to conduct additional studies, while a training workshop may transfer methodological knowledge to emerging researchers.
Knowledge dissemination should therefore be designed according to the intended audience and potential contribution.
Measuring Research Contribution to the SDGs
Connecting research with the SDGs should involve more than simply adding an SDG label to a publication.
Researchers should identify how their questions, methods, findings, and recommendations relate to particular sustainable-development challenges.
A project may contribute directly to one SDG while indirectly supporting several others.
For example, research improving public transport accessibility may primarily contribute to sustainable cities but may also support reduced inequality, climate action, economic opportunity, and health.
Track2Training seeks to encourage such substantive connections rather than superficial categorisation.
Over time, institutional research outputs can be mapped according to SDG themes to demonstrate where research activity is concentrated and where new research programmes may be needed.
Partnerships for Sustainable Development
The complexity of sustainable-development challenges makes collaboration essential.
This aligns closely with SDG 17: Partnerships for the Goals.
Track2Training seeks to encourage partnerships involving universities, research institutions, government agencies, industries, professionals, civil-society organisations, faculty members, students, and independent researchers.
Collaborative research can enable access to diverse expertise, locations, datasets, technologies, and perspectives.
Partnerships can also help transform academic findings into pilot projects, policy discussions, professional practices, and educational initiatives.
Building a Sustainable Research Ecosystem
Track2Training views sustainable development not as a separate research subject but as a framework capable of connecting multiple disciplines.
Planning provides tools for shaping settlements. Engineering develops infrastructure and technologies. Environmental research examines ecological limits. Health research focuses on human well-being. Education builds knowledge and capacity. Social sciences analyse communities and inequalities. Technology creates new analytical and practical possibilities. Public policy determines how many of these ideas are translated into action.
When these disciplines work together, research can address development challenges more comprehensively.
Research for Knowledge, Society and the Future
The long-term goal of interdisciplinary research at Track2Training is to strengthen the connection between academic knowledge and societal development.
Research should help explain problems, evaluate alternatives, develop solutions, challenge ineffective assumptions, and identify new opportunities.
The Sustainable Development Goals provide a valuable framework through which these contributions can be understood and connected.
Through research in planning, engineering, transportation, environment, education, health, artificial intelligence, technology, social sciences, and public policy, Track2Training aims to contribute to an academic ecosystem where knowledge is not produced in isolation from society.
Instead, research becomes part of a wider process of building more inclusive communities, stronger institutions, resilient infrastructure, sustainable environments, improved educational opportunities, responsible technologies, and better-informed public decisions.
Research Ethics, Integrity and Responsible Scholarship at Track2Training
Research has value only when it is conducted responsibly. The credibility of academic knowledge depends not only on innovative ideas or advanced analytical methods but also on honesty, transparency, respect for participants, responsible authorship, accurate reporting, and ethical publication practices.
At Track2Training, research ethics and academic integrity are treated as fundamental components of scholarly activity. Researchers, faculty members, students, collaborators, and contributors are encouraged to follow principles that protect participants, preserve the reliability of evidence, and maintain public confidence in academic research.
Responsible scholarship begins at the planning stage of a study and continues through data collection, analysis, writing, publication, archiving, and dissemination. Ethical research therefore cannot be reduced to a single approval form or declaration. It is a continuous responsibility throughout the research lifecycle.
Research Ethics as a Foundation of Academic Work
Research ethics refers to the principles and standards that guide responsible academic inquiry.
Ethical research requires researchers to consider how their work may affect individuals, communities, institutions, and society. Researchers should minimise potential harm, respect participants’ autonomy, protect privacy, communicate honestly, and report findings accurately.
Track2Training encourages researchers to consider ethical implications before data collection begins.
Important questions include:
Does the research involve human participants?
Could participants face physical, psychological, social, professional, or reputational risks?
Is personal or sensitive information being collected?
Have participants been adequately informed about the purpose of the study?
Is participation voluntary?
How will the data be stored and protected?
Are there conflicts of interest that need to be disclosed?
Can the study be conducted in a manner that respects dignity, privacy, and fairness?
Ethical planning strengthens both the credibility and social value of research.
Informed Consent and Voluntary Participation
Informed consent is a central principle in research involving human participants.
Participants should understand what the study is about, why they have been invited, what participation involves, how their information will be used, and whether there are any foreseeable risks or benefits.
Consent should be voluntary.
Researchers should avoid coercion, inappropriate pressure, or misleading information. Participants should normally have the opportunity to decline participation or withdraw according to the conditions communicated during the consent process.
Informed-consent materials should use clear and understandable language appropriate to the participant group.
For online surveys, interviews, field studies, focus groups, experiments, or community-based research, the consent process should be adapted to the research context.
Where vulnerable populations are involved, additional safeguards may be necessary.
Privacy, Confidentiality and Participant Information
Researchers frequently collect information that participants may reasonably expect to remain private.
Responsible research requires careful management of such information.
Personal identifiers should be collected only when necessary for the study. Where possible, research datasets may use anonymisation, pseudonymisation, coded identifiers, or other techniques that reduce unnecessary exposure of participants’ identities.
Researchers should consider who will have access to the data, where it will be stored, how long it will be retained, and how it will ultimately be archived or securely disposed of.
Research reports should also avoid revealing information that could indirectly identify participants.
This is particularly important in small communities, organisations, workplaces, specialist groups, or case studies where individuals may be identifiable even when names are removed.
At Track2Training, respect for research participants extends beyond obtaining consent. It includes responsible stewardship of the information entrusted to researchers.
Plagiarism and Original Scholarship
Plagiarism undermines the foundations of academic research.
It occurs when words, ideas, data, images, arguments, or other intellectual contributions are used without appropriate acknowledgement.
Researchers are expected to distinguish clearly between their own contribution and material derived from other sources.
Proper citation is therefore essential.
This applies not only to direct quotations but also to paraphrased ideas, theoretical frameworks, datasets, figures, tables, methods, and previously published findings.
Self-plagiarism and inappropriate duplication should also be avoided. Researchers should not present previously published material as entirely new work without appropriate disclosure and citation.
Similarity-detection software can support manuscript checking, but responsible scholarship cannot be reduced to a similarity percentage. A manuscript may have a low similarity score and still contain poor attribution, while legitimate quotations and references may increase similarity scores.
Academic integrity ultimately depends on responsible authorship and accurate acknowledgement of sources.
Responsible Authorship
Authorship communicates both academic credit and responsibility.
Individuals listed as authors should have made meaningful scholarly contributions to the research and should be able to take responsibility for their role in the work.
Authorship should not be offered as a favour, institutional courtesy, financial arrangement, or reward unrelated to genuine academic contribution.
Similarly, contributors who have made substantial intellectual contributions should not be excluded unfairly.
Research teams should ideally discuss authorship at an early stage and revisit the discussion if responsibilities change during the project.
Author contributions may include conceptualisation, methodology, data collection, analysis, software development, investigation, writing, supervision, project administration, or other legitimate research activities.
Transparent contribution statements can help clarify the roles played by each researcher.
Practices such as guest authorship, honorary authorship, ghost authorship, and purchased authorship are inconsistent with responsible scholarship.
Conflicts of Interest
A conflict of interest exists when personal, financial, professional, institutional, or other relationships could potentially influence—or reasonably be perceived to influence—the research process.
A conflict of interest does not automatically mean that research is invalid. The important principle is transparency.
Researchers should disclose relevant relationships that may affect research design, data interpretation, publication decisions, or recommendations.
Funding sources should also be reported appropriately.
Where a sponsor has influenced the study design, data analysis, manuscript preparation, or publication decision, this should be transparently stated.
Clear disclosure allows readers to evaluate research with an informed understanding of the circumstances in which it was produced.
Data Integrity and Responsible Analysis
The reliability of research depends heavily on the integrity of its data.
Researchers should maintain accurate records of how data were collected, cleaned, transformed, analysed, and interpreted.
Fabrication, falsification, selective manipulation, or intentional suppression of inconvenient findings are serious violations of research integrity.
Data should never be changed simply because the results do not support the researcher’s expectations.
Researchers should also avoid inappropriate analytical practices such as repeatedly testing models until statistically significant results appear without transparent reporting.
Missing data, excluded observations, outliers, transformations, and analytical decisions should be handled using defensible procedures.
Where possible, analytical workflows should be documented so that results can be checked or reproduced.
Responsible data practices may include maintaining data dictionaries, analytical scripts, survey instruments, coding frameworks, GIS procedures, statistical syntax, and version histories.
Ethical Use of Artificial Intelligence in Research
Generative artificial intelligence is increasingly being used in academic research and scholarly communication.
AI tools can assist researchers with tasks such as language improvement, coding support, literature organisation, brainstorming, data processing, and technical explanation.
However, AI-assisted research introduces important ethical responsibilities.
Researchers remain accountable for everything submitted under their names.
AI-generated information should therefore be checked carefully because such systems may produce inaccurate statements, fabricated references, misleading interpretations, or inappropriate generalisations.
Researchers should not use AI to fabricate data, create fictitious participants, generate false citations, manipulate evidence, or misrepresent work that was never conducted.
Confidential research data, unpublished manuscripts, personally identifiable participant information, or restricted institutional material should not be entered into AI systems without appropriate consideration of privacy, security, and applicable policies.
Where publishers, universities, funders, or professional organisations require disclosure of AI use, researchers should follow those requirements.
AI should support scholarly work without replacing human responsibility, critical judgment, methodological accountability, or intellectual contribution.
Ethical Publication Practices
Responsible publication extends beyond writing a technically correct manuscript.
Researchers should submit work that accurately represents the research undertaken.
Data should not be fabricated or selectively reported. Images and figures should not be manipulated in misleading ways. Citations should be relevant and should not be added merely to inflate citation counts or satisfy inappropriate requests.
Simultaneous submission of the same manuscript to multiple journals should generally be avoided where prohibited by journal policies.
Duplicate publication should also be prevented.
Authors should select publication venues carefully and evaluate whether journals provide transparent editorial policies, credible peer review, clear fees, appropriate indexing claims, and verifiable contact information.
Researchers should be cautious of deceptive journals or publishing platforms that misrepresent peer-review practices, indexing status, impact indicators, or editorial credentials.
Publication decisions should prioritise scholarly suitability and integrity rather than promises of unusually rapid acceptance.
Peer Review and Confidentiality
Peer review is an important component of scholarly communication.
Researchers acting as reviewers should evaluate manuscripts fairly, constructively, and confidentially.
Unpublished ideas or data obtained through peer review should not be used for personal advantage.
Reviewers should declare conflicts of interest when appropriate and avoid reviewing manuscripts where impartiality may reasonably be questioned.
Constructive peer review should focus on research quality, methodology, evidence, interpretation, and presentation rather than personal criticism of authors.
Authors, in turn, should respond to reviewers respectfully and transparently, explaining how comments were addressed or why particular recommendations were not adopted.
Correction, Retraction and Scholarly Accountability
Responsible scholarship includes acknowledging errors.
Even carefully conducted research can contain mistakes.
If researchers identify an important error after publication, they should work with the relevant publisher or institution to determine whether a correction, clarification, or other action is appropriate.
Where serious problems undermine the reliability of published work, formal retraction may be necessary.
Correcting the scholarly record should not automatically be viewed as a failure. Transparent correction mechanisms are an important part of a functioning research system.
The more serious ethical problem arises when researchers knowingly conceal errors or unreliable findings.
Research with Communities and Social Responsibility
Researchers working with communities should consider the broader consequences of their work.
Community-based research should avoid treating participants simply as sources of data.
Where appropriate, researchers should communicate findings back to communities and consider how research outcomes may contribute to practical understanding or decision-making.
Studies involving vulnerable groups require particular sensitivity.
Researchers should avoid language that stigmatises communities or reinforces harmful stereotypes.
Context is essential when interpreting socioeconomic, behavioural, cultural, educational, or health-related findings.
Responsible research should recognise the dignity and agency of people whose experiences contribute to academic knowledge.
Ethical Use of Research Outputs
Research findings can influence planning decisions, public policy, professional practices, technologies, investment, and public understanding.
Researchers therefore have a responsibility to communicate evidence carefully.
Results should not be exaggerated to create stronger headlines or policy claims than the evidence supports.
Statistical association should not automatically be described as causation. Findings from limited samples should not be presented as universally applicable.
Limitations and uncertainty should be communicated clearly.
Responsible scholarship requires researchers to distinguish between what the evidence demonstrates, what it suggests, and what remains uncertain.
Building a Culture of Research Integrity
Research integrity is most effective when it becomes part of institutional culture.
Track2Training seeks to promote this culture through research training, methodological guidance, ethical awareness, scholarly communication, and responsible academic practice.
Students and early-career researchers should be introduced to research ethics from the beginning of their academic development rather than encountering it only during journal submission or ethics review.
Training may address topics such as:
research ethics, informed consent, plagiarism prevention, authorship, citation practices, data management, statistical integrity, AI use, publication ethics, peer review, and research transparency.
Senior researchers and supervisors also play an important role by modelling responsible research practices.
Our Commitment to Responsible Scholarship
At Track2Training, research integrity is understood as a shared responsibility involving researchers, supervisors, institutions, participants, reviewers, editors, publishers, and research collaborators.
Ethical scholarship requires more than compliance with rules. It requires a commitment to honesty, transparency, fairness, respect, accountability, and intellectual responsibility.
From informed consent and participant confidentiality to authorship, data integrity, AI-assisted research, and publication practices, ethical considerations should remain embedded throughout the research process.
As technologies and research methods continue to evolve, new ethical challenges will emerge. The principles underlying responsible research, however, remain consistent: protect participants, preserve the integrity of evidence, acknowledge contributions fairly, communicate transparently, and ensure that scholarly work deserves the trust placed in it.
Through these principles, Track2Training aims to strengthen a research environment in which academic quality and ethical responsibility advance together.
Which relationship has taught you the most about yourself?
Track2Training Working Paper Series: Promoting Early-Stage Academic Research and Scholarly Discussion
Academic research develops through discussion, revision, critique, and continuous refinement. Important ideas often emerge long before they are published in a journal, book, or formal research report. Researchers frequently need a credible platform where they can share preliminary findings, conceptual arguments, policy analyses, methodological notes, field observations, and early-stage research outputs with a wider academic audience.
The Track2Training Working Paper Series is conceived as an institutional platform for the dissemination of such emerging research.
The series is designed to provide researchers, faculty members, doctoral scholars, professionals, and independent academics with an opportunity to circulate research that is sufficiently developed for scholarly discussion but may still be undergoing refinement before submission to a peer-reviewed journal or other formal publication outlet.
By establishing a structured Working Paper Series, Track2Training aims to strengthen academic exchange, improve the visibility of ongoing research, encourage constructive feedback, and support the development of high-quality scholarly outputs.
What Is a Working Paper?
A working paper is a research document that presents ideas, evidence, analysis, or preliminary findings before final journal publication.
Unlike a published journal article, a working paper may represent a study that is still developing. The research may later be revised substantially after receiving comments from colleagues, seminar participants, reviewers, or other researchers.
Working papers are widely used by universities, research centres, policy institutes, think tanks, and academic departments because they allow knowledge to circulate more quickly than conventional publication systems often permit.
A working paper may contain completed empirical analysis, an emerging theoretical framework, a methodological innovation, a policy evaluation, a research note, or a structured discussion of an important academic question.
The key principle is transparency. Readers should clearly understand that the document represents a working version of research rather than necessarily being its final published form.
Purpose of the Track2Training Working Paper Series
The Track2Training Working Paper Series is intended to serve several interconnected academic purposes.
First, it provides a formal channel for disseminating early-stage research. Researchers often spend months or years collecting and analysing data before their work appears in a journal. A working paper enables useful findings to enter academic discussion earlier.
Second, the series encourages scholarly feedback. Early circulation allows researchers to identify weaknesses in arguments, methods, interpretation, or presentation before final publication.
Third, working papers help create a visible record of ongoing institutional research. A regularly updated series can demonstrate the range of questions being investigated by scholars associated with Track2Training and its wider research network.
Fourth, the platform can encourage interdisciplinary dialogue. A paper developed within urban planning, for example, may contain findings relevant to transportation, sustainability, public policy, economics, or environmental research.
Finally, the series can provide emerging researchers with experience in preparing professional research manuscripts and presenting their work to an academic audience.
Who Can Contribute?
The Working Paper Series is envisioned as an inclusive but academically structured platform.
Potential contributors may include:
university faculty members,
doctoral and postgraduate researchers,
postdoctoral scholars,
professionals engaged in research,
independent researchers,
research fellows,
institutional collaborators,
interdisciplinary research teams, and
scholars participating in Track2Training research initiatives.
Collaborative papers involving authors from multiple institutions or disciplines are particularly encouraged where such collaboration contributes to the quality and relevance of the work.
Students and early-career researchers may also submit papers, preferably where the work demonstrates a clear research objective, appropriate methodology, and meaningful academic contribution.
Types of Working Papers
The series can accommodate several forms of research output.
Preliminary Empirical Findings
Researchers who have completed substantial data collection and initial analysis may use a working paper to present emerging findings.
For example, a transportation researcher may publish preliminary results from a commuter survey, while an environmental researcher may present early spatial findings from a land-use change study.
Such papers can help authors receive feedback before developing the final journal manuscript.
Conceptual Papers
Not all valuable academic work is based on primary data.
Conceptual papers may develop theoretical arguments, propose analytical frameworks, integrate ideas from multiple disciplines, or introduce new ways of understanding an existing research problem.
These papers can be especially valuable in emerging fields where established theoretical frameworks remain limited.
Policy Analyses
Policy research often needs to be communicated while the policy issue remains current.
Working papers can examine legislation, institutional frameworks, implementation challenges, governance structures, planning regulations, educational policies, environmental regulations, or public programmes.
Such papers should distinguish clearly between evidence, interpretation, and recommendations.
Research Notes
Research notes are generally shorter and more focused than full working papers.
They may report an interesting observation, methodological challenge, dataset, pilot study, technical procedure, or emerging research question that deserves wider discussion.
Research notes can help researchers communicate useful information without waiting until a complete journal article has been developed.
Methodological Papers
The Working Paper Series can also provide space for studies focusing specifically on research methods.
Possible subjects include sampling strategies, questionnaire development, structural equation modelling, machine learning applications, bibliometric methods, GIS analysis, systematic review protocols, qualitative coding approaches, or the integration of multiple methods.
Methodological working papers can support wider research capacity by making analytical procedures more transparent.
Literature and Evidence Reviews
Structured literature reviews, scoping reviews, bibliometric analyses, and evidence maps may also be suitable for the series.
These papers can identify research trends, knowledge gaps, methodological patterns, and areas requiring further investigation.
Field Reports and Case Studies
Field-based research often generates valuable evidence that may not fit immediately into a traditional journal format.
Working papers can document field surveys, planning cases, community studies, heritage assessments, institutional experiences, pilot projects, and local research initiatives.
Such outputs are particularly useful for connecting academic research with real-world contexts.
Priority Research Areas
The Track2Training Working Paper Series is interdisciplinary in scope.
Priority areas may include urban planning, architecture, transportation, sustainable development, environmental studies, education, artificial intelligence, machine learning, public policy, governance, social sciences, heritage studies, data science, research methodology, digital transformation, and emerging technologies.
The series may also include papers addressing interdisciplinary problems that cannot be adequately located within a single academic discipline.
This broad scope reflects the institutional research philosophy of Track2Training, which recognises that many contemporary challenges require collaboration across fields.
Suggested Structure of a Working Paper
Although the structure may vary depending on the nature of the research, an empirical working paper could generally include:
Title and Author Information – including institutional affiliation and contact details.
Abstract – a concise overview of the purpose, methodology, major findings, and contribution.
Keywords – terms representing the central themes of the paper.
Introduction – background, research problem, objectives, and significance.
Literature Review – relevant scholarship and identification of the research gap.
Methodology – research design, data sources, sampling, methods, and analytical techniques.
Results or Preliminary Findings – presentation of evidence.
Discussion – interpretation of findings in relation to previous research.
Implications – academic, professional, or policy relevance.
Limitations and Future Research – acknowledgement of areas requiring further investigation.
Conclusion – summary of the principal contribution.
Conceptual papers, policy papers, and research notes may use a more flexible structure appropriate to their purpose.
Academic Quality and Screening
Although working papers are preliminary outputs, they should still meet basic standards of academic quality.
Submissions to the Track2Training Working Paper Series should demonstrate a clear research purpose, coherent argument, appropriate methodology where applicable, accurate referencing, and responsible scholarly practice.
An institutional screening process can be used to assess whether submitted papers are suitable for inclusion in the series.
Screening may consider:
relevance to the scope of the series,
originality of the research question,
clarity of writing,
adequacy of methodology,
transparency of data and analysis,
ethical considerations,
citation and attribution practices, and
overall scholarly value.
This screening process should not be represented as equivalent to external journal peer review unless a formal peer-review procedure is specifically established.
Clearly distinguishing editorial screening from formal peer review is important for academic transparency.
Research Ethics and Integrity
All submissions should follow recognised principles of responsible research.
Authors should ensure that their work is original, properly referenced, and free from plagiarism or inappropriate duplication.
Where human participants are involved, relevant ethical requirements should be followed, including informed consent, confidentiality, privacy, and institutional ethical approval where required.
Authors should also disclose conflicts of interest, funding sources, and important methodological limitations.
Where artificial intelligence tools have been used in research or manuscript preparation, disclosure should follow applicable institutional, journal, or disciplinary standards.
The use of AI does not transfer responsibility away from authors. Authors remain accountable for the accuracy, originality, interpretation, and integrity of their work.
Versioning and Revision
One of the most useful characteristics of a working paper is that it can evolve.
A paper may first appear as Version 1 and later be updated after receiving comments, presenting the work at a conference, completing additional analysis, or revising the conceptual framework.
A transparent versioning system can record these changes.
Each version should ideally include the date of publication and an indication that readers should consult the most recent version where available.
Versioning can demonstrate the development of research over time and provide a useful scholarly record.
Relationship with Journal Publication
A Working Paper Series should complement, rather than replace, peer-reviewed publication.
Authors may subsequently develop their working papers into journal articles, book chapters, conference papers, or research reports.
However, journal policies vary regarding prior circulation of manuscripts as working papers or preprints.
Authors should therefore check the policies of their intended journal before posting a working paper publicly.
Where a paper is later formally published, the working-paper page may be updated to include the citation of the final publication.
This creates a useful link between early-stage research and the completed scholarly output.
Visibility and Academic Communication
Working papers can improve the discoverability of ongoing research when they are organised systematically and supported by appropriate metadata.
Each paper should ideally have a dedicated webpage containing the title, authors, affiliations, abstract, keywords, publication date, working-paper number, version, and recommended citation.
A consistent numbering system could be introduced, such as:
Track2Training Working Paper No. 2026-01
This can be followed by subsequent papers according to year and sequence.
Where technically and institutionally appropriate, persistent identifiers may also be considered in the future to improve citation stability and discoverability.
The series can additionally be promoted through research newsletters, academic social networks, seminars, institutional profiles, and conference activities.
Encouraging Scholarly Discussion
A Working Paper Series should function as more than an online storage location.
Its broader value lies in encouraging dialogue.
Track2Training can connect working papers with research seminars, online discussions, author presentations, thematic workshops, or invited responses.
Researchers could present their ongoing work and receive comments from scholars working on similar questions.
This process can improve the quality of subsequent publications while developing a stronger culture of academic exchange.
Supporting Early-Career Researchers
The Working Paper Series can be especially valuable for doctoral scholars and early-career researchers.
Preparing a working paper requires researchers to organise their evidence, articulate the contribution of their study, explain their methodology, and communicate findings clearly.
This process can help scholars identify weaknesses before formal journal submission.
Early-career researchers can also benefit from the visibility created by sharing their ongoing work and engaging with other academics.
However, quality standards should remain consistent across career stages. Supporting emerging researchers should mean helping them develop rigorous research rather than lowering scholarly expectations.
Building an Institutional Research Record
Over time, the Track2Training Working Paper Series can develop into an important archive of institutional research activity.
A searchable collection of working papers can reveal the development of research themes, collaborations, methods, locations, and policy interests across years.
Individual papers may later lead to journal publications, funded projects, doctoral research, policy reports, conferences, datasets, or collaborative studies.
The series can therefore become part of a broader institutional research ecosystem connecting research projects, seminars, publications, researchers, training programmes, and knowledge dissemination.
A Platform for Research in Progress
Research rarely moves directly from an idea to a finished publication.
It develops through reading, debate, data collection, analysis, revision, criticism, and reconsideration.
The Track2Training Working Paper Series is intended to recognise this process by creating a formal space for research in progress.
By facilitating the circulation of preliminary findings, conceptual studies, policy analyses, methodological contributions, and research notes, Track2Training seeks to strengthen scholarly dialogue while helping researchers refine their work before final publication.
The series reflects a broader institutional commitment to open academic exchange, methodological transparency, research integrity, interdisciplinary collaboration, and evidence-based knowledge creation.
As the collection develops, it has the potential to become a visible record of emerging scholarship and an important component of Track2Training’s identity as a research-oriented academic institution.
Which relationship has taught you the most about yourself?
Which reResearch Methodology at Track2Training: From Research Questions to Evidence-Based Findings
Research methodology provides the foundation for credible academic inquiry. A well-designed study does more than collect information; it establishes a clear relationship between research questions, evidence, analytical methods, and interpretation. At Track2Training, research methodology is treated as a structured process that guides researchers from the identification of a problem to the development of evidence-based conclusions.
The organisation promotes methodological approaches that are rigorous, transparent, interdisciplinary, and appropriate to the nature of the research question. Depending on the study, this may involve literature reviews, questionnaire surveys, field investigations, interviews, focus groups, statistical modelling, structural equation modelling, machine learning, GIS analysis, qualitative interpretation, or mixed-method designs.
The objective is not simply to apply sophisticated tools. The central concern is to ensure that every method selected contributes directly to answering the research questions in a valid and meaningful way.
Beginning with a Research Problem
Every research project begins with a clearly defined problem.
A strong research problem identifies an issue that requires systematic investigation. It may emerge from gaps in previous research, practical challenges, policy concerns, changing technologies, environmental pressures, social problems, or inconsistencies in existing knowledge.
At Track2Training, researchers are encouraged to distinguish between a broad topic and a researchable problem.
For example, “urban transportation” is a broad topic. A more focused research problem may examine how first- and last-mile accessibility influences public transport preference in a rapidly growing city.
Similarly, “artificial intelligence in education” is broad, while a specific research problem may investigate whether generative AI affects academic writing practices among postgraduate students.
Once the problem is defined, researchers develop research questions, objectives, and where appropriate, hypotheses.
These elements establish the direction of the study and determine the type of evidence required.
Literature Review and Research Gap Identification
A literature review is one of the most important stages of research design.
It helps researchers understand what is already known, what methods have been used, where findings disagree, and which issues remain insufficiently explored.
At Track2Training, literature reviews may range from traditional narrative reviews to systematic literature reviews, scoping reviews, bibliometric studies, and evidence-mapping exercises.
A rigorous literature review generally involves identifying relevant databases, developing search terms, screening studies, applying eligibility criteria, organising evidence, and synthesising findings.
For systematic reviews, transparent procedures are particularly important. Search strategies, inclusion and exclusion criteria, screening processes, and quality-assessment approaches should be clearly documented.
The purpose of the literature review is not merely to summarize previous publications. It should establish the intellectual foundation of the research and demonstrate why the proposed study is necessary.
A clearly identified research gap helps connect previous knowledge with the objectives of the new investigation.
Developing the Conceptual or Theoretical Framework
Once the literature is reviewed, researchers may develop a conceptual or theoretical framework.
A theoretical framework draws upon established theories to explain relationships between concepts. A conceptual framework may combine ideas from previous literature into a structure that guides data collection and analysis.
For example, a transportation study might examine relationships among accessibility, service quality, infrastructure, safety, and public transport preference.
An environmental study may investigate how land-use characteristics, vegetation, density, and surface materials influence urban heat.
The framework helps researchers identify variables, constructs, expected relationships, and appropriate indicators.
In quantitative research, the framework often supports hypothesis development. In qualitative research, it can provide an interpretive lens while still allowing new themes to emerge from the data.
Questionnaire Development and Measurement Design
Questionnaires are widely used in research involving perceptions, attitudes, behaviour, preferences, satisfaction, and socioeconomic characteristics.
However, a questionnaire must be carefully designed if it is to generate reliable data.
At Track2Training, questionnaire development begins by linking each question or indicator with the study objectives and conceptual framework.
Researchers may use established measurement scales from previous studies where appropriate. When new items are developed, they should be clearly worded, relevant to the target population, and capable of measuring the intended concept.
Likert scales are commonly used for measuring perceptions and attitudes, while categorical and numerical questions may be used for demographic, behavioural, or contextual information.
Questionnaires should also avoid leading questions, double-barrelled questions, ambiguous language, and unnecessary technical terminology.
A pilot survey is strongly recommended before full data collection. Pilot testing helps identify problems in wording, sequence, interpretation, response options, and survey duration.
Depending on the study, reliability and validity testing may later be performed to determine whether the measurement instrument performs adequately.
Sampling Design
Researchers rarely have the resources to study an entire population. Sampling is therefore a critical methodological decision.
The sampling process begins by defining the target population. Researchers then determine who is eligible to participate and how participants will be selected.
Probability sampling techniques include simple random sampling, systematic sampling, stratified sampling, and cluster sampling.
Non-probability approaches include purposive sampling, convenience sampling, quota sampling, and snowball sampling.
The appropriate method depends on the research context.
A household mobility survey may require stratified sampling across neighbourhoods, while an expert-based heritage assessment may use purposive sampling because participants need specialised knowledge.
Qualitative studies often use smaller purposive samples because the objective is depth of understanding rather than statistical representation.
Sample size should also be justified. The required number of participants depends on factors such as population size, study design, statistical technique, model complexity, expected variation, and required statistical power.
Researchers should therefore avoid treating sample size as an arbitrary number.
Field Surveys and Primary Data Collection
Field surveys allow researchers to collect evidence directly from real-world contexts.
Track2Training encourages systematic fieldwork protocols to improve consistency and data quality.
Before entering the field, researchers should establish the survey instrument, sampling plan, study locations, ethical procedures, data-recording format, and quality-control measures.
Field data may include household surveys, commuter surveys, pedestrian counts, traffic observations, building assessments, environmental measurements, photographs, spatial observations, land-use records, or infrastructure audits.
Digital data-collection platforms can also improve efficiency by incorporating GPS locations, timestamps, validation rules, and real-time data entry.
Researchers should maintain clear documentation of how, when, and where data were collected.
This strengthens transparency and helps other researchers evaluate the reliability of the study.
Qualitative Research Methods
Not every research question can be adequately answered through numerical data.
Qualitative research is particularly valuable when researchers need to understand experiences, perceptions, institutional processes, cultural meanings, or complex social relationships.
Common qualitative methods include semi-structured interviews, in-depth interviews, focus group discussions, participant observation, case studies, document analysis, and content analysis.
At Track2Training, qualitative methods are used when the research problem requires depth, context, and interpretation.
Interview questions are typically designed around broad themes while allowing participants to explain their perspectives in detail.
Qualitative data can then be coded and analysed to identify recurring themes, patterns, contradictions, and relationships.
Researchers should also consider reflexivity, positionality, saturation, credibility, and transparency during qualitative analysis.
Where appropriate, qualitative findings can be integrated with quantitative data through a mixed-method research design.
Data Cleaning and Preparation
Analysis should not begin immediately after data collection.
Raw data often contain missing values, duplicate records, incorrect entries, inconsistent coding, unusual observations, or incomplete responses.
Data cleaning is therefore an essential methodological step.
Researchers may check frequency distributions, ranges, missing-value patterns, outliers, logical inconsistencies, and variable coding.
For questionnaire data, negatively worded items may need reverse coding. Composite variables may need to be calculated, and categorical data may require appropriate numerical encoding.
Proper documentation of these procedures helps ensure reproducibility.
Data should never be altered simply to produce a desired statistical result. Any exclusion or transformation should have a defensible methodological justification.
Descriptive and Inferential Statistical Analysis
Statistical analysis helps researchers summarise patterns and test relationships within quantitative data.
Descriptive statistics commonly include frequencies, percentages, means, medians, standard deviations, and distributions.
These provide an initial understanding of the sample and variables.
Inferential techniques may then be used to investigate research questions or hypotheses.
Depending on the data, researchers may apply:
t-tests,
chi-square tests,
analysis of variance,
correlation,
linear regression,
logistic regression,
multinomial models,
non-parametric tests,
factor analysis, or
multivariate statistical techniques.
Software such as SPSS, R, and Python can support these analyses.
However, Track2Training emphasises that software should not replace statistical reasoning. Researchers need to understand assumptions, variable types, sample requirements, effect sizes, confidence intervals, and the substantive meaning of results.
A statistically significant result is not automatically a practically important result.
Structural Equation Modelling
Structural Equation Modelling, including covariance-based SEM and Partial Least Squares Structural Equation Modelling, is increasingly used in behavioural, management, planning, transportation, and social science research.
SEM allows researchers to examine relationships among multiple latent constructs simultaneously.
For example, a study may investigate whether infrastructure quality, service experience, and accessibility influence public transport preference.
The analysis generally involves two major components: the measurement model and the structural model.
Measurement-model assessment evaluates whether indicators adequately represent their intended constructs. Researchers may examine indicator loadings, internal consistency, reliability, convergent validity, and discriminant validity.
Structural-model assessment examines relationships between constructs using path coefficients, significance testing, effect sizes, explanatory power, predictive relevance, and other appropriate indicators.
Software such as SmartPLS, AMOS, R, or other SEM platforms may be used depending on the model and research philosophy.
Researchers should avoid using SEM simply because it appears sophisticated. It should be selected only when the conceptual model and data structure justify its application.
Machine Learning and Predictive Analytics
Machine learning provides another set of tools for analysing complex data.
Unlike many traditional statistical models, machine-learning approaches may place greater emphasis on prediction, classification, and pattern recognition.
Techniques may include decision trees, random forests, support vector machines, gradient boosting, neural networks, and clustering algorithms.
At Track2Training, machine learning may be applied to transport mode choice, environmental prediction, urban classification, educational analytics, research trend analysis, or other data-intensive problems.
Model development typically involves data preparation, feature selection, division into training and testing sets, model training, validation, and performance evaluation.
Metrics such as accuracy, precision, recall, F1-score, area under the curve, mean squared error, or calibration measures may be used depending on the problem.
Interpretability is also important.
Tools such as feature importance or SHAP analysis can help researchers understand which variables contribute most strongly to model predictions.
The objective should not be to replace established statistical approaches automatically, but to select the method best suited to the research purpose.
GIS and Spatial Analysis
Many research problems have a spatial dimension.
Geographic Information Systems allow researchers to integrate, analyse, and visualise geographically referenced data.
GIS applications at Track2Training may include land-use analysis, transport accessibility, urban growth, infrastructure mapping, environmental assessment, service-area analysis, spatial inequality, heritage mapping, and climate-related studies.
Researchers can combine spatial datasets such as administrative boundaries, road networks, public transport routes, satellite imagery, population data, land-use maps, environmental indicators, and field observations.
Spatial techniques may include proximity analysis, buffer analysis, network analysis, density analysis, overlay analysis, hotspot identification, and spatial statistics.
Remote sensing can further support studies of land-use change, vegetation, surface temperature, urban expansion, and environmental conditions.
Maps should be treated as analytical outputs rather than decorative illustrations. Every spatial representation should communicate a clearly defined research finding.
Mixed-Method Research
Complex research questions often require both quantitative and qualitative evidence.
Mixed-method research combines these approaches systematically.
For example, a researcher may first conduct a large questionnaire survey to identify statistically significant factors and then undertake interviews to understand why those factors matter to participants.
Alternatively, qualitative interviews may be used first to identify themes that inform the design of a subsequent quantitative survey.
The strength of mixed methods lies in integration.
Simply conducting a survey and a few interviews does not automatically create a mixed-method study. Researchers need to explain how the two forms of evidence complement, confirm, expand, or challenge one another.
Interpreting Research Findings
Interpretation is the stage where numerical outputs, interview themes, spatial patterns, or model results are transformed into meaningful knowledge.
Researchers should return to the original research questions and explain what the findings reveal.
Results should also be compared with previous studies.
Where findings agree with earlier research, researchers can discuss how the new evidence strengthens existing understanding. Where they differ, possible contextual, methodological, or theoretical explanations should be considered.
Researchers should avoid overstating conclusions.
Association does not always imply causation, statistical significance does not necessarily imply practical significance, and findings from one location or population may not automatically generalise to another.
Limitations should therefore be acknowledged openly.
From Evidence to Recommendations
Evidence-based research can inform policy, professional practice, planning, education, technology development, and future scholarship.
However, recommendations should emerge directly from the findings.
A transportation study may identify the need for improved feeder connectivity. An education study may indicate gaps in methodological training. An environmental assessment may demonstrate the importance of protecting green areas. A policy study may reveal implementation barriers requiring institutional reform.
Recommendations become more credible when readers can clearly trace them back to the evidence.
Research Integrity and Reproducibility
Methodological quality is closely connected with research integrity.
Track2Training encourages researchers to document their methods clearly, report findings accurately, preserve research data responsibly, acknowledge limitations, and avoid selective reporting.
Where appropriate, research workflows should be reproducible.
This may involve maintaining code, analytical logs, questionnaires, data dictionaries, GIS procedures, search strategies, or methodological documentation.
Transparency strengthens confidence in academic research and makes it easier for other scholars to build upon previous work.
From Research Questions to Evidence-Based Knowledge
Research methodology is not a single technique or software package. It is the complete intellectual and practical process through which a research question is transformed into defensible evidence and meaningful conclusions.
At Track2Training, methodological choices are guided by the nature of the research problem, the available evidence, ethical considerations, theoretical foundations, and the type of conclusions researchers seek to draw.
By integrating literature review, survey design, sampling, field investigation, qualitative inquiry, statistical analysis, SEM, machine learning, GIS, and careful interpretation, Track2Training promotes a research culture based on methodological rigour rather than methodological complexity for its own sake.
The ultimate objective is to produce research that is transparent, reproducible, ethically responsible, academically credible, and relevant to society.
Through systematic research design and evidence-based analysis, Track2Training seeks to strengthen the connection between scholarly inquiry and meaningful knowledge creation.ationship has taught you the most about yourself?
Current Research Projects and Ongoing Studies at Track2Training
Research institutions are defined not only by the knowledge they disseminate but also by the questions they actively investigate. At Track2Training, ongoing research is organised around contemporary challenges in urban development, transportation, sustainability, education, artificial intelligence, social sciences, public policy, environmental management, and emerging technologies.
The organisation’s research portfolio reflects an interdisciplinary approach in which academic inquiry is connected with practical problems, policy concerns, technological change, and societal development. Projects are designed to contribute to scholarly literature while also generating insights that may be useful for planners, educators, policymakers, researchers, practitioners, institutions, and communities.
This page provides an institutional overview of the major research themes and ongoing areas of investigation associated with Track2Training. It can serve as a continuously updated Research Projects section documenting active studies, collaborative initiatives, methodological developments, and future research directions.
Urban Planning and Built Environment Research
Urbanisation is transforming cities at an unprecedented pace. Population growth, changing mobility patterns, land pressure, housing demand, environmental stress, and infrastructure requirements are creating new challenges for planners and urban institutions.
Track2Training is engaged in research addressing the relationship between land use, infrastructure, mobility, accessibility, urban form, and planning policy.
Current areas of investigation include transit-oriented development, land-use regulation, development rights, urban accessibility, infrastructure capacity, public space, heritage conservation, informal-sector planning, urban resilience, and sustainable neighbourhood development.
Studies in this domain examine how planning policies influence development patterns and how urban systems can be made more inclusive, efficient, and sustainable.
Particular attention is given to Indian cities, where rapid growth frequently creates tensions between development, infrastructure provision, heritage protection, environmental sustainability, and social equity.
Transportation, Mobility and Accessibility Studies
Transportation research forms an important part of the institutional research portfolio.
Mobility influences access to employment, education, healthcare, markets, and public services. It also affects urban productivity, environmental quality, social inclusion, and individual quality of life.
Ongoing research examines themes such as public transport preference, first- and last-mile connectivity, travel behaviour, transit-oriented development, pedestrian accessibility, multimodal transport, service quality, transport infrastructure, and sustainable mobility.
Researchers associated with Track2Training are also examining the factors that influence people’s choice of transport mode. These may include distance, accessibility, reliability, safety, comfort, travel time, infrastructure quality, household characteristics, and land-use conditions.
Quantitative techniques such as regression analysis, structural equation modelling, discrete-choice modelling, machine learning, and statistical comparison are increasingly being incorporated into transportation research.
A long-term objective is to generate evidence that can contribute to more accessible, integrated, and people-centred urban mobility systems.
Sustainable Development and Climate-Responsive Research
Sustainability is a cross-cutting theme connecting many Track2Training research activities.
Current studies explore how cities, buildings, communities, institutions, and infrastructure systems can respond more effectively to environmental challenges.
Priority themes include climate-resilient urban planning, sustainable transportation, energy-efficient buildings, environmental assessment, urban heat, water systems, waste management, green infrastructure, land-use change, and sustainable development indicators.
Research is also examining how climate extremes affect human behaviour and urban systems. Extreme heat, flooding, changing rainfall patterns, and other climate-related events can influence mobility, energy consumption, health, infrastructure performance, and everyday urban activity.
Such studies are important because climate change increasingly requires planners and policymakers to incorporate adaptation and resilience into long-term development strategies.
Track2Training also encourages research that connects local development challenges with the United Nations Sustainable Development Goals, particularly those relating to sustainable cities, climate action, infrastructure, education, clean water, innovation, and reduced inequality.
Artificial Intelligence and Machine Learning Research
Artificial intelligence is rapidly changing the way research is conducted and how decisions are made across many professional fields.
Track2Training is developing research interests in the application of artificial intelligence, machine learning, data analytics, generative AI, and automated decision-support systems.
Research in this area investigates how computational tools can be used for prediction, classification, pattern recognition, modelling, optimisation, and evidence-based decision-making.
Potential applications include urban planning, transportation, education, environmental monitoring, research analytics, infrastructure management, academic publishing, and public administration.
Researchers are also interested in comparing traditional statistical methods with machine-learning approaches. Such comparisons help identify the circumstances in which advanced computational techniques provide meaningful improvements and where conventional methods may remain preferable because of interpretability or data limitations.
Responsible artificial intelligence is another important research priority.
Track2Training recognises that AI systems raise questions regarding transparency, bias, accountability, privacy, authorship, data quality, and research integrity. Studies in this area therefore consider not only technological capability but also the ethical and institutional implications of AI adoption.
Education and Higher Education Research
Education is both a field of research and a foundation for broader social development.
Track2Training supports studies examining higher education, research training, digital learning, academic skills, educational technology, curriculum development, student engagement, research literacy, and scholarly communication.
One important area of interest is research capacity building among postgraduate students, doctoral scholars, and early-career researchers.
Academic researchers increasingly need competencies in literature searching, research design, statistics, data visualisation, systematic reviews, bibliometric methods, academic writing, research ethics, and digital tools.
Ongoing studies may investigate how such competencies are developed and how universities and research organisations can strengthen methodological training.
The use of artificial intelligence in education is another emerging theme. Research questions include how generative AI affects teaching, assessment, academic writing, creativity, research practices, and academic integrity.
Systematic Reviews and Evidence Synthesis
Evidence synthesis is becoming increasingly important across academic disciplines.
Track2Training promotes research using systematic literature reviews, scoping reviews, bibliometric analysis, meta-analysis, and structured evidence-mapping techniques.
Such projects help researchers identify patterns in existing scholarship, evaluate the quality of evidence, identify research gaps, and develop future research agendas.
Ongoing evidence-synthesis themes include transportation, sustainable development, building performance, urban policy, climate impacts, heritage conservation, educational technology, and emerging research methodologies.
Methodological standards such as transparent search strategies, eligibility criteria, systematic screening, quality assessment, and reproducible reporting are emphasised.
Research in this area also contributes to improved scholarly practice by demonstrating how reviews can move beyond simple literature summaries toward structured and evidence-based synthesis.
Social Sciences and Community Research
Social development cannot be understood only through infrastructure, technology, or economics. Institutions, communities, identities, livelihoods, social networks, and patterns of inequality also shape development outcomes.
Track2Training therefore supports research in areas such as social inclusion, informal economies, community participation, livelihoods, social justice, gender, vulnerable populations, urban informality, and citizen engagement.
Studies may examine how development policies affect different social groups and whether planning systems adequately represent the needs of people whose livelihoods or living conditions are often overlooked in formal policy frameworks.
Community-based and participatory research approaches are particularly valuable because they allow researchers to understand local experiences rather than relying solely on administrative or secondary data.
Such research can contribute to more inclusive planning and more responsive public institutions.
Public Policy and Governance Studies
Evidence-based public policy represents another important institutional research direction.
Track2Training encourages studies examining how policies are formulated, implemented, evaluated, and experienced by citizens.
Research themes include urban governance, planning legislation, institutional performance, development regulation, public service delivery, policy implementation, local government, infrastructure governance, and regulatory frameworks.
Studies may compare policy intentions with actual implementation outcomes.
For example, a development policy may appear effective in formal regulations but encounter difficulties because of market conditions, administrative capacity, public awareness, infrastructure limitations, or stakeholder participation.
Understanding such implementation gaps is essential for meaningful policy evaluation.
Public policy research at Track2Training therefore seeks to connect legal and institutional frameworks with empirical evidence from real-world settings.
Environmental and Natural Resource Research
Environmental research has become increasingly important as societies face pressure on land, water, ecosystems, and natural resources.
Track2Training supports research on water systems, environmental planning, ecological sustainability, river-sensitive development, environmental governance, land-use change, biodiversity, urban ecosystems, pollution, and climate adaptation.
Such projects often require interdisciplinary methods involving planning, environmental science, engineering, public policy, and community participation.
A key objective is to understand how development can be balanced with environmental protection.
Research may examine environmental impacts at different scales, from individual buildings and neighbourhoods to cities, river systems, and regional landscapes.
Heritage, Culture and Place-Based Research
Historic environments contribute to identity, tourism, cultural continuity, and local economies.
Track2Training is interested in research related to heritage conservation, adaptive reuse, cultural landscapes, historic urban areas, tourism activation, place identity, and cultural sustainability.
Studies may evaluate heritage significance, physical condition, visitor perception, management practices, and the relationship between conservation and economic development.
The organisation also encourages research exploring how cultural heritage can be integrated into contemporary planning without reducing historic places to purely commercial tourism assets.
This research area connects architecture, planning, history, tourism, sociology, conservation, and cultural studies.
Emerging Technology and Digital Transformation
Digital technologies are transforming both professional practice and research methodology.
Ongoing research interests include digital twins, smart cities, GIS, remote sensing, building information modelling, virtual environments, automation, data visualisation, digital fabrication, and technology-supported decision-making.
These technologies provide new opportunities to analyse complex systems, simulate alternative scenarios, and communicate information more effectively.
However, digital transformation also creates questions regarding accessibility, technical capacity, governance, interoperability, privacy, and technological dependence.
Track2Training therefore approaches emerging technologies as both technical tools and subjects of critical research.
Research Methods and Methodological Innovation
Strong research depends on strong methodology.
Track2Training supports methodological research and advanced analytical practices involving SPSS, R, Python, SmartPLS, structural equation modelling, machine learning, multivariate statistics, GIS, bibliometric tools, and qualitative research software.
Research in this area is not limited to applying software. Greater emphasis is placed on understanding research design, assumptions, measurement quality, reliability, validity, model interpretation, reproducibility, and appropriate reporting.
Methodological training and experimentation can help researchers select analytical techniques that are appropriate to their questions rather than simply using methods because they are popular.
Collaboration and Institutional Research Partnerships
Many contemporary research problems are too complex to be addressed effectively by individuals working in isolation.
Track2Training therefore encourages collaboration among universities, faculty members, doctoral researchers, research organisations, industry professionals, government institutions, civil-society organisations, and independent scholars.
Collaborative projects can include comparative research, multicity studies, systematic reviews, joint publications, policy reports, conferences, workshops, research proposals, datasets, and edited academic volumes.
The institution also seeks to support interdisciplinary teams in which researchers from different backgrounds contribute complementary expertise.
From Research Projects to Knowledge Outputs
An important objective of the Track2Training research programme is to ensure that research findings are communicated through appropriate channels.
Project outputs may include:
peer-reviewed journal articles,
conference papers,
working papers,
technical reports,
policy briefs,
research datasets,
edited books and chapters,
research methodology resources,
seminars and workshops,
public-facing research articles, and
academic training material.
Different audiences require different forms of communication. A technical research paper may be appropriate for academic specialists, while policymakers may benefit more from a concise policy brief and students may benefit from an educational research summary.
Building a Dynamic Research Portfolio
The Current Research Projects and Ongoing Studies section of Track2Training is intended to evolve continuously.
As new projects are initiated, individual project pages can provide information about research objectives, principal investigators, collaborators, methodology, study location, funding, project duration, research outputs, publications, datasets, and project status.
Over time, this can develop into a structured institutional research repository documenting the organisation’s intellectual contribution across disciplines.
Looking Ahead
Track2Training’s research portfolio reflects its broader commitment to interdisciplinary inquiry, methodological rigour, academic collaboration, and socially relevant knowledge creation.
Future research will continue to focus on the major transitions shaping contemporary society: rapid urbanisation, changing mobility, climate change, artificial intelligence, digital transformation, educational innovation, environmental sustainability, and evolving governance systems.
By bringing together researchers, institutions, students, professionals, and communities, Track2Training aims to develop an active research ecosystem in which academic investigation contributes meaningfully to knowledge, policy, professional practice, and society.
The institution’s ongoing research agenda is therefore not a fixed list of projects. It is a developing platform for inquiry, collaboration, experimentation, and evidence-based contribution to the challenges of the present and the future.
Which relationship has taught you the most about yourself?
Research at Track2Training: Our Vision, Priority Areas and Institutional Research Agenda
Research is central to the creation of knowledge, the improvement of professional practice, and the development of evidence-based solutions for society. At Track2Training, research is viewed not simply as an academic requirement but as a structured process of inquiry that connects ideas, evidence, technology, policy, and real-world challenges.
Track2Training functions as a multidisciplinary research and academic organisation committed to supporting knowledge creation, research capacity building, scholarly communication, and collaborative inquiry across a wide range of disciplines. Its institutional research agenda is designed around the belief that meaningful research should be rigorous, ethical, interdisciplinary, socially relevant, and capable of contributing to both academic advancement and practical problem-solving.
Our Research Vision
The research vision of Track2Training is to contribute to the development of an inclusive and knowledge-driven academic ecosystem where researchers, students, faculty members, practitioners, and institutions can participate in high-quality research and scholarly exchange.
Track2Training seeks to promote research that responds to contemporary societal, technological, environmental, and developmental challenges. The organisation encourages researchers to move beyond isolated disciplinary boundaries and engage with complex questions through interdisciplinary and multidisciplinary perspectives.
The long-term vision is to develop Track2Training into a platform for research collaboration, methodological innovation, academic training, knowledge dissemination, and evidence-based dialogue.
Research undertaken or supported through Track2Training is expected to contribute not only to academic literature but also to policy discussions, institutional practices, professional development, and community-level understanding.
Our Research Philosophy
The research philosophy of Track2Training is founded on five broad principles: rigour, relevance, interdisciplinarity, integrity, and accessibility.
Rigour requires that research questions are addressed through appropriate theoretical frameworks, systematic methodologies, reliable data, transparent analysis, and careful interpretation.
Relevance ensures that research remains connected to emerging academic debates and real-world challenges. Track2Training encourages studies that address issues affecting cities, communities, institutions, industries, education systems, technologies, and the environment.
Interdisciplinarity recognises that contemporary problems rarely belong to a single field. Issues such as climate change, urbanisation, artificial intelligence, public health, mobility, sustainability, and social inequality require knowledge from multiple disciplines.
Integrity remains fundamental to all scholarly activity. Research ethics, responsible authorship, transparency, proper citation, data integrity, and responsible use of artificial intelligence are therefore important components of the organisation’s academic philosophy.
Accessibility reflects the belief that research should contribute to wider knowledge exchange. Research findings should be communicated not only through scholarly journals but also through reports, working papers, policy briefs, conferences, training programmes, and public-facing academic communication.
Interdisciplinary Research Approach
Track2Training promotes interaction between disciplines because many of today’s most important research questions occur at the intersection of multiple areas of knowledge.
Urban research, for example, may involve architecture, transportation planning, environmental science, public policy, economics, sociology, data science, and governance. Similarly, research on artificial intelligence may involve computer science, education, research ethics, business, communication, and public administration.
This interdisciplinary orientation encourages researchers to examine problems from multiple perspectives and select research methods based on the nature of the problem rather than disciplinary convention alone.
Track2Training therefore supports a wide range of methodological approaches, including qualitative research, quantitative analysis, mixed-method research, systematic literature reviews, bibliometric analysis, case studies, surveys, statistical modelling, structural equation modelling, machine learning, GIS-based analysis, content analysis, policy analysis, and comparative research.
Priority Research Areas
The institutional research agenda of Track2Training covers several broad domains.
Urban Planning, Architecture and Built Environment
Urbanisation creates complex challenges involving housing, infrastructure, mobility, land use, accessibility, sustainability, public spaces, heritage conservation, and urban governance.
Track2Training promotes research related to urban planning, regional planning, architecture, urban design, transit-oriented development, land management, development regulations, infrastructure planning, heritage conservation, public spaces, and sustainable cities.
Research in this area seeks to contribute to more inclusive, resilient, accessible, and environmentally responsible urban development.
Transportation and Mobility Research
Transportation strongly influences economic opportunity, accessibility, urban form, environmental quality, and social inclusion.
Priority themes include public transport, travel behaviour, first- and last-mile connectivity, transit-oriented development, pedestrian mobility, cycling, accessibility, road safety, sustainable mobility, intelligent transportation systems, and the application of data science in transport planning.
Special attention is given to understanding how infrastructure, service quality, accessibility, behaviour, and urban design influence mobility choices.
Sustainability, Environment and Climate Research
Environmental sustainability represents another major area of institutional interest.
Research themes include climate change, energy efficiency, sustainable buildings, environmental planning, urban heat islands, ecosystem management, water systems, waste management, environmental impact assessment, climate-resilient infrastructure, and sustainable development.
Track2Training encourages research aligned with the broader goals of environmental responsibility and sustainable development.
Artificial Intelligence, Data Science and Emerging Technologies
Rapid advances in artificial intelligence and data science are transforming research, education, industry, governance, and professional practice.
Track2Training promotes research on machine learning, generative artificial intelligence, data analytics, digital twins, smart cities, automation, intelligent decision-support systems, and responsible AI.
Particular importance is placed on the ethical use of artificial intelligence, transparency of AI-assisted research, methodological validation, and the responsible integration of technology into academic and professional practices.
Education and Research Capacity Building
Education remains central to social and economic development.
Research priorities include higher education, research methodology education, digital learning, academic writing, research skills, educational technology, curriculum development, scholarly communication, student learning behaviour, and research capacity building.
Track2Training also seeks to understand how researchers can be better equipped with methodological, statistical, analytical, and communication skills.
Social Sciences and Public Policy
Research in the social sciences helps explain how institutions, communities, policies, and social structures influence development.
Track2Training encourages research on governance, social inclusion, public policy, gender, informal economies, community development, social justice, institutional performance, and citizen participation.
Evidence-based policy analysis is particularly important in connecting academic research with public decision-making.
Research Methods and Scholarly Communication
An additional institutional priority is the advancement of research methodology itself.
This includes systematic reviews, bibliometric methods, statistical modelling, survey research, structural equation modelling, qualitative analysis, reproducibility, open science, research data management, and scholarly publishing.
Track2Training promotes methodological literacy because the quality of research depends greatly on the quality of the methods used to generate and analyse evidence.
Research and Societal Relevance
The value of research extends beyond publication counts or citation indicators. Research becomes particularly meaningful when it contributes to understanding and addressing societal challenges.
Track2Training therefore encourages research that can inform planning, policy, professional practice, education, technological innovation, and community development.
Where appropriate, research outputs may be translated into policy briefs, technical reports, educational resources, working papers, professional guidelines, and public knowledge resources.
Such knowledge translation helps reduce the distance between academic research and practical implementation.
Research Ethics and Responsible Scholarship
Track2Training considers research integrity an essential institutional responsibility.
Researchers are encouraged to follow accepted standards relating to authorship, citation, plagiarism prevention, informed consent, confidentiality, data protection, conflicts of interest, and responsible reporting.
With the increasing use of generative artificial intelligence in academic work, responsible AI use is becoming particularly important. AI tools may support researchers in selected tasks, but scholarly responsibility, verification, interpretation, and accountability must remain with researchers.
Transparency regarding methods, data, limitations, and the use of computational tools strengthens confidence in research findings.
Building Research Capacity
Research institutions have a responsibility not only to produce knowledge but also to help develop future researchers.
Track2Training therefore places significant emphasis on research training and capacity building.
Academic programmes, workshops, training modules, research consultations, methodological guidance, and scholarly resources can help students, doctoral researchers, faculty members, and early-career researchers develop stronger research skills.
Key capacity-building areas include research design, literature review, systematic review methodology, statistical analysis, SPSS, R, Python, SmartPLS, structural equation modelling, bibliometric analysis, academic writing, reference management, and research publication.
Collaboration and Knowledge Networks
Research becomes stronger when knowledge is shared across institutions and disciplines.
Track2Training aims to develop research collaborations with universities, research organisations, faculty members, doctoral scholars, independent researchers, professional bodies, industry experts, and public institutions.
Collaborative research can support comparative studies, interdisciplinary projects, joint publications, conferences, workshops, edited volumes, policy studies, research training, and externally funded projects.
Building such networks forms an important part of the organisation’s long-term academic development.
Long-Term Institutional Research Agenda
The long-term research agenda of Track2Training focuses on developing a sustainable research ecosystem rather than isolated academic activities.
Future priorities include strengthening institutional research programmes, creating thematic research groups, publishing working papers, producing research reports, developing academic datasets, organising conferences and seminars, supporting methodological innovation, expanding international collaborations, and strengthening connections between research and public policy.
Track2Training also seeks to promote research aligned with the United Nations Sustainable Development Goals, particularly in areas such as quality education, sustainable cities, climate action, innovation, infrastructure, reduced inequalities, and responsible institutions.
Toward a Knowledge-Driven Research Institution
Track2Training’s institutional research agenda reflects a broader commitment to knowledge creation, academic integrity, interdisciplinary collaboration, and societal contribution.
The objective is not simply to support individual research outputs but to cultivate an environment where meaningful questions are investigated systematically, researchers receive appropriate methodological support, interdisciplinary collaboration is encouraged, and research findings are communicated responsibly.
As research challenges become increasingly interconnected, institutions must create spaces where disciplines, technologies, communities, and ideas can interact.
Through its research programmes, scholarly initiatives, training activities, collaborations, and knowledge dissemination efforts, Track2Training aims to contribute to a research culture that is rigorous, ethical, inclusive, innovative, and relevant to the changing needs of society.
Which relationship has taught you the most about yourself?
Artificial Intelligence, Machine Learning, Generative AI and Data Science are among the fastest-growing career areas for students and young professionals. Companies are increasingly using AI for supply-chain optimization, financial analytics, customer service, software development, document intelligence, forecasting, computer vision and business automation.
For students pursuing B.Tech, B.E., M.Tech, MCA, BCA, B.Sc., M.Sc., MBA, PhD or other technology-related programs, an AI/ML internship can provide valuable industry exposure and help build a strong career portfolio.
From multinational corporations to AI-native startups, there are many organisations worth monitoring for internship and early-career opportunities.
🏢 1. Global Supply Chain, FinTech & Enterprise Companies
Large corporations are increasingly integrating artificial intelligence into traditional business operations. For interns, this creates opportunities to work on real datasets, enterprise processes and large-scale technology platforms.
Cargill
Cargill is a global company operating across agriculture, food, supply chains and related industries. Its technology teams recruit professionals and university candidates in areas connected with AI, software engineering and data.
As of September 2026, Cargill’s career search includes a Gen AI Analyst Internship in Singapore, along with several AI-related professional positions in locations including Bengaluru. Because vacancies change frequently, applicants should search the official Cargill careers portal regularly rather than relying on old internship advertisements.
Relevant skills may include:
Python
SQL
Data preprocessing
Machine learning
Generative AI
Prompt engineering
Retrieval-Augmented Generation (RAG)
Data visualization
Cloud technologies
Students interested in the application of AI to supply chains, forecasting and enterprise operations should keep companies such as Cargill on their watchlist.
CRISIL
Financial analytics organisations such as CRISIL are also attractive destinations for students interested in combining AI, machine learning, finance and data analytics.
Potential work in this sector may include NLP, predictive modelling, financial datasets, risk analytics, automation and quantitative research.
Students interested in FinTech should therefore develop both technical abilities and an understanding of financial data.
Icertis
Icertis develops contract intelligence technology and describes its platform as AI-native, making it particularly relevant for students interested in the intersection of Artificial Intelligence, NLP, enterprise software and document analytics. Its careers portal provides current vacancies and opportunities to join its technology teams.
Internship applicants interested in companies like Icertis should strengthen Python, APIs, NLP, LLM applications and document-processing skills.
HighRadius
HighRadius operates in autonomous finance technology for the Office of the CFO and maintains career opportunities, including India-based positions in Hyderabad.
Students seeking careers at the intersection of AI, SaaS and financial operations should watch companies in this category for internships, graduate programs and entry-level openings.
💻 2. Big Tech and Advanced AI Research Organisations
Students wanting deeper exposure to machine learning engineering, computer vision, AI infrastructure or advanced research should monitor major technology companies.
Apple
Apple maintains dedicated Machine Learning and AI internship opportunities as well as research-oriented programs. Its Machine Learning Research portal specifically highlights internships in ML and AI.
Apple also operates advanced programs such as its AIML Residency. The residency targets graduates with advanced degrees and provides opportunities to work on high-impact machine-learning projects with Apple teams and mentors.
Typical areas worth preparing for include:
Machine learning algorithms
Deep learning
Computer vision
Natural Language Processing
Speech technologies
Data-centric AI
Privacy-preserving ML
Interactive ML and AI agents
NVIDIA and Intel
Companies involved in CPUs, GPUs and accelerated computing are particularly attractive for students interested in deep learning infrastructure, computer vision, CUDA, model optimization and high-performance computing.
Candidates targeting such organisations should go beyond introductory Python and gain experience with PyTorch or TensorFlow, Linux, algorithms, GPU computing and model deployment.
Google, Microsoft and Amazon
Global technology companies regularly offer student, graduate and research opportunities across software engineering, cloud computing, AI, data science and applied research.
Competition is extremely high, so students should prepare early rather than waiting until their final semester.
A strong GitHub profile, competitive-programming experience, research publications or well-developed AI projects can significantly strengthen an application.
🚀 3. AI-Native Startups and Growth Companies
Startups provide a different internship experience.
Instead of working on only one small part of a large corporate system, interns may get exposure to multiple stages of development — from gathering data to building models, creating APIs and deploying applications.
Yellow.ai
AI-powered customer-service companies such as Yellow.ai are especially relevant for people interested in:
Conversational AI, NLP, chatbots, LLM applications, AI agents and enterprise automation.
Students should monitor company career pages and professional platforms for new internship announcements.
Cleanlab
Cleanlab focuses heavily on improving the reliability and quality of AI systems. Its team has strong research roots, including founders and researchers with MIT machine-learning backgrounds, and the company invites prospective candidates to monitor its careers opportunities.
This type of company may particularly interest students working on data quality, noisy labels, model evaluation and trustworthy AI.
Sarvam AI
Sarvam AI is building AI systems for India, including foundational models, infrastructure and enterprise applications. Its careers page currently lists dozens of positions across engineering, models, infrastructure, product and other functions.
As of September 2026, Sarvam also lists internship opportunities in areas such as marketing and strategy/operations, while its technical teams include roles connected with foundational models, ML infrastructure and AI engineering.
Sarvam’s 2026 campus initiative also gives students opportunities to interact with its research and engineering teams and build AI projects.
📊 Enterprise vs AI-Native Internship
Feature
Enterprise Companies
AI-Native Startups
Main Focus
Applying AI to business processes
Developing AI-first products
Typical Projects
Forecasting, analytics, automation
LLMs, agents, RAG and GenAI
Useful Skills
Python, SQL, BI, ML
Python, PyTorch, Hugging Face, APIs
Work Environment
Structured teams and processes
Rapid experimentation
Learning Opportunity
Enterprise-scale implementation
End-to-end product development
Best For
Business + AI exposure
Deep hands-on AI exposure
Neither environment is automatically better. The right internship depends on whether the student’s priority is enterprise-scale implementation, research, product development or startup-style experimentation.
🧠 Skills Students Should Develop
If you want to apply for AI/ML internships, focus on building practical skills rather than collecting certificates alone.
Learn Python, NumPy, Pandas, Scikit-learn, SQL, Git and GitHub first. Then progress toward TensorFlow or PyTorch, Hugging Face Transformers, NLP, computer vision, LLMs, vector databases, RAG, prompt engineering, APIs and cloud deployment.
Equally important is developing 3–5 meaningful projects.
Examples include an AI chatbot using RAG, recommendation system, image-classification model, sentiment-analysis application, forecasting system or LLM-based document-search platform.
Publish the code on GitHub and prepare a clear README explaining the problem, methodology, dataset, results and limitations.
📩 How to Find and Apply for Internships
Do not depend entirely on LinkedIn posts or third-party internship websites.
Start with the company’s official careers page.
Also monitor LinkedIn, university placement cells, company campus programs, research laboratories, startup career pages and professional communities.
Prepare a concise one-page resume highlighting technical skills, projects, GitHub, research work, internships and measurable achievements.
Customize your application according to the job description rather than sending the same resume everywhere.
Most importantly, apply early and apply consistently.
An applicant may need to submit dozens of applications before receiving interviews. Rejection is a normal part of competitive technology recruitment.
🎯 Final Takeaway
The AI revolution is creating internship opportunities far beyond traditional software companies. Agriculture, supply chains, finance, SaaS, healthcare, manufacturing and enterprise operations are all adopting AI.
Students should therefore consider a broad range of employers including Cargill, CRISIL, Icertis, HighRadius, Apple, NVIDIA, Intel, Amazon, Google, Microsoft, Yellow.ai, Cleanlab and Sarvam AI.
An internship can become much more than a certificate. It can provide real-world experience, industry connections, research exposure, stronger technical skills and potentially a pathway toward a full-time career in AI, Machine Learning, Generative AI and Data Science.
⚠️ Important: Internship openings, eligibility requirements, locations and application deadlines change frequently. Always verify vacancies and application requirements on the organisation’s official careers page before applying.
High-Rise Structures: Structural Systems & Core Configuration
High-rise buildings are among the most complex forms of contemporary construction. Unlike low-rise buildings, where gravity loads generally dominate structural design, tall buildings must resist significant lateral forces generated by wind and earthquakes. As building height increases, structural stability, stiffness, vibration control, load transfer, and efficient use of materials become critical. The structural system and the configuration of the building core therefore play a major role in determining the safety, economy, functionality, and architectural form of a high-rise building.
Understanding High-Rise Structural Behaviour
A high-rise structure may be understood as a tall building in which lateral loads have a significant influence on structural design. The exact definition varies between building codes and organizations, but buildings exceeding approximately 35–50 metres are commonly treated as high-rise structures for planning, fire safety, and structural considerations.
The major forces acting on a high-rise building include dead loads, live loads, wind loads, seismic forces, temperature effects, and sometimes differential settlement. Vertical loads are carried primarily through slabs, beams, columns, walls, and foundations. Lateral loads create shear forces and overturning moments, which become increasingly important as the height of the building increases.
An effective high-rise structural system must provide adequate strength while also controlling lateral displacement, inter-storey drift, acceleration, and vibration.
1. Rigid Frame Structural System
A rigid frame consists of beams and columns connected through moment-resisting joints. These rigid connections enable the frame to resist both gravity and lateral loads.
When wind or earthquake forces act on the building, the beams and columns bend together to resist lateral movement. The stiffness of the system depends on the dimensions of the structural members and the rigidity of beam-column connections.
Rigid frames are commonly used in reinforced concrete and steel buildings of moderate height. They provide architectural flexibility because large open spaces can be created without depending heavily on structural walls.
However, as the height increases, rigid frames become relatively inefficient because large beam and column sizes are needed to control lateral deflection.
Advantages
Rigid frames provide flexibility in planning, allow relatively open façades, and are easy to integrate with conventional construction systems.
Limitations
Their lateral stiffness becomes inadequate for very tall buildings unless combined with shear walls, bracing, or other systems.
2. Shear Wall System
Shear walls are vertical structural elements designed to resist lateral loads. They generally consist of reinforced concrete walls located around lift shafts, staircases, service areas, or other strategically selected parts of the building.
The walls behave like vertical cantilevers fixed at the foundation. They resist wind and seismic forces through shear and bending.
Shear wall systems are particularly effective in residential towers, hotels, and apartment buildings where repetitive floor layouts allow walls to be incorporated into room partitions.
Their major advantage is high lateral stiffness. However, excessive use of shear walls may reduce flexibility in floor planning.
3. Frame–Shear Wall System
The frame–shear wall system combines the advantages of rigid frames and shear walls. Both systems work together to resist lateral forces.
The shear walls carry a large proportion of the overturning forces, while the surrounding structural frame contributes additional stiffness and supports gravity loads.
This system is widely used for medium- to high-rise reinforced concrete buildings because it provides an efficient balance between structural performance and architectural flexibility.
It can typically be used for buildings substantially taller than those relying only on rigid frames.
4. Braced Frame System
Braced frames use diagonal structural members to increase lateral stiffness. Bracing may be arranged in different configurations such as:
X-bracing
K-bracing
V-bracing
Inverted V-bracing
Eccentric bracing
In steel high-rise buildings, braced frames can efficiently transfer lateral loads through axial tension and compression rather than relying entirely on bending.
Because axial resistance is structurally efficient, braced frames can reduce material consumption. However, internal bracing may interfere with openings and architectural planning.
5. Tube Structural Systems
The tube system revolutionized the design of skyscrapers. In this concept, closely spaced perimeter columns connected by deep spandrel beams form a stiff structural tube around the exterior of the building.
The building behaves somewhat like a hollow vertical cantilever.
Several forms of tube systems are used.
Framed Tube
Closely spaced exterior columns form a stiff perimeter structure. This arrangement reduces dependence on large interior columns.
Braced Tube
Diagonal braces are incorporated into the building façade to improve lateral stiffness. Because the diagonals carry substantial lateral forces, exterior columns can be spaced further apart.
Bundled Tube
Several individual structural tubes are grouped together to form a larger structural system. This approach enables extremely tall buildings while allowing variations in building mass and height.
Tube systems are particularly suitable for skyscrapers because they efficiently resist overturning moments caused by wind.
6. Core and Outrigger System
The core-and-outrigger system is one of the most widely used structural arrangements in modern supertall buildings.
A stiff central core is connected to exterior columns through horizontal structural elements known as outriggers. These outriggers may consist of deep reinforced concrete walls, steel trusses, or composite systems.
When the building attempts to overturn due to lateral forces, the outriggers mobilize the exterior columns. Columns on one side experience additional compression, while those on the opposite side may experience tension.
This mechanism significantly increases the effective structural width of the building and reduces lateral movement.
Outrigger floors are commonly located at mechanical floors or other levels where deep structural elements can be accommodated without significantly affecting usable space.
7. Diagrid Structural System
A diagrid consists of a network of diagonal structural members positioned around the exterior of the building. The diagonal grid carries both gravity and lateral loads.
Unlike traditional framed tubes, diagrid structures may require fewer conventional vertical perimeter columns.
Diagrid systems are structurally efficient because diagonal elements resist forces largely through axial action. They also allow architects to create distinctive geometric façades.
Modern high-rise buildings increasingly use diagrid structures because of their combination of structural efficiency and architectural expression.
Importance of the Structural Core
The core is often described as the structural spine of a high-rise building. It commonly accommodates:
Elevators
Staircases
Fire escape routes
Mechanical shafts
Electrical services
Plumbing risers
Refuge or service spaces
Structurally, the core may consist of reinforced concrete shear walls, steel bracing, composite walls, or combinations of these systems.
The location, geometry, thickness, and continuity of the core strongly influence the building’s response to lateral forces.
Central Core Configuration
A central core is located approximately at the geometric centre of the building.
This arrangement provides good structural balance because stiffness and mass can be distributed relatively symmetrically.
Central cores are commonly used in office towers because usable floor space can be arranged around the perimeter, allowing access to daylight and views.
Central placement also reduces torsional behaviour when the building is reasonably symmetrical.
Offset Core Configuration
In some buildings, the core is positioned away from the geometric centre.
An offset core may be required due to architectural planning, site constraints, views, entrance arrangements, or floor-space requirements.
However, an eccentric core may cause torsion because the centre of structural stiffness does not coincide with the centre of mass.
Engineers must therefore introduce additional shear walls, frames, outriggers, or other structural elements to control rotational movement.
Split-Core Configuration
A split-core arrangement uses two or more separate structural cores.
These may be positioned at opposite sides of the floor plate or distributed according to functional requirements.
The cores can be connected through beams, slabs, trusses, or outrigger systems.
Split cores may be advantageous for large floor plates and mixed-use towers where different building zones require independent vertical circulation systems.
External Core Configuration
In certain architectural concepts, lift shafts, stairs, and structural cores are placed along or outside the main building envelope.
This allows large uninterrupted interior floor plates.
External cores may also become prominent visual elements of the façade. However, careful design is necessary to manage structural eccentricity, thermal exposure, fire safety, and connections between the core and floor system.
Core Geometry and Structural Efficiency
The shape of the core influences its strength and stiffness.
Common core forms include:
Rectangular cores
Square cores
Circular cores
U-shaped cores
H-shaped cores
Multiple-cell cores
Closed core configurations generally provide better torsional resistance than open sections.
For example, a rectangular box-shaped core provides excellent resistance against bending and twisting because walls are arranged continuously around the circulation zone.
Open U-shaped cores may be functionally convenient but require careful structural analysis because torsional stiffness can be lower.
Factors Governing Structural System Selection
The choice of structural system depends on several interrelated factors.
Building height is one of the most important considerations. Rigid frames may be appropriate for moderate heights, while tube, outrigger, and diagrid systems become increasingly advantageous for very tall towers.
Building function also influences structural planning. Residential towers often use shear-wall cores, while commercial towers may require large column-free spaces.
Wind climate, seismicity, soil conditions, building shape, floor dimensions, material availability, construction technology, and cost must also be considered.
For extremely tall structures, aerodynamic form becomes important. Rounded corners, tapering forms, setbacks, openings, and changes in building profile can reduce wind-induced forces.
Conclusion
High-rise structural design requires the careful integration of structural engineering, architecture, building services, construction technology, and safety requirements. Rigid frames, shear walls, braced frames, tube systems, diagrids, and core-outrigger arrangements provide different strategies for transferring vertical and lateral loads.
Among these systems, the structural core is particularly important because it performs both functional and structural roles. Its location, geometry, stiffness, and connection to the surrounding structural system greatly influence building stability.
As buildings continue to reach greater heights, advanced structural concepts such as composite mega-columns, outriggers, diagrids, tuned mass damping systems, and aerodynamic forms are increasingly being adopted. The most successful high-rise structures are therefore those in which the structural system and core configuration are conceived together from the earliest stage of architectural design, producing buildings that are safe, efficient, economical, and visually distinctive.
I can also prepare a poster, diagram of high-rise structural systems and core configurations, or exam-oriented notes for this topic.at are your best healthy eating habits?
Reinforced Cement Concrete (RCC) is one of the most widely used structural systems in buildings and infrastructure. It combines the compressive strength of concrete with the tensile strength of steel reinforcement, allowing structural members to resist different types of loads safely and efficiently. RCC is extensively used in residential buildings, commercial complexes, bridges, industrial structures, institutional buildings, retaining walls, water tanks, and high-rise construction.
Structural design with RCC elements involves determining suitable sizes, reinforcement, detailing, and arrangement of members so that the structure remains safe, serviceable, durable, and economical throughout its intended life. The main RCC elements include slabs, beams, columns, foundations, staircases, shear walls, and retaining walls. These components work together to transfer loads from the building to the ground.
Basic Principle of RCC
Concrete performs very well in compression but has relatively low tensile strength. Steel, on the other hand, has excellent tensile capacity. In RCC, steel reinforcement is placed in regions where tension is expected.
The bond between concrete and steel allows them to act together as a composite structural material.
The basic load path in a framed building is generally:
Slab → Beam → Column → Foundation → Soil
Each structural component must therefore be designed not only individually but also as part of an integrated load-transfer system.
Objectives of RCC Structural Design
The main objectives of RCC design are to ensure:
structural safety;
adequate strength;
stability;
serviceability;
durability;
fire resistance;
economy;
constructability.
A structure should not collapse under design loads, but it should also not experience excessive cracking, vibration, or deflection during normal use.
Loads Considered in RCC Design
Structural design begins with identifying the loads acting on the building.
Dead Load
Dead load includes the permanent weight of:
RCC members;
walls;
floor finishes;
roofing;
fixed equipment.
Live Load
Live load includes temporary or movable loads caused by:
occupants;
furniture;
storage;
movable equipment.
Wind Load
Wind produces lateral pressure and suction on buildings.
It becomes particularly important for tall buildings, large roofs, and exposed structures.
Earthquake Load
Earthquake forces result from ground motion and structural inertia.
Seismic design is especially important in earthquake-prone regions.
Other Loads
Depending on the structure, designers may also consider:
snow loads;
soil pressure;
water pressure;
temperature effects;
impact;
equipment vibration.
Limit State Design of RCC
Modern RCC structures are commonly designed using the Limit State Method.
Two broad categories are checked:
Ultimate Limit State
This concerns safety against failure due to:
bending;
shear;
compression;
torsion;
instability;
collapse.
Serviceability Limit State
This concerns satisfactory performance under normal use.
Typical checks include:
deflection;
cracking;
vibration;
durability.
The structure must satisfy both.
RCC Slabs
A slab is a horizontal structural element used to form floors and roofs.
Slabs transfer loads to beams, walls, or directly to columns.
Common slab types include:
one-way slabs;
two-way slabs;
flat slabs;
cantilever slabs.
One-Way Slab
A one-way slab primarily bends and transfers load in one direction.
This usually occurs when the slab is supported on two opposite sides or when the longer span is significantly greater than the shorter span.
Main reinforcement is generally placed along the shorter span.
Distribution reinforcement is provided perpendicular to it.
Two-Way Slab
A two-way slab transfers load in both directions.
It is commonly used when the slab is supported on all four sides and the plan dimensions are relatively comparable.
Reinforcement is provided in both directions.
Two-way action can reduce bending moments compared with one-way action.
Flat Slab
A flat slab is supported directly by columns without conventional beams.
Its advantages include:
reduced structural depth;
flexible floor planning;
simpler service routing;
clean ceiling appearance.
However, punching shear around columns becomes an important design concern.
Drop panels or column heads may be used where necessary.
Cantilever Slab
A cantilever slab is fixed at one end and free at the other.
Typical applications include:
balconies;
sunshades;
canopies.
The main tensile reinforcement is generally placed near the top surface close to the support.
RCC Beams
Beams transfer loads from slabs and walls to columns or other supports.
They primarily resist:
bending moments;
shear forces;
sometimes torsion.
In a simply supported beam under downward gravity loading, the bottom region is generally in tension and the top region in compression.
Beam Reinforcement
Typical beam reinforcement includes:
Main Bars
These resist flexural tension.
Stirrups
Stirrups provide shear resistance and hold longitudinal reinforcement in position.
Top Bars
Top reinforcement is particularly important at supports in continuous beams and cantilevers.
Bottom Bars
Bottom reinforcement is commonly required at midspan in simply supported beams.
Proper anchorage and development length are essential.
Simply Supported Beams
A simply supported beam rests on supports at both ends.
The maximum positive bending moment generally occurs near midspan.
These beams are conceptually simple but are less common in monolithic RCC frames where continuity is usually present.
Continuous Beams
Continuous beams extend over more than two supports.
They develop:
positive moments in spans;
negative moments over supports.
Reinforcement must therefore be arranged appropriately in both top and bottom zones.
Cantilever Beams
Cantilever beams are fixed at one end and free at the other.
The top surface near the fixed support is usually in tension under downward load.
Cantilevers are used for balconies, canopies, projections, and architectural features.
RCC Columns
Columns are vertical structural members that transfer loads from beams and slabs to foundations.
They are mainly subjected to compression but may also experience bending moments.
Columns may be:
square;
rectangular;
circular;
L-shaped;
T-shaped.
Their design depends on:
axial load;
bending moment;
slenderness;
reinforcement ratio;
support conditions.
Short and Slender Columns
A short column is less sensitive to buckling and generally fails by compression or material strength.
A slender column can experience significant additional bending due to lateral deflection.
Slenderness must therefore be checked carefully.
Column Reinforcement
Column reinforcement includes:
Longitudinal Bars
These carry axial and bending forces.
Lateral Ties
These hold the longitudinal reinforcement in position and provide confinement.
Spiral Reinforcement
Circular columns may use helical reinforcement.
Good confinement improves ductility, particularly under seismic loading.
Beam-Column Joints
Beam-column joints are critical areas in RCC frames.
They transfer forces between horizontal and vertical structural elements.
Under earthquake loading, these joints may experience high shear stresses and repeated load reversals.
Good detailing includes:
proper anchorage;
adequate confinement;
closely spaced ties;
correct bar continuity.
Poor joint detailing can lead to brittle failure.
RCC Foundations
Foundations transfer column and wall loads safely to the soil.
Common RCC foundations include:
isolated footings;
combined footings;
strap footings;
raft foundations;
pile caps.
Foundation design depends heavily on soil bearing capacity and settlement.
Isolated Footing
An isolated footing supports a single column.
Its area is selected so that soil pressure remains within allowable limits.
The footing must be checked for:
bending;
one-way shear;
punching shear;
bearing.
Combined Footing
A combined footing supports two or more columns.
It is often used when:
columns are close together;
property boundaries restrict footing size;
individual footings would overlap.
The footing may be rectangular or trapezoidal.
Raft Foundation
A raft or mat foundation supports many columns over a large slab.
It is useful when:
soil bearing capacity is low;
columns are closely spaced;
settlement needs to be controlled.
Rafts distribute loads over a large area.
Pile Caps
Pile caps connect groups of piles and transfer column loads to them.
They are designed to resist:
bending;
shear;
localized stresses.
Pile caps must be carefully detailed because loads are concentrated around pile locations.
RCC Staircases
RCC staircases may be designed as:
waist-slab stairs;
folded plate stairs;
cantilever stairs;
stair slabs supported on beams.
The stair must safely carry:
self-weight;
finishes;
live load.
Reinforcement follows the direction of structural spanning.
Shear Walls
Shear walls are vertical RCC elements designed to resist lateral loads caused by wind and earthquakes.
They are commonly used in:
high-rise buildings;
apartment towers;
core walls;
lift and stair enclosures.
Shear walls provide:
high lateral stiffness;
reduced building sway;
improved seismic resistance.
Their location should be carefully planned to reduce torsional effects.
Retaining Walls
Retaining walls resist lateral earth pressure.
Common RCC retaining wall types include:
cantilever retaining walls;
counterfort retaining walls;
basement walls.
The wall must be designed for:
earth pressure;
surcharge;
water pressure;
sliding;
overturning;
bearing.
Drainage behind retaining walls is essential to reduce hydrostatic pressure.
Reinforcement Detailing
Good reinforcement detailing is essential for structural performance.
Important aspects include:
bar spacing;
anchorage;
development length;
lap length;
cover;
stirrup spacing;
curtailment;
joint detailing.
Incorrect detailing can cause failure even when member dimensions are adequate.
Development Length
Reinforcement must extend sufficiently into concrete so that bond stresses can safely transfer force between steel and concrete.
This required embedded length is called development length.
Insufficient anchorage can cause bar pull-out or bond failure.
Lap Splices
When reinforcement bars cannot be provided in one continuous length, lap splices are used.
The lap length depends on:
bar diameter;
concrete strength;
steel grade;
type of stress.
Splices should be located away from highly stressed zones whenever possible.
Concrete Cover
Concrete cover is the distance between the reinforcement and the concrete surface.
It provides protection against:
corrosion;
fire;
weather exposure.
Insufficient cover reduces durability, while excessive cover can contribute to wider surface cracking.
Shear Design
Shear forces can produce diagonal cracking in beams and slabs.
Shear resistance is provided by:
concrete;
stirrups;
bent bars in some systems.
In beams, vertical or inclined stirrups are commonly used.
Shear failure is potentially brittle and must be prevented.
Flexural Design
Flexural design ensures that the member can resist bending moments.
For an under-reinforced RCC beam, steel should yield before concrete crushes.
This provides more ductile behavior and warning before failure.
Over-reinforced sections are generally avoided because they may fail suddenly through concrete crushing.
Torsion
Torsion occurs when a structural member twists about its longitudinal axis.
It may occur in:
edge beams;
curved structures;
irregular framing.
Torsion reinforcement generally consists of closed stirrups and longitudinal bars.
Punching Shear
Punching shear is particularly important in flat slabs and footings.
It occurs around concentrated supports such as columns.
The slab may fail around the column perimeter if adequate thickness or reinforcement is not provided.
Measures may include:
increasing slab thickness;
providing drop panels;
increasing column dimensions;
using shear reinforcement.
Deflection Control
Excessive deflection can cause:
cracked partitions;
uneven floors;
visual problems;
serviceability issues.
Deflection is influenced by:
span;
depth;
loading;
reinforcement;
cracking;
long-term creep.
Adequate member depth is one of the simplest ways to control deflection.
Crack Control
Cracking in RCC can result from:
flexure;
shrinkage;
temperature changes;
settlement;
corrosion.
Controlled cracking is expected in reinforced concrete, but crack widths should remain within acceptable limits.
Proper reinforcement distribution and curing help reduce cracking.
Durability
Durability is essential for long service life.
Important factors include:
adequate cover;
low-permeability concrete;
proper compaction;
proper curing;
suitable materials;
environmental exposure.
Poor durability may lead to reinforcement corrosion and concrete spalling.
Concrete Grade
Concrete grade indicates its characteristic compressive strength.
The selected grade depends on:
structural requirement;
exposure condition;
durability;
applicable design codes.
Higher strength concrete may be used for heavily loaded columns, high-rise buildings, and specialized structures.
Reinforcement Steel
Reinforcement steel should provide:
adequate yield strength;
ductility;
bond;
weldability where required.
Deformed bars are commonly used because their ribs improve bond with concrete.
Formwork Considerations
RCC elements require formwork until concrete develops sufficient strength.
Formwork must provide:
correct dimensions;
alignment;
stability;
smooth finish;
leak resistance.
Poor formwork can result in dimensional errors and honeycombing.
Concreting
Concrete should be properly:
batched;
mixed;
transported;
placed;
compacted;
cured.
Segregation should be avoided.
Mechanical vibrators are commonly used to remove entrapped air.
Curing
Curing allows cement hydration to continue.
Proper curing improves:
compressive strength;
durability;
water resistance;
crack control.
Inadequate curing can significantly reduce concrete quality.
Construction Joints
Construction joints are required when concrete placement is interrupted.
They should be placed at suitable structural locations.
The old concrete surface should be cleaned and prepared before placing new concrete.
Ductile Detailing
In earthquake-resistant RCC design, ductility is critical.
Important principles include:
strong-column weak-beam behavior;
closely spaced ties near joints;
adequate anchorage;
confinement of column ends;
controlled lap locations.
The aim is to allow energy dissipation without sudden collapse.
Strong-Column Weak-Beam Concept
In seismic design, it is preferable for beams to yield before columns.
If columns fail first, an entire storey may collapse.
Therefore, columns are often designed to remain stronger than connected beams.
Structural Regularity
Regular structural layouts generally perform better during earthquakes.
Irregularities may occur in:
plan;
elevation;
stiffness;
mass distribution.
Examples include soft storeys, floating columns, large setbacks, and asymmetrical cores.
These conditions require special analysis and detailing.
Service Integration
Structural design should be coordinated with building services.
Openings for:
ducts;
pipes;
electrical services;
should not be cut into beams or slabs without structural approval.
Unplanned openings can significantly weaken structural members.
Quality Control
Important quality checks include:
reinforcement diameter and spacing;
concrete cover;
formwork alignment;
slump;
concrete strength testing;
vibration;
curing;
dimensions.
Good site supervision is essential.
Common RCC Defects
Typical defects include:
Honeycombing
Caused by poor compaction or congested reinforcement.
Cracks
May result from structural stress, shrinkage, thermal effects, or settlement.
Corrosion
Occurs when moisture and aggressive chemicals reach reinforcement.
Spalling
Concrete cover may break away due to reinforcement corrosion or impact.
Excessive Deflection
May result from inadequate stiffness, overloading, or poor design.
Sustainability in RCC Structural Design
RCC structures can be made more sustainable by reducing unnecessary material use.
Strategies include:
structural optimization;
blended cement;
supplementary cementitious materials;
recycled aggregates where suitable;
reusable formwork;
efficient reinforcement detailing;
long-life design.
Durable design reduces the need for repair and replacement.
Importance of Structural Coordination
RCC design should be coordinated closely with architectural planning.
Important issues include:
column positions;
beam depths;
slab thickness;
floor heights;
service shafts;
openings;
façade systems.
Early coordination reduces later conflicts and improves structural efficiency.
Conclusion
Structural design with RCC elements requires a systematic understanding of how slabs, beams, columns, foundations, staircases, shear walls, and retaining walls work together. Each component plays a specific role in transferring loads safely through the structure to the ground.
Slabs distribute floor loads, beams transfer these loads to columns, columns carry them vertically, and foundations spread them to the soil. Shear walls provide resistance to lateral loads, while reinforcement ensures that concrete can safely resist tensile forces.
Successful RCC design depends on more than calculations. Proper reinforcement detailing, adequate cover, good formwork, careful concreting, compaction, curing, and quality control are equally important.
When structural design, material selection, construction practice, durability, and seismic detailing are properly integrated, RCC provides a safe, strong, durable, adaptable, and economical structural system suitable for a wide variety of modern buildings and infrastructure.
Daily writing prompt
How do you write what people actually want to read?
Structural Design: Elastic Design vs Limit State Design
Introduction
Structural design is the process of determining the size, shape, material, reinforcement, and arrangement of structural members so that a building or infrastructure system can safely resist the loads acting on it throughout its service life. The designer must ensure that the structure is not only strong enough to avoid collapse but also sufficiently stiff and durable to remain usable under normal conditions.
Two important approaches used in structural engineering are Elastic Design and Limit State Design. Elastic design is based mainly on the assumption that structural materials behave elastically under working loads and that stresses should remain within permissible values. Limit State Design, on the other hand, evaluates a structure against clearly defined failure and serviceability conditions and uses partial safety factors for loads and materials.
The shift from elastic or working stress methods to limit state design represents an important development in structural engineering because it provides a more realistic treatment of material behavior, loading uncertainty, structural safety, and serviceability.
Concept of Elastic Design
Elastic design is based on the principle that a structural member should remain within the elastic range when subjected to normal working loads.
In the elastic range, stress is approximately proportional to strain, following Hooke’s law:
Stress ∝ Strain
or
σ = Eε
where:
σ = stress,
E = modulus of elasticity,
ε = strain.
If the applied load is removed while the material remains within the elastic range, the member returns approximately to its original shape.
Elastic design is closely associated with the Working Stress Method, in which allowable or permissible stresses are obtained by dividing the material strength by a factor of safety.
Working Stress Concept
In working stress design, the loads expected during normal use are called working loads or service loads.
The calculated stress under these loads should not exceed the permissible stress.
A simplified expression is:
Permissible Stress = Material Strength / Factor of Safety
For example, if a material has a specified strength of 300 MPa and a factor of safety of 1.5 is used:
Permissible Stress = 300 / 1.5 = 200 MPa
The member is then proportioned so that the calculated working stress remains below 200 MPa.
Assumptions of Elastic Design
Elastic design generally assumes that:
materials behave elastically under service loads;
stress and strain have a linear relationship;
sections remain within permissible stress limits;
factors of safety are applied mainly to material strength;
the structural response is predictable through elastic analysis.
These assumptions make calculations relatively straightforward.
Advantages of Elastic Design
Elastic design offers several benefits.
Simplicity
The method is conceptually simple and easy to understand.
Service Load Focus
Because calculations are performed directly at working loads, stresses and elastic deformations can be assessed easily.
Suitable for Certain Materials and Structures
Elastic methods remain useful in areas where service stress control is particularly important.
Long Historical Use
Many existing buildings and bridges were successfully designed using elastic or working stress principles.
Limitations of Elastic Design
The main limitation is that the method does not always represent actual structural behavior near failure.
Materials such as reinforced concrete and structural steel can develop significant reserve strength beyond initial elastic behavior.
Elastic design may therefore be overly conservative in some cases and may not distribute safety as consistently across different types of loads and materials.
Other limitations include:
limited representation of ultimate failure;
single overall safety approach;
less rational treatment of load variability;
inability to make full use of plastic behavior;
possible uneconomical member sizes.
Concept of Limit State Design
Limit State Design (LSD) is a modern approach in which a structure is designed so that it does not reach any unacceptable condition during its intended life.
These unacceptable conditions are called limit states.
A limit state represents the point beyond which a structure no longer satisfies the required performance criteria.
Limit states are broadly classified into:
Ultimate Limit States
Serviceability Limit States
Ultimate Limit State
The Ultimate Limit State, or ULS, concerns structural safety against collapse or major failure.
Examples include:
flexural failure;
shear failure;
compression failure;
buckling;
overturning;
sliding;
loss of equilibrium;
fatigue in relevant structures;
rupture of structural members.
The structure must possess adequate strength and stability under factored loads.
Serviceability Limit State
The Serviceability Limit State, or SLS, concerns the satisfactory functioning of the building under normal use.
Typical serviceability issues include:
excessive deflection;
excessive cracking;
vibration;
settlement;
water leakage;
discomfort;
unacceptable appearance.
A structure may be safe against collapse but still be unsuitable for use if it deflects excessively or develops severe cracking.
Thus, Limit State Design explicitly checks both safety and usability.
Characteristic Loads and Strengths
Limit state design generally uses characteristic values of loads and material strengths.
Characteristic loads may include:
dead load;
live load;
wind load;
earthquake load;
snow load;
other environmental actions.
Characteristic strength refers to a statistically defined material strength below which only a specified proportion of test results is expected to fall.
These characteristic values are then modified using partial safety factors.
Partial Safety Factors
One of the key features of Limit State Design is the use of separate safety factors for:
loads;
materials.
This is more refined than applying a single overall factor of safety.
The design action may be expressed conceptually as:
Design Load = Characteristic Load × Load Factor
Similarly:
Design Strength = Characteristic Strength / Material Safety Factor
The exact factors depend on the applicable design code, load combination, material, and limit state.
Load Combinations
A structure rarely experiences maximum values of all loads simultaneously.
Limit State Design therefore considers various load combinations.
Typical combinations may involve:
dead load + live load;
dead load + wind load;
dead load + live load + wind load;
dead load + earthquake load.
Different combinations are checked because each may produce a different critical response.
Elastic Analysis Within Limit State Design
It is important to understand that Limit State Design does not necessarily mean elastic analysis is abandoned.
Many structures are still analyzed using elastic structural analysis to determine:
bending moments;
shear forces;
axial forces;
reactions.
However, the design of members is then checked using limit state principles and factored values.
Thus, elastic analysis and elastic design are not always identical concepts.
Elastic Design of Reinforced Concrete
In traditional working stress design of reinforced concrete, both concrete and steel stresses are kept within permissible limits under working loads.
Because concrete is weak in tension, tensile forces are primarily resisted by reinforcement.
The method assumes elastic behavior and generally produces larger sections or more conservative stress levels compared with modern ultimate strength approaches.
Limit State Design of Reinforced Concrete
In Limit State Design, reinforced concrete members are designed using their behavior closer to ultimate conditions.
For example, a reinforced concrete beam is checked for:
ultimate bending strength;
shear resistance;
reinforcement requirements;
deflection;
cracking.
The method recognizes nonlinear concrete behavior and allows more realistic use of reinforcement and concrete strength.
Structural Steel and Elastic Design
Steel behaves approximately elastically up to its yield point.
Traditional elastic steel design limits stresses below yield under service loads.
This provides straightforward analysis but may not make full use of steel’s capacity beyond first yield.
Limit State Design of Steel
Limit state steel design checks structural members against conditions such as:
yielding;
buckling;
local buckling;
lateral torsional buckling;
connection failure;
fatigue;
excessive deflection.
Modern steel design therefore addresses both material strength and instability.
Factor of Safety Philosophy
The difference between the two methods can be better understood through their safety philosophy.
Elastic Design
Elastic design generally applies safety by limiting allowable stress.
The main idea is:
Actual working stress < Permissible stress
Limit State Design
Limit State Design applies safety separately to loads and material resistance.
The main concept is:
Design resistance ≥ Design action
This provides a more transparent and consistent approach to uncertainty.
Comparison: Elastic Design vs Limit State Design
Aspect
Elastic Design
Limit State Design
Basic concept
Keep stresses within permissible elastic limits
Prevent specified ultimate and serviceability limit states
Loads
Working/service loads
Factored loads for ULS and service loads for SLS
Material strength
Reduced by overall factor of safety
Characteristic strength modified by material factors
Structural behavior
Mainly elastic
Includes ultimate and service behavior
Safety factors
Usually global or permissible-stress based
Partial factors for loads and materials
Failure prediction
Less direct
Explicitly considers failure modes
Serviceability
Often inherent in working stress check
Checked separately
Economy
Often more conservative
Usually more efficient
Modern usage
Limited/special applications
Widely used in modern codes
Example of a Beam
Consider a beam carrying permanent and imposed loads.
Under elastic design, the designer calculates bending moment using service loads and determines the bending stress.
The calculated stress must remain below the permissible stress.
In Limit State Design, the procedure is different.
First, ultimate load combinations are generated using appropriate partial factors. The beam is designed so that its ultimate moment resistance exceeds the factored bending moment.
Then separate checks are performed for serviceability, such as:
deflection;
cracking;
vibration.
This separates collapse prevention from normal-use performance.
Strength and Serviceability
One of the most important principles of modern structural design is that strength alone is not sufficient.
For example, a floor beam might be strong enough to avoid collapse but may vibrate excessively when people walk across it.
Similarly, an RCC slab may have adequate ultimate capacity but may develop excessive cracking.
Limit State Design directly recognizes this by requiring separate ULS and SLS checks.
Reliability-Based Approach
Limit State Design is more closely connected with probabilistic thinking.
Loads and material strengths are not perfectly predictable.
For example:
actual live loads vary;
material strength varies between batches;
dimensions may differ slightly;
workmanship varies;
environmental effects are uncertain.
Partial safety factors are intended to account for such uncertainties in a rational way.
Ductility
Ductility is another important consideration.
A ductile structure can deform significantly before failure, providing warning and redistributing forces.
Modern limit state codes often include detailing requirements to achieve ductile behavior, especially in earthquake-resistant design.
This is particularly important for:
reinforced concrete frames;
steel moment frames;
seismic structures.
Economy of Limit State Design
Because Limit State Design makes better use of material strength and provides a more refined safety approach, it can often produce more economical structures.
Possible benefits include:
smaller member dimensions;
optimized reinforcement;
efficient material utilization;
better load combination treatment.
However, economy should never compromise durability or serviceability.
Role of Codes and Standards
Structural design must follow applicable national or international standards.
Design codes specify:
loads;
load combinations;
material strengths;
safety factors;
detailing rules;
serviceability limits.
Different jurisdictions may use different terminology, coefficients, and calculation methods.
Therefore, designers should always work with the current applicable code rather than relying on generic values.
Elastic Design in Present Practice
Although Limit State Design dominates modern structural engineering, elastic concepts remain extremely important.
Elastic analysis is still used for:
structural response calculations;
serviceability analysis;
stress distribution;
preliminary sizing;
certain specialized design situations.
Thus, the development of Limit State Design did not make elasticity irrelevant.
Instead, it placed elastic analysis within a broader safety framework.
Limit State Design in Seismic Engineering
Seismic design particularly demonstrates the importance of limit state thinking.
A structure may be expected to experience different performance levels during different earthquake intensities.
Possible objectives include:
limited damage during minor earthquakes;
repairable damage during moderate events;
prevention of collapse during severe earthquakes.
This approach cannot be captured adequately through a simple permissible-stress check alone.
Durability as a Design Consideration
Modern structural design also recognizes that a structure must remain safe throughout its intended life.
Durability issues include:
reinforcement corrosion;
carbonation;
chloride exposure;
weathering;
moisture;
chemical attack.
Limit state-based codes often include minimum requirements for cover, crack control, materials, and exposure conditions.
Construction Quality
No design approach can compensate for poor construction.
Even a well-designed structure can perform poorly if:
reinforcement is misplaced;
concrete is inadequately compacted;
bolts are improperly tightened;
welds are defective;
member dimensions are incorrect.
Quality control and inspection therefore remain essential under both design philosophies.
Advantages of Limit State Design
Major advantages include:
rational safety treatment;
consideration of multiple failure modes;
separate serviceability checks;
better representation of actual material behavior;
efficient use of materials;
compatibility with modern reliability concepts.
Limitations of Limit State Design
Despite its benefits, Limit State Design can be more complex than basic elastic design.
It requires:
multiple load combinations;
separate ULS and SLS checks;
detailed understanding of material behavior;
careful code interpretation.
For complex structures, computer-based analysis is often used.
Importance for Architecture and Construction
Architects and construction professionals should understand these design concepts even when detailed calculations are performed by structural engineers.
Structural design influences:
column spacing;
beam depth;
slab thickness;
floor-to-floor height;
structural form;
material selection;
cost.
Early coordination between architectural and structural design can therefore produce more efficient buildings.
Conclusion
Elastic Design and Limit State Design represent two important approaches to structural engineering. Elastic Design is based primarily on keeping stresses under service loads within permissible elastic limits. It is conceptually simple and has a long history of successful use, but it does not fully describe structural behavior near failure.
Limit State Design provides a broader framework by checking both Ultimate Limit States and Serviceability Limit States. It uses partial safety factors for loads and materials, evaluates different failure modes, and recognizes that a structure must be safe against collapse while also remaining functional, comfortable, and durable during normal use.
The basic distinction can therefore be summarized as follows:
Elastic Design asks: “Are the stresses under working loads within allowable limits?”
Limit State Design asks: “Is the structure safe against failure and satisfactory in normal service under all relevant design conditions?”
Modern structural engineering largely adopts the second philosophy because it provides a more comprehensive, realistic, and economical basis for designing reinforced concrete, steel, and other structural systems.
Daily writing prompt
How do you write what people actually want to read?
Alternative & Earth-Based Building Materials: CSEB and Bamboo
Introduction
Alternative and earth-based building materials are becoming increasingly important in sustainable architecture and construction. Conventional materials such as fired clay bricks, cement, steel, and concrete are widely used because of their strength, availability, and established construction practices. However, their production can require large amounts of energy, natural resources, and transportation. In response, architects, engineers, and builders are exploring materials that are locally available, renewable, low in embodied energy, affordable, and environmentally responsible.
Among the most promising alternatives are Compressed Stabilized Earth Blocks (CSEB) and bamboo. CSEB combines earth with a small quantity of stabilizer and mechanical compression to produce strong masonry units. Bamboo is a rapidly renewable natural material with high tensile strength and a long history of use in houses, bridges, roofs, scaffolding, and furniture.
Both materials demonstrate how traditional knowledge can be combined with modern engineering to create durable, efficient, and climate-responsive buildings.
What Are Alternative Building Materials?
Alternative building materials are materials used as substitutes for conventional construction products when they offer environmental, economic, social, or technical advantages.
Examples include:
compressed earth blocks;
stabilized mud blocks;
rammed earth;
adobe;
bamboo;
straw bale;
recycled aggregates;
fly-ash blocks;
lime-based materials;
recycled timber;
agricultural-waste panels.
The choice of material depends on local climate, available resources, required structural performance, workmanship, maintenance, and building regulations.
Earth as a Building Material
Earth is one of the oldest construction materials used by humans. Traditional earth construction techniques include adobe, cob, rammed earth, mud masonry, and earthen plaster.
Earth offers several advantages:
local availability;
relatively low embodied energy;
good thermal mass;
low transportation requirements;
recyclability;
affordability.
However, untreated earth can have limitations such as low water resistance, shrinkage cracking, and variable strength. Stabilization and controlled production methods help improve its performance.
Compressed Stabilized Earth Blocks
Compressed Stabilized Earth Blocks, or CSEB, are masonry units made from suitable soil mixed with a controlled amount of stabilizer and compacted under pressure.
Typical ingredients include:
soil;
sand where required;
cement or lime;
water.
The mixture is placed in a manual or mechanical press and compressed into blocks of uniform size.
Unlike fired bricks, CSEB units are generally not fired in kilns.
Soil Selection for CSEB
The performance of a CSEB depends strongly on soil composition.
Suitable soil generally contains a balanced mixture of:
gravel;
sand;
silt;
clay.
Too much clay can cause shrinkage and cracking, while too much sand may reduce cohesion.
Before production, soil should be tested for:
grain-size distribution;
plasticity;
moisture content;
organic matter;
stabilizer requirement.
Locally available soil may often be modified by adding sand or other materials.
Stabilization
Stabilization improves the strength and water resistance of earth blocks.
Common stabilizers include:
Cement
Cement is widely used because it improves compressive strength and resistance to moisture.
Lime
Lime is especially useful for certain clay-rich soils and can improve workability and long-term stability.
Combined Stabilizers
In some cases, cement and lime may be used together.
The amount of stabilizer should be optimized because excessive use increases cost and embodied energy.
Manufacturing Process of CSEB
A typical CSEB production process includes:
selecting suitable soil;
removing organic matter and oversized particles;
sieving the soil;
proportioning soil and stabilizer;
dry mixing;
adding controlled water;
placing the mixture in a block press;
compressing the block;
removing the block carefully;
curing under controlled conditions.
Proper curing is particularly important for cement-stabilized blocks.
CSEB Block Presses
Blocks may be produced using:
manual presses;
semi-mechanical presses;
hydraulic machines.
Manual presses are useful for small-scale and community-based construction, while hydraulic machines provide higher production rates and more consistent compaction.
Advantages of CSEB
CSEB offers several benefits.
Lower Energy Requirement
Because blocks are not fired in conventional brick kilns, production generally requires less energy.
Local Material Use
Soil can often be obtained near the construction site, reducing transportation.
Uniform Dimensions
Mechanical compression creates regular blocks, reducing mortar consumption and improving construction accuracy.
Thermal Performance
Earth walls have high thermal mass, helping moderate indoor temperature fluctuations.
Reduced Waste
Broken or rejected blocks can sometimes be crushed and reused as earth material.
Architectural Character
Exposed earth blocks provide a natural texture and color.
Limitations of CSEB
CSEB also has limitations.
These include:
need for proper soil testing;
sensitivity to poor curing;
potential water damage if detailing is inadequate;
requirement for skilled production control;
need for protective design in heavy rainfall regions.
CSEB walls should not be continuously exposed to standing water.
Construction Detailing for CSEB
Good detailing is essential for long-lasting earth buildings.
Important measures include:
raised plinths;
damp-proof courses;
roof overhangs;
proper drainage;
protected wall bases;
suitable plaster or surface treatment where required.
The principle often summarized as “good boots and a good hat” is particularly relevant to earth buildings: protect the base from water and provide adequate roof protection.
Mortar for CSEB
Mortar should be compatible with the blocks.
Possible mortars include:
stabilized earth mortar;
cement-lime mortar;
thin joint mortar where suitable.
Very strong cement-rich mortar may be unnecessary and can create compatibility problems.
Structural Use of CSEB
CSEB can be used for:
load-bearing walls;
non-load-bearing partitions;
infill walls;
low-rise buildings;
community facilities;
residential construction.
Structural use should be based on tested block strength, wall thickness, building height, and applicable design requirements.
Bamboo as a Building Material
Bamboo is a fast-growing natural material that has been used for construction for centuries, especially in tropical and subtropical regions.
Although commonly called a wood material, bamboo is botanically a grass.
Its structural advantages include:
high tensile strength;
low density;
flexibility;
rapid renewability;
ease of cutting;
good performance in lightweight structures.
Bamboo can be used in both traditional and engineered forms.
Characteristics of Bamboo
Bamboo has a hollow cylindrical form divided by nodes.
The fibers run mainly along the length of the culm, providing high longitudinal strength.
Its performance depends on:
species;
age;
moisture content;
diameter;
wall thickness;
harvesting method;
treatment.
Mature bamboo is generally preferred for structural use.
Applications of Bamboo
Bamboo can be used for:
columns;
roof trusses;
rafters;
purlins;
floor systems;
wall frames;
scaffolding;
bridges;
partitions;
furniture;
screens and shading devices.
Modern engineered bamboo products expand these possibilities further.
Bamboo Structural Systems
Post-and-Beam Systems
Bamboo culms can act as columns and beams in lightweight buildings.
Roof Trusses
Bamboo is suitable for roof trusses because of its light weight and ability to resist tensile forces.
Space Frames
Properly connected bamboo members can create lightweight three-dimensional structures.
Curved Structures
Bamboo’s natural flexibility allows the creation of curved roofs, pavilions, and organic architectural forms.
Bamboo Connections
Connections are one of the most challenging parts of bamboo construction.
Because bamboo is hollow and can split, conventional timber connections may not always work effectively.
Common connection methods include:
rope or fiber lashing;
bolts;
dowels;
steel plates;
clamps;
threaded rods;
filled joint systems;
specially designed connectors.
The connection should distribute forces without crushing or splitting the bamboo.
Lashing Connections
Traditional bamboo buildings often use natural fiber or rope lashings.
Advantages include:
simplicity;
flexibility;
low cost;
ease of replacement.
However, lashing durability and long-term performance must be considered.
Bolted Connections
Bolts can provide stronger mechanical connections.
To reduce splitting, designers may use:
washers;
internal fillers;
reinforced nodes;
steel sleeves.
Bolt holes should be carefully located and drilled.
Bamboo Treatment
Untreated bamboo is vulnerable to insects, fungi, and decay.
Treatment is therefore essential for durable construction.
Common methods include:
borax-boric acid treatment;
soaking;
pressure treatment;
heat treatment;
surface coatings.
The selected treatment should be suitable for the intended exposure conditions.
Protection from Moisture
Bamboo should be kept away from prolonged ground contact and standing water.
Good detailing includes:
raised foundations;
steel or concrete base connections;
roof overhangs;
ventilation;
protective coatings.
Direct embedding of untreated bamboo in soil should generally be avoided where long-term durability is required.
Fire Performance of Bamboo
Bamboo is combustible and requires careful fire design.
Fire safety measures may include:
fire-retardant treatment;
protective linings;
separation from ignition sources;
adequate escape planning;
sprinklers where required.
Fire performance should be assessed as part of the complete building system.
Engineered Bamboo Products
Modern manufacturing techniques can transform bamboo into more standardized products.
Examples include:
laminated bamboo lumber;
bamboo boards;
bamboo plywood;
bamboo composite panels;
strand-woven bamboo.
These products can provide more predictable dimensions and properties than natural culms.
Laminated Bamboo
Laminated bamboo is produced by cutting bamboo into strips, treating them, and bonding them together.
It may be used for:
beams;
flooring;
furniture;
panels;
interior finishes.
The process allows bamboo to be manufactured in regular rectangular sections.
Bamboo Flooring and Panels
Bamboo flooring is popular because it combines a natural appearance with good hardness and renewability.
Bamboo panels can be used for:
interior partitions;
furniture;
ceilings;
decorative wall systems.
Surface treatment improves resistance to wear and moisture.
CSEB and Bamboo in Sustainable Construction
CSEB and bamboo can complement each other effectively.
For example, a low-rise building may use:
CSEB walls;
bamboo roof trusses;
bamboo shading screens;
earth or lime finishes.
This creates a construction system based largely on locally available and renewable materials.
Embodied Energy
One of the major sustainability advantages of alternative materials is the potential reduction in embodied energy.
CSEB avoids energy-intensive firing associated with many conventional bricks.
Bamboo grows rapidly and requires relatively limited processing in its natural form.
However, the environmental benefit depends on:
transportation distance;
stabilizer quantity;
adhesives;
treatment chemicals;
durability.
Life-cycle thinking is therefore important.
Thermal Performance
Earth materials have high thermal mass, which helps absorb and release heat slowly.
This can improve comfort in climates with significant day-night temperature variations.
Bamboo, being lightweight, has different thermal characteristics and is often used in roofs, frames, or shaded envelope systems.
Together, the materials can support climate-responsive design.
Seismic Considerations
Lightweight bamboo structures can perform well under earthquake forces because lower building mass reduces seismic loads.
Earth walls, however, require careful structural design in seismic regions.
Measures may include:
horizontal bands;
vertical reinforcement;
confined masonry techniques;
lightweight roofs;
good wall connections.
Unreinforced heavy earthen walls can be vulnerable during strong earthquakes.
Water Management
Water protection is one of the most important considerations for both materials.
For CSEB:
provide raised plinths;
avoid prolonged saturation;
protect the wall base;
use suitable roof overhangs.
For bamboo:
avoid direct soil contact;
keep joints dry;
provide drainage and ventilation;
protect cut ends.
Good architectural detailing can greatly extend service life.
Economic Benefits
Both CSEB and bamboo can support affordable construction, particularly when materials and skills are locally available.
Possible economic advantages include:
reduced transportation costs;
local employment;
community production;
lower structural weight;
use of simple tools.
However, cost savings should not come at the expense of testing, treatment, and quality control.
Social and Regional Benefits
Alternative materials can help preserve traditional building skills while creating modern employment opportunities.
Local production can support:
rural economies;
craftspeople;
small enterprises;
decentralized construction industries.
Buildings can also reflect regional identity through natural materials and construction methods.
Quality Control
Alternative construction must be based on proper quality assurance.
For CSEB, checks may include:
soil testing;
mix proportion;
compression pressure;
block dimensions;
curing;
compressive strength.
For bamboo, checks may include:
species;
maturity;
treatment;
moisture content;
defects;
connection quality.
Standardization can help alternative materials achieve greater acceptance.
Common Problems in CSEB Construction
Typical problems include:
erosion at wall bases;
cracking;
weak blocks;
poor bonding;
insufficient curing;
excessive stabilizer variation.
Most of these problems can be prevented through proper production and detailing.
Common Problems in Bamboo Construction
Common problems include:
insect attack;
fungal decay;
splitting at connections;
moisture damage;
weak joints;
poor-quality culms.
Proper harvesting, treatment, storage, and connection design are therefore essential.
Maintenance
CSEB and bamboo buildings require regular inspection.
CSEB walls should be checked for:
erosion;
cracks;
moisture staining;
damaged plaster.
Bamboo should be checked for:
insect holes;
splitting;
decay;
loose joints;
coating deterioration.
Early maintenance significantly extends service life.
Future of Alternative Materials
Growing concern about climate change, resource consumption, and construction waste has renewed interest in earth and bio-based materials.
Research is expanding in areas such as:
engineered bamboo;
prefabricated earth blocks;
hybrid structural systems;
digital fabrication;
bio-based composites.
Future construction may combine traditional materials with modern engineering, testing, prefabrication, and building science.
Conclusion
Alternative and earth-based materials such as Compressed Stabilized Earth Blocks and bamboo offer important opportunities for sustainable construction. CSEB uses locally available soil, stabilization, and mechanical compression to create durable masonry units with relatively low energy requirements. Bamboo offers a rapidly renewable, lightweight, and structurally efficient material for frames, roofs, screens, and engineered products.
Both materials require careful design. CSEB must be protected from excessive moisture and produced using properly selected soil and controlled stabilization. Bamboo requires treatment against biological attack, good moisture protection, and carefully designed connections.
When supported by testing, quality control, skilled workmanship, and appropriate architectural detailing, CSEB and bamboo can provide durable, economical, low-impact, and visually distinctive buildings. Their use demonstrates that sustainable construction does not always depend on highly industrialized materials; it can also emerge from intelligently adapting local resources, traditional knowledge, and modern engineering principles.
Daily writing prompt
How do you write what people actually want to read?
Repair, Retrofitting, and Rehabilitation Materials
Introduction
Buildings and civil engineering structures deteriorate over time because of aging, environmental exposure, poor workmanship, overloading, corrosion, moisture penetration, chemical attack, settlement, fire, earthquakes, and changes in use. Instead of demolishing damaged structures and replacing them completely, engineers often use repair, retrofitting, and rehabilitation techniques to restore or improve structural performance.
Although these three terms are closely related, they have different meanings. Repair usually focuses on correcting local defects such as cracks, spalling, leakage, or damaged concrete. Retrofitting involves strengthening an existing structure so that it can carry higher loads or perform better under hazards such as earthquakes. Rehabilitation is a broader process that restores the overall functionality, safety, durability, and serviceability of a structure.
The success of these processes depends greatly on selecting suitable materials. Modern rehabilitation work uses a wide range of cementitious, polymer-based, metallic, fiber-reinforced, and composite materials. Proper diagnosis of the defect is essential before selecting the repair system.
Objectives of Repair and Rehabilitation
The main objectives are to:
restore structural strength;
improve durability;
stop further deterioration;
protect reinforcement from corrosion;
seal cracks and leakage paths;
improve seismic performance;
increase load-carrying capacity;
extend service life;
improve appearance and functionality.
Repair should not simply cover visible damage. The underlying cause should first be identified and controlled.
Common Causes of Structural Deterioration
Structures may require repair because of:
reinforcement corrosion;
carbonation;
chloride attack;
chemical exposure;
freeze-thaw action;
water leakage;
shrinkage cracking;
foundation settlement;
overloading;
poor detailing;
fire damage;
earthquake damage;
impact damage.
Concrete structures are particularly vulnerable when moisture and aggressive chemicals reach reinforcement and initiate corrosion.
Cementitious Repair Mortars
Cementitious repair mortar is one of the most widely used materials for concrete repair. It is generally made from cement, graded sand, water, and chemical or mineral additives.
It is used for:
patch repairs;
surface restoration;
filling shallow defects;
repairing spalled concrete;
rebuilding damaged edges.
Advantages include:
compatibility with concrete;
ease of application;
relatively low cost;
good compressive strength.
However, shrinkage must be controlled, especially in larger repairs.
Polymer-Modified Mortars
Polymer-modified mortars contain polymers such as acrylic, styrene-butadiene, or latex.
The polymer improves:
adhesion;
flexibility;
water resistance;
tensile strength;
durability.
These mortars are suitable for thin repairs, overlays, façade repairs, and areas where better bonding with the existing substrate is required.
Micro-Concrete
Micro-concrete is a flowable, high-strength cementitious repair material containing small aggregates.
It is commonly used for:
column jacketing;
beam repair;
machine foundations;
congested reinforcement zones;
structural strengthening.
Because of its high flowability, it can fill narrow or difficult spaces without requiring heavy vibration.
Micro-concrete is especially useful when conventional concrete placement is difficult.
Non-Shrink Grout
Non-shrink grout is used where dimensional stability is important.
Common applications include:
base plates;
machine foundations;
precast joints;
anchor bolts;
structural gaps;
column bases.
The material is designed to minimize shrinkage after placement and maintain full contact between connected surfaces.
Epoxy Resin
Epoxy resins are widely used in structural repair because of their strong bonding capability.
Applications include:
crack injection;
bonding old and new concrete;
anchoring reinforcement;
surface sealing;
structural adhesives.
Epoxy can develop high tensile and compressive strength.
However, epoxy is generally less tolerant of wet surfaces and elevated temperatures than some cementitious systems.
Epoxy Injection
Epoxy injection is used for repairing fine structural cracks in concrete.
The procedure typically includes:
cleaning the crack;
sealing the surface;
installing injection ports;
injecting epoxy under controlled pressure;
allowing the resin to cure.
This can restore continuity across cracks if the crack is dormant and the underlying cause has been addressed.
Polyurethane Resins
Polyurethane materials are especially useful for sealing cracks that experience moisture or minor movement.
Polyurethane injection may be used for:
water leakage;
basement cracks;
tunnels;
retaining walls;
wet joints.
Some polyurethane systems react with water and expand into a foam, helping block active leaks.
Unlike rigid epoxy, polyurethane can provide greater flexibility.
Bonding Agents
Bonding agents improve adhesion between existing and new materials.
Common types include:
epoxy bonding agents;
polymer latex;
cement slurry with additives.
They are used before placing repair mortar, overlays, or concrete.
Surface preparation remains essential even when bonding agents are used.
Corrosion Inhibitors
Corrosion inhibitors are materials used to slow or prevent reinforcement corrosion.
They may be:
mixed into repair materials;
applied to exposed reinforcement;
applied to concrete surfaces.
Their purpose is to reduce electrochemical activity and protect steel.
Corrosion inhibitors are often used together with patch repairs and protective coatings.
Rust Converters and Reinforcement Coatings
When corroded reinforcement is exposed during repair, rust must be removed and the steel cleaned.
Protective coatings may then be applied.
These coatings may be:
cementitious;
epoxy-based;
polymer-based.
Their role is to provide a protective barrier and improve bond with the surrounding repair material.
Protective Surface Coatings
Protective coatings are applied to concrete or masonry surfaces to reduce water and chemical penetration.
Examples include:
acrylic coatings;
epoxy coatings;
polyurethane coatings;
silane or siloxane water repellents;
elastomeric coatings.
These systems help reduce:
carbonation;
chloride ingress;
moisture penetration;
chemical attack.
Elastomeric coatings are useful where small surface cracks need to be bridged.
Fiber-Reinforced Polymer
Fiber-Reinforced Polymer (FRP) is an important modern strengthening material.
It consists of high-strength fibers embedded in a polymer matrix.
Common types include:
CFRP – Carbon Fiber-Reinforced Polymer;
GFRP – Glass Fiber-Reinforced Polymer;
AFRP – Aramid Fiber-Reinforced Polymer.
FRP can be supplied as sheets, strips, plates, bars, or wraps.
CFRP Strengthening
Carbon fiber-reinforced polymer is widely used for strengthening concrete structures.
Applications include:
beam flexural strengthening;
shear strengthening;
column confinement;
slab strengthening;
seismic retrofitting.
Advantages include:
very high strength-to-weight ratio;
corrosion resistance;
low added weight;
rapid installation;
minimal increase in member size.
Its main limitations are relatively high cost, surface preparation requirements, and sensitivity to high temperature unless protected.
GFRP
Glass fiber-reinforced polymer is generally less expensive than carbon fiber.
It offers:
corrosion resistance;
low weight;
good tensile strength.
GFRP is used for strengthening, reinforcement bars, façades, and other applications where extreme stiffness is not essential.
Steel Plate Bonding
Steel plates can be bonded or bolted to existing concrete members to increase capacity.
This method may be used for:
beams;
slabs;
columns;
connection regions.
Steel plate strengthening can be effective but requires corrosion protection and careful detailing.
Steel Jacketing
Steel jacketing is used to strengthen columns and sometimes beams.
Steel plates or angles are placed around the existing member and connected through bolts or welding.
Advantages include:
significant increase in strength;
improved confinement;
rapid installation.
Steel jacketing is especially useful where high load capacity is required.
RCC Jacketing
RCC jacketing involves increasing the size of an existing reinforced concrete member by adding:
new reinforcement;
new concrete or micro-concrete;
shear connectors or dowels.
It is commonly used for columns and beams.
Benefits include:
increased axial capacity;
improved flexural strength;
greater stiffness;
improved seismic resistance.
However, jacketing increases member dimensions and adds weight.
Shotcrete and Gunite
Shotcrete is concrete or mortar pneumatically projected onto a surface at high velocity.
It can be applied to:
walls;
tunnels;
bridges;
retaining structures;
damaged concrete surfaces.
Shotcrete provides good compaction and bond.
It is useful for repairing large irregular surfaces and for seismic strengthening.
Gunite generally refers to a dry-mix sprayed mortar process, while shotcrete may include wet-mix systems.
Ferrocement
Ferrocement consists of a thin cement mortar matrix reinforced with closely spaced layers of wire mesh.
It is used for:
thin jackets;
walls;
tanks;
shells;
repair overlays.
Advantages include good crack control, lightweight construction, and ease of forming around complex shapes.
Grouting Materials
Grouting is used to fill voids, cracks, joints, or spaces in soil and structures.
Common grouting materials include:
cement grout;
chemical grout;
epoxy grout;
polyurethane grout.
Applications include:
foundation strengthening;
void filling;
masonry consolidation;
crack sealing;
soil improvement.
Crack-Filling Materials
Not all cracks require structural epoxy.
Different materials are selected according to crack type.
Common options include:
epoxy for structural dormant cracks;
polyurethane for leaking cracks;
polymer sealants for movement joints;
cement slurry for larger non-critical cracks;
flexible sealants for dynamic cracks.
Correct crack diagnosis is essential.
Sealants
Sealants are flexible materials used at joints and cracks where movement is expected.
Common types include:
silicone;
polyurethane;
polysulfide;
acrylic.
They are used around:
façades;
windows;
expansion joints;
concrete joints;
roofing systems.
Sealants must remain flexible and maintain adhesion.
Waterproofing Materials
Waterproofing is often an important part of rehabilitation.
Common systems include:
cementitious coatings;
bituminous membranes;
liquid-applied polyurethane;
acrylic coatings;
sheet membranes;
crystalline waterproofing.
Waterproofing prevents future deterioration caused by moisture.
Crystalline Waterproofing
Crystalline waterproofing contains chemicals that react with moisture and cement compounds to form insoluble crystals within concrete pores.
It is used for:
basements;
tanks;
tunnels;
foundations.
The crystals reduce water permeability.
Repair of Masonry Structures
Masonry rehabilitation may use:
lime mortar;
compatible cement-lime mortar;
grout injection;
stainless steel ties;
crack stitching bars;
stone replacement.
Historic masonry requires special care because overly strong repair materials can damage original bricks or stone.
Compatibility is more important than simply achieving maximum strength.
Crack Stitching
Crack stitching involves inserting metal bars across cracks.
Slots are cut across the crack, and bars are fixed with grout or resin.
This helps reconnect separated masonry and distribute tensile stresses.
Underpinning Materials
Foundation rehabilitation may require underpinning.
Materials include:
concrete;
reinforced concrete;
structural steel;
micropiles;
grout.
Micropiles are especially useful where access is restricted or stronger soil lies at greater depth.
Seismic Retrofitting Materials
Earthquake retrofitting aims to improve strength, stiffness, and ductility.
Common materials and systems include:
FRP wraps;
steel bracing;
RCC jackets;
steel jackets;
shotcrete;
shear walls;
dampers;
base isolation devices.
Material selection depends on the existing structure and expected seismic demand.
Steel Bracing
Steel bracing can improve the lateral resistance of framed buildings.
Common systems include:
X-bracing;
V-bracing;
inverted V-bracing.
Bracing can often be installed with relatively limited disturbance compared with adding large concrete walls.
Addition of Shear Walls
Reinforced concrete shear walls may be added during rehabilitation to increase lateral stiffness.
They are particularly effective in buildings with weak resistance to wind or earthquake forces.
However, foundation strengthening may also be required to support the additional loads.
Repair of Fire-Damaged Structures
After fire exposure, concrete, steel, and masonry should be carefully assessed.
Repair may include:
removal of weakened concrete;
reinforcement replacement;
protective coatings;
section rebuilding;
FRP strengthening;
steel plate strengthening.
Fire-damaged materials should not be covered until their residual strength has been evaluated.
Surface Preparation
Surface preparation is one of the most important steps in repair work.
Before repair materials are applied, surfaces may need:
removal of loose concrete;
cleaning;
roughening;
dust removal;
reinforcement cleaning;
moisture conditioning.
Poor surface preparation can cause repair failure even when high-quality materials are used.
Compatibility of Repair Materials
Repair materials should be compatible with the existing substrate.
Important properties include:
strength;
modulus of elasticity;
shrinkage;
thermal expansion;
permeability;
bond strength.
A repair material that is much stronger or stiffer than the original material can sometimes create stress concentrations.
Durability Considerations
A successful repair should address the long-term environment.
For example, repairing corrosion damage without stopping chloride or water ingress may only provide temporary improvement.
Durable repair therefore combines:
defect removal;
structural restoration;
corrosion protection;
waterproofing;
protective coatings;
proper drainage.
Quality Control
Repair and retrofitting work requires careful inspection.
Important checks include:
substrate preparation;
crack condition;
reinforcement cleaning;
material mixing;
application thickness;
curing;
bond quality;
anchor installation.
Specialized strengthening systems such as FRP should be installed according to approved procedures.
Non-Destructive Testing
Before and after rehabilitation, non-destructive tests may be used.
Examples include:
rebound hammer testing;
ultrasonic pulse velocity;
cover meter surveys;
half-cell potential;
infrared thermography.
These methods help assess condition without extensive damage to the structure.
Sustainability Benefits
Repair and rehabilitation can be more sustainable than demolition and reconstruction.
Benefits include:
conservation of existing materials;
reduction in demolition waste;
lower demand for new resources;
lower embodied energy;
extension of building life.
Retrofitting also allows existing buildings to meet new functional, structural, or energy requirements.
Selecting the Right Repair Material
Selection should consider:
cause of damage;
structural importance;
exposure conditions;
crack movement;
moisture;
required strength;
access;
cost;
durability.
There is no single material suitable for all repairs.
For example, epoxy may be ideal for a dry structural crack, while polyurethane may be more appropriate for a leaking moving crack.
Maintenance After Rehabilitation
Repaired structures should continue to be monitored.
Periodic inspections should check for:
new cracks;
coating deterioration;
water leakage;
corrosion;
movement;
joint failure.
Early maintenance helps protect the investment made in rehabilitation.
Conclusion
Repair, retrofitting, and rehabilitation materials play a vital role in extending the service life of buildings and infrastructure. Materials such as cementitious repair mortars, polymer-modified mortars, micro-concrete, epoxy resins, polyurethane, FRP composites, steel plates, shotcrete, sealants, waterproofing systems, and protective coatings provide a wide range of solutions for structural and durability problems.
The choice of material should always follow a proper investigation of the damage. Repair treats defects, retrofitting improves structural capacity, and rehabilitation restores the overall performance and usability of a structure.
The most effective rehabilitation does not merely hide visible damage. It addresses the underlying cause, restores structural behavior, protects the repaired area from future deterioration, and ensures compatibility between old and new materials.
When supported by good diagnosis, proper surface preparation, skilled application, quality control, and continued maintenance, modern repair and retrofitting materials can significantly improve the safety, durability, resilience, and sustainability of existing structures.
Daily writing prompt
How do you write what people actually want to read?
Modular coordination and dimensional grids are fundamental concepts in architecture, building construction, industrialized building systems, and interior planning. They help bring order, consistency, efficiency, and economy to the design and construction process. In simple terms, modular coordination means planning building dimensions and components according to a basic module or standard unit of measurement, while dimensional grids refer to the organized system of reference lines used to position structural and architectural elements accurately within a plan.
These principles are especially important in modern construction because buildings are no longer made only through completely individual, handcrafted methods. Instead, many building elements such as doors, windows, wall panels, tiles, furniture systems, structural members, and prefabricated components are manufactured in standard sizes. If building dimensions are coordinated with these standard modules, materials can fit more easily, waste can be reduced, and construction becomes faster and more economical.
Thus, modular coordination and dimensional grids are not just drafting tools; they are planning principles that connect design, production, construction, and maintenance into a more rational system.
Meaning of Modular Coordination
Modular coordination is the use of a standard module as the basis for setting out dimensions of buildings, spaces, and building components. The module acts as a common dimensional reference so that different elements can fit together properly.
A module is a basic unit of size adopted for coordination. In building practice, a common basic module may be 100 mm or another agreed unit depending on the system used. Dimensions of rooms, wall panels, columns, openings, doors, windows, tiles, furniture layouts, and structural spacing can then be planned as multiples or submultiples of this module.
For example, if 100 mm is taken as the basic module, then dimensions such as 300 mm, 600 mm, 1200 mm, 2400 mm, and 3600 mm are all modular dimensions. This creates compatibility between different building parts.
Objectives of Modular Coordination
The main objectives of modular coordination are to:
standardize dimensions;
improve compatibility of building components;
reduce cutting and wastage;
simplify design and detailing;
improve speed of construction;
support prefabrication and industrialization;
reduce cost;
facilitate maintenance and replacement;
improve dimensional accuracy.
A modular approach is particularly beneficial where building components are produced in factories and assembled on site.
Basic Principles of Modular Coordination
Several principles guide modular coordination in building design.
1. Use of a Standard Basic Module
The first principle is to adopt a standard module that becomes the common dimensional basis for planning. Once the module is selected, all major dimensions should relate to it wherever practical.
This does not mean every dimension must be identical, but it means dimensions should be coordinated in modular increments.
2. Coordination of Building Components
All building components should be dimensionally related so that they fit together without excessive adjustment.
These components may include:
structural bays;
wall thicknesses;
door and window openings;
stair dimensions;
flooring units;
ceiling panels;
service ducts;
furniture modules.
The success of modular design depends on the ability of different components to connect logically.
3. Dimensional Compatibility
A building should be designed so that components from different manufacturers or systems can be assembled within the same dimensional logic. This reduces the need for custom fabrication and site modification.
Dimensional compatibility is especially important in prefabricated construction and open building systems.
4. Rational Space Planning
Spaces such as rooms, corridors, kitchens, classrooms, and offices should be dimensioned according to modular principles so that furniture, fixtures, and circulation can be arranged efficiently.
This improves both function and economy.
5. Reduction of Waste
When wall lengths, floor sizes, ceiling layouts, and surface finishes are planned using modular increments, fewer materials need to be cut. This reduces:
material wastage;
labor time;
construction debris;
cost.
6. Ease of Repetition
Modular coordination encourages repeated use of the same dimensions and details. Repetition simplifies construction and improves productivity.
This is particularly useful in:
housing projects;
office buildings;
schools;
hospitals;
hotels;
industrial buildings.
Modular Dimensions in Building Design
Modular coordination may be applied at several scales.
Component Level
At the smallest level, individual components such as bricks, blocks, tiles, doors, and windows can be dimensioned in modular units.
Assembly Level
Groups of components, such as wall panels, façade systems, partitions, and furniture systems, can also be based on modules.
Building Level
At the overall building level, modular coordination can influence:
room sizes;
bay spacing;
floor-to-floor height;
façade rhythm;
planning grids.
Thus, modular thinking extends from the smallest unit to the entire building.
Horizontal and Vertical Coordination
Modular coordination must work in both horizontal and vertical directions.
Horizontal Coordination
This concerns dimensions in plan, such as:
room length and width;
wall spacing;
column spacing;
corridor widths;
location of openings.
Vertical Coordination
This concerns heights and levels, such as:
floor-to-floor heights;
sill levels;
lintel heights;
door heights;
ceiling levels;
structural depths.
Both directions must be coordinated so that all components align properly.
Dimensional Grids
A dimensional grid is a system of horizontal and vertical reference lines used to organize the placement of structural and architectural elements.
In building drawings, grids are usually represented by evenly spaced lines identified by numbers and letters. For example, one direction may be labeled 1, 2, 3, 4, while the other may be labeled A, B, C, D.
The intersections of these lines become reference points for locating:
columns;
walls;
beams;
partition lines;
service cores;
façade elements.
The grid acts as a framework for accurate planning and construction.
Purpose of Dimensional Grids
Dimensional grids are used to:
organize the building layout;
establish positional control;
coordinate structural and architectural drawings;
simplify communication between consultants;
assist in setting out on site;
ensure alignment and consistency.
Without a clear grid system, the design and construction process can become confusing and prone to dimensional errors.
Types of Grids
Different types of dimensional grids may be used depending on the project.
Structural Grid
A structural grid is based primarily on the placement of columns, load-bearing walls, beams, and structural bays.
This is especially important in framed structures such as RCC and steel buildings.
Planning Grid
A planning grid is used more broadly for spatial organization and may guide room sizes, partition layouts, and façade modules.
Service Grid
In some projects, service systems such as ceiling layouts, lighting, HVAC diffusers, and raised floors may follow their own modular grid while still coordinating with the main structural grid.
Principles of Dimensional Grids
1. Clarity
The grid should be simple and easy to understand. Unnecessarily complicated grids create confusion in design and execution.
2. Consistency
Grid spacing should follow a consistent logic. Regular spacing improves planning efficiency and structural simplicity.
3. Functional Suitability
The grid should suit the intended building use. For example, an office building may need a different grid spacing from a hospital, classroom building, or industrial shed.
4. Structural Efficiency
Grid spacing should allow efficient structural design. Very small spacing may increase the number of columns unnecessarily, while very large spacing may make beams and slabs uneconomical.
5. Coordination with Building Components
The grid should relate to modular sizes of walls, openings, ceiling panels, partitions, and furniture systems.
6. Flexibility
A well-designed grid should allow future changes in space layout or service arrangement.
Advantages of Modular Coordination and Grids
The use of modular coordination and dimensional grids offers many benefits.
Improved Design Efficiency
Designers can make decisions more quickly because dimensions follow a rational system.
Better Construction Accuracy
Grid lines provide clear references during setting out, reducing mistakes on site.
Faster Construction
Standardized dimensions and repeated components speed up fabrication and assembly.
Support for Prefabrication
Prefabricated panels, structural systems, and interior components work more effectively when coordinated by modules and grids.
Easier Interdisciplinary Coordination
Architects, structural engineers, and service consultants can all refer to the same grid system.
Reduced Cost
Standardization, repetition, and reduced waste contribute to economy.
Better Maintenance and Replacement
Modular components are easier to replace or upgrade because their dimensions are standardized.
Applications in Modern Construction
These principles are widely used in contemporary construction.
Residential Buildings
Modular room sizes, kitchen layouts, toilet units, and structural bays improve economy and repetition in housing.
Office Buildings
Open-plan offices benefit greatly from dimensional grids because workstations, partitions, lighting, and services can be arranged more flexibly.
Industrial Buildings
Factories and warehouses often use large structural grids to accommodate machinery, circulation, and modular roofing systems.
Schools and Hospitals
Repetitive rooms such as classrooms, wards, and consultation rooms can be planned using modular logic.
Interior Systems
False ceilings, raised access floors, partition systems, storage units, and façade cladding often depend on modular dimensions.
Relationship with Prefabrication
Modular coordination is closely related to prefabrication.
In prefabricated construction, components are manufactured in standard sizes before arriving on site. If the building design does not follow modular principles, these components may not fit properly, causing delays and costly modifications.
Thus, modular coordination is one of the essential foundations of industrialized building systems.
Challenges in Modular Coordination
Despite its advantages, modular design also presents some challenges.
It may be seen as restrictive if applied too rigidly.
Irregular sites may require adjustments.
Complex forms may not fit easily within regular modules.
Coordination among many disciplines is required.
Tolerances must be managed carefully.
However, these challenges can usually be addressed through thoughtful planning rather than abandoning the modular approach.
Modular Coordination and Human Use
Modular planning should not be based only on construction efficiency. It must also respond to human needs.
Spaces must remain comfortable, functional, and proportionate. Good modular design therefore balances:
structural logic;
manufacturing efficiency;
human scale;
spatial quality;
aesthetics.
A grid should support architecture, not destroy creativity.
Conclusion
Principles of modular coordination and dimensional grids play a vital role in rational building design and construction. Modular coordination ensures that spaces, components, and systems relate to a standard dimensional unit, while dimensional grids provide the reference framework for setting out and organizing the building accurately.
Together, they improve compatibility, reduce waste, support prefabrication, simplify construction, and enhance interdisciplinary coordination. They also make buildings more economical, adaptable, and easier to maintain.
In an age of increasing standardization, prefabrication, and complex building services, these principles are more important than ever. When used intelligently, modular coordination and dimensional grids help create buildings that are not only efficient to build but also functional, orderly, and flexible in use.
If you want, I can also make a poster for “Principles of Modular Coordination and Dimensional Grids”.
Principles of Modular Coordination and Dimensional Grids
Daily writing prompt
How do you write what people actually want to read?
Flooring Systems: Tiles, Terrazzo, Concrete, and Raised Access Floors
Introduction
Flooring is one of the most important finishing elements in a building because it directly affects durability, comfort, appearance, maintenance, safety, acoustics, and overall user experience. A good flooring system should be selected according to the function of the space, expected traffic, moisture conditions, structural requirements, maintenance needs, and budget. Different buildings require different flooring solutions. For example, residential spaces may prioritize comfort and appearance, while commercial, industrial, institutional, and data-processing spaces may require high durability, easy cleaning, or flexible access to services.
Among the widely used flooring systems are tile flooring, terrazzo flooring, concrete flooring, and raised access floors. Each system has its own construction method, materials, benefits, limitations, and applications. Understanding these flooring systems helps architects, engineers, contractors, and students make appropriate decisions for different types of buildings.
Functions of Flooring
Flooring performs several functions beyond simply providing a walking surface.
A good floor should:
provide a level and durable surface;
resist wear and impact;
support furniture and equipment;
contribute to thermal and acoustic comfort;
provide slip resistance;
resist moisture where required;
allow easy cleaning and maintenance;
improve the aesthetic quality of interiors.
The performance of flooring depends not only on the surface material but also on the quality of the base, subfloor, screed, joints, adhesives, and workmanship.
Basic Components of a Flooring System
A typical flooring system may consist of several layers.
These may include:
structural slab;
damp-proof or waterproof layer;
leveling screed;
adhesive or bedding mortar;
flooring finish;
joint filler or sealant.
In some applications, additional layers may include insulation, acoustic mats, vapor barriers, or underfloor services.
Proper preparation of the substrate is essential because unevenness, cracks, moisture, or contamination can lead to later flooring failure.
Tile Flooring
Tile flooring is one of the most widely used systems in residential, commercial, institutional, and public buildings. Tiles are available in a wide variety of materials, sizes, finishes, colors, and textures.
Common tile materials include:
ceramic tiles;
porcelain tiles;
vitrified tiles;
natural stone tiles;
cement tiles;
mosaic tiles.
Ceramic Tiles
Ceramic tiles are produced from clay and other minerals that are shaped and fired at high temperature.
They may be glazed or unglazed.
Advantages include:
wide design range;
ease of cleaning;
water resistance;
relatively low maintenance;
suitability for walls and floors.
Ceramic tiles are commonly used in kitchens, bathrooms, residential rooms, and commercial interiors.
Porcelain Tiles
Porcelain tiles are denser and less porous than many conventional ceramic tiles.
They offer:
high strength;
good stain resistance;
low water absorption;
durability;
suitability for high-traffic areas.
Porcelain tiles may imitate stone, timber, concrete, or other materials.
Vitrified Tiles
Vitrified tiles are manufactured through a process that produces a dense and glass-like body.
They are popular because of their:
low porosity;
smooth finish;
durability;
resistance to stains;
consistent dimensions.
They are widely used in modern residential and commercial interiors.
Tile Installation
Tiles may be fixed using:
cement-sand mortar;
tile adhesive;
specialized thin-set systems.
The substrate should be clean, stable, and level.
Important installation steps include:
checking the base;
setting out the tile pattern;
applying adhesive;
placing tiles with correct spacing;
checking alignment and level;
grouting joints;
cleaning the finished surface.
Proper joint width is important to accommodate dimensional variation and minor movement.
Advantages of Tile Flooring
Tile flooring offers several benefits:
wide range of designs;
good moisture resistance;
easy maintenance;
durability;
compatibility with underfloor heating;
resistance to stains and chemicals in many cases.
However, some tiles may be slippery when wet.
Therefore, slip-resistant finishes should be selected for bathrooms, ramps, external areas, and other wet locations.
Terrazzo Flooring
Terrazzo is a composite flooring material made by combining decorative aggregates with a cementitious or resin-based binder.
Aggregates may include:
marble chips;
granite chips;
quartz;
glass;
recycled materials.
After placement, the surface is ground and polished to create a smooth and decorative finish.
Terrazzo has been used for centuries and remains popular in public and institutional buildings because of its durability.
Types of Terrazzo
Cement-Based Terrazzo
This traditional system uses cement as the binder.
It is usually thicker and heavier than resin-based terrazzo.
Epoxy Terrazzo
Epoxy terrazzo uses a resin binder.
It allows thinner construction and a wider range of colors.
It also provides a smooth and highly decorative surface.
Construction of Terrazzo Flooring
The typical process includes:
preparing the concrete base;
installing divider strips;
placing the terrazzo mixture;
compacting and leveling;
allowing the surface to cure;
grinding;
filling small voids;
polishing;
sealing where required.
Divider strips are commonly made from brass, aluminum, zinc, or other materials.
They help control cracking and create patterns.
Advantages of Terrazzo
Terrazzo offers:
long service life;
excellent wear resistance;
seamless appearance;
high decorative potential;
low maintenance;
suitability for high traffic.
It is commonly used in:
airports;
hospitals;
educational buildings;
shopping centers;
public halls;
institutional buildings.
A well-maintained terrazzo floor can remain functional for many decades.
Limitations of Terrazzo
Potential limitations include:
higher initial cost;
skilled workmanship requirements;
longer installation time for some systems;
risk of cracking if the substrate moves;
hard walking surface.
Proper movement joints and substrate design are therefore important.
Concrete Flooring
Concrete flooring is commonly used in industrial, commercial, institutional, and modern architectural interiors.
A concrete floor may be left as a simple finished slab or treated with decorative and protective systems.
Concrete floors can be:
power-trowelled;
polished;
stained;
colored;
textured;
coated.
Basic Concrete Floor Construction
Concrete flooring usually involves placing concrete over a prepared base or structural slab.
The sequence may include:
subgrade preparation;
granular base;
vapor barrier where required;
reinforcement;
concrete placement;
compaction;
screeding;
finishing;
joint formation;
curing.
Good curing is essential for strength and durability.
Polished Concrete
Polished concrete is produced by mechanically grinding and polishing the concrete surface.
The process may involve progressively finer abrasives.
A densifier may also be applied to harden the surface.
Advantages include:
high durability;
modern appearance;
easy cleaning;
reduced need for additional floor finishes;
long service life.
Polished concrete is commonly used in offices, shops, airports, warehouses, and contemporary residences.
Industrial Concrete Floors
Industrial floors are designed for heavy traffic and equipment loads.
They may be used in:
factories;
warehouses;
logistics centers;
workshops;
parking facilities.
These floors must often resist:
forklifts;
impact;
abrasion;
chemicals;
heavy machinery.
Special surface hardeners or coatings may be used to improve performance.
Concrete Floor Joints
Concrete shrinks and expands due to temperature and moisture changes.
Joints are therefore essential.
Common types include:
construction joints;
contraction joints;
isolation joints;
expansion joints.
Poor joint design can lead to uncontrolled cracking.
Advantages of Concrete Flooring
Concrete flooring offers:
high compressive strength;
durability;
resistance to heavy loads;
relatively low maintenance;
thermal mass;
compatibility with industrial use.
However, concrete can feel hard and cold underfoot and may develop cracks if not correctly designed and cured.
Raised Access Floors
Raised access flooring is a specialized system in which floor panels are elevated above the structural floor slab, creating a concealed service zone underneath.
The system is particularly useful in buildings that require frequent access to electrical, communication, data, or mechanical services.
A typical raised access floor consists of:
pedestal supports;
stringers where required;
removable floor panels;
finished surface covering.
Pedestal System
Pedestals are vertical adjustable supports fixed to the structural slab.
They allow the floor height to be accurately controlled.
The void beneath the panels can accommodate:
cables;
data lines;
electrical systems;
air distribution;
pipes.
Floor Panels
Panels may be manufactured from:
steel;
calcium sulfate;
wood-core materials;
cementitious materials;
composite systems.
The top surface may receive:
carpet tiles;
vinyl;
laminate;
stone;
antistatic finishes.
Panels are usually removable, allowing easy access to services below.
Applications of Raised Access Floors
Raised floors are commonly used in:
data centers;
server rooms;
offices;
control rooms;
trading floors;
laboratories;
telecommunications facilities.
They are particularly valuable where technical services change frequently.
Advantages of Raised Access Floors
The system provides several benefits:
easy access to services;
flexible office layouts;
simplified cable management;
quick maintenance;
adaptable electrical distribution;
potential use for underfloor air conditioning.
Raised floors can significantly reduce disruption when office workstations or technology systems are relocated.
Limitations of Raised Floors
Potential disadvantages include:
higher initial cost;
reduction in clear room height;
need for careful structural design;
vibration concerns;
requirement for precise installation;
need for fire stopping around penetrations.
In areas with heavy equipment, panel load capacity must be carefully checked.
Comparison of Flooring Systems
Each flooring system serves a different purpose.
Tiles are ideal where easy maintenance, moisture resistance, and visual variety are important.
Terrazzo is suitable for prestigious, high-traffic environments requiring durability and decorative quality.
Concrete flooring is appropriate for industrial, commercial, and minimalist architectural applications.
Raised access flooring is best suited to technology-intensive spaces requiring flexible access to services.
Selection should be based on:
traffic level;
moisture exposure;
maintenance;
structural load;
appearance;
cost;
service requirements.
Flooring and Moisture Control
Moisture is a major cause of flooring failure.
Problems may include:
tile debonding;
staining;
adhesive failure;
mold growth;
terrazzo discoloration;
coating blistering.
Moisture barriers should be used where required, especially over ground-bearing slabs.
The concrete substrate should also have adequate moisture conditions before sensitive flooring is installed.
Slip Resistance
Safety is an important flooring consideration.
Wet areas require surfaces with adequate slip resistance.
Such areas include:
bathrooms;
kitchens;
entrances;
swimming pool decks;
ramps;
external walkways.
Highly polished surfaces should be used carefully in locations exposed to water.
Acoustic Performance
Hard floor finishes can reflect sound and increase noise.
Acoustic performance can be improved through:
resilient underlays;
acoustic mats;
carpet finishes;
floating floors;
insulated raised floors.
Acoustic requirements are particularly important in apartments, offices, schools, and hospitals.
Thermal Comfort
Floor materials influence thermal sensation.
Tiles, terrazzo, and concrete may feel cool, which can be useful in hot climates.
These materials also work effectively with radiant or underfloor heating systems because of their thermal mass.
Raised floors can also support underfloor air-distribution systems.
Maintenance
Different flooring systems require different maintenance strategies.
Tile floors generally require regular cleaning and periodic grout maintenance.
Terrazzo may require polishing and resealing.
Concrete floors may require re-polishing or repair of joints.
Raised floors require inspection of:
panels;
pedestals;
service voids;
edge details.
Preventive maintenance extends the service life of flooring.
Sustainability
Flooring can contribute to sustainable building design.
Considerations include:
locally sourced materials;
recycled content;
long service life;
low-maintenance finishes;
reduced replacement frequency;
low-emission adhesives;
reuse and recyclability.
Terrazzo can incorporate recycled aggregates, while concrete can use supplementary cementitious materials. Raised floor systems may also allow building services to be changed without major demolition.
Common Flooring Defects
Typical defects include:
cracks;
uneven surfaces;
hollow tiles;
loose tiles;
stained grout;
terrazzo cracking;
concrete dusting;
panel rocking in raised floors;
damaged finishes.
Many defects result from poor substrate preparation, inadequate joints, moisture, or improper installation.
Quality Control
Flooring work should be inspected for:
level and flatness;
joint alignment;
adhesion;
surface finish;
moisture condition;
slope in wet areas;
edge detailing.
Raised flooring should additionally be checked for pedestal alignment, panel stability, and load capacity.
Conclusion
Flooring systems play an important role in the performance, appearance, and functionality of buildings. Tile flooring provides versatility, moisture resistance, and ease of maintenance. Terrazzo offers exceptional durability and decorative quality. Concrete flooring provides strength, economy, and suitability for heavy-duty applications, while raised access floors provide flexibility and easy access to technical services.
The successful performance of any flooring system depends on proper substrate preparation, material selection, joint design, moisture control, installation, and maintenance. Floors must also address safety, thermal comfort, acoustics, and expected loading.
When the right flooring system is selected for the intended use, it can provide a durable, attractive, safe, and efficient surface that contributes significantly to the long-term quality of the built environment.
Daily writing prompt
How do you write what people actually want to read?
Fire Protection Materials, Fire Rating, and Compartmentation
Introduction
Fire safety is a fundamental part of building design and construction. A building must not only provide shelter and functional space but also protect occupants and structural systems during a fire. Effective fire protection depends on a combination of fire-resistant materials, appropriate fire ratings, compartmentation, detection systems, evacuation planning, and firefighting provisions.
Among these measures, passive fire protection is especially important because it is built into the structure itself. Passive fire protection includes fire-resistant walls, floors, doors, ceilings, structural coatings, and compartment barriers that limit the spread of flames, heat, and smoke. Unlike active systems such as sprinklers or alarms, passive systems do not require activation to perform their basic role.
Understanding fire protection materials, fire ratings, and compartmentation is essential for architects, civil engineers, building designers, facility managers, and construction professionals.
Fire Behaviour in Buildings
A fire requires three basic elements:
fuel;
oxygen;
heat.
Together, these are often described as the fire triangle.
In a building, fuel may include furniture, finishes, timber, plastics, fabrics, papers, and stored materials. Once ignition occurs, heat can spread through radiation, convection, and conduction.
The severity of a building fire depends on:
quantity and type of combustible material;
ventilation;
room size;
surface finishes;
structural materials;
fire protection systems.
The main objective of fire-resistant construction is to delay structural failure and restrict fire and smoke movement long enough for occupants to escape and firefighters to respond.
Passive and Active Fire Protection
Fire safety systems can broadly be divided into passive and active protection.
Passive Fire Protection
Passive systems are built into the structure.
Examples include:
fire-resistant walls;
fire-rated doors;
fire-resistant floors;
protected structural steel;
fire stops;
smoke barriers;
compartment walls;
fire-resistant glazing.
Active Fire Protection
Active systems operate when a fire occurs.
Examples include:
automatic sprinklers;
fire alarms;
smoke detectors;
hydrants;
fire extinguishers;
smoke extraction systems.
Both systems should work together as part of an integrated fire safety strategy.
Fire Protection Materials
Different materials behave differently under fire exposure. Some materials are naturally non-combustible, while others require protective treatment.
Concrete
Concrete is generally considered to have good fire resistance because it is non-combustible and has relatively low thermal conductivity.
Advantages include:
does not burn;
delays heat transfer;
protects embedded reinforcement;
maintains structural capacity for a period during fire.
However, very high temperatures can cause cracking, spalling, and loss of strength.
Adequate concrete cover over reinforcement is therefore important for fire resistance.
Brick and Masonry
Brick, concrete block, and stone masonry generally provide good fire resistance.
Masonry walls can act as effective fire barriers when they have:
sufficient thickness;
proper mortar joints;
sealed penetrations;
suitable structural stability.
Masonry is commonly used for fire compartment walls, stair enclosures, and service shafts.
Gypsum Board
Gypsum board is widely used in fire-rated partitions and ceilings.
Gypsum contains chemically combined water. During fire exposure, this water is gradually released as vapor, helping to delay temperature rise.
Fire-resistant gypsum systems may consist of:
multiple board layers;
steel studs;
cavity insulation;
fire-resistant sealants.
The fire rating depends on the complete tested wall or ceiling assembly.
Mineral Wool
Mineral wool is a non-combustible insulation material made from mineral fibers.
It is commonly used for:
fire barriers;
wall cavities;
ceilings;
façade systems;
service penetrations.
It provides both thermal insulation and fire resistance.
Mineral wool is especially useful for filling gaps around pipes, ducts, and structural elements.
Calcium Silicate Boards
Calcium silicate boards are used for fire protection in walls, ceilings, shafts, and structural encasements.
Their advantages include:
non-combustibility;
good thermal resistance;
dimensional stability;
relatively low weight.
They are commonly used for protecting steel columns and beams.
Vermiculite and Perlite
Vermiculite and perlite are lightweight mineral materials that can be incorporated into plasters or boards.
They help improve thermal and fire resistance.
They are often used in:
sprayed fireproofing;
lightweight plaster;
fire-resistant panels;
steel protection systems.
Intumescent Coatings
Intumescent paint is a special coating applied to structural steel.
When exposed to high temperatures, the coating expands and forms a thick insulating char layer.
This slows the rate at which steel heats up.
Advantages include:
relatively thin protective layer;
clean architectural appearance;
useful for exposed steelwork;
adaptable to complex shapes.
Intumescent systems must be applied to the required thickness and maintained properly.
Spray-Applied Fire-Resistive Materials
Spray-applied materials are commonly used to protect steel beams and columns.
They may contain:
mineral fibers;
cementitious materials;
vermiculite.
The coating insulates structural steel and delays temperature rise.
Careful application is necessary to maintain uniform thickness and adhesion.
Fire-Resistant Glass
Conventional glass can crack quickly when exposed to fire.
Fire-resistant glazing is specially designed to provide a defined level of performance.
Different products may provide:
integrity against flames;
smoke control;
reduced heat radiation;
thermal insulation.
Fire-resistant glazing is used in corridors, doors, partitions, and protected escape routes.
Fire-Resistant Doors
Fire doors are critical elements in compartmentation.
They are designed to remain closed during a fire and restrict the spread of flames and smoke.
A typical fire door assembly may include:
fire-resistant door leaf;
rated frame;
self-closing device;
intumescent seals;
smoke seals;
tested ironmongery.
A fire door must be installed as a complete tested system.
Timber and Fire Protection
Timber is combustible, but its fire performance depends on size and detailing.
Large timber sections develop a char layer on their exposed surface. This char can slow further burning and protect the inner section.
Timber fire protection methods include:
gypsum board encasement;
fire-retardant treatment;
increased member dimensions;
protected connections;
sprinklers.
Mass timber buildings require careful fire engineering.
Steel and Fire
Steel is non-combustible but loses strength and stiffness as temperature increases.
At sufficiently high temperatures, an unprotected steel member may deform or buckle.
Steel protection methods include:
intumescent coatings;
spray-applied fireproofing;
concrete encasement;
gypsum board protection;
fire-resistant ceiling systems.
Fire Rating
A fire rating indicates how long a building element can maintain specified performance when exposed to a standard fire test.
Fire resistance is commonly expressed in minutes or hours, such as:
30 minutes;
60 minutes;
90 minutes;
120 minutes;
180 minutes.
The required rating depends on factors such as building height, occupancy, compartment size, structural function, and applicable codes.
Fire Resistance Criteria
Fire-resistant elements are often evaluated using three basic criteria:
Load-Bearing Capacity
The structural element must continue supporting its design load during fire exposure.
Integrity
The element should prevent flames and hot gases from passing through openings or cracks.
Insulation
The unexposed side should not reach excessive temperatures that could ignite materials or endanger occupants.
These criteria are often represented conceptually as:
R – Load-bearing resistance E – Integrity I – Insulation
The exact notation used may depend on the applicable testing standard.
Fire Rating of Walls
A fire-rated wall is designed to limit fire spread from one space to another.
The rating depends on:
wall material;
thickness;
board layers;
stud construction;
insulation;
joints;
penetrations.
A wall system should not be assumed to have a fire rating simply because one component is fire resistant.
The entire assembly must meet the required performance.
Fire Rating of Floors and Ceilings
Floors and ceilings can separate different storeys and prevent vertical fire spread.
A fire-rated floor assembly may include:
reinforced concrete slab;
steel deck;
fire-resistant ceiling;
insulation;
protected steel beams.
Openings in floors should be carefully protected because they can allow rapid smoke and flame movement between levels.
Fire Rating of Structural Members
Structural columns and beams must retain sufficient strength during fire.
Their required protection depends on:
member size;
load level;
fire exposure;
protection material;
required resistance period.
Structural fire protection is especially important for escape routes and major load-bearing frames.
Compartmentation
Fire compartmentation is the division of a building into separate fire-resistant sections.
The main purpose is to contain fire and smoke within a limited area for a defined period.
A fire compartment may be formed using:
fire-rated walls;
floors;
doors;
ceilings;
shafts;
fire-resistant glazing.
Compartmentation limits the size of a fire and provides safer escape conditions.
Objectives of Compartmentation
The main objectives are to:
restrict fire spread;
limit smoke movement;
protect escape routes;
reduce property damage;
support firefighting operations;
delay structural involvement.
Compartmentation is particularly important in large buildings such as hospitals, hotels, offices, shopping centres, and high-rise buildings.
Horizontal Compartmentation
Horizontal compartmentation divides a floor into separate fire zones.
Fire-resistant walls and doors are used to limit lateral spread.
This is useful where occupants may need to move from one part of a floor to another during evacuation.
Hospitals often use horizontal compartmentation because some patients may not be able to use stairs easily.
Vertical Compartmentation
Vertical compartmentation prevents fire from moving between floors.
Elements include:
fire-resistant floors;
protected shafts;
enclosed staircases;
sealed service risers;
protected lift shafts.
Unprotected vertical openings can act like chimneys and allow smoke and heat to move rapidly upward.
Fire Compartments and Escape Routes
Escape routes should be protected from fire and smoke.
Protected escape routes may include:
fire-rated corridors;
enclosed staircases;
fire doors;
smoke lobbies;
protected exits.
Compartment walls should be arranged so that occupants have sufficient time to reach a safe exit.
Fire Stopping
Fire compartmentation can fail if openings are not properly sealed.
Penetrations may be created for:
electrical cables;
pipes;
ducts;
data services;
drainage systems.
Fire stopping materials are used to seal these openings.
Examples include:
fire-resistant sealants;
collars;
wraps;
mineral wool;
firestop boards;
firestop mortar.
These systems must accommodate the type of service passing through the barrier.
Fire Dampers
Ventilation ducts can allow fire and smoke to cross compartment walls.
Fire dampers are installed within ducts where they pass through fire-rated barriers.
When activated by heat, the damper closes and restricts fire spread through the duct system.
Smoke dampers may also be used to control smoke movement.
Cavity Barriers
Concealed cavities within walls, roofs, façades, and ceilings can allow hidden fire spread.
Cavity barriers are installed to divide these voids into smaller sections.
They are particularly important in:
suspended ceilings;
ventilated façades;
lightweight walls;
roof voids.
Compartmentation in Façades
External façades require careful fire detailing because fire can spread vertically or horizontally outside the main compartment.
Important considerations include:
non-combustible or appropriately tested materials;
cavity barriers;
perimeter fire seals;
protection around windows;
slab-edge fire stopping.
Façade systems should be considered as complete assemblies.
Smoke Control
Smoke is a major hazard during building fires because it reduces visibility and contains toxic gases.
Compartmentation helps control smoke, but additional measures may include:
smoke doors;
pressurized staircases;
smoke extraction;
smoke reservoirs;
automatic vents.
The goal is to maintain tenable conditions along escape routes.
Fire Compartment Doors
A compartment wall is only effective if its doors perform correctly.
Fire doors should:
remain closed when required;
fit correctly within the frame;
have functioning self-closing devices;
contain suitable seals;
not be wedged open;
remain free from damage.
Regular inspection is essential.
Common Weaknesses in Fire Compartmentation
Typical defects include:
gaps around service penetrations;
damaged fire doors;
missing fire stops;
unsealed cable openings;
incomplete walls above suspended ceilings;
damaged fire-resistant boards;
poorly installed dampers.
Even small defects can significantly reduce the effectiveness of a fire barrier.
Inspection and Maintenance
Passive fire protection requires periodic inspection.
Important items include:
fire door condition;
fire seals;
compartment walls;
service penetrations;
structural coatings;
fire-resistant ceilings;
dampers;
cavity barriers.
Any modification to services or internal layouts should be checked to ensure that fire barriers remain continuous.
Fire Safety During Construction
Buildings may be especially vulnerable to fire during construction because permanent fire systems may not yet be operational.
Precautions include:
controlled hot work;
storage of combustible materials;
temporary firefighting equipment;
clear escape routes;
housekeeping;
temporary fire barriers.
Fire protection should be considered from early construction stages.
Sustainability and Fire Protection
Sustainable construction should not compromise fire safety.
Materials chosen for low embodied carbon, insulation, lightweight façades, or energy efficiency should also be assessed for fire performance.
A balanced design considers:
environmental impact;
durability;
thermal efficiency;
fire resistance;
occupant safety.
Durable fire protection systems also reduce replacement and repair requirements over a building’s life.
Integrated Fire Safety Design
Fire protection should be coordinated with:
architecture;
structural design;
mechanical systems;
electrical services;
evacuation planning;
accessibility.
For example, a fire-rated wall may lose its intended performance if ducts, cables, or doors are installed incorrectly.
Therefore, fire safety requires coordination between multiple design disciplines.
Conclusion
Fire protection materials, fire ratings, and compartmentation are fundamental elements of safe building design. Materials such as concrete, masonry, gypsum board, mineral wool, calcium silicate, intumescent coatings, and fire-resistant glazing can delay the spread of heat and flames and protect structural components.
Fire ratings provide a measurable indication of how long walls, floors, doors, or structural members can maintain specified performance under standard fire conditions. However, the rating applies to the complete tested assembly rather than to a single material in isolation.
Compartmentation divides a building into fire-resistant zones, restricting the spread of flames and smoke and protecting escape routes. Its effectiveness depends on continuous barriers, reliable fire doors, properly sealed penetrations, functioning dampers, and regular maintenance.
A successful fire safety strategy integrates passive protection, active systems, structural stability, smoke control, and evacuation planning. When these elements are properly designed and maintained, they significantly improve occupant safety, reduce property damage, and increase the resilience of buildings during fire emergencies.
Daily writing prompt
How do you write what people actually want to read?
Lightweight Construction, Drywall, and Sandwich Panels
Introduction
Lightweight construction refers to building systems that reduce the dead load of a structure by using materials and components that are lighter than conventional masonry, reinforced concrete, or solid stone construction. Such systems are increasingly used in residential, commercial, institutional, industrial, and prefabricated buildings because they allow faster construction, easier handling, lower structural loads, and greater flexibility in planning.
Among the most common lightweight building systems are drywall partitions and sandwich panels. Drywall is widely used for internal partitions, ceilings, and wall linings, while sandwich panels are used for walls, roofs, façades, cold storage facilities, warehouses, industrial sheds, and modular construction. Both systems support rapid, dry, and relatively clean construction methods.
Lightweight construction does not mean weak construction. When properly designed, these systems can provide adequate strength, fire resistance, thermal insulation, acoustic performance, and durability. Their successful use depends on correct material selection, structural detailing, joint treatment, moisture protection, and workmanship.
Concept of Lightweight Construction
Traditional construction often relies on heavy materials such as brick masonry, stone, and reinforced concrete. Lightweight construction replaces some of these elements with materials such as:
light-gauge steel;
timber framing;
gypsum boards;
fiber-cement boards;
aluminum panels;
insulated sandwich panels;
lightweight concrete blocks;
composite panels.
The primary objective is to reduce self-weight while maintaining the required structural and functional performance.
Lower dead load can reduce the size of foundations, columns, beams, and supporting structural members. It can also make transportation and erection easier.
Advantages of Lightweight Construction
Lightweight systems offer several important benefits.
Faster Construction
Many components are factory-made and assembled on site. This reduces wet construction and allows faster project completion.
Reduced Structural Load
Lower building weight reduces loads on floors, frames, and foundations.
This is particularly useful in:
high-rise buildings;
building extensions;
renovation projects;
seismic regions.
Flexibility
Lightweight partitions can often be altered more easily than masonry walls.
This allows flexible interior planning in offices, hospitals, hotels, educational buildings, and commercial spaces.
Cleaner Construction
Dry construction produces less water usage, debris, and site waste compared with conventional plastered masonry.
Improved Prefabrication
Panels and framed components can be produced under controlled factory conditions, improving dimensional accuracy and quality.
Drywall Construction
Drywall is a lightweight internal wall system made from boards fixed to a supporting frame.
The most common drywall board is gypsum plasterboard, also known as gypsum board or plasterboard.
A typical drywall partition consists of:
floor track;
ceiling track;
vertical studs;
gypsum boards;
screws;
joint tape;
jointing compound;
insulation where required.
The supporting frame may be made from light-gauge galvanized steel or timber.
Gypsum Board
Gypsum board consists of a gypsum core faced with paper or other protective layers.
It is widely used because it is:
lightweight;
easy to install;
economical;
smooth;
suitable for painting;
fire resistant to a certain degree.
Different types of gypsum boards are available for specific applications.
Types of Gypsum Boards
Standard Gypsum Board
Used for normal internal walls and ceilings in dry areas.
Moisture-Resistant Board
Used in areas exposed to higher humidity, such as kitchens and selected bathroom locations.
Fire-Resistant Board
Contains additives and reinforcement that improve fire resistance.
It is often used in fire-rated walls, service shafts, corridors, and structural protection systems.
Acoustic Board
Designed to improve sound insulation and reduce noise transfer.
Impact-Resistant Board
Used where partitions may experience greater physical abuse, such as schools, hospitals, and public buildings.
Drywall Framing
Light-gauge steel framing is widely used for drywall partitions.
The system generally includes:
Tracks: Horizontal members fixed to the floor and ceiling.
Studs: Vertical members placed between the tracks.
Nogging or bracing: Additional support where required.
The studs provide support for boards and allow service installations to pass through the wall cavity.
Drywall Installation Process
A typical installation sequence includes:
marking the wall location;
fixing floor and ceiling tracks;
installing vertical studs;
placing services within the cavity;
installing insulation if required;
fixing gypsum boards;
treating joints;
sanding and finishing;
applying paint or decorative finish.
Good alignment is essential to achieve straight walls.
Joint Treatment
The joints between gypsum boards are treated using jointing compound and tape.
The process normally includes:
first coat of compound;
embedding joint tape;
additional coats;
sanding;
final finishing.
Poor joint treatment may result in visible cracks or uneven surfaces.
Drywall and Fire Resistance
Gypsum contains chemically combined water.
When exposed to fire, some of this water is released as vapor, which helps slow temperature rise.
Fire-rated drywall systems may use:
multiple board layers;
fire-resistant gypsum;
insulated cavities;
protected framing.
The fire resistance of a wall depends on the complete tested assembly, not only the board type.
Acoustic Performance of Drywall
Drywall systems can provide good acoustic separation when correctly designed.
Sound performance can be improved by:
increasing board layers;
using acoustic insulation;
using staggered studs;
creating double-frame walls;
sealing gaps around services;
using resilient channels.
Openings and poorly sealed joints can significantly reduce acoustic performance.
Moisture Protection in Drywall
Standard gypsum board should not be exposed to continuous moisture.
Areas prone to water exposure require appropriate moisture-resistant materials, membranes, and detailing.
In wet areas, boards should be protected from direct water contact.
Water leakage within wall cavities can damage boards and encourage mold growth.
Advantages of Drywall
Drywall provides several construction benefits:
low weight;
fast installation;
smooth finish;
easy service integration;
simple modification;
good fire performance when correctly designed;
good acoustic potential;
reduced construction waste.
It is particularly suitable for non-load-bearing internal partitions.
Limitations of Drywall
Some disadvantages include:
lower impact resistance than masonry;
sensitivity to water;
requirement for specialized fixing when supporting heavy objects;
possibility of joint cracking;
hollow sound if poorly constructed.
Heavy fixtures should be attached to studs or specially provided supports.
Sandwich Panels
A sandwich panel is a composite building element consisting of two strong outer facing layers bonded to a lightweight core.
The principle is similar to an I-beam: the outer skins resist bending stresses while the core keeps them separated and transfers shear.
A typical sandwich panel contains:
Outer skin + insulation core + inner skin
The facing materials may be steel, aluminum, fiber-reinforced sheets, or composite boards.
Core Materials in Sandwich Panels
Common core materials include:
polyurethane foam;
polyisocyanurate foam;
expanded polystyrene;
extruded polystyrene;
mineral wool;
honeycomb cores.
The choice of core affects thermal performance, fire behavior, weight, stiffness, and cost.
Metal-Faced Sandwich Panels
Metal-faced insulated panels are widely used in industrial and commercial construction.
They commonly consist of coated steel sheets surrounding an insulating core.
Applications include:
warehouses;
factories;
cold storage;
food-processing facilities;
prefabricated buildings;
roofs;
external walls.
These panels combine enclosure and insulation in a single component.
Structural Behavior of Sandwich Panels
The outer skins carry tensile and compressive stresses caused by bending.
The core:
separates the skins;
resists shear;
provides thermal insulation;
stabilizes the thin facing sheets.
Because the skins are separated by the core, the panel can achieve considerable stiffness with relatively little material.
Types of Sandwich Panels
Polyurethane and PIR Panels
These panels provide high thermal insulation and are commonly used for walls and roofs.
PIR cores generally offer improved fire performance compared with some conventional polyurethane products.
EPS Panels
Expanded polystyrene core panels are lightweight and economical.
They are widely used in modular and prefabricated construction.
Mineral Wool Panels
Mineral wool provides:
fire resistance;
acoustic insulation;
thermal insulation.
These panels are suitable where fire performance is a major consideration.
Honeycomb Panels
Honeycomb cores may be made from aluminum, paper, or composite materials.
They are lightweight and can provide high stiffness.
They are often used in façades, transportation, and specialized architectural applications.
Roof Sandwich Panels
Roof sandwich panels combine roofing, insulation, and interior lining.
They may have profiled external metal sheets to improve drainage and stiffness.
Benefits include:
rapid installation;
reduced roof weight;
integrated insulation;
clean interior finish.
Correct overlap and joint detailing are essential to prevent leakage.
Wall Sandwich Panels
Wall sandwich panels can form the external envelope of industrial and commercial buildings.
They may be installed horizontally or vertically.
Joints are designed to control:
water penetration;
air leakage;
thermal bridging;
movement.
Sealants and gaskets are often used at panel interfaces.
Thermal Performance
One of the main advantages of sandwich panels is their insulation capacity.
The core limits heat transfer, helping reduce energy demand for heating and cooling.
Thermal performance depends on:
core thickness;
insulation type;
panel joints;
fasteners;
thermal bridges.
Continuous insulation generally performs better than systems with many conductive interruptions.
Acoustic Performance
Sandwich panels can provide varying levels of sound insulation.
Mineral wool cores are often effective where acoustic performance is important.
Performance can be improved through:
thicker panels;
perforated internal skins;
acoustic core materials;
multi-layer assemblies.
Fire Performance
Fire behavior varies significantly depending on the core.
Mineral wool is non-combustible, while foam insulation systems require careful fire assessment.
Fire safety should consider:
flame spread;
smoke production;
core combustibility;
joint behavior;
fire compartmentation.
Selection should comply with applicable fire safety regulations.
Lightweight Steel Framing
Lightweight construction is often combined with Light Gauge Steel Framing (LGSF).
LGSF uses thin galvanized steel sections formed into:
studs;
tracks;
joists;
rafters;
trusses.
The system is used for walls, floors, roofs, and modular buildings.
Advantages include high precision, low weight, fast assembly, and resistance to termites.
Lightweight Panels in Prefabricated Construction
Drywall and sandwich panels are commonly used in prefabricated and modular buildings.
Factory production can improve:
quality control;
speed;
dimensional accuracy;
waste management.
Modules can be assembled rapidly on site, reducing disruption and labor requirements.
Applications in Renovation
Lightweight construction is particularly suitable for building renovation.
Because the systems add relatively little dead load, they can be used to:
subdivide existing spaces;
create additional rooms;
improve insulation;
upgrade façades;
add lightweight floors or extensions.
This can reduce the need for major strengthening of existing structures.
Common Defects
Drywall Defects
Typical defects include:
cracked joints;
screw popping;
damaged corners;
moisture staining;
uneven surfaces;
board sagging.
Sandwich Panel Defects
Common problems include:
water leakage at joints;
damaged coatings;
corrosion;
delamination;
thermal bridging;
loose fasteners;
dented external skins.
Many defects can be prevented through proper installation and regular inspection.
Sustainability
Lightweight construction can support sustainable building practices.
Potential benefits include:
reduced structural material use;
lower transportation weight;
faster construction;
reduced waste;
factory prefabrication;
possibility of disassembly.
However, sustainability also depends on material sourcing, manufacturing energy, durability, recyclability, and end-of-life management.
Steel framing can be recycled, while gypsum can also be recovered in suitable recycling systems.
Quality Control
Drywall and sandwich panel installation should be carefully inspected.
Important checks include:
frame spacing;
alignment;
screw spacing;
board joints;
insulation continuity;
panel fixing;
sealants;
flashing;
weatherproofing.
Correct workmanship is especially important because thin lightweight systems are sensitive to small installation errors.
Safety Considerations
Panels should be handled carefully because large sheets can be difficult to control in windy conditions.
Workers should use appropriate lifting methods and protective equipment.
Fire-rated systems should not be modified without checking their performance.
Services passing through fire-rated walls should be properly sealed.
Conclusion
Lightweight construction has become an important part of modern building technology because it offers speed, flexibility, reduced dead load, and efficient use of materials. Systems such as drywall partitions and sandwich panels can significantly reduce construction time while providing good functional performance.
Drywall systems use framed construction and gypsum boards to create lightweight internal walls and ceilings. They can provide effective fire and acoustic performance when properly detailed. Sandwich panels combine strong outer skins with lightweight insulating cores, creating stiff and energy-efficient wall and roof systems.
These technologies are particularly valuable in prefabricated buildings, commercial interiors, industrial structures, modular construction, and renovation projects. Their performance depends on accurate framing, appropriate materials, good joint treatment, moisture protection, fire safety, and careful installation.
When properly designed and maintained, lightweight construction, drywall, and sandwich panels provide durable, adaptable, energy-efficient, and economical alternatives to conventional heavy building systems.
Daily writing prompt
How do you write what people actually want to read?
The roof is one of the most important components of a building because it protects the interior from rain, sunlight, wind, snow, dust, and other environmental conditions. A well-designed roof contributes to structural stability, thermal comfort, drainage, durability, energy efficiency, and the overall architectural character of a building. Roofs vary widely in form, material, slope, structural system, and covering depending on climate, building use, span, construction technology, and local traditions.
The main elements involved in roof construction include the roof structure, trusses or supporting framework, and roof coverings. In many buildings, trusses provide the structural support for the roof, while roofing materials form the outer protective layer. Understanding the types, mechanics, materials, and construction details of roofs and trusses is essential in architecture, civil engineering, and building construction.
Functions of a Roof
A roof performs several important functions. Its primary role is to protect the building from weather. However, it also contributes to structural performance and thermal control.
The main functions of a roof include:
protection from rain, sun, wind, and snow;
drainage of rainwater;
thermal insulation;
structural support for roofing materials;
contribution to building appearance;
support for services such as solar panels and water tanks;
creation of usable or semi-usable spaces in some buildings.
The roof must be designed to carry both permanent and temporary loads safely.
Types of Roofs
Roofs can broadly be classified into flat roofs and pitched roofs.
Flat Roofs
Flat roofs have a very low slope and are common in reinforced concrete construction. They are widely used in urban residential, institutional, and commercial buildings.
Although they are called flat, they are normally given a slight slope for drainage.
Advantages include:
usable terrace space;
easy installation of services;
suitability for solar panels;
simple building form;
potential for future vertical expansion.
However, flat roofs require careful waterproofing because poor drainage can lead to leakage.
Pitched Roofs
Pitched roofs have clearly inclined surfaces that allow rapid rainwater drainage.
They are common in regions with heavy rainfall or snow.
Pitched roofs may be constructed using timber, steel, reinforced concrete, or prefabricated framing.
Common pitched roof forms include:
lean-to roof;
gable roof;
hip roof;
gambrel roof;
mansard roof;
butterfly roof;
monitor roof;
saw-tooth roof.
Lean-To Roof
A lean-to roof consists of a single sloping surface.
It is one of the simplest roof forms and is often used for:
verandas;
sheds;
extensions;
small service structures.
Its simplicity makes it economical and easy to construct.
Gable Roof
A gable roof consists of two sloping surfaces meeting at a ridge.
It forms triangular walls at the ends known as gables.
Advantages include:
good drainage;
simple construction;
attic space;
suitability for different roofing materials.
It is one of the most common roof forms in residential construction.
Hip Roof
A hip roof slopes downward on all sides of the building.
It generally has no vertical gable ends.
Hip roofs offer good resistance to wind because of their aerodynamic shape and balanced slopes.
They are commonly used in residential buildings and structures exposed to strong winds.
Mansard Roof
A mansard roof has two slopes on each side, with the lower slope being steeper than the upper slope.
This arrangement creates additional usable space beneath the roof.
It is often associated with traditional European architecture.
Saw-Tooth Roof
Saw-tooth roofs consist of repeated roof profiles with alternating sloping and near-vertical surfaces.
They are commonly used in industrial buildings because the vertical portions can be glazed to provide natural daylight.
Roof Structural Elements
The main structural components of a pitched roof may include:
rafters;
purlins;
ridge members;
battens;
trusses;
ceiling joists;
bracing.
Each component plays a role in transferring loads safely to the supporting walls or columns.
Rafters
Rafters are inclined structural members that extend from the ridge to the wall or eaves.
They directly support battens or roof coverings.
Rafters may be made from timber, steel, or reinforced concrete.
The size and spacing of rafters depend on:
span;
roof load;
roofing material;
slope;
structural material.
Purlins
Purlins are horizontal members that support rafters or directly support roofing sheets.
They run parallel to the ridge.
Steel purlins are commonly used in industrial buildings and may be formed from:
channels;
Z-sections;
C-sections.
Purlin spacing depends on the type of roof covering and the expected loads.
Ridge
The ridge is the highest horizontal line where two sloping roof surfaces meet.
A ridge board or ridge beam may be provided depending on the structural system.
The ridge must be properly detailed to prevent water penetration.
Eaves
The eaves are the lower edges of a roof projecting beyond the wall.
They help protect external walls from rain and sunlight.
Gutters are often fixed at the eaves to collect rainwater.
Trusses
A roof truss is a structural framework made of straight members arranged mainly in triangular forms.
Trusses are efficient because they transfer loads mainly through axial tension and compression.
They are suitable for long-span roofs where intermediate supports are undesirable.
Trusses are commonly made from:
timber;
steel;
aluminum;
engineered wood.
Components of a Roof Truss
Top Chord
The top chord forms the sloping upper members of the truss.
It generally carries compression under gravity loads.
Bottom Chord
The bottom chord forms the lower horizontal member.
It commonly carries tension.
Web Members
Web members connect the top and bottom chords.
They may be vertical or diagonal.
These members transfer internal forces throughout the truss.
Panel Points
The joints at which truss members meet are called panel points or nodes.
Loads should preferably be applied close to these points.
King Post Truss
A king post truss is one of the simplest roof trusses.
It consists of:
two principal rafters;
one horizontal tie beam;
one central vertical king post;
struts where required.
It is suitable for relatively short spans.
King post trusses are often used in small buildings and traditional timber construction.
Queen Post Truss
The queen post truss has two vertical members instead of one central member.
It can span greater distances than a king post truss.
It is useful where an open central portion is desirable.
Fink Truss
The Fink truss is commonly used in residential and industrial roof construction.
Its web members form a W-shaped arrangement.
It is efficient for medium spans and is well suited to prefabrication.
Pratt Truss
In a Pratt truss, diagonal members generally slope toward the center.
Under normal gravity loading, diagonal members mainly carry tension while verticals carry compression.
Pratt trusses are widely used in roofs and bridges.
Howe Truss
The Howe truss has diagonals arranged in the opposite direction to a Pratt truss.
Its diagonal members typically carry compression under gravity loading.
It has been widely used in timber and steel construction.
Warren Truss
The Warren truss is formed from a series of triangles.
It uses relatively few members and provides efficient load distribution.
Warren trusses are common in bridges and long-span roof structures.
Bowstring Truss
A bowstring truss has a curved or arched top chord and a lower tie chord.
It is suitable for large-span roofs and is often used in:
warehouses;
hangars;
sports buildings;
industrial sheds.
Roof Truss Mechanics
The efficiency of a truss comes from triangular geometry.
Unlike solid beams, truss members are intended to carry primarily axial forces.
Some members work in compression, while others work in tension.
The basic load path is:
Roof covering → Purlins → Truss → Supports → Foundation
Compression members must be checked for buckling, while tension members must be designed against yielding and connection failure.
Connections are particularly important because failure of a joint may affect the entire truss.
Roof Loads
A roof must be designed for several types of loads.
These include:
Dead Load
Dead load includes the permanent weight of:
roof coverings;
structural framing;
insulation;
ceilings;
fixed services.
Live Load
Live loads may result from:
maintenance workers;
temporary stored materials;
access activities.
Wind Load
Wind can create both pressure and suction on roofs.
Roof edges and corners are particularly vulnerable to uplift.
Snow Load
In cold regions, snow accumulation may create significant vertical load.
Rainwater Ponding
Poor drainage on low-slope roofs may lead to ponding, increasing load and leakage risk.
Roof Coverings
Roof covering is the outermost layer that protects the building from weather.
The choice depends on:
climate;
slope;
structural system;
cost;
durability;
fire resistance;
appearance;
maintenance.
Clay Tiles
Clay tiles are traditional roofing materials used widely in pitched roofs.
Advantages include:
durability;
good thermal performance;
attractive appearance;
resistance to weather.
They require adequate roof slope and supporting battens.
Clay tiles are relatively heavy, so the roof structure must be designed accordingly.
Concrete Tiles
Concrete tiles are similar in function to clay tiles but are made from cement-based materials.
They are durable and available in various colors and profiles.
Like clay tiles, they add significant dead load to the roof.
Slate Roofing
Slate is a natural stone roofing material.
It offers:
high durability;
excellent appearance;
fire resistance;
long service life.
However, slate is heavy and relatively expensive.
Metal Roofing
Metal roofing is widely used in residential, industrial, and commercial buildings.
Common materials include:
galvanized steel;
aluminum;
zinc;
copper.
Metal roofing can be supplied as sheets, panels, or standing seam systems.
Advantages include:
low weight;
rapid installation;
durability;
recyclability.
Insulation and acoustic treatment may be required to reduce heat gain and rain noise.
Corrugated Sheets
Corrugated roofing sheets are common in industrial and low-cost construction.
They may be made from steel, aluminum, or other materials.
The corrugated shape improves stiffness and allows sheets to span between purlins.
Asphalt Shingles
Asphalt shingles are widely used in pitched residential roofs in some regions.
They are relatively lightweight and easy to install.
They require a continuous roof deck beneath them.
Thatch Roofing
Thatch uses natural materials such as:
grass;
reeds;
straw;
palm leaves.
It has been used traditionally in many regions.
Advantages include low embodied energy and good insulation.
However, it requires careful fire protection and regular maintenance.
Waterproofing Membranes
Flat and low-slope roofs often use waterproof membranes instead of overlapping tiles or sheets.
Common membrane types include:
bituminous membranes;
PVC membranes;
EPDM membranes;
liquid-applied systems.
Proper joint treatment and drainage are essential for waterproof performance.
Green Roofs
Green roofs include vegetation planted over a waterproof roof assembly.
A typical green roof may include:
vegetation;
growing medium;
filter layer;
drainage layer;
root barrier;
waterproof membrane.
Benefits include:
improved insulation;
reduced stormwater runoff;
biodiversity support;
urban heat reduction.
However, additional structural load and waterproofing requirements must be considered.
Roof Insulation
Roof insulation reduces heat transfer between indoor and outdoor environments.
Common insulation materials include:
mineral wool;
rigid foam boards;
glass wool;
cellulose;
natural fiber products.
In hot climates, reflective roofing and insulation can significantly reduce cooling demand.
Roof Ventilation
Ventilation helps remove heat and moisture from roof spaces.
Methods include:
ridge vents;
eave vents;
roof ventilators;
ventilated attic spaces.
Proper ventilation can reduce condensation and improve thermal comfort.
Rainwater Drainage
Roof drainage is essential for protecting the building.
Pitched roofs usually drain toward gutters and downpipes.
Flat roofs may use:
internal drains;
scuppers;
rainwater outlets;
downpipes.
All roof surfaces should be properly sloped toward drainage points.
Blocked drainage outlets may cause leakage, ponding, and structural problems.
Roof Flashing
Flashing is used to prevent water penetration at vulnerable roof junctions.
Flashing is commonly provided around:
chimneys;
parapets;
skylights;
roof valleys;
wall-roof junctions;
service penetrations.
Poor flashing is one of the most common causes of roof leakage.
Roof Construction Sequence
A typical pitched roof construction sequence may include:
installation of supporting walls or columns;
erection of trusses or rafters;
fixing of bracing;
installation of purlins or battens;
provision of underlay or insulation;
installation of roof covering;
fixing of ridge pieces;
installation of gutters and flashing;
final inspection.
Accurate alignment and temporary bracing are essential during erection.
Common Roof Defects
Common roof problems include:
leakage;
corrosion;
cracked or displaced tiles;
damaged waterproof membranes;
blocked gutters;
inadequate slope;
poor flashing;
truss deformation;
termite damage in timber roofs;
loose metal sheets.
Regular inspection helps identify defects before they become serious.
Sustainability in Roofing
Roof design offers several opportunities for sustainable construction.
These include:
solar photovoltaic installation;
green roofs;
rainwater harvesting;
recyclable metal roofing;
locally available tiles;
high-performance insulation;
cool roofs.
Durable roof materials also reduce replacement frequency and environmental impact.
Maintenance
Roofs should be inspected periodically.
Maintenance activities may include:
cleaning gutters;
repairing flashing;
replacing damaged tiles;
repainting metal roofs;
checking truss connections;
inspecting waterproofing;
removing vegetation from unwanted areas.
Preventive maintenance extends roof service life and reduces repair costs.
Conclusion
Roofs, trusses, and roof coverings are essential components of building construction. The roof protects the building from environmental exposure, while the structural system safely transfers loads to walls, columns, and foundations.
Roof trusses provide an efficient way to span large spaces using triangular arrangements of tension and compression members. Types such as king post, queen post, Fink, Pratt, Howe, Warren, and bowstring trusses are selected according to span, loading, material, and architectural requirements.
Roof coverings, including clay tiles, metal sheets, slate, membranes, shingles, and green roof systems, provide the final weather-resistant layer. Their performance depends on proper slope, fixing, drainage, flashing, insulation, and maintenance.
A successful roof combines structural stability, weather protection, thermal performance, drainage, durability, and architectural expression. When these factors are integrated carefully, the roof becomes not only a protective element but also a major contributor to the safety, comfort, energy efficiency, and visual identity of a building.
Daily writing prompt
How do you write what people actually want to read?
Steel Frame Construction, Connections, and Truss Systems
Introduction
Steel is one of the most important structural materials used in modern construction. It is widely applied in industrial buildings, warehouses, commercial complexes, bridges, airports, stadiums, high-rise buildings, factories, railway structures, and long-span roofs. Steel combines high strength, relatively low self-weight, uniform material properties, speed of erection, and the ability to form slender structural members. These characteristics make steel particularly suitable for buildings that require large column-free spaces, rapid construction, or future modification.
A steel structural system generally consists of columns, beams, bracing members, connections, and trusses. Unlike reinforced concrete, which is commonly cast on site, structural steel components are usually fabricated in workshops and assembled at the construction site. The performance of a steel structure depends not only on the strength of individual members but also on the quality of their connections and the overall stability of the frame.
Steel Frame Construction
Steel frame construction uses a skeleton of steel members to support building loads. The main structural elements include vertical columns, horizontal beams, floor systems, roof members, and bracing.
Steel framing may be used independently or in combination with concrete, masonry, timber, or composite systems.
Main Components of a Steel Frame
Columns
Steel columns are vertical members that transfer loads from beams and floors to the foundations.
Common column sections include:
I-sections;
H-sections;
box sections;
circular hollow sections;
rectangular hollow sections;
built-up sections.
Columns may carry axial compression, bending, or a combination of both.
The design of a column must consider not only material strength but also buckling, which can occur when a slender compression member becomes unstable.
Beams
Steel beams are horizontal structural members that support floors, roofs, walls, and other loads.
Common beam sections include:
I-beams;
universal beams;
channels;
box beams;
plate girders.
Beams primarily resist bending and shear.
The upper and lower flanges of an I-section resist much of the bending stress, while the web mainly resists shear.
For long spans or heavy loads, deeper beams or built-up plate girders may be used.
Steel Sections
Structural steel is manufactured in standardized shapes.
Common sections include:
I-Section
I-sections are efficient in bending because a large portion of the material is concentrated in the flanges away from the neutral axis.
H-Section
H-sections are similar to I-sections but often have wider flanges and are commonly used for columns.
Channel Section
Channel sections have a C-shaped profile and are used for secondary framing, purlins, lintels, and built-up members.
Angle Section
Angle sections may be equal or unequal and are widely used in trusses, bracing, towers, and connection details.
Hollow Structural Sections
Circular, square, and rectangular hollow sections provide good torsional resistance and attractive architectural appearance.
They are commonly used in exposed structures, space frames, and columns.
Advantages of Steel Frame Construction
Steel structures offer several benefits:
high strength-to-weight ratio;
rapid construction;
prefabrication;
dimensional accuracy;
long-span capability;
easy modification and extension;
recyclability;
reduced foundation loads due to lower self-weight.
Steel members can be manufactured under controlled workshop conditions, improving quality and reducing site work.
Limitations of Steel Construction
Steel also has some disadvantages.
It can corrode when exposed to moisture and aggressive environments.
Steel loses strength at high temperatures and therefore requires fire protection in many buildings.
Other concerns include:
local and overall buckling;
fatigue under repeated loading;
thermal expansion;
cost fluctuations;
need for skilled fabrication and erection.
Protective coatings, fireproofing, and proper detailing help address these issues.
Structural Steel Connections
Connections are among the most critical parts of steel construction. They transfer forces from one structural member to another and determine how the frame behaves under load.
Connections may transfer:
axial force;
shear;
bending moment;
torsion;
combinations of these forces.
The two most common connection methods are bolting and welding.
Bolted Connections
Bolted connections use steel bolts to join members through plates, angles, or directly connected components.
They are widely used because they are relatively quick to assemble and inspect.
Bearing-Type Bolted Connections
In bearing connections, forces are transferred through contact between bolts and the sides of bolt holes.
These connections are common in general structural construction.
High-Strength Friction-Grip Connections
In friction-type connections, high-strength bolts clamp the connected plates together.
Loads are transferred primarily through friction between the contacting surfaces.
These connections are useful where slip must be minimized.
Advantages of Bolted Connections
Bolted connections offer:
rapid site erection;
easy inspection;
easier dismantling;
less dependence on site welding conditions;
good suitability for prefabrication.
However, accurate drilling and proper bolt tightening are essential.
Welded Connections
Welding joins steel components by melting and fusing the metal, often with additional filler material.
Common weld types include:
fillet welds;
groove or butt welds;
plug welds;
slot welds.
Fillet welds are widely used because they are simple and suitable for many connection configurations.
Advantages of Welding
Welded connections can provide:
continuous joints;
clean appearance;
high rigidity;
no bolt holes;
efficient connection of complex shapes.
However, welding requires skilled labor and careful quality control.
Site welding can also be affected by weather, access, and positioning.
Beam-to-Column Connections
Beam-to-column joints may be classified as:
Simple or Shear Connections
These mainly transfer shear and allow some rotational movement.
Examples include:
fin plate connections;
web angle connections;
seated connections.
Moment Connections
Moment connections transfer bending moments in addition to shear.
They provide greater rotational restraint and contribute to lateral stability.
Typical moment connections may use:
extended end plates;
welded flanges;
bolted flange plates.
Column Bases
Steel columns are usually connected to concrete foundations through base plates and anchor bolts.
The base plate spreads the concentrated column load over a larger area of concrete.
A typical column base includes:
steel column;
base plate;
anchor bolts;
grout;
concrete pedestal or footing.
The base may be designed as pinned or fixed depending on structural requirements.
Splices
Steel members may require splices when the required length exceeds available manufacturing or transportation limits.
Column splices and beam splices can be bolted or welded.
Splices must transfer forces safely between connected member segments.
Bracing Systems
Steel frames may require bracing to resist lateral loads from wind and earthquakes.
Common bracing types include:
X-bracing;
K-bracing;
V-bracing;
inverted V-bracing;
eccentric bracing.
Bracing members generally work primarily in axial tension or compression.
They help reduce lateral sway and improve frame stability.
Truss Systems
A truss is a structural system composed of interconnected straight members arranged mainly in triangular patterns.
The triangular geometry makes trusses highly efficient because members primarily carry axial tension or compression rather than large bending moments.
Trusses are widely used for:
roofs;
bridges;
industrial sheds;
airport terminals;
railway stations;
exhibition halls;
stadiums.
Main Parts of a Truss
A typical truss includes:
Top Chord
The top chord forms the upper boundary of the truss and generally carries compression under gravity loads.
Bottom Chord
The bottom chord forms the lower boundary and commonly carries tension.
Web Members
Diagonal and vertical members connect the chords and transfer forces through the truss.
Panel Points
The intersections of truss members are called panel points or nodes.
Ideally, loads are applied at these joints to minimize bending in members.
Types of Trusses
King Post Truss
The king post truss is one of the simplest forms.
It includes a central vertical member and is suitable for relatively short spans.
Queen Post Truss
The queen post truss uses two vertical members and can span greater distances than the king post type.
Pratt Truss
In a Pratt truss, diagonal members generally slope toward the center of the span.
Under typical gravity loading, the diagonals mainly carry tension while verticals carry compression.
Howe Truss
The Howe truss is similar in arrangement to the Pratt truss but with diagonals sloping in the opposite direction.
Warren Truss
The Warren truss uses a series of triangles with fewer vertical members.
It provides an efficient and repetitive structural form.
Fink Truss
Fink trusses are widely used for roofs.
Their web configuration subdivides the span into smaller triangular units.
Bowstring Truss
A bowstring truss has a curved top chord and a straight or slightly curved bottom chord.
It is often used for large-span roofs and industrial buildings.
Truss Mechanics
Trusses work efficiently because loads are transferred mainly through axial forces.
Some members are in tension, while others are in compression.
The structural behavior depends on:
truss geometry;
span;
support conditions;
loading;
member sizes;
connection details.
Compression members must be checked for buckling, while tension members must be checked for yielding and connection strength.
Roof Truss Construction
Steel roof trusses are commonly fabricated in workshops and transported to site in complete or partial sections.
The construction process may include:
fabrication of members;
drilling or welding of connection plates;
trial assembly if required;
transportation;
lifting by crane;
temporary bracing;
final bolting or welding;
installation of purlins;
roof covering.
Accurate erection is essential to maintain geometry and alignment.
Purlins
Purlins are secondary horizontal members placed over roof trusses or rafters.
They support roofing sheets or other roof coverings.
Common purlin sections include:
channels;
Z-sections;
C-sections;
cold-formed sections.
Their spacing depends on roof loads and roofing material.
Gusset Plates
Gusset plates are flat steel plates used to connect multiple members at truss joints.
They are particularly common where several angles or tubular members meet.
The gusset plate transfers forces between members through bolts or welds.
Its thickness, shape, and connection detailing must be designed carefully.
Steel Fabrication
Fabrication is the process of converting steel sections and plates into ready-to-erect structural components.
Typical fabrication activities include:
cutting;
drilling;
punching;
bending;
welding;
surface preparation;
painting;
marking.
Computer-controlled fabrication has improved accuracy and efficiency.
Steel Erection
Steel erection involves assembling fabricated components on site.
The typical sequence includes:
setting base plates;
erecting columns;
installing beams;
temporary bracing;
tightening bolts;
installing permanent bracing;
checking alignment.
Cranes and lifting equipment are commonly required.
Temporary stability during erection is particularly important.
Corrosion Protection
Steel corrodes when exposed to moisture and oxygen.
Protection methods include:
painting;
galvanizing;
protective coatings;
weather-resistant steel;
proper drainage detailing.
Surfaces should be prepared properly before coatings are applied.
Fire Protection
At high temperatures, structural steel loses stiffness and strength.
Fire protection methods include:
intumescent coatings;
spray-applied fire-resistant materials;
concrete encasement;
gypsum board systems;
fire-resistant ceilings.
The required fire protection depends on the building type and fire resistance requirements.
Composite Steel Construction
Steel may be combined with concrete to improve structural efficiency.
A common example is a steel beam supporting a concrete slab connected through shear studs.
The steel beam and concrete slab then act together as a composite member.
Advantages include:
increased stiffness;
improved load capacity;
efficient use of materials;
reduced beam depth in some cases.
Quality Control
Steel construction requires careful quality assurance.
Important checks include:
material certification;
dimensional accuracy;
weld inspection;
bolt tightening;
alignment;
coating thickness;
connection detailing.
Non-destructive testing may be used to inspect critical welds.
Sustainability of Steel Structures
Steel can contribute to sustainable construction because it is highly recyclable and can often be reused.
Other sustainability advantages include:
prefabrication;
reduced site waste;
lighter structural systems;
potential for disassembly;
long service life.
Environmental impacts can be further reduced through optimized member sizes, recycled steel content, efficient fabrication, and low-carbon production methods.
Conclusion
Steel frame construction is an efficient and versatile structural system suitable for buildings ranging from small industrial sheds to high-rise towers and long-span public structures. Steel columns, beams, bracing systems, and trusses create strong yet relatively lightweight frames that can be fabricated accurately and erected rapidly.
Connections are fundamental to structural performance. Bolted and welded joints transfer forces between members and must be carefully designed and executed. Beam-column joints, base plates, splices, and gusset connections determine how effectively the structural system behaves under both gravity and lateral loads.
Truss systems use triangular arrangements to achieve long spans with efficient use of material. Through members working mainly in tension and compression, trusses can create large column-free spaces for roofs, bridges, and industrial buildings.
When fabrication, connections, corrosion protection, fire safety, and erection are properly managed, steel construction provides strength, flexibility, speed, durability, and adaptability. It remains one of the most important structural systems in contemporary architecture and civil engineering.
Daily writing prompt
How do you write what people actually want to read?
Timber Frame Construction, Joinery, and Wood Products
Introduction
Timber is one of the oldest and most versatile building materials used in architecture and construction. It is valued for its relatively high strength-to-weight ratio, ease of fabrication, natural appearance, renewability, and adaptability. Timber can be used in structural frames, roofs, floors, walls, doors, windows, furniture, interior finishes, and engineered building products.
Modern timber construction combines traditional carpentry skills with advanced engineered wood technologies. Three important areas of study are timber frame construction, wood joinery, and wood products. Timber frame construction deals with structural systems made from timber members. Joinery refers to the techniques used to connect timber components. Wood products include both natural timber and engineered materials such as plywood, laminated veneer lumber, glulam, oriented strand board, and cross-laminated timber.
Proper design and detailing are essential because timber is affected by moisture, biological attack, fire, dimensional movement, and connection behavior. When correctly selected, treated, and maintained, timber can provide durable, efficient, and sustainable construction.
Timber as a Construction Material
Timber is obtained from trees and processed into structural and non-structural building components. Its properties vary according to species, moisture content, grain direction, density, defects, and processing.
Timber performs particularly well in tension and compression parallel to the grain. Its relatively low self-weight makes it useful for buildings where lighter structures are desirable.
Important advantages of timber include:
low weight compared with concrete and masonry;
good strength-to-weight ratio;
ease of cutting and shaping;
rapid construction;
attractive natural appearance;
renewable origin when responsibly sourced;
good thermal insulation;
potential for prefabrication.
However, timber also requires protection from moisture, termites, fungi, and uncontrolled fire exposure.
Timber Frame Construction
Timber frame construction is a structural system in which timber members form the primary load-bearing framework of a building. Loads are transferred from roofs and floors through beams, joists, studs, and columns to the foundation.
Timber framing is widely used in residential buildings, low-rise structures, modular construction, and increasingly in larger engineered timber buildings.
Traditional Timber Framing
Traditional heavy timber framing uses large posts and beams connected through carefully crafted joints.
The main elements include:
posts;
beams;
braces;
rafters;
purlins;
tie beams.
This system can create large open internal spaces because loads are concentrated at structural frames rather than continuous walls.
Traditional timber frames are often visible inside the building, making the structural system part of the architectural expression.
Platform Frame Construction
Platform framing is one of the most common forms of light timber construction.
Each floor is constructed as a separate platform. Wall frames are erected on one floor platform, followed by the next floor system.
Typical components include:
timber studs;
top and bottom plates;
floor joists;
sheathing;
roof rafters or trusses.
Platform framing is popular because it is simple, repetitive, economical, and suitable for prefabrication.
Balloon Frame Construction
In balloon framing, wall studs extend continuously through more than one floor.
Floor joists are supported by the continuous wall studs.
This method was historically important but is less common today because long timber members are required and fire can spread through uninterrupted wall cavities unless appropriate fire stopping is provided.
Post-and-Beam Construction
Post-and-beam construction uses vertical posts and horizontal beams to carry loads.
The spaces between structural members may be filled with lightweight wall systems, glass, masonry, or insulated panels.
This system allows:
large openings;
flexible floor plans;
exposed structural timber;
wide spans.
Modern post-and-beam buildings may use solid timber or engineered wood members such as glulam.
Wall Framing
Timber wall frames commonly consist of vertical studs connected by horizontal plates.
Important wall components include:
Sole or bottom plate: Horizontal member fixed near floor level.
Top plate: Horizontal member at the top of the wall.
Studs: Vertical elements supporting wall loads.
Nogging or blocking: Horizontal pieces between studs that improve stability.
Headers: Structural members placed above doors and windows.
Sheathing: Sheet material attached to framing to improve rigidity and provide a base for finishes.
Insulation is often installed between studs.
Timber Floor Construction
Timber floors generally consist of joists supported by beams, walls, or other structural elements.
Floorboards or structural sheet materials are placed over the joists.
The floor system must resist:
dead loads;
live loads;
vibration;
deflection.
Joist spacing and dimensions depend on the span, loading, timber grade, and floor material.
Engineered joists such as I-joists may be used for greater spans and improved material efficiency.
Timber Roof Construction
Timber is widely used in roof structures.
Common roof elements include:
rafters;
purlins;
ridge boards;
ceiling joists;
trusses.
Timber roof trusses can span relatively large distances while using material efficiently.
Prefabricated roof trusses are commonly manufactured under controlled conditions and transported to the construction site for installation.
Timber Joinery
Joinery is the method of connecting pieces of timber to form structural or decorative assemblies.
Traditional joinery often relies on shaped timber connections, while modern systems use metal fasteners, plates, bolts, screws, and specialized connectors.
Good joints should provide:
adequate strength;
accurate alignment;
durability;
efficient load transfer;
ease of construction.
Butt Joint
The butt joint is the simplest timber joint.
The end of one piece is placed directly against another and fixed using nails, screws, glue, or metal connectors.
It is easy to construct but generally requires mechanical reinforcement because it provides limited interlocking strength.
Lap Joint
In a lap joint, portions of two timber members overlap.
Common forms include:
half-lap joint;
cross-lap joint;
end-lap joint.
Lap joints provide greater contact area than simple butt joints and can be used in framing, furniture, and carpentry.
Mortise and Tenon Joint
The mortise and tenon joint is one of the most important traditional timber connections.
A projecting tenon at the end of one member fits into a corresponding mortise cut into another member.
This joint is widely used in:
timber frames;
doors;
windows;
furniture.
It provides good alignment and structural performance when properly constructed.
Dovetail Joint
A dovetail joint consists of interlocking wedge-shaped projections.
It is particularly effective in resisting pulling forces.
Dovetail joints are commonly associated with high-quality cabinet and furniture construction but may also be used in traditional timber structures.
Tongue-and-Groove Joint
In a tongue-and-groove joint, one timber member has a projecting tongue that fits into a groove in the adjacent member.
It is commonly used for:
flooring;
wall paneling;
ceiling boards.
The joint creates a relatively continuous surface and helps maintain alignment.
Scarf Joint
A scarf joint connects two timber pieces end-to-end to create a longer member.
It is useful when available timber lengths are shorter than required.
Traditional scarf joints may use complex interlocking forms, while modern versions may use bolts, plates, or adhesives.
Mechanical Timber Connections
Modern timber construction frequently uses mechanical fasteners.
These include:
nails;
screws;
bolts;
dowels;
steel plates;
joist hangers;
brackets;
toothed connectors.
Connections are often critical points in timber structures because loads are concentrated around fasteners.
Correct spacing and edge distances are important to reduce splitting.
Wood Products
Modern construction uses a wide variety of processed and engineered wood products.
These products improve dimensional stability, allow larger structural sizes, and make more efficient use of timber resources.
Plywood
Plywood is manufactured by bonding thin layers or veneers of wood together.
The grain direction of adjacent layers is usually arranged approximately at right angles.
This cross-lamination improves:
strength;
dimensional stability;
resistance to splitting.
Plywood is widely used for:
wall and roof sheathing;
flooring;
furniture;
formwork;
interior panels.
Particleboard
Particleboard is manufactured by compressing wood particles with resin.
It is commonly used in furniture and interior applications.
Advantages include:
relatively low cost;
smooth surface;
efficient use of wood residues.
However, it generally has lower moisture resistance and structural capacity than plywood unless specially manufactured.
Medium-Density Fibreboard
MDF is produced from fine wood fibers bonded under heat and pressure.
It has a smooth and uniform surface, making it suitable for:
furniture;
cabinetry;
decorative panels;
interior finishes.
MDF can be easily machined, but standard products should be protected from excessive moisture.
Oriented Strand Board
OSB is manufactured from wood strands arranged in layers and bonded with adhesives.
The strands are oriented to improve structural performance.
OSB is widely used for:
wall sheathing;
roof decking;
floors;
prefabricated panels.
It can provide an economical alternative to structural plywood in many applications.
Glued Laminated Timber
Glulam consists of multiple timber laminations bonded together with structural adhesives.
It can be manufactured into straight or curved structural members.
Glulam offers:
high strength;
long spans;
architectural flexibility;
controlled quality.
It is used for beams, columns, arches, roof structures, and large public buildings.
Laminated Veneer Lumber
LVL is an engineered structural product manufactured from thin wood veneers bonded together.
Unlike plywood, most veneers in LVL are oriented in the same general direction.
This provides high strength along the length of the member.
LVL is commonly used for:
beams;
headers;
columns;
long structural members.
Cross-Laminated Timber
Cross-Laminated Timber (CLT) consists of large layers of timber boards bonded at right angles to one another.
CLT panels can be used as:
walls;
floors;
roofs.
The panels are prefabricated and can be rapidly assembled on site.
CLT has contributed to the development of multi-storey mass-timber buildings.
Moisture and Timber
Moisture is one of the most important factors affecting timber performance.
Timber expands and contracts as its moisture content changes.
Excessive moisture can result in:
fungal decay;
mold;
dimensional movement;
reduction in durability.
Good timber construction should therefore provide:
protection from ground moisture;
adequate roof overhangs;
proper flashing;
ventilation;
drainage;
separation from wet surfaces.
Timber Preservation
Preservative treatment may be necessary where timber is exposed to termites, fungi, or weather.
Methods include:
pressure treatment;
surface coatings;
chemical preservatives;
natural protective finishes.
The required treatment depends on timber species and exposure conditions.
Fire Performance
Although timber is combustible, large timber members can perform predictably in fire.
When exposed to fire, the outer surface develops a char layer. This can slow further burning and protect the inner core for a period of time.
Fire safety may be improved through:
increased member dimensions;
fire-resistant linings;
sprinklers;
protected connections;
compartmentation.
Engineered timber buildings require careful fire engineering and compliance with applicable regulations.
Sustainability of Timber
Timber can be an environmentally beneficial construction material when obtained from responsibly managed forests.
Trees absorb carbon dioxide during growth, and this carbon may remain stored in wood products during their service life.
Other sustainability advantages include:
renewable resource potential;
relatively low processing energy;
prefabrication opportunities;
reduced construction waste;
lightweight transportation.
However, sustainability depends on responsible forestry, durability, efficient material use, and end-of-life management.
Maintenance
Timber buildings require periodic inspection.
Important areas to check include:
roof leaks;
external coatings;
joints;
termite activity;
moisture accumulation;
exposed end grain;
connections.
Early repair of moisture problems can greatly extend the life of timber structures.
Conclusion
Timber frame construction combines structural efficiency, rapid construction, architectural flexibility, and the natural qualities of wood. Systems such as platform framing, post-and-beam construction, timber floors, and roof trusses demonstrate the versatility of timber in buildings.
Joinery is fundamental to timber construction because connections determine how effectively structural members transfer loads. Traditional joints such as mortise-and-tenon, lap, dovetail, tongue-and-groove, and scarf joints remain important, while modern mechanical connectors make construction faster and enable more complex structures.
Engineered products such as plywood, OSB, glulam, LVL, and CLT have expanded the capabilities of timber far beyond traditional small-scale construction. They allow longer spans, larger panels, increased prefabrication, and even multi-storey timber buildings.
When timber is carefully designed, properly detailed against moisture, protected from biological deterioration, and sourced responsibly, it can provide durable, efficient, attractive, and increasingly sustainable solutions for contemporary construction.
Daily writing prompt
How do you write what people actually want to read?
Scaffolding, formwork, shoring, and underpinning are essential temporary and supporting systems used in building construction. Although these systems may not remain visible after a project is completed, they play a major role in ensuring safety, stability, accuracy, and construction efficiency. They allow workers to operate at height, support freshly placed concrete, stabilize weakened structures, and strengthen existing foundations.
Each system serves a different purpose. Scaffolding provides temporary working platforms and access. Formwork provides molds into which concrete is placed and shaped. Shoring gives temporary support to structures, excavations, or formwork systems. Underpinning strengthens or deepens an existing foundation when its original capacity becomes inadequate. Proper design, erection, inspection, and dismantling of these systems are critical because failure can lead to severe structural damage, accidents, or loss of life.
Scaffolding
Scaffolding is a temporary framework constructed around or within a building to provide safe access and working platforms for workers, tools, and materials. It is widely used in construction, maintenance, repair, painting, plastering, façade work, and demolition.
A good scaffolding system should be stable, sufficiently strong, properly braced, and capable of carrying expected loads.
Main Components of Scaffolding
Typical scaffolding includes:
Standards – vertical members that transfer loads to the ground;
Ledgers – horizontal members connecting the standards;
Putlogs or transoms – members supporting working platforms;
Braces – diagonal members that provide stability;
Base plates – plates placed beneath standards to distribute loads;
Sole boards – timber boards placed below base plates on weak ground;
Working platforms – surfaces on which workers stand;
Guardrails – protective rails provided along platform edges;
Toe boards – boards preventing tools and materials from falling;
Access ladders or stair units – safe means of movement between levels.
Types of Scaffolding
Single Scaffolding
Single scaffolding is commonly used for brick masonry. A single row of standards is erected parallel to the wall, and putlogs are supported partly by the wall.
It is simple and economical for relatively light work.
Double Scaffolding
Double scaffolding is often used for stone masonry because stone walls cannot easily accommodate putlog holes.
Two rows of standards are provided, making the system stronger and more independent of the wall.
Cantilever Scaffolding
Cantilever scaffolding is supported on needles or projecting members rather than directly from the ground.
It is useful where ground access is restricted, such as above busy streets, weak ground, or lower-level construction.
Suspended Scaffolding
Suspended scaffolding consists of platforms hung from the roof or upper levels by ropes or cables.
It is commonly used for:
façade cleaning;
painting;
maintenance;
window work.
Steel or Tubular Scaffolding
Steel scaffolding uses tubes connected by couplers or proprietary fittings.
Advantages include:
high strength;
durability;
reuse;
adaptability;
improved fire resistance compared with timber.
Mobile Scaffolding
Mobile scaffolding is mounted on wheels or castors and can be moved from one location to another.
It is useful for indoor maintenance and finishing work, but wheels must be locked before use.
Safety Requirements for Scaffolding
Scaffolding should be erected on firm and level ground. Connections should be secure, braces should be correctly installed, and the scaffold should be tied to the building where necessary.
Important safety measures include:
guardrails at open edges;
safe access ladders;
adequate platform width;
regular inspection;
no overloading;
secure base supports;
protection from falling materials;
proper anchorage;
competent supervision.
Scaffolding should not be altered without authorization.
Formwork
Formwork is a temporary or permanent mold used to shape fresh concrete until it gains enough strength to support itself.
Concrete is placed into the formwork and allowed to harden. The formwork must maintain the required shape, dimensions, line, level, and surface finish.
Formwork is used for:
columns;
beams;
slabs;
walls;
foundations;
stairs;
arches;
shells.
Requirements of Good Formwork
Good formwork should be:
strong enough to carry fresh concrete loads;
rigid enough to prevent excessive deformation;
watertight to prevent cement slurry leakage;
easy to erect and dismantle;
dimensionally accurate;
reusable where possible;
economical;
safe for workers.
It should also produce the desired concrete surface finish.
Loads on Formwork
Formwork may be subjected to several types of loads:
self-weight;
weight of wet concrete;
reinforcement weight;
workers and equipment;
construction impact;
vibration;
lateral pressure from fresh concrete;
wind loads.
Columns and walls create significant lateral pressure because fresh concrete behaves partly like a fluid before setting.
Types of Formwork
Timber Formwork
Timber is one of the traditional formwork materials.
Advantages include:
easy cutting and shaping;
local availability;
suitability for complex forms.
Its disadvantages include limited reuse and possible warping if not properly maintained.
Plywood Formwork
Plywood sheets are often fixed to timber or steel frames.
They provide relatively smooth concrete surfaces and can be reused several times if handled properly.
Steel Formwork
Steel formwork is strong, durable, accurate, and highly reusable.
It is commonly used in repetitive construction projects and large-scale developments.
Aluminum Formwork
Aluminum formwork is lightweight and suitable for repetitive floor layouts.
It is often used in mass housing and high-rise construction.
Plastic Formwork
Plastic formwork is lightweight, reusable, and resistant to moisture.
It is useful in repetitive modular construction.
Formwork for Structural Elements
Column Formwork
Column formwork encloses reinforcement and fresh concrete on all sides.
It must resist lateral pressure and remain vertical.
Beam Formwork
Beam formwork usually consists of side panels and a soffit panel supported by props.
Proper alignment is necessary to achieve correct beam dimensions.
Slab Formwork
Slab formwork consists of horizontal sheathing supported by beams, joists, and props.
It must carry the considerable weight of wet concrete over a large area.
Removal of Formwork
Formwork should be removed only after concrete has gained sufficient strength.
Premature removal may cause:
cracking;
deflection;
collapse;
permanent deformation.
The required striking time depends on concrete strength, span, structural element, curing conditions, temperature, and design requirements.
Shoring
Shoring is the temporary support provided to a building, excavation, wall, trench, or structural member to prevent collapse or excessive movement.
It is commonly required during:
renovation;
demolition;
foundation work;
excavation;
structural repair;
alteration of load-bearing walls.
Types of Shoring
Raking Shoring
Raking shores are inclined members placed against a wall to provide lateral support.
They are often used when a wall has become unstable.
The system commonly consists of:
wall plates;
rakers;
cleats;
sole plates;
braces.
Flying Shoring
Flying shoring provides horizontal support between two parallel walls when the structure between them has been removed or is under reconstruction.
Unlike raking shores, flying shores do not require direct ground support in the space between the walls.
Dead Shoring
Dead shoring provides vertical support to walls, beams, floors, or roofs while lower portions are being altered.
It is commonly used when:
creating large wall openings;
replacing foundations;
repairing lower walls.
Shoring in Excavation
Deep excavations may require shoring to prevent soil collapse.
Common systems include:
sheet piles;
soldier piles and lagging;
diaphragm walls;
secant pile walls;
braced excavation systems.
Excavation shoring is especially important in urban areas where nearby roads, utilities, and buildings may be affected by ground movement.
Underpinning
Underpinning is the process of strengthening, stabilizing, or deepening an existing foundation.
It becomes necessary when the original foundation can no longer safely support the building or when site conditions change.
Typical reasons for underpinning include:
foundation settlement;
soil weakening;
adjacent excavation;
increased structural loads;
addition of new floors;
change in building use;
nearby construction;
structural deterioration.
Mass Concrete Underpinning
Mass concrete underpinning is a traditional method.
Small sections below the existing foundation are excavated sequentially and filled with concrete.
Work is carried out in stages so that the entire foundation is not unsupported at the same time.
It is suitable for relatively shallow foundation strengthening.
Beam and Base Underpinning
In this method, reinforced concrete beams are constructed to transfer existing wall loads to new foundation bases.
It is useful when loads need to be redistributed over a wider area.
Mini-Piled Underpinning
Mini-piles or micro-piles transfer loads to deeper and stronger soil layers.
This method is suitable when:
surface soil is weak;
access is restricted;
high loads are involved;
settlement control is important.
Mini-piles may extend several meters below the existing foundation.
Pile and Beam Underpinning
Piles are installed on both sides of a wall, and a reinforced concrete or steel beam transfers the building load to the piles.
This system is suitable for heavy structures and deeper load transfer.
Difference Between Shoring and Underpinning
Although shoring and underpinning are related, they are not the same.
Shoring is primarily a temporary support system used to stabilize structures or excavations.
Underpinning is generally a more permanent method used to strengthen or deepen foundations.
For example, a damaged wall may first require temporary shoring for safety before permanent underpinning is carried out below its foundation.
Construction Planning
Temporary works require careful planning.
Before scaffolding, formwork, shoring, or underpinning begins, the project team should assess:
structural loads;
soil conditions;
nearby buildings;
underground services;
groundwater;
construction sequence;
equipment access;
worker safety.
Temporary works should be designed with the same level of care as permanent structures.
Inspection and Quality Control
Regular inspection is essential.
Scaffolds should be checked after erection, modification, severe weather, or extended periods of non-use.
Formwork should be checked before concrete placement for:
line and level;
dimensions;
support stability;
joint tightness;
reinforcement clearance.
Shoring and underpinning systems should be monitored for movement, settlement, cracking, and instability.
Common Failures
Failures may occur because of:
insufficient bracing;
weak ground support;
overloading;
poor connections;
premature formwork removal;
inadequate shoring;
incorrect construction sequence;
foundation movement;
lack of inspection.
Many temporary-work failures are preventable through proper design, supervision, and adherence to safe construction procedures.
Sustainability Considerations
Reusable formwork and scaffolding can significantly reduce material waste.
Steel and aluminum systems can be reused many times, while modular systems can improve construction efficiency.
Careful planning also reduces unnecessary timber consumption and material disposal.
In repair projects, underpinning and structural stabilization can extend the life of existing buildings, reducing the need for demolition and reconstruction.
Conclusion
Scaffolding, formwork, shoring, and underpinning are vital components of safe and efficient construction. Scaffolding provides access and working platforms, while formwork shapes and supports fresh concrete. Shoring temporarily stabilizes walls, structures, or excavations, and underpinning permanently strengthens foundations where existing support is inadequate.
The success of these systems depends on careful design, proper material selection, accurate erection, regular inspection, correct sequencing, and skilled workmanship. Although many of them are temporary, their importance is fundamental because they protect workers and structures during some of the most vulnerable stages of construction.
Well-planned temporary works contribute not only to safety but also to quality, speed, economy, and durability. For this reason, scaffolding, formwork, shoring, and underpinning should be treated as essential engineering systems rather than secondary construction activities.
Daily writing prompt
How do you write what people actually want to read?
Arches, Vaults, Domes: Construction Details and Mechanics
Introduction
Arches, vaults, and domes are among the most important structural forms in the history of architecture and construction. They have been used for centuries in temples, churches, mosques, palaces, bridges, gateways, public buildings, and monumental structures. Their significance lies not only in their visual character but also in the way they transfer loads through compression. Unlike simple beams, which resist bending, arches, vaults, and domes are shaped so that much of the structural force flows along curved paths toward their supports.
These forms were especially important before the widespread use of steel and reinforced concrete because materials such as brick, stone, and masonry perform very well in compression but relatively poorly in tension. By arranging masonry in curved geometries, builders were able to span large openings and create impressive interior spaces. Understanding their construction details and mechanics is essential for architecture, structural engineering, heritage conservation, and building technology.
Arches
An arch is a curved structural element designed to span an opening and transfer loads to supports on either side. It may be constructed from stone, brick, concrete, steel, timber, or other materials, although traditional arches are most commonly associated with masonry.
The basic principle of an arch is compression. Loads applied to the arch are transferred along its curve toward the supports. These supports must resist both vertical forces and horizontal thrust.
Main Parts of an Arch
Several technical terms are used to describe the components of an arch.
Voussoirs
Voussoirs are wedge-shaped masonry units that form the curved body of the arch.
Keystone
The keystone is the central topmost voussoir. It locks the arch units together and is traditionally the last piece placed during construction.
Intrados
The intrados is the inner curved surface or underside of the arch.
Extrados
The extrados is the outer curved surface of the arch.
Springing Point
The springing point is the location where the curve of the arch begins from its support.
Crown
The crown is the highest point of the arch.
Abutment
The abutment is the supporting masonry or structural element at either end of the arch.
Span
The span is the horizontal distance between the supports.
Rise
The rise is the vertical distance between the springing line and the crown.
Types of Arches
Arches can take many forms depending on structural requirements, architectural style, and construction tradition.
Semicircular Arch
A semicircular or Roman arch forms half of a circle. It is strong, simple, and widely used in classical and Romanesque architecture.
Segmental Arch
A segmental arch is formed from a segment of a circle smaller than a semicircle. It has a lower rise and is often used above doors and windows.
Pointed Arch
The pointed arch is created from two intersecting curves. It became especially important in Gothic architecture.
Because of its geometry, it can reduce horizontal thrust and accommodate different spans and heights.
Flat Arch
A flat arch appears almost horizontal but is formed from wedge-shaped units.
It is commonly used over small openings.
Horseshoe Arch
A horseshoe arch curves beyond a semicircle and narrows toward the base. It is associated with Islamic and Moorish architectural traditions.
Three-Centered and Four-Centered Arches
These arches are formed from multiple circular arcs. They are used when wider openings with relatively low rises are required.
Mechanics of Arches
The structural behavior of an arch depends on the way compressive forces travel through it.
When a load is applied, forces move along what is called the line of thrust. For a stable masonry arch, the line of thrust should remain within the thickness of the arch.
If the thrust line moves outside the masonry section, tensile stresses and cracking may occur.
Arches generate both:
vertical reactions at their supports;
horizontal thrust acting outward.
The horizontal thrust must be resisted by strong abutments, buttresses, adjacent walls, or tie rods.
The geometry of the arch strongly affects its thrust. A flatter arch generally produces greater horizontal thrust than a steeper one.
Construction of Arches
Traditional masonry arches require temporary support during construction.
A timber framework called centering or falsework is placed beneath the arch. Voussoirs are then laid from both sides toward the center.
The keystone is placed last.
Once the mortar has gained adequate strength, the centering is carefully removed.
Good construction requires:
accurate centering;
uniform joint thickness;
properly shaped voussoirs;
strong abutments;
gradual removal of support;
correct mortar selection.
Vaults
A vault is essentially an arch extended through space. It creates a roof or ceiling over a larger area.
Vaults are generally constructed in masonry, brick, concrete, or reinforced concrete.
They transfer loads primarily through compression and thrust toward supporting walls, columns, or piers.
Barrel Vault
A barrel vault is formed by extending a semicircular arch along a longitudinal axis.
It resembles a half-cylinder.
The barrel vault transfers loads continuously to the supporting walls along both sides. These walls must be strong enough to resist both vertical loads and outward thrust.
Buttresses may be required where the thrust is significant.
Groin Vault
A groin vault is formed by the intersection of two barrel vaults at right angles.
The intersection creates curved lines called groins.
One major advantage of the groin vault is that loads can be concentrated at four corner supports rather than along continuous side walls.
This allows greater flexibility in wall openings and interior planning.
Ribbed Vault
A ribbed vault uses structural ribs along the intersections of vault surfaces.
The ribs act as a framework carrying loads toward columns or piers, while lighter infill panels complete the vault surface.
Ribbed vaults became important in Gothic architecture because they allowed taller spaces, thinner walls, and larger windows.
Fan Vault
A fan vault consists of curved ribs spreading outward in fan-like patterns.
It is primarily associated with late Gothic architecture and is notable for both structural ingenuity and decorative complexity.
Mechanics of Vaults
Vaults act similarly to arches, but their behavior occurs in three dimensions.
Loads are transferred through compression along the curved surfaces toward supports.
The principal forces include:
compression within the vault;
vertical reactions;
horizontal thrust;
localized forces at ribs, piers, or walls.
Vault stability depends on geometry, thickness, support conditions, material strength, and load distribution.
Cracking may develop when supports move or when thrust is inadequately restrained.
Construction of Vaults
Traditional vault construction generally requires extensive centering or temporary formwork.
Masonry units are laid in carefully arranged courses over the supporting framework.
The construction process must ensure:
proper curvature;
stable support;
accurate jointing;
uniform load distribution;
gradual removal of formwork.
Modern reinforced concrete vaults may be cast using curved formwork, while thin-shell concrete techniques can create much lighter structures.
Domes
A dome is a curved roof structure that generally has a circular, polygonal, or elliptical plan.
A dome may be understood as an arch rotated around a vertical axis.
Domes have been used in monumental architecture for thousands of years and are associated with structures such as temples, churches, mosques, government buildings, and assembly halls.
Main Parts of a Dome
Important parts include:
Crown
The crown is the highest point of the dome.
Base or Springing
The springing is the level where the dome begins.
Haunch
The haunch is the middle zone between the crown and the base.
Drum
A drum is a cylindrical or polygonal wall supporting the dome.
Pendentives
Pendentives are curved triangular surfaces used to support a circular dome over a square room.
Squinches
Squinches are structural elements placed across the corners of a square space to support a polygonal or circular dome above.
Oculus
An oculus is a circular opening, often provided at the top of a dome for daylight or ventilation.
Types of Domes
Hemispherical Dome
The hemispherical dome forms half of a sphere.
It produces strong compressive action but may also create substantial outward thrust near its base.
Segmental Dome
A segmental dome has a lower rise than a hemisphere and produces a flatter profile.
Onion Dome
An onion dome has a bulbous form and is commonly associated with Islamic, Russian, and regional architectural traditions.
Ribbed Dome
A ribbed dome includes structural ribs that transfer loads along defined paths.
Geodesic Dome
A geodesic dome is composed of interconnected triangular elements.
It is lightweight, efficient, and capable of spanning large areas with relatively little material.
Mechanics of Domes
Domes transfer loads in two principal ways:
meridional forces, acting from the crown toward the base;
hoop forces, acting horizontally around the dome.
Near the crown, hoop forces are often compressive. Toward the lower portion of many domes, hoop tension may develop.
Traditional masonry has limited tensile capacity, so additional measures may be required to resist these forces.
These may include:
thick supporting walls;
buttresses;
tension rings;
iron or steel chains;
reinforced concrete ring beams.
The shape of a dome strongly affects its structural efficiency.
Construction of Masonry Domes
Traditional domes are built using bricks or stones arranged in progressively inward-projecting courses.
Temporary centering may be required, although some traditional methods allow construction with limited formwork.
Accurate geometry is essential.
At the base, the dome must be carefully connected to its supporting structure.
Where a dome is placed over a square room, pendentives or squinches are commonly used to make the geometric transition.
Reinforced Concrete Domes
Reinforced concrete made dome construction more flexible because concrete can be shaped into thin shells while steel reinforcement helps resist tensile stresses.
Modern concrete domes can cover large spans with relatively small thicknesses.
Their advantages include:
structural efficiency;
reduced self-weight;
large column-free spaces;
architectural freedom.
However, careful analysis is needed to address buckling, cracking, reinforcement layout, and support conditions.
Common Structural Problems
Arches, vaults, and domes can experience structural problems if thrust is not properly controlled.
Typical problems include:
cracking at the crown or haunch;
spreading of supports;
settlement of foundations;
separation between structural elements;
deterioration of mortar joints;
water penetration;
local crushing.
In historic masonry structures, even small support movements can significantly change the thrust line and lead to visible cracking.
Materials Used
Traditional materials include:
stone;
fired brick;
lime mortar;
gypsum mortar.
Modern construction may use:
reinforced concrete;
structural steel;
timber;
precast concrete;
composite materials.
Material choice affects thickness, span, construction method, and structural performance.
Architectural and Environmental Advantages
Curved structural forms can offer both architectural and environmental benefits.
High vaulted and domed spaces can improve air circulation by allowing warm air to rise above occupied areas.
Domes and vaults can also create dramatic interior spaces while reducing the need for intermediate columns.
When carefully designed, curved shells can span large areas using less material than conventional heavy beam systems.
Heritage Conservation
Many historic arches, vaults, and domes are part of culturally important buildings.
Conservation requires an understanding of their original materials and structural mechanics.
Repairs should avoid introducing excessively rigid materials that may be incompatible with historic masonry.
Traditional lime mortars are often more suitable than strong cement mortars because they allow movement and moisture transfer.
Monitoring cracks and foundation settlement is also important.
Conclusion
Arches, vaults, and domes demonstrate how geometry can be used to achieve structural strength, stability, and architectural beauty. The arch transfers loads primarily through compression toward its supports. A vault extends this principle across a larger area, while a dome develops three-dimensional shell action through meridional and hoop forces.
Their successful performance depends on proper geometry, stable supports, adequate resistance to horizontal thrust, suitable materials, and accurate construction. Temporary centering, careful masonry bonding, strong abutments, and appropriate support systems are essential in traditional construction.
Modern materials such as reinforced concrete and steel have expanded the possibilities of these forms, allowing thinner shells and much larger spans. Nevertheless, the fundamental mechanics remain closely related to principles developed centuries ago. Arches, vaults, and domes therefore remain important examples of the close relationship between architectural form, construction technique, and structural behavior.
Daily writing prompt
How do you write what people actually want to read?
Fenestration refers to the arrangement, design, proportion, and detailing of openings provided in a building envelope. These openings include windows, doors, ventilators, skylights, and louvers. Fenestration is an important component of architectural and building design because it directly affects daylight, ventilation, thermal comfort, energy efficiency, security, accessibility, privacy, and the visual character of a building.
Well-designed fenestration improves the relationship between indoor and outdoor spaces. It allows natural light and fresh air to enter, provides views, supports movement, and contributes to the aesthetic composition of façades. Poorly designed openings, however, can increase heat gain, glare, air leakage, water penetration, noise, and energy consumption. Therefore, fenestration design must consider climate, orientation, room function, materials, user needs, and construction details.
Importance of Fenestration
Fenestration serves several functional and environmental purposes. Windows provide daylight, ventilation, and visual connection with the outside. Doors provide access, security, privacy, and movement between spaces. Ventilators help remove hot or stale air, while louvers control airflow, sunlight, rain, and privacy.
Good fenestration design can reduce dependence on artificial lighting and mechanical cooling. In warm climates, appropriately shaded openings can reduce solar heat gain. In cooler climates, controlled solar exposure can contribute to passive heating. Fenestration therefore plays an important role in climate-responsive architecture.
Windows
A window is an opening in a wall, roof, or other building element designed mainly to admit light and air and provide external views. Windows are usually fitted with glass, shutters, frames, or a combination of these elements.
The main components of a window include:
frame;
shutter or sash;
glass pane;
sill;
jamb;
head;
glazing bead;
hardware;
weather seal.
The frame is fixed to the wall opening and supports the shutters or glazing. The sill forms the lower horizontal surface and is usually sloped to drain rainwater away from the wall.
Types of Windows
Casement Window
A casement window has shutters hinged at the sides. It can open inward or outward.
Its advantages include:
good ventilation;
easy operation;
effective sealing;
simple construction.
Casement windows are commonly used in residential, institutional, and office buildings.
Sliding Window
Sliding windows have shutters that move horizontally or vertically along tracks.
They are suitable where outward or inward opening space is limited. They are frequently used in modern buildings because of their compact operation and clean appearance.
Fixed Window
A fixed window does not open. It is used mainly to provide daylight and views.
Because it has no movable parts, it can offer good airtightness and low maintenance. However, it does not provide natural ventilation.
Pivoted Window
Pivoted windows rotate around a central horizontal or vertical pivot.
They are useful for ventilation and can create distinctive architectural effects.
Awning and Hopper Windows
An awning window is hinged at the top and opens outward, while a hopper window is hinged at the bottom and usually opens inward.
Awning windows can provide ventilation even during light rain, while hopper windows are often used in basements and utility spaces.
Bay and Corner Windows
Bay windows project outward from the external wall, creating additional interior space and wider views.
Corner windows are provided at the intersection of two walls and can increase daylight penetration and panoramic visibility.
Window Materials
Window frames may be made from:
timber;
steel;
aluminum;
uPVC;
composite materials.
Timber provides a warm appearance and good thermal performance but requires maintenance. Aluminum is strong, durable, and suitable for large glazed areas but may need thermal breaks. uPVC offers good thermal insulation and relatively low maintenance.
Window Glazing
Glazing influences energy performance, daylight, acoustics, and safety.
Common glazing types include:
single glazing;
double glazing;
triple glazing;
laminated glass;
toughened glass;
tinted glass;
low-emissivity glass.
Double and triple glazing improve thermal and acoustic performance by creating insulating air or gas layers between glass panes.
Doors
Doors provide access between rooms, buildings, and external areas. They also contribute to privacy, security, fire safety, acoustics, and architectural character.
A typical door consists of:
frame;
shutter or leaf;
threshold;
head;
jambs;
hinges;
locks and handles;
weather seals.
Doors must be dimensioned according to occupancy, accessibility requirements, furniture movement, and emergency evacuation needs.
Types of Doors
Panelled Door
Panelled doors consist of a frame with timber, plywood, glass, or other panels.
They are durable and widely used in residential buildings.
Flush Door
Flush doors have smooth surfaces on both sides. They may have solid or hollow cores.
They are economical, simple, and commonly used for internal doors.
Glazed Door
Glazed doors include substantial areas of glass and are used where visibility and daylight are desirable.
They are common in offices, commercial buildings, balconies, and entrance areas.
Sliding Door
Sliding doors move along horizontal tracks and save floor space because they do not require a swing area.
They are commonly used in balconies, patios, wardrobes, and large openings.
Folding Door
Folding doors consist of multiple panels connected by hinges. They can open large areas and are useful for halls, partitions, cafés, and flexible spaces.
Revolving Door
Revolving doors rotate around a central axis. They are often used at entrances to hotels, commercial complexes, and large public buildings.
They reduce uncontrolled air exchange between indoor and outdoor environments.
Fire Doors
Fire doors are specially designed to resist fire and smoke for a specified duration. They are essential in staircases, fire exits, service areas, and compartment walls.
Fire doors must be correctly installed and should not be blocked or modified.
Door Materials
Doors may be constructed from timber, steel, aluminum, glass, uPVC, fiberglass, or composites.
Steel doors provide high security and fire resistance. Aluminum and glass doors are popular in commercial buildings. Timber remains widely used because of its appearance and workability.
Ventilators
Ventilators are relatively small openings generally placed at higher levels in walls. Their primary function is to remove hot, humid, polluted, or stale air and support natural ventilation.
Because warm air rises, high-level ventilators can be effective in releasing accumulated heat.
Ventilators are commonly provided in:
toilets;
kitchens;
staircases;
industrial buildings;
storage spaces;
utility areas.
They may be fixed, operable, glazed, screened, or fitted with louvers.
Role of Ventilators in Natural Ventilation
Ventilators can support the stack effect, in which warm indoor air rises and escapes through high-level openings while cooler air enters through lower openings.
This arrangement can improve natural airflow without mechanical equipment.
For effective ventilation, the location, size, orientation, and height of openings should be carefully considered.
Louvers
Louvers are arrangements of inclined horizontal or vertical slats that permit air movement while controlling sunlight, rain, visibility, and sometimes noise.
They may be fixed or adjustable.
Louvers are used in:
façades;
windows;
doors;
ventilation openings;
mechanical plant rooms;
parking structures;
industrial buildings.
Types of Louvers
Fixed Louvers
Fixed louvers have blades set at a permanent angle.
They are simple, durable, and require little maintenance.
Adjustable Louvers
Adjustable louvers allow the blade angle to be changed depending on sunlight, privacy, or airflow requirements.
They offer greater environmental control.
Horizontal Louvers
Horizontal louvers are effective for controlling high-angle sunlight, particularly on façades that receive strong overhead solar radiation.
Vertical Louvers
Vertical louvers are useful where low-angle sunlight needs to be controlled, particularly on east- and west-facing façades.
Weather Louvers
Weather louvers are designed to admit air while limiting the entry of wind-driven rain.
They are commonly used in service areas and mechanical ventilation openings.
Fenestration and Climate Responsive Design
Fenestration should respond to local climate and orientation.
In hot climates, large unshaded glass areas can significantly increase cooling loads. Shading devices, recessed windows, balconies, overhangs, fins, and louvers can reduce direct solar heat gain.
In moderate climates, operable windows can encourage cross-ventilation. Openings on opposite or adjacent walls can create better airflow through occupied spaces.
In cold climates, highly insulated glazing and airtight frames can reduce heat loss.
Daylighting
Windows are an important source of natural illumination.
Good daylighting can reduce artificial lighting demand and improve visual comfort. However, excessive daylight may cause glare.
The design of windows should therefore consider:
window size;
sill and head height;
orientation;
glazing type;
shading;
room depth;
internal surface reflectance.
Higher window heads generally allow daylight to penetrate deeper into rooms.
Waterproofing and Weather Protection
Fenestration openings are vulnerable to water leakage.
Proper detailing is required at:
window sills;
heads;
jambs;
thresholds;
frame-wall joints.
Sills should be sloped outward and may include drip grooves. Sealants and flashing should be provided where required to prevent rainwater from entering wall assemblies.
Thermal and Acoustic Performance
Fenestration can be a major route for heat transfer and external noise.
Thermal performance can be improved through:
insulated glazing;
low-emissivity coatings;
thermal-break frames;
airtight seals;
external shading.
Acoustic performance can be improved using laminated glass, double glazing, appropriate air gaps, and well-sealed frames.
Accessibility and Safety
Doors must allow safe and convenient movement for all users, including persons with disabilities.
Accessible doors should provide adequate clear width, manageable opening forces, suitable handles, and level or low thresholds.
Glazed doors and large windows should use safety glass where required. Visible markings may also be necessary to prevent accidental collision with transparent surfaces.
Maintenance of Fenestration
Windows, doors, ventilators, and louvers require regular maintenance to ensure long-term performance.
Maintenance may include:
cleaning tracks and drainage holes;
checking hinges and locks;
replacing worn seals;
repairing damaged glazing;
repainting or protecting timber;
cleaning louvers;
checking sealant joints.
Regular maintenance prevents water leakage, air infiltration, corrosion, and operational failure.
Conclusion
Fenestration is a fundamental component of building design that combines functional, environmental, technical, and aesthetic considerations. Windows provide daylight, ventilation, and views, while doors enable movement, security, and privacy. Ventilators support air circulation and heat removal, and louvers help regulate sunlight, airflow, rain, and visual privacy.
Successful fenestration design requires careful attention to orientation, climate, materials, glazing, shading, weather protection, accessibility, and construction detailing. When these elements are properly integrated, fenestration can improve indoor comfort, reduce energy consumption, enhance building appearance, and contribute to a healthier and more sustainable built environment.
Daily writing prompt
How do you write what people actually want to read?
Masonry is one of the oldest and most widely used construction systems in the world. It involves assembling individual units such as bricks, concrete blocks, or stones and bonding them together with mortar to form walls, partitions, foundations, arches, retaining structures, and other building components. Masonry is valued for its durability, strength, fire resistance, thermal mass, acoustic performance, and architectural character.
Three important aspects of masonry construction are brickwork bonds, mortars, and stone masonry. Brick bonds determine how bricks are arranged to achieve strength and stability. Mortar binds the masonry units together, distributes loads, seals joints, and accommodates minor irregularities. Stone masonry uses natural stone units arranged in different patterns to produce strong, durable, and often visually impressive structures. Understanding these systems is essential for architects, engineers, builders, and students of construction technology.
Brick Masonry
Brick masonry is formed by laying bricks in horizontal courses and joining them with mortar. Bricks may be made from burnt clay, fly ash, concrete, calcium silicate, or other materials. Good brick masonry depends on proper bonding, accurate alignment, uniform joints, suitable mortar, and adequate curing.
A well-constructed brick wall should have:
proper line and level;
uniform mortar joints;
overlapping vertical joints;
good bond between bricks;
appropriate wall thickness;
adequate curing and workmanship.
The arrangement of bricks in a wall is known as a brick bond.
Purpose of Brick Bonds
Brick bonds are used to connect individual bricks into a unified wall mass. If vertical joints continue through several courses, the wall becomes weak and may crack or separate easily. Bonding breaks these continuous joints and distributes loads more effectively.
A good brick bond should provide:
structural strength;
lateral stability;
uniform load transfer;
proper interlocking of bricks;
attractive appearance;
economy in construction.
Different bonds are used depending on wall thickness, structural requirement, appearance, and construction tradition.
Stretcher Bond
In stretcher bond, all bricks are laid with their longer face visible on the wall surface. Each brick overlaps the joint below it by approximately half a brick length.
This bond is commonly used for:
half-brick-thick walls;
partition walls;
cavity wall leaves;
boundary walls;
non-load-bearing walls.
Stretcher bond is simple, economical, and easy to construct. However, it is not suitable by itself for thick load-bearing walls because it provides limited transverse bonding.
Header Bond
In header bond, bricks are laid with their shorter face visible on the wall surface. Each course consists primarily of headers.
This bond is suitable for:
one-brick-thick walls;
curved brickwork;
foundations;
thick masonry where transverse bonding is needed.
Header bond provides better connection across the wall thickness than stretcher bond.
English Bond
English bond is one of the strongest and most widely used brick bonds. It consists of alternate courses of headers and stretchers.
In one course, all bricks are laid as headers, while in the next course they are laid as stretchers. Proper closers are used near corners to maintain bonding.
Advantages of English bond include:
high structural strength;
excellent load distribution;
good bonding across wall thickness;
suitability for load-bearing walls.
Because of its strength and simplicity, it is commonly used in traditional and heavy masonry construction.
Flemish Bond
In Flemish bond, each course contains alternating headers and stretchers. The header in one course is generally centered over the stretcher below.
Flemish bond provides a more decorative and uniform appearance than English bond.
It may be classified as:
Double Flemish Bond: Flemish pattern is visible on both faces.
Single Flemish Bond: Flemish bond appears on the exposed face, while English bond is used internally.
Flemish bond is visually attractive but usually requires greater skill and careful workmanship.
Rat-Trap Bond
Rat-trap bond is an energy- and material-efficient brickwork system in which bricks are laid on edge to create cavities within the wall.
Advantages include:
reduced number of bricks;
lower mortar consumption;
improved thermal insulation;
lighter wall construction;
potential reduction in construction cost.
The cavities reduce heat transfer and may improve indoor comfort in suitable climates. However, good workmanship and detailing are essential.
Mortar in Masonry
Mortar is a workable mixture used to join masonry units together. It generally consists of a binder, fine aggregate, and water.
The binder may be cement, lime, or a combination of both. Sand is the most common fine aggregate.
The main functions of mortar are to:
bind masonry units;
fill joints and surface irregularities;
distribute loads uniformly;
provide weather resistance;
improve airtightness;
accommodate small movements;
improve appearance.
Mortar should be workable enough for laying but sufficiently strong and durable after hardening.
Types of Mortar
Cement Mortar
Cement mortar is made from cement, sand, and water.
It provides:
relatively high strength;
good durability;
rapid setting;
resistance to moisture.
It is commonly used in foundations, external walls, load-bearing masonry, and damp locations.
However, very strong cement mortar may sometimes be too rigid for weak masonry units.
Lime Mortar
Lime mortar consists mainly of lime, sand, and water.
Its advantages include:
excellent workability;
good water retention;
flexibility;
ability to accommodate minor movement;
suitability for historic masonry.
Lime mortar develops strength more slowly than cement mortar but is often preferred in conservation and restoration work because it is compatible with traditional masonry.
Cement-Lime Mortar
Cement-lime mortar combines the strength of cement with the workability and flexibility of lime.
It is widely used in general masonry construction because it provides a balance between:
strength;
adhesion;
workability;
durability.
Mud Mortar
Mud mortar is made using locally available soil and water, sometimes with additives such as straw or natural fibers.
It has traditionally been used in rural and low-cost construction.
Advantages include:
very low embodied energy;
local availability;
low cost;
environmental compatibility.
Its main limitations are low water resistance and lower durability unless adequately protected.
Properties of Good Mortar
A good masonry mortar should possess several important qualities.
It should have:
good workability;
adequate strength;
strong adhesion;
sufficient water retention;
suitable setting time;
durability;
resistance to weathering;
limited shrinkage.
The strength of mortar should be compatible with the masonry units. Excessively strong mortar can sometimes lead to cracking of softer bricks or stones.
Mortar Joints
Mortar joints influence both performance and appearance.
Common joint finishes include:
flush joint;
recessed joint;
struck joint;
weathered joint;
keyed joint;
concave joint.
External walls often require joint profiles that encourage water runoff and improve weather resistance.
Stone Masonry
Stone masonry is the construction of walls and other structural elements using natural stones bonded with mortar or, in some cases, carefully fitted without mortar.
Stone masonry has been used for centuries in temples, forts, bridges, retaining walls, monuments, and residential buildings.
Advantages of stone masonry include:
high compressive strength;
durability;
resistance to weathering;
fire resistance;
attractive natural appearance;
long service life.
Its disadvantages may include high self-weight, labor-intensive construction, transportation cost, and the need for skilled workmanship.
Types of Stone Masonry
Stone masonry is generally classified into two major categories:
Rubble masonry
Ashlar masonry
Rubble Masonry
Rubble masonry uses stones that are roughly dressed or undressed.
Random Rubble Masonry
In random rubble masonry, stones of irregular shapes and sizes are used. Larger stones are carefully placed, while smaller stones fill the gaps.
It is commonly used for:
foundations;
retaining walls;
boundary walls;
rural buildings.
Coursed Rubble Masonry
In coursed rubble masonry, stones are roughly dressed and arranged in approximately horizontal courses.
It provides a more organized and stronger appearance than random rubble masonry.
Ashlar Masonry
Ashlar masonry uses finely dressed stones with accurate dimensions and smooth faces.
The joints are thin and regular, giving the wall a refined appearance.
Types of ashlar masonry include:
fine ashlar;
rough-tooled ashlar;
rock-faced ashlar;
chamfered ashlar;
block-in-course masonry.
Ashlar masonry requires skilled labor and careful stone dressing and is generally more expensive than rubble masonry.
Construction Principles of Stone Masonry
Good stone masonry should follow certain principles.
Large and strong stones should be used at corners and important load-bearing locations. Stones should be laid on their natural beds whenever possible.
Vertical joints should not continue through several courses. Bond stones or through stones should be provided to connect the wall faces.
Small stone chips should not be excessively used as substitutes for proper bonding. Cavities should be filled carefully with mortar and spalls.
Brick Masonry vs Stone Masonry
Brick masonry is generally lighter, easier to handle, and faster to construct. Brick units are uniform in size, making alignment simpler.
Stone masonry is heavier and often stronger in compression. It provides greater durability and a natural architectural character, but construction is usually slower and more labor-intensive.
Brick masonry is common in residential and urban construction, whereas stone masonry is often used in retaining walls, foundations, heritage buildings, landscape structures, and areas where suitable stone is locally available.
Sustainability in Masonry
Masonry can contribute to sustainable construction when materials are selected responsibly.
Locally produced bricks and locally sourced stone can reduce transportation impacts. Reclaimed bricks and stones can be reused in new construction.
Lime-based mortars may offer lower embodied energy than cement-rich mortars and can be especially appropriate for heritage work.
Innovative systems such as fly-ash bricks, compressed earth blocks, and rat-trap bonds can also reduce material consumption and environmental impact.
Conclusion
Masonry remains an essential construction system because of its durability, versatility, strength, and visual character. Brickwork bonds such as stretcher, header, English, Flemish, and rat-trap bond determine how effectively bricks work together as a structural unit. Mortar plays an equally important role by bonding masonry units, filling joints, distributing loads, and protecting walls from weather.
Stone masonry, whether rubble or ashlar, provides strength, durability, and architectural richness. The choice between brick and stone masonry depends on structural needs, local materials, cost, appearance, workmanship, and environmental conditions.
Good masonry construction requires more than simply placing bricks or stones together. Proper bonding, suitable mortar, accurate alignment, correct joint treatment, careful curing, and skilled workmanship are essential. When these principles are followed, masonry systems can provide safe, durable, economical, and attractive buildings for generations.
Rate this:
Plinth Details, Damp Proof Course (DPC), and Waterproofing
Introduction
The durability and performance of a building depend not only on its superstructure but also on how effectively it is protected from ground moisture, rainwater, seepage, and capillary action. Three important elements in this context are the plinth, Damp Proof Course (DPC), and waterproofing systems. These components form a critical interface between the ground and the building and help prevent moisture-related deterioration.
Moisture can cause peeling paint, damp patches, mold growth, corrosion of reinforcement, deterioration of plaster, damage to flooring, and weakening of masonry. If moisture problems are ignored, they can affect indoor comfort, hygiene, and structural durability. Therefore, proper plinth design, installation of DPC, and suitable waterproofing are essential parts of building construction.
Plinth and Its Importance
The plinth is the portion of a building located between the surrounding ground level and the finished floor level of the ground floor. It raises the building above the natural ground surface and helps protect the interior from surface water, moisture, dirt, and minor flooding.
The height of the plinth varies according to site conditions, local climate, drainage pattern, building use, and applicable building regulations. In areas prone to waterlogging or heavy rainfall, a higher plinth may be required.
The main functions of a plinth are to:
raise the building above ground level;
protect the floor from surface water and dampness;
provide a stable transition between foundation and superstructure;
reduce the entry of insects and soil moisture;
improve the appearance of the building base;
provide protection against minor variations in ground level.
Plinth Construction Details
A typical plinth consists of the foundation wall or columns, plinth beam where required, filling material, compacted soil, floor base, and DPC.
Plinth Beam
A plinth beam is a reinforced concrete beam constructed at or near plinth level. It is especially useful in framed structures and in buildings constructed on weak or uneven soil.
The plinth beam connects columns and helps distribute loads more uniformly. It may also reduce the effects of differential settlement and provide lateral stability to walls.
Plinth beams can be particularly useful in seismic areas because they tie structural elements together and improve overall integrity.
Plinth Filling
The space inside the plinth is usually filled with selected soil, sand, granular material, or other approved filling material.
The filling should be placed in layers and compacted properly. Poor compaction may result in later settlement of the floor.
A common sequence may include:
selected soil or granular filling;
proper watering and compaction;
sand layer;
lean concrete base;
waterproofing or damp-resistant treatment where required;
floor finish.
Plinth Protection
Plinth protection refers to a paved or concrete strip provided around the external perimeter of a building.
Its purpose is to prevent rainwater from collecting near the foundation. The surface is generally sloped away from the building so that water drains toward surrounding open areas or drainage channels.
Proper plinth protection helps reduce:
soil erosion near the foundation;
seepage into basement or foundation walls;
dampness in lower walls;
water accumulation near the building.
Damp Proof Course
A Damp Proof Course, commonly called DPC, is a horizontal or vertical barrier placed within a wall or floor to prevent moisture from passing through the building fabric.
The most common location for horizontal DPC is at plinth level, above the surrounding ground level and below the ground-floor wall construction.
DPC works mainly by preventing rising damp, which occurs when moisture from the soil moves upward through porous construction materials by capillary action.
Causes of Dampness in Buildings
Dampness may result from several sources.
Rising Damp
Ground moisture rises through masonry pores due to capillary action.
Rain Penetration
Rainwater may enter through external walls, joints, cracks, windows, roofs, or poorly protected surfaces.
Roof Leakage
Defective roof waterproofing, damaged drainage outlets, and ponding can lead to leakage.
Plumbing Leakage
Leaking water pipes, drainage lines, or sanitary fittings can produce localized dampness.
Condensation
Moist indoor air can condense on cold surfaces, particularly in poorly ventilated rooms.
Lateral Seepage
Water may penetrate basement walls or retaining walls under lateral hydrostatic pressure.
Materials Used for DPC
Different materials may be used depending on building type and exposure conditions.
Bituminous Materials
Bitumen coatings, bituminous felt, and membranes are widely used because they provide effective moisture resistance.
Cement Concrete with Waterproofing Compound
Dense cement concrete containing approved waterproofing admixtures may be used as a DPC layer.
Mastic Asphalt
Mastic asphalt provides a continuous impermeable layer and is used in locations requiring strong protection against moisture.
Plastic and Polyethylene Membranes
Flexible polymer membranes can form effective damp barriers when properly installed.
Metal Sheets
Copper, lead, and aluminum sheets have historically been used as damp-proof layers, although they are less common in ordinary modern construction.
Requirements of an Effective DPC
A good DPC should be:
impermeable to moisture;
durable;
strong enough to resist construction loads;
continuous across the entire wall thickness;
resistant to cracking;
properly bonded with surrounding construction;
capable of accommodating minor building movement.
Any break or discontinuity in the DPC can create a path for moisture.
Waterproofing
Waterproofing is broader than damp-proofing. While DPC mainly controls moisture movement through walls and floors, waterproofing is intended to resist direct water penetration, sometimes even under pressure.
Waterproofing is commonly required in:
roofs and terraces;
toilets and bathrooms;
balconies;
basements;
water tanks;
swimming pools;
retaining walls;
podium slabs;
foundations;
sunken floors.
Types of Waterproofing Systems
Cementitious Waterproofing
Cementitious waterproofing is prepared using cement-based compounds and additives.
It is relatively easy to apply and is commonly used in bathrooms, water tanks, basements, and internal wet areas.
Liquid-Applied Membrane
Liquid waterproofing materials are applied by brush, roller, or spray. After curing, they form a continuous flexible membrane.
These systems are useful on roofs, balconies, and complex surfaces with many joints.
Bituminous Membrane
Bituminous membranes are widely used for roofs, basements, and foundations.
They may be torch-applied, self-adhesive, or cold-applied.
Polyurethane Waterproofing
Polyurethane coatings form flexible and seamless waterproof layers.
They are suitable for terraces, balconies, wet areas, and surfaces subject to minor movement.
Sheet Membranes
PVC, HDPE, EPDM, and other synthetic sheet membranes are used where reliable and continuous water protection is required.
They are commonly applied in basements, roofs, tunnels, and large waterproofing projects.
Waterproofing of Roofs and Terraces
Flat roofs are particularly vulnerable to leakage because water may remain on the surface if drainage is inadequate.
Good roof waterproofing requires:
proper slope toward outlets;
well-designed rainwater pipes;
sealing around parapets and penetrations;
treatment of joints;
continuous waterproof membranes;
protective screed or finish where required.
Water ponding should be avoided because prolonged water exposure increases the possibility of membrane failure.
Waterproofing of Bathrooms and Wet Areas
Bathrooms require special treatment because water frequently contacts floors and walls.
Waterproofing should generally extend across the floor and rise up adjacent walls. Corners, pipe penetrations, floor traps, and construction joints require particular attention.
Before fixing tiles, the waterproofing layer should be inspected and tested for leakage.
Basement Waterproofing
Basements are exposed to soil moisture and, in some cases, groundwater pressure.
Waterproofing may be provided externally or internally. External waterproofing is often more effective because it prevents water from entering the wall in the first place.
Basement systems may include:
waterproof membranes;
drainage boards;
protection layers;
water stops at joints;
perimeter drainage;
sump pumps where necessary.
Importance of Proper Drainage
Waterproofing cannot perform effectively if drainage is poor.
Surface water around a building should be directed away from foundations. Roof water should be collected through gutters, pipes, and drains. Site grading should prevent water accumulation near walls.
Good drainage reduces hydrostatic pressure and prolongs the service life of waterproofing systems.
Common Defects in DPC and Waterproofing
Several failures can occur due to poor workmanship or inadequate design.
Common problems include:
discontinuous DPC;
punctured membranes;
poorly sealed joints;
incorrect surface preparation;
insufficient roof slope;
cracks in substrate;
blocked drainage outlets;
inadequate curing;
poor detailing around pipes and corners.
Many waterproofing failures occur not because the material itself is unsuitable but because joints and transition points have been poorly executed.
Testing and Quality Control
Waterproofed areas should be tested before being covered by finishes.
A common method for bathrooms and terraces is the ponding test, in which water is retained on the treated surface for a specified period while the area below is checked for leakage.
Inspection should also verify:
membrane continuity;
correct overlaps;
corner treatment;
protection of waterproof layers;
drainage slope;
proper sealing at penetrations.
Maintenance
Waterproofing systems require periodic maintenance.
Roofs and terraces should be inspected for cracks, damaged finishes, blocked drains, and vegetation growth. Sealants around joints should be checked and replaced when necessary.
Early repair is much less expensive than allowing water penetration to damage structural and finishing components.
Conclusion
Plinth construction, Damp Proof Course, and waterproofing are essential for protecting a building from moisture and water-related deterioration. The plinth raises the building above ground level and reduces direct exposure to surface water. DPC prevents rising damp and moisture penetration through walls, while waterproofing protects roofs, basements, wet areas, foundations, and other vulnerable components from direct water entry.
Their effectiveness depends on correct material selection, proper detailing, workmanship, drainage, and maintenance. Particular attention should be given to joints, corners, pipe penetrations, wall-floor connections, and changes in construction materials because these locations are especially vulnerable to leakage.
When plinth details, DPC, drainage, and waterproofing are properly integrated into building design and construction, they improve durability, indoor comfort, hygiene, appearance, and long-term structural performance.v
The foundation is one of the most important parts of any building or civil engineering structure. It forms the lowest portion of the structure and transfers loads from columns, walls, beams, and slabs safely to the ground. A properly designed foundation ensures stability, prevents excessive settlement, and protects the structure from failure. The choice of foundation depends largely on the magnitude of structural loads, soil conditions, groundwater level, site characteristics, and the safe bearing capacity of the soil.
Foundations are broadly classified into shallow foundations and deep foundations. Shallow foundations are suitable when competent soil is available near the ground surface, whereas deep foundations are used when stronger soil or rock lies at a considerable depth. Understanding soil bearing capacity is therefore essential for selecting and designing an appropriate foundation system.
Purpose of Foundations
The primary function of a foundation is to distribute the structural load over a sufficient area of soil so that the pressure imposed on the ground remains within safe limits. A foundation must also prevent excessive or uneven settlement, resist horizontal and uplift forces, provide stability against sliding and overturning, and ensure that the structure remains serviceable throughout its life.
A well-designed foundation should satisfy both strength and serviceability requirements. Strength relates to the ability of soil and foundation materials to resist failure, while serviceability mainly concerns settlement, tilting, cracking, and deformation.
Shallow Foundations
A shallow foundation transfers structural loads to soil located relatively close to the ground surface. In general, a foundation is considered shallow when its depth is small compared with its width.
Shallow foundations are commonly used for low-rise and medium-rise buildings where soil near the surface has adequate bearing capacity.
Types of Shallow Foundations
1. Isolated Footing
An isolated footing supports a single column. It is one of the most common and economical foundation types used in framed buildings.
The footing may be square, rectangular, or circular depending on column shape, loading, and soil conditions. Its main purpose is to spread the concentrated column load over a larger soil area.
2. Combined Footing
A combined footing supports two or more columns. It is generally adopted when columns are closely spaced or when an exterior column is located near the property boundary.
Combined footings may be rectangular or trapezoidal. They are designed so that the resultant load passes approximately through the centroid of the footing area.
3. Strip or Continuous Footing
Strip foundations consist of continuous strips of concrete placed under load-bearing walls or closely spaced columns. They distribute wall loads along a continuous length.
They are widely used in residential buildings and masonry structures where loads are moderate and soil conditions are satisfactory.
4. Raft or Mat Foundation
A raft foundation is a large reinforced concrete slab supporting several columns and walls over most or all of the building area.
Raft foundations are useful where:
soil bearing capacity is low,
columns are closely spaced,
individual footings would cover a large portion of the site,
differential settlement must be minimized.
Raft foundations distribute loads over a wide area, thereby reducing soil pressure.
Deep Foundations
Deep foundations transfer loads to deeper soil layers or rock where sufficient bearing resistance is available. They are adopted when near-surface soil is weak, compressible, expansive, or unsuitable for carrying structural loads.
Deep foundations are commonly used for high-rise buildings, bridges, industrial structures, marine structures, and heavy infrastructure projects.
Types of Deep Foundations
1. Pile Foundations
Pile foundations consist of long, slender structural members driven, drilled, or cast into the ground.
Piles may be made of concrete, steel, timber, or composite materials.
According to load-transfer mechanism, piles may be classified as:
End-bearing piles: These transfer the structural load to a hard stratum or rock at their tip.
Friction piles: These transfer load through skin friction developed between the pile surface and surrounding soil.
Combined end-bearing and friction piles: These transfer loads through both mechanisms.
Piles may also be used to resist uplift, lateral forces, and soil movement.
2. Pier Foundations
Pier foundations consist of relatively large-diameter cylindrical columns constructed below ground level. They transfer heavy loads to stronger soil strata.
They are usually shorter and larger in diameter than conventional piles.
3. Caisson or Well Foundations
Caisson foundations are large hollow structures sunk into the ground or riverbed. They are commonly used for bridge piers, waterfront structures, and foundations constructed in deep water.
Well foundations are particularly common in bridge construction because they can resist significant vertical and lateral forces.
Soil Bearing Capacity
Soil bearing capacity refers to the ability of soil to support loads transmitted by a foundation without experiencing shear failure or excessive settlement.
It is usually expressed in units such as kN/m².
The bearing capacity of soil depends on several factors, including:
soil type,
soil density,
moisture content,
depth of foundation,
width and shape of footing,
groundwater level,
soil stratification,
loading conditions.
Ultimate Bearing Capacity
The ultimate bearing capacity is the maximum pressure that the soil can sustain before shear failure occurs.
If foundation pressure exceeds this value, the soil may fail suddenly or undergo excessive deformation.
For shallow foundations, bearing capacity is often estimated using classical bearing-capacity theories based on soil cohesion, friction angle, foundation dimensions, and unit weight.
Safe Bearing Capacity
The safe bearing capacity is obtained by applying a factor of safety to the ultimate bearing capacity.
For example, if the ultimate bearing capacity is 600 kN/m² and the factor of safety is 3:
Safe Bearing Capacity = 600 / 3 = 200 kN/m²
The factor of safety accounts for uncertainties in soil properties, loading conditions, construction quality, and analytical assumptions.
Allowable Bearing Pressure
Allowable bearing pressure considers both soil shear strength and permissible settlement. Even if soil is strong enough against shear failure, excessive settlement may still damage the structure.
Therefore, allowable bearing pressure is generally taken as the smaller value determined from:
shear failure considerations, and
settlement considerations.
Factors Affecting Soil Bearing Capacity
Soil Type
Dense sand, gravel, and hard rock generally have high bearing capacities. Loose sand, soft clay, filled ground, and organic soil normally have lower bearing capacities.
Foundation Depth
Increasing foundation depth may improve bearing capacity because of higher confining pressure and stronger underlying strata.
Foundation Width
Foundation width influences the stress distribution in soil. Larger foundations distribute loads over a wider area but may also influence deeper soil layers.
Groundwater Level
A high groundwater table may reduce effective soil stress and bearing capacity, particularly in granular soils.
Soil Moisture
Changes in moisture content can significantly influence clay soils. Some clays may swell when wet and shrink when dry, causing foundation movement.
Eccentric Loading
Loads acting away from the center of a footing can cause uneven pressure distribution and increase the risk of settlement or rotation.
Foundation Settlement
Settlement occurs when soil compresses under building loads. A small amount of uniform settlement may be acceptable, but differential settlement is more serious because different parts of a structure move by different amounts.
Differential settlement may cause:
cracks in walls,
distortion of doors and windows,
uneven floors,
structural damage,
tilting of columns.
Proper geotechnical investigation and foundation design are therefore essential.
Soil Investigation
Before selecting a foundation, a geotechnical investigation is usually carried out. It may include:
borehole drilling,
soil sampling,
Standard Penetration Test,
Cone Penetration Test,
plate load test,
laboratory testing,
groundwater observation.
The investigation helps determine soil stratification, shear strength, compressibility, density, groundwater conditions, and suitable foundation depth.
Choosing Between Shallow and Deep Foundations
Shallow foundations are generally preferred when competent soil occurs close to the surface and expected settlement is within acceptable limits. They are usually simpler and more economical.
Deep foundations become necessary when surface soils are weak, structural loads are very high, settlement needs strict control, or hard-bearing layers are available only at greater depths.
The final selection should consider technical performance, safety, constructability, environmental conditions, equipment availability, and cost.
Conclusion
Deep and shallow foundations are fundamental components of structural engineering because they provide a stable interface between buildings and the ground. Shallow foundations, including isolated, combined, strip, and raft footings, are suitable where adequate bearing soil is available near the surface. Deep foundations, such as piles, piers, and caissons, transfer loads to stronger strata located at greater depths.
Soil bearing capacity is a key parameter in foundation design. It determines how much load the ground can safely support without shear failure or excessive settlement. Accurate soil investigation, proper assessment of bearing capacity, and careful consideration of settlement are essential for selecting the correct foundation system.
Daily writing prompt
What’s the most spontaneous thing you’ve ever done?
The building sector is one of the largest consumers of energy and natural resources worldwide. Buildings require considerable amounts of energy for heating, cooling, lighting, ventilation, water supply, appliances, and other services. At the same time, construction activities consume materials such as cement, steel, glass, timber, and aggregates, all of which carry environmental impacts through extraction, processing, transportation, and disposal. As concerns about climate change, resource depletion, urbanization, and rising energy costs increase, sustainable building technologies have become an important part of modern architecture, engineering, and urban development.
Sustainable buildings are designed, constructed, operated, and eventually dismantled in ways that minimize environmental impacts while providing healthy, comfortable, and productive indoor spaces. Among the most advanced forms of sustainable development is the Zero-Energy Building, commonly known as a Zero-Energy Building (ZEB) or Net-Zero Energy Building (NZEB). Such buildings attempt to balance their annual energy consumption with energy generated from renewable sources.
Concept of Sustainable Building Technology
Sustainable building technology refers to the application of environmentally responsible materials, systems, construction techniques, and management practices throughout the life cycle of a building. The objective is not simply to reduce energy consumption but also to improve water efficiency, material utilization, indoor environmental quality, durability, resilience, and occupant comfort.
A sustainable building therefore considers the entire process from site selection and design to construction, operation, maintenance, renovation, and demolition. Life-cycle thinking is important because a building that saves operational energy but requires highly energy-intensive materials may still have a considerable environmental footprint.
Sustainable design attempts to achieve a balance between environmental performance, economic feasibility, and social well-being.
Passive Design Strategies
Passive design is one of the most effective approaches to reducing building energy demand. Passive techniques use the natural characteristics of climate, site, orientation, building form, and materials rather than depending entirely on mechanical systems.
Building orientation is particularly important. In warm climates, appropriate orientation can reduce unwanted solar heat gain, while properly located openings can improve daylight and natural ventilation. Shading devices such as overhangs, louvers, balconies, vegetation, and fins can protect building interiors from excessive solar radiation.
Natural ventilation can reduce the need for mechanical cooling when outdoor climatic conditions are suitable. Courtyards, atriums, wind towers, cross-ventilation, and stack ventilation can be incorporated into architectural design to improve air movement.
Thermal insulation also plays a major role. Well-insulated walls and roofs reduce heat transfer between indoor and outdoor environments, thereby decreasing cooling and heating requirements.
High-Performance Building Envelope
The building envelope includes the walls, roof, windows, doors, floors, and other components separating indoor spaces from the external environment. A high-performance envelope minimizes unwanted heat gain or heat loss.
Modern sustainable buildings may use high-performance glazing, insulated wall systems, reflective roofing materials, airtight construction, thermal-break systems, and advanced façade technologies.
Double- or triple-glazed windows can improve thermal performance while allowing natural light to enter. Low-emissivity coatings can further reduce heat transfer through glazing. In hot climates, reflective or cool roofs help decrease roof surface temperatures and reduce cooling loads.
Green roofs are another sustainable technology. Vegetation installed on roofs can provide thermal insulation, reduce stormwater runoff, improve biodiversity, and mitigate the urban heat island effect.
Energy-Efficient Lighting and Equipment
Lighting can account for a significant proportion of energy consumption, particularly in commercial and institutional buildings. The use of LED lighting substantially reduces electricity demand compared with conventional incandescent or fluorescent systems.
Lighting controls can provide additional savings. Occupancy sensors automatically switch lights off when spaces are vacant, while daylight sensors reduce artificial lighting when sufficient natural illumination is available.
Energy-efficient appliances, pumps, motors, elevators, and office equipment further reduce building electricity consumption. Proper equipment sizing is also important because oversized systems may operate inefficiently and increase initial costs.
Efficient HVAC Systems
Heating, ventilation, and air-conditioning systems are often the largest energy consumers in modern buildings. Sustainable buildings use high-efficiency HVAC technologies combined with intelligent controls.
Variable refrigerant flow systems, high-efficiency chillers, heat pumps, radiant cooling, energy recovery ventilators, and variable-speed drives are among the technologies that can improve performance.
Smart thermostats and building management systems can adjust operating conditions according to occupancy, indoor temperature, outdoor climate, and energy demand. Regular monitoring and commissioning help ensure that installed systems continue to operate at their designed efficiency.
Renewable Energy Technologies
Renewable energy systems are essential for achieving zero-energy performance. Solar photovoltaic systems are among the most commonly used technologies because they can be installed on rooftops, façades, parking structures, and other available surfaces.
Building-integrated photovoltaics take this concept further by integrating solar cells directly into construction elements such as façades, skylights, windows, and roofing materials.
Solar thermal collectors can provide hot water and support space-heating systems. Depending on location and climatic conditions, buildings may also use small wind turbines, biomass, geothermal systems, or ground-source heat pumps.
The selection of renewable energy technology should be based on local climate, available resources, building demand, cost, and maintenance requirements.
Water-Efficient Technologies
Sustainable buildings also seek to conserve water. Low-flow taps, dual-flush toilets, water-efficient fixtures, and sensor-based fittings help reduce potable water consumption.
Rainwater harvesting systems can collect roof runoff for irrigation, flushing, cleaning, and other non-potable purposes. Greywater from washbasins, showers, and certain other sources can be treated and reused within the building.
Landscape design should also support water conservation. Native and drought-resistant plants generally require less irrigation and maintenance than water-intensive landscaping.
Sustainable Building Materials
Material selection significantly influences the environmental performance of a building. Sustainable materials generally have lower embodied energy, reduced toxicity, longer service life, and greater potential for reuse or recycling.
Examples include recycled steel, fly-ash or slag-blended cement, recycled aggregates, engineered timber, bamboo, compressed earth blocks, and locally sourced materials.
Using local materials can reduce transportation-related emissions while supporting regional economies. Reclaimed materials from demolished buildings can also be reused, reducing waste sent to landfills.
Life-cycle assessment can help designers compare materials according to environmental impacts associated with extraction, manufacturing, transportation, use, and disposal.
Smart Building Technologies
Digital technologies are increasingly important in sustainable buildings. Sensors, smart meters, Internet of Things devices, automated controls, and building management systems allow real-time monitoring of energy, water, indoor air quality, temperature, humidity, lighting, and occupancy.
Building automation systems can adjust lighting and HVAC operation depending on actual demand rather than fixed schedules. Energy dashboards can also provide occupants and facility managers with information about consumption patterns.
Artificial intelligence and predictive controls are increasingly being used to optimize building operation by analyzing historical and real-time data.
Zero-Energy Buildings
A Zero-Energy Building is designed to achieve a balance between energy consumed and renewable energy produced over a defined period, usually one year.
The process begins with minimizing energy demand. Passive design, insulation, efficient glazing, daylighting, natural ventilation, efficient HVAC systems, and energy-saving equipment are used first. Renewable energy is then introduced to meet the remaining energy demand.
This approach is important because simply adding a large solar photovoltaic system to an inefficient building does not represent good zero-energy design. Energy efficiency should always precede renewable energy generation.
A simplified annual energy balance can be expressed as:
Net Energy = Annual Energy Consumption − Annual Renewable Energy Generation
When annual renewable energy generation equals annual energy consumption, the building can achieve net-zero energy performance under the adopted accounting method.
Types of Zero-Energy Approaches
Zero-energy performance can be interpreted in different ways. A site zero-energy building generates as much renewable energy on or near the site as it consumes annually.
A source zero-energy building considers the primary energy required to generate and deliver energy to the building.
A zero-energy cost building attempts to balance annual energy costs through energy savings and renewable energy production.
A zero-carbon building focuses on reducing or balancing carbon emissions associated with building energy use. Increasingly, attention is also being given to embodied carbon from construction materials.
These definitions demonstrate that zero-energy and zero-carbon concepts are closely related but are not always identical.
Benefits and Challenges
Sustainable and zero-energy buildings can provide several benefits, including lower operating costs, reduced greenhouse gas emissions, improved indoor environmental quality, increased resilience, and decreased dependence on conventional energy sources.
However, challenges remain. Advanced building systems may require higher initial investment, specialized technical knowledge, careful commissioning, and long-term maintenance. Renewable energy generation may also be constrained by building height, roof area, shading, climate, or site conditions.
Occupant behavior is another important factor. A technically efficient building may still consume excessive energy if users operate equipment inefficiently or override automated systems.
Therefore, successful zero-energy buildings require collaboration among architects, planners, engineers, contractors, facility managers, energy consultants, and building occupants.
Conclusion
Sustainable building technologies represent a fundamental transition from conventional resource-intensive construction toward buildings that use energy, water, materials, and land more responsibly. Passive design, high-performance envelopes, efficient HVAC systems, LED lighting, water conservation, sustainable materials, renewable energy, and smart building controls collectively contribute to improved environmental performance.
Zero-Energy Buildings take this concept further by aiming to balance annual energy demand with renewable energy generation. Their successful implementation depends first on reducing energy requirements and then meeting the remaining demand through clean energy sources.
As cities continue to grow and climate-related challenges become more significant, sustainable and zero-energy buildings will play an increasingly important role in reducing emissions, improving urban resilience, controlling long-term operating costs, and creating healthier built environments. They represent not merely a technological innovation but a broader approach to designing buildings that can meet present needs while conserving resources for future generations.
Daily writing prompt
How do you write what people actually want to read?
Foundations are among the most critical components of any building or civil engineering structure because they safely transfer the loads of the superstructure to the ground. The performance and stability of a building depend not only on the strength of columns, beams, walls, and slabs but also on the suitability of the foundation and the bearing capacity of the supporting soil. Foundations are generally classified into two broad categories: shallow foundations and deep foundations. The choice between them depends on structural loads, soil conditions, groundwater level, site constraints, settlement criteria, and economic considerations.
Introduction to Foundations
A foundation forms the lowest part of a structure and acts as an interface between the building and the soil. Its primary function is to distribute structural loads over a sufficiently large area so that the pressure exerted on the soil remains within safe limits. A properly designed foundation should prevent excessive settlement, differential settlement, sliding, overturning, and structural instability.
The major loads transferred to foundations include dead load, live load, wind load, earthquake forces, and sometimes machine or impact loads. The soil beneath the foundation must be capable of supporting these loads without experiencing shear failure or unacceptable deformation.
Depending on how deeply loads are transferred into the soil, foundations may be shallow or deep.
Shallow Foundations
Shallow foundations are generally used when strong and competent soil is available relatively close to the ground surface. In these foundations, the depth of the foundation is small compared with its width. They are common in residential, commercial, and low- to medium-rise buildings.
Shallow foundations are relatively economical because they require less excavation, simpler construction methods, and fewer specialized machines.
Isolated Footing
An isolated footing supports a single column. It is one of the most commonly used types of shallow foundations for framed structures.
The footing may be square, rectangular, circular, stepped, or sloped in shape. Its dimensions are determined according to the column load and the safe bearing capacity of the soil.
For example, if a column carries a load of 600 kN and the allowable soil pressure is 200 kN/m², the approximate required footing area can be estimated as:
Required area = Column load / Allowable bearing capacity
= 600 / 200 = 3 m²
Additional considerations such as footing self-weight, eccentricity, reinforcement, and settlement must also be incorporated in final design.
Combined Footing
A combined footing supports two or more columns on a common foundation slab. It is normally used when individual footings overlap or when a column is situated close to a property boundary.
Combined footings may be rectangular or trapezoidal. Their purpose is to distribute the loads from several columns uniformly over the underlying soil.
Strip or Wall Footing
A strip footing is a continuous foundation constructed beneath a load-bearing wall or a closely spaced row of columns. It spreads the wall load over a larger area and is widely used in masonry construction and low-rise buildings.
The width of the footing depends on wall load, soil bearing capacity, construction material, and structural requirements.
Raft or Mat Foundation
A raft foundation consists of a large reinforced concrete slab supporting several or all columns and walls of a building. It covers a substantial portion, or sometimes the entire area, of the building.
Raft foundations are particularly useful where soil has relatively low bearing capacity and isolated footings would occupy a large proportion of the site. They also help reduce differential settlement by distributing loads over a wide area.
Deep Foundations
Deep foundations are used when suitable load-bearing soil is located at considerable depth below the ground surface or when structural loads are too large for shallow foundations.
They transfer loads to deeper and stronger soil or rock through end bearing, skin friction, or a combination of both.
Deep foundations are commonly used for high-rise buildings, bridges, industrial structures, marine structures, transmission towers, and projects constructed on weak or compressible soils.
Pile Foundations
Pile foundations consist of long slender structural members driven, bored, or cast into the ground. They may be constructed from reinforced concrete, prestressed concrete, steel, timber, or composite materials.
Piles transfer loads through two principal mechanisms.
End-bearing piles transfer loads to a strong soil layer or rock located beneath weaker deposits. The base of the pile acts similarly to a column resting on a firm stratum.
Friction piles transfer loads through friction developed between the pile surface and the surrounding soil. These piles are useful where no strong bearing layer exists at a practical depth.
Pile foundations may also resist uplift and lateral forces, making them suitable for towers, offshore structures, and bridges.
Pier Foundations
Pier foundations consist of large-diameter cylindrical structural elements constructed by excavating or drilling into the ground and filling the excavation with reinforced concrete.
They are generally larger in diameter than piles and are suitable where firm soil or rock exists at moderate depths.
Caisson Foundations
Caissons are large hollow foundation units that are sunk into the ground or riverbed. They are particularly useful for bridge piers, docks, harbours, and waterfront structures.
Common types include open caissons, box caissons, and pneumatic caissons.
Soil Bearing Capacity
The term bearing capacity refers to the ability of soil to support structural loads without experiencing shear failure or excessive settlement.
It is one of the most important factors in foundation design.
When a foundation applies pressure to the soil, stresses are developed within the ground. If the applied pressure becomes excessive, the soil may fail through shear or undergo large settlements.
Several terms are commonly used in geotechnical engineering.
Ultimate Bearing Capacity
Ultimate bearing capacity is the maximum pressure that soil can support before shear failure occurs.
At this stage, the soil beneath the foundation becomes unstable and significant deformation may take place.
Safe Bearing Capacity
Safe bearing capacity is obtained by applying an appropriate factor of safety to the ultimate bearing capacity.
A factor of safety is used because soil properties vary and exact ground behaviour cannot always be predicted.
Allowable Bearing Pressure
Allowable bearing pressure considers not only shear strength but also settlement criteria.
In practical foundation design, settlement often governs the allowable pressure, particularly in clayey or compressible soils.
Factors Affecting Soil Bearing Capacity
The bearing capacity of soil depends on several factors.
The type of soil is important because dense sand, gravel, stiff clay, and rock generally have higher bearing capacity than loose sand, soft clay, organic soil, or uncontrolled fill.
The density and consistency of soil also influence its performance. Dense granular soils generally support greater loads than loose soils, while stiff clays usually perform better than soft clays.
The foundation depth affects bearing capacity because deeper foundations are confined by greater overburden pressure.
The size and shape of footing also influence the stress distribution in the ground.
Groundwater is another significant factor. A high groundwater table can reduce the effective strength of soil, particularly in granular deposits.
The load characteristics are equally important. Vertical, eccentric, inclined, dynamic, or cyclic loads affect the behaviour of foundations differently.
Soil Investigation for Foundation Design
Foundation design should ideally be based on a proper geotechnical investigation. Soil testing helps determine soil profile, groundwater level, strength, compressibility, and bearing capacity.
Common field and laboratory investigations include boreholes, trial pits, Standard Penetration Tests, Cone Penetration Tests, plate load tests, grain-size analysis, moisture-content testing, shear-strength testing, and consolidation testing.
A geotechnical report typically provides recommendations regarding suitable foundation type, allowable bearing pressure, expected settlement, groundwater conditions, and construction precautions.
Shallow versus Deep Foundations
The selection of foundation type requires technical and economic judgment.
Shallow foundations are usually preferred where good soil is available close to the surface and structural loads are moderate. They are easier and cheaper to construct.
Deep foundations are preferred where surface soils are weak, compressible, expansive, or susceptible to erosion, and where strong strata are available at greater depths. They are also necessary for structures subjected to large vertical or lateral loads.
Settlement considerations may sometimes require a deep foundation even if the soil’s calculated bearing capacity appears sufficient.
Settlement and Foundation Performance
Settlement is the downward movement of a foundation caused by compression or deformation of the supporting soil.
Some settlement is normal, but excessive or uneven settlement can damage buildings.
Uniform settlement occurs when the whole structure settles by approximately the same amount.
Differential settlement occurs when different parts of the structure settle by different amounts. It is more harmful because it can cause cracks in walls, distortion of frames, tilting, and failure of finishes or services.
Proper soil investigation, suitable foundation selection, adequate drainage, and sound construction practices help control settlement.
Importance in Sustainable Construction
Efficient foundation design also contributes to sustainability. Oversized foundations consume unnecessary quantities of concrete, steel, energy, and financial resources. Conversely, poorly designed foundations may require expensive repairs or reconstruction.
Modern engineering therefore seeks to optimize foundations by accurately assessing soil properties and selecting the most suitable system.
Techniques such as ground improvement, soil stabilization, stone columns, geosynthetics, and reinforced earth can sometimes improve weak soil sufficiently to allow economical shallow foundations instead of costly piles.
Conclusion
Deep and shallow foundations play a fundamental role in ensuring the safety, stability, and durability of buildings and infrastructure. Shallow foundations such as isolated footings, combined footings, strip foundations, and raft foundations are suitable where adequate soil strength exists near the surface. Deep foundations such as piles, piers, and caissons are required when structural loads must be transferred to stronger strata located at greater depths.
Soil bearing capacity is the central geotechnical parameter governing foundation design. However, bearing capacity alone is not sufficient; settlement, groundwater, soil variability, structural loading, and construction conditions must also be considered. A reliable foundation design therefore combines structural engineering principles with detailed knowledge of soil behaviour. Proper site investigation and careful foundation selection can significantly improve structural performance, reduce construction risks, and ensure long-term safety and economy.
Daily writing prompt
What’s the most spontaneous thing you’ve ever done?
Madhya Pradesh Bhoj (Open) University, Bhopal has released an employment notification inviting applications for the posts of Professor, Associate Professor, and Assistant Professor in various subjects.
Pay Scale: As per UGC Regulations, 2018, as amended from time to time.
Subjects Available
Applications are invited for teaching positions in the following disciplines:
Botany
Chemistry
Commerce
Computer Science
Economics
Education
English
Geography
Hindi
History
Information Technology
Journalism & Mass Communication
Management
Mathematics
Physics
Political Science
Sociology
Special Education
Zoology
Eligibility Criteria
Professor: Ph.D. in the concerned/allied/relevant discipline, required teaching/research experience, research publications, and academic/research score as prescribed.
Associate Professor: Ph.D., Master’s degree with at least 55% marks, minimum eight years of teaching/research experience, and required research publications and score.
Assistant Professor: Master’s degree with at least 55% marks in the concerned/relevant/allied subject and NET/SLET/SET or applicable Ph.D. exemption, as per UGC regulations.
Candidates must carefully check the official notification for subject-wise qualifications, specializations, and experience requirements.
Application Fee
General / OBC / EWS: ₹1,000/-
SC/ST candidates of MP domicile: ₹500/-
PwBD (Divyaang) candidates: Exempted, subject to applicable conditions.
Last Date to Apply
📅 12 October 2026, up to 6:00 PM
How to Apply
Eligible candidates are required to:
Download the prescribed application form from the official university website.
Fill in the application form and attach all required documents and annexures.
Pay the applicable application fee through the prescribed online payment method.
Send the completed application form along with enclosures through Registered Post, Speed Post, or Courier.
Visit the official university website for the complete advertisement, detailed eligibility criteria, application form, and other recruitment instructions:
Sustainable Development Goal 1, “End poverty in all its forms everywhere,” is the foundational goal among the 17 SDGs adopted by all UN member states in 2015. It builds on the Millennium Development Goals but sets a far more ambitious target: fully eradicating extreme poverty by 2030, not just reducing it. Poverty here is treated as multidimensional rather than purely economic, going beyond income to include hunger, poor health, limited education, lack of clean water and sanitation, and vulnerability to shocks.
SDG 1 also targets the structural causes of poverty, such as unequal access to land, property, and financial services, recognizing that marginalized groups, especially women and rural populations, are often systematically excluded from these resources. It is closely linked to nearly every other SDG, since progress on health, education, and climate action both affects and depends on poverty levels. This makes SDG 1 a gateway goal, requiring coordinated policy, financing, and structural reform to achieve by 2030.
SDG1 Targets
1.1 – Eradicate extreme poverty Eliminate extreme poverty for all people everywhere, currently measured as living on less than $2.15/day (2017 PPP, updated from $1.25). This target focuses on the most severe form of deprivation, where basic survival needs go unmet.
1.2 – Reduce poverty by half (national definitions) Halve the proportion of people living in poverty according to each country’s own definitions and multidimensional measures. This acknowledges that poverty looks different across contexts, so national benchmarks matter alongside the global one.
1.3 – Social protection systems Roll out nationally appropriate social protection systems (pensions, unemployment benefits, child support, disability assistance) and achieve substantial coverage of the poor and vulnerable by 2030. This is about building safety nets that prevent people from falling into poverty or help them recover from it.
1.4 – Equal rights to resources Ensure equal rights for all — especially the poor and vulnerable — to economic resources, land, property, inheritance, natural resources, technology, and financial services like microfinance. This targets structural barriers, particularly those affecting women, who are often legally or socially denied land or inheritance rights.
1.5 – Build resilience to shocks Strengthen the ability of poor and vulnerable populations to withstand and recover from climate-related disasters and economic/social shocks. This reflects growing recognition that climate change and poverty are deeply intertwined — disasters push people into poverty and keep them there.
1.a – Mobilize resources Ensure significant resource mobilization — through international cooperation, aid, and domestic funding — to give developing countries the means to implement poverty-eradication programs.
1.b – Sound policy frameworks Create pro-poor, gender-sensitive policy frameworks at national, regional, and international levels to accelerate investment in poverty eradication.
Key Indicators
Indicator
What it Measures
1.1.1
% of population below the international poverty line
1.2.1
% of population below the national poverty line
1.2.2
% living in poverty per national multidimensional definitions
1.3.1
% of population covered by social protection floors/systems
1.4.1
% of households with access to basic services
1.4.2
% of adults with secure land tenure rights
1.5.1
Deaths/missing/affected persons per 100,000 due to disasters
1.5.2
Direct disaster economic loss relative to GDP
1.5.3
Countries with national/local disaster risk reduction strategies
1.5.4
Local governments with disaster risk reduction strategies
1.a.1
Government resources allocated to poverty reduction
1.a.2
% of government spending on essential services
1.b.1
Government spending benefiting women, poor, and vulnerable groups
Strategies for Achieving SDG 1
1. Expanding Social Protection Systems Social protection is one of the most direct tools for reducing poverty and preventing people from falling into it. Cash transfer programs, such as Brazil’s Bolsa Família, give poor households direct income support, sometimes tied to conditions like school attendance or health check-ups. Some governments have also piloted universal basic income schemes to guarantee a minimum income floor. Non-contributory pensions protect elderly populations lacking other income, while unemployment insurance cushions workers who lose their jobs. Universal health coverage further prevents “medical poverty traps,” where a single health crisis can wipe out a family’s savings.
2. Promoting Inclusive Economic Growth and Employment Poverty reduction depends heavily on whether economic growth actually creates opportunities for the poor. This involves job creation in labor-intensive sectors like agriculture, manufacturing, and construction, along with fair minimum wages that let full-time work lift people out of poverty. Since a large share of the poor work informally, as street vendors, day laborers, or subsistence farmers, strategies also focus on formalizing informal businesses and extending social protections and credit access to them. Skills training and vocational education help match people, especially youth, to labor market needs, while rural development programs (irrigation, subsidies, infrastructure) target poverty’s disproportionate concentration in rural areas.
3. Expanding Access to Finance Financial exclusion keeps many poor households trapped in cycles of debt and vulnerability. Microfinance institutions provide small loans to individuals who lack collateral or credit history, enabling them to start or grow small businesses. Mobile banking and digital payment systems, widely adopted in countries like Kenya, have brought banking services to remote and underserved populations. Broader financial inclusion initiatives also help households build savings, access insurance, and better manage financial shocks like illness or crop failure.
4. Reforming Land and Property Rights Secure and equal access to land and property is a foundational strategy for reducing poverty, particularly for women, who are often excluded from ownership or inheritance rights in many countries. Legal reforms that guarantee formal land titles and property registration give the poor collateral to access credit and reduce their vulnerability to eviction or land disputes. These reforms are especially important in agrarian economies, where land is often the primary productive asset available to poor households.
5. Investing in Basic Services Access to clean water, sanitation, healthcare, and education directly affects whether people can escape poverty and stay out of it. Governments and development partners invest in expanding these services to rural and underserved urban areas, since gaps in basic infrastructure disproportionately affect the poor. Quality public education, in particular, is seen as a long-term poverty-reduction strategy since it improves future earning potential and breaks intergenerational cycles of poverty.
6. Building Disaster Risk Reduction and Climate Resilience Since climate-related disasters push people into poverty and keep them there, strategies focus on early-warning systems, resilient infrastructure, and climate adaptation programs targeted at vulnerable communities. Insurance mechanisms, such as index-based crop insurance for smallholder farmers, help households recover financially after floods, droughts, or storms. Local governments are also encouraged to develop disaster risk reduction strategies tailored to the specific hazards their populations face.
7. Strengthening International Cooperation and Aid Many developing countries lack the domestic resources to fund large-scale poverty-reduction programs on their own. International cooperation, through development assistance, debt relief, and technology transfer, provides additional means to implement these programs. Wealthier nations and multilateral institutions are encouraged to align aid flows specifically toward poverty-focused initiatives rather than general budget support.
8. Improving Data and Monitoring Systems Effective poverty reduction requires accurate data to identify who is poor, where they live, and what specific barriers they face. Strengthening national statistical systems allows governments to track progress against SDG indicators, target interventions more precisely, and adjust policies based on evidence. Without reliable data, it becomes difficult to measure whether poverty-reduction programs are actually working.
9. Adopting Gender-Responsive Policies Poverty affects men and women differently, with women and girls often bearing a disproportionate burden due to unequal access to education, employment, and resources. Gender-responsive poverty strategies ensure that programs, from cash transfers to land reform, actively address these disparities rather than assuming poverty is gender-neutral. This includes designing social protection systems that account for unpaid care work and barriers unique to women-headed households.
Conclusion
SDG 1 sets an ambitious but essential agenda: eliminating extreme poverty and substantially reducing poverty in all its forms by 2030. Its targets address both the symptoms of poverty (lack of income, food insecurity, poor access to services) and its structural causes (unequal rights to resources, weak social protection, vulnerability to shocks). Achieving it requires coordinated action — strong national policies, adequate financing, international cooperation, and resilience-building against climate and economic shocks. While significant progress was made in the years following 2015, setbacks from the COVID-19 pandemic, conflicts, and climate-related disasters have slowed momentum, underscoring that ending poverty is not a linear process but one requiring sustained, adaptive global commitment.
References
United Nations Department of Economic and Social Affairs (UN DESA) — Goal 1: End poverty in all its forms everywherehttps://sdgs.un.org/goals/goal1
Track2Training – Research & Publication Support Services
Before submitting your research paper, thesis, dissertation, book chapter, conference paper, or academic manuscript, it is important to check the document for plagiarism/similarity and AI-generated content.
Track2Training provides an affordable Plagiarism and AI Detection Checking Service for researchers, faculty members, PhD scholars, postgraduate students, authors, and academic institutions.
📄 Plagiarism Checking Service
Fee: ₹500 for up to 20 A4 pages
The standard fee applies to a manuscript of:
• Maximum 20 A4 pages • Font size: 11–12 pt • Standard academic formatting • Research papers, review papers, chapters and other scholarly manuscripts
For manuscripts exceeding 20 pages, the applicable fee may be calculated according to the additional number of pages.
🤖 AI Detection Report
An AI-generated content detection report can also be requested separately.
Important: The AI Detection Report is not included in the ₹500 plagiarism-checking fee. A separate fee applies for the AI report.
Researchers who require both services can request:
1. Plagiarism/Similarity Report Identification of text similarities and potentially overlapping sources.
2. AI Detection Report – Separate Fee Assessment of text that may be identified by the detection system as AI-generated or AI-assisted.
🎓 Who Can Use This Service?
The service is suitable for:
• PhD scholars and research students • Faculty members and academicians • Undergraduate and postgraduate researchers • Journal article authors • Conference paper authors • Book and book-chapter contributors • Thesis and dissertation writers • Research organisations and academic institutions
⚠️ Important Academic Integrity Note
A similarity percentage should not automatically be interpreted as plagiarism. Properly cited quotations, references, technical terminology, standard methodological descriptions and other legitimate textual similarities may contribute to a similarity score.
Likewise, AI-detection results should be treated as indicators rather than definitive proof of AI authorship. Authors and institutions should interpret such reports carefully and in accordance with the policies of the concerned university, journal, publisher or research organisation.
📩 Get Your Research Paper Checked
Send your manuscript to:
Track2Training Research & Publication Support New Delhi, India
📧 research@track2training.com
While sending your manuscript, mention whether you require:
Plagiarism Report / AI Detection Report / Both Reports
Ensure the quality and academic integrity of your manuscript before journal submission, thesis submission or publication.
Track2Training – Supporting Researchers from Research to Publication
Urban development programmes commonly report completed dwellings, infrastructure expenditure and installed facilities, yet these outputs do not establish whether residents experience lasting improvements. This article develops a practical approach to evaluating inclusive urban development in India through the relationships among housing, livelihoods, mobility, environmental comfort and service reliability. It draws on eleven selected urban publications, supplemented by three methodological and monitoring sources, addressing settlement typologies, redevelopment, urban renewal, vernacular architecture, heritage comfort, public transport, pedestrian access, green buildings and waste management. The approach is a conceptual synthesis, not a systematic review or an evaluation of a completed programme. Six figures combine a conceptual framework, a descriptive literature profile, transparent numerical illustrations and a management feedback cycle. Six tables translate the discussion into evaluation questions, indicators, calculation inputs and reporting arrangements. The article distinguishes inputs, outputs, outcomes and distributional consequences; explains how baselines, comparison strategies and repeated observations can support interpretation; and examines the risks of composite scores, incomplete household records and unverified technology claims. It proposes an evaluation process that begins before intervention selection and continues through transition, occupation and maintenance. Special attention is given to recurring household costs, livelihood continuity, complete journeys, user experience and residents missing from routine administrative records. The resulting framework supports municipal decision-making, interdisciplinary education and future empirical research, while requiring local adaptation and validation.
A city improvement programme can complete its construction schedule while leaving important questions unanswered. Can households meet the cost of living in the new environment? Can workers reach their jobs at the necessary times? Do installed services operate reliably? These questions concern the experience of development, and they cannot be answered by expenditure and completion figures alone.
Evaluation should connect physical change with the daily activities it is intended to support. A drainage project should be examined through service performance and reported problems, while a housing intervention should be assessed through occupation, affordability and suitability for household use. The purpose is to understand whether the intended improvement occurs and for whom.
This article places evaluation at the centre of inclusive planning. It treats housing, movement and environmental quality as interconnected conditions. A change in residential location can affect travel costs; an unreliable service can consume household time; and a poorly designed approach route can reduce the practical usefulness of public transport. These relationships require more than separate departmental accounts.
The central argument is that evaluation should begin before a preferred intervention has been selected. Early investigation helps define the problem, compare alternatives and establish what later success would mean. When evaluation is added only at completion, the programme may lack a credible baseline or a clear explanation of its intended outcomes.
For students and practitioners, this offers a disciplined way to connect research with public decisions. The task is not to collect every available number. It is to identify meaningful questions, obtain dependable evidence and use the results to improve action. Evaluation becomes valuable when it changes a decision, corrects a failure or reveals a consequence that would otherwise remain unnoticed.
Figure 1. Proposed integrated evaluation framework. Diagnosis and delivery are connected to everyday outcomes, distributional context and an accountable response. Conceptual relationships are not estimated causal effects.
2. Evidence Base and Analytical Approach
The discussion uses eleven distinct publications selected for their relevance to neighbourhood conditions and urban intervention. Six works originate from the initial bibliography supplied for this series of articles; five complementary works were identified through the Track2Training research collection. A duplicated redevelopment reference is counted once, and the verified journal version represents the vernacular-architecture work.
The selection is purposive and should not be interpreted as a comprehensive literature search. Available publisher records, abstracts and accessible texts support the descriptions. Different publication types contribute different forms of evidence, and their findings are not combined into an estimated overall effect. Where original text was unavailable, detailed results are not attributed.
Figure 1 presents the proposed relationships among diagnosis, intervention, everyday experience and accountable response. Figure 2 assigns each of the eleven urban publications one primary theme for descriptive counting. Several works span multiple topics, so this coding simplifies their scope. Table 1 makes the assignment visible. Theme counts reflect the selection made for this paper; they do not establish the relative importance of research fields or the effectiveness of particular interventions.
Three additional sources strengthen the methodological discussion. OECD (2021) provides evaluation criteria, Gertler and colleagues (2016) introduce impact-evaluation methods, and UN-Habitat’s urban monitoring resources address integrated urban measurement. These sources provide methodological context and are excluded from the eleven-item theme graph. The paper therefore cites fourteen distinct works while retaining a clearly bounded urban reference profile.
Figures 3–5 use deliberately constructed teaching examples to explain household costs, incomplete follow-up and journey components. Every numerical input is disclosed. These illustrations are not observations, estimates or forecasts for any Indian city. Figure 6 depicts a proposed management cycle. Separating conceptual diagrams, bibliography counts and illustrative calculations enables visual communication without confusing different kinds of evidence.
Table 1. Selected publications and primary-theme coding
Publication
Year
Primary theme
Focus
Sharma & Dhote
2003
Buildings and climate
Heritage and thermal comfort
Dhote, Onkar & Das
2012
Buildings and climate
Vernacular habitat
Jaiswal et al.
2012
Mobility and public space
Janmarg BRT
Singh et al.
2013
Housing and regeneration
Settlement typologies
Dhote, Silakri & Onkar
2013
Housing and regeneration
Intervention selection
Bouddha et al.
2014
Housing and regeneration
Inclusive redevelopment
Lodhi et al.
2024
Mobility and public space
Bus-user satisfaction
Sharma, Dehalwar & Singh
2024
Environmental services
Solid waste management
Lalramsangi et al.
2025
Mobility and public space
Open-space access
Sharma, Singh et al.
2025
Buildings and climate
Green neighbourhoods
Yadav et al.
2026
Mobility and public space
First and last mile
Source: reference metadata and author-assigned primary themes. Each distinct work is counted once; thematic categories simplify overlapping subjects.
Figure 2. Primary-theme profile of the eleven core urban publications. One author-assigned theme per work; see Table 1. Rounded percentages describe this selected set, not the wider literature. The three methodological sources are excluded.
2.1 Evaluation criteria and the contribution of this framework
The OECD identifies relevance, coherence, effectiveness, efficiency, impact and sustainability as six evaluation criteria. They address different judgements about an intervention and should be applied thoughtfully in context (OECD, 2021). OECD evaluation guidance. This paper translates those perspectives into neighbourhood questions: whether the response matches residents’ priorities, fits surrounding services, delivers intended changes, uses resources responsibly, contributes to wider improvement and sustains its benefits.
That translation is an analytical proposal. It does not establish a new international standard. Its contribution lies in connecting criteria usually discussed at programme level with household occupation costs, livelihood transitions, pedestrian journeys and maintenance responsibilities. The unit of interest moves repeatedly between the intervention and the experience of people affected by it.
UN-Habitat’s Global Urban Monitoring Framework emphasises integration across urban dimensions, data disaggregation and inclusion. This supports examining connected conditions while retaining differences between population groups. UN-Habitat urban monitoring resources. A local evaluation can contribute to broader monitoring, but the relationship must be explicit: an indicator designed for one project should not automatically be labelled an official global indicator. Definitions, geographic coverage and collection procedures may differ.
The synthesis proceeds by identifying a planning concern in the selected literature, translating it into an observable evaluation question, specifying suitable evidence and identifying a decision that evidence could inform. This four-part process makes the argument traceable. It also leaves space for disagreement: readers can challenge the interpretation of a source, the proposed measure or the decision rule separately.
3. Distinguishing Inputs, Outputs, Outcomes and Wider Effects
Evaluation becomes clearer when different levels of achievement are separated. Inputs are the resources committed to an activity. Outputs are the immediate products delivered. Outcomes concern changes in the conditions or experiences that the activity seeks to improve. Wider effects extend beyond those immediate changes and generally require stronger evidence to establish.
For example, the budget and staff assigned to a pedestrian improvement programme are inputs. Completed crossings and repaired walking surfaces are outputs. Easier access to a bus stop is a potential outcome. A change in employment participation or household expenditure is a possible wider consequence, but it should not be inferred automatically from construction.
Each level answers a legitimate question. Financial records help establish whether resources were used as intended, and construction inspections help determine whether works meet the approved specification. These are necessary checks. They become misleading only when presented as sufficient proof that residents’ lives have improved.
A practical evaluation plan should state the connection expected between levels. If a new facility is intended to reduce travel difficulty, the programme should explain who will use it, which barriers it addresses and what other conditions must hold. An accessible stop, for instance, still depends on a service that reaches useful destinations at relevant times.
The evaluator should also record alternative explanations. Changes in household circumstances or wider service provision may influence the outcome independently of the project. The strength of the conclusion should match the design and evidence available. Describing a change is different from attributing it to an intervention, and both forms of reporting should be labelled accurately.
Table 2. Distinguishing levels of evaluation
Level
Question
Example evidence
Input
What resources were committed?
Budget, staff allocation and implementation capacity.
Output
What was delivered?
Verified dwellings, crossings or service assets completed.
Outcome
What changed for users?
Occupation costs, journey difficulty or service reliability.
Wider effect
What broader change can be supported?
Sustained opportunity or well-being changes, with attribution examined.
Proposed analytical distinction. Examples are evaluation questions and evidence types, not measured programme results.
4. Defining the Unit of Evaluation
The choice of unit determines what an evaluation can see. A project boundary is convenient for contracts, but residents may depend on destinations beyond it. A dwelling is useful for inspecting building conditions, but household activities can extend into shared spaces and nearby streets. A neighbourhood assessment should therefore combine several connected units.
Dhote, Silakri and Onkar (2013) emphasise understanding physical and social conditions before selecting renewal or redevelopment. Their intervention framework provides a relevant foundation for examining local circumstances rather than assuming that a single response fits every area.
The approach proposed here distinguishes the household, dwelling, neighbourhood and journey. Household information explains affordability, work and care. Dwelling information describes the physical environment. Neighbourhood information captures shared services and public space. Journey information connects residents with opportunities outside the immediate area.
These units should be linked carefully rather than merged indiscriminately. An average neighbourhood service score cannot establish that every household receives a reliable service. Similarly, a good building inspection cannot show that the dwelling suits all occupants. Reporting at several levels makes those differences visible.
Boundaries should be documented at the start and retained for comparison where possible. If the area, population or service definition changes, the evaluation should explain how that affects interpretation. Otherwise, an apparent improvement may arise because the measurement unit changed rather than because conditions improved. Clear units are a basic requirement for a trustworthy account of urban change.
5. Using Settlement Typologies Without Losing Household Variation
Classification can help organise a complex urban area into categories relevant to action. It may distinguish service deficiencies, building conditions or site constraints. However, a typology should support investigation rather than replace it. The way categories are defined influences which problems become visible and which interventions appear appropriate.
Singh, Dhote and Soni (2013) develop a settlement typology through a Jabalpur case study, considering location, poverty, housing and services. Their matrix-based approach is intended to support intervention prioritisation. It shows the value of examining differences between settlements before making redevelopment choices.
An evaluation can build on this principle by comparing outcomes within and across clearly defined starting conditions. A programme serving areas with severe service failures should not be compared casually with one addressing minor building defects. Baseline differences affect what improvement is feasible and how quickly it might occur.
Variation within a category remains important. Some households may have direct access to a service while others depend on shared or distant facilities. Renters may experience changes differently from owners. A category average can therefore conceal unequal outcomes, even when its overall direction appears favourable.
The proposed practice is to retain both the classification and the underlying observations. Evaluators should explain why a category exists, which indicators define it and how uncertainty is handled. Residents should have a route for correcting inaccurate information. Classification then becomes an accountable analytical step rather than a permanent label attached to a place.
6. Establishing a Baseline That Can Be Revisited
A baseline should describe the conditions that an intervention intends to change. Collecting information merely because it is easy to obtain can leave important outcomes unmeasured. The starting point should be a set of evaluation questions linked to the programme’s objectives and residents’ priorities.
The baseline should combine records, observation and household accounts where appropriate. Administrative information may identify a connection or facility, while users describe interruptions or access difficulties. Disagreement between sources should prompt investigation rather than an automatic preference for the more formal record.
Timing requires attention. A service observed during one season may operate differently at another time. Travel conditions can vary across weekdays, weekends and working hours. An evaluation should document its observation periods and avoid presenting a short survey as a complete account of annual conditions.
Repeatability also matters. Questions, measurement procedures and location records should be sufficiently clear for another team to revisit them. Changes in instruments or survey wording should be recorded so that later differences are not mistaken for real improvement. Baseline documentation is part of the evidence, not an administrative afterthought.
Finally, the baseline should be usable by the people making decisions. A concise summary can identify major deficiencies, uncertainty and groups requiring closer attention. Detailed records can support analysis without overwhelming public discussion. The aim is a starting account that is credible, understandable and capable of supporting future comparison, rather than a large dataset whose relationship to the project remains unclear.
6.1 A reproducible field protocol
A practical protocol should identify the eligible population before deciding how many interviews to conduct. A housing register may omit tenants, recent arrivals or people using dwellings partly for work. Researchers should document who the register represents, compare it with a field listing where feasible and explain exclusions. Coverage problems cannot be repaired simply by increasing interviews within an incomplete list.
Sampling should follow the intended claim. Probability selection is appropriate when the objective requires population estimates and a usable sampling frame exists. Purposive interviews are useful for exploring experiences and mechanisms, including difficulties faced by groups poorly represented in routine records. Their findings should be reported as qualitative evidence. Combining approaches is valuable when each has an explicit role rather than when one is used to imply the representativeness of the other.
Sample-size planning should consider the main outcome, required precision, expected variation, clustering and anticipated non-response. No universal household total is proposed here. If households are sampled within settlements, observations may share service conditions; treating them as wholly independent can overstate precision. A statistician should help align the design, analysis and uncertainty estimates before collection begins.
Each measure needs a compact data dictionary: variable name, question or observation rule, unit, valid range, missing-value codes and reporting period. Interviewer training should use realistic examples of ambiguous answers. A pilot can reveal whether a question about monthly transport expenditure includes school trips, employer reimbursement or occasional long-distance journeys. The final wording must settle these boundaries consistently.
Quality checks should investigate implausible combinations without silently changing them. An unusually long journey may be a recording error, a disrupted trip or a real access problem. The original record, query and resolution should be retained. Corrections improve data accuracy; deleting inconvenient observations to obtain a more favourable conclusion does not.
Before fieldwork, the team should prepare a short analysis plan naming primary outcomes, comparison groups and subgroup questions. Subsequent changes may be necessary, but they should be recorded with reasons. This keeps interpretation connected to the original purpose and helps reviewers distinguish planned analysis from exploratory learning.
7. Measuring Housing Affordability Beyond the Initial Price
Housing affordability should be examined through the continuing costs of occupation. The initial payment or allocation condition is only one component. Utilities, maintenance, repairs and changes in transport expenditure can influence whether a household can remain in the improved environment.
Bouddha, Dhote and Sharma (2014) connect redevelopment approaches with environmental management and residents’ well-being. Their review provides a relevant basis for considering improvement beyond physical shelter replacement. The evaluation questions developed here extend that inclusive perspective into recurring household costs.
A practical survey should distinguish regular obligations from occasional expenses. It should ask how payments are managed, whether costs are predictable and whether households experience difficulty meeting them. Sensitive financial questions require clear explanations and appropriate privacy arrangements; exact income figures are not always necessary for every evaluation purpose.
Interpretation should consider household composition and income variability. The same expenditure may have different implications for households with different needs and resources. A single affordability threshold should not be introduced without explaining its basis, and any reported ratio should identify what costs and resources it includes.
A hypothetical relocation illustrates the connection with mobility. A dwelling with a lower direct payment may involve higher travel expenditure. The evaluation should record the combined change rather than declaring success from the housing figure alone. This is a proposed appraisal principle, not an observed result for a particular programme. Its purpose is to make transferred burdens visible.
7.1 Worked illustration: a lower dwelling payment can conceal higher costs
Consider three invented monthly budgets for the same hypothetical household: an initial condition, an in-situ improvement and a relocation option. Direct housing payments are INR 3,000, INR 3,400 and INR 2,500 respectively. Utilities and maintenance are INR 800, INR 1,000 and INR 1,200; necessary travel costs are INR 1,200, INR 900 and INR 2,200. Table 3 records these inputs and Figure 3 displays their composition.
The combined amounts are INR 5,000, INR 5,300 and INR 5,900. Relative to the initial condition, the relocation option lowers the direct housing payment by INR 500 but raises the combined total by INR 900, or 18 per cent. In-situ improvement raises the combined total by INR 300, or 6 per cent. These calculations demonstrate a measurement issue; they do not establish which planning option is preferable.
The alternatives could differ in safety, space, tenure arrangements, employment opportunities or service quality, none of which is assigned a value here. A real appraisal must investigate those dimensions and explain how residents assess the trade-offs. The example also excludes relocation expenses, debt repayments and changes in earnings. Those exclusions are deliberate teaching boundaries, not a claim that the omitted items are unimportant.
This presentation is more informative than a single affordability score because readers can inspect what drives the difference. If a transport intervention changes the travel component, its effect on the total can be calculated directly. Decision-makers can then ask which costs are predictable, which are controllable and which households are most exposed to increases.
Table 3. Inputs for the illustrative monthly household budget
Cost component (INR/month)
Initial condition
In-situ improvement
Relocation option
Housing payment
3,000
3,400
2,500
Utilities and maintenance
800
1,000
1,200
Necessary travel
1,200
900
2,200
Combined total
5,000
5,300
5,900
Change from initial total
—
+300 (+6%)
+900 (+18%)
Constructed teaching inputs. The same hypothetical household is assumed. Earnings, one-off transition costs and non-monetary benefits are not modelled. No city data are represented.
Figure 3. Illustrative household budgets: combined monthly cost rises by 6% for the in-situ option and 18% for the relocation option relative to the initial condition. Values are constructed teaching inputs, not observed household data; see Table 3.
8. Following Livelihoods Through the Transition
Livelihood evaluation should begin with how work depends on location, space and relationships. Some residents travel to a fixed workplace, while others work from home or serve nearby customers. The physical arrangement that supports income can be as important as the distance to an employment centre.
Before intervention, evaluators should document the activities residents wish to continue and the conditions that make them possible. Relevant questions may concern storage, customer access, deliveries, working hours and the combination of paid work with care responsibilities. These details can inform design and transition planning.
The construction period requires separate attention. Restricted access, temporary moves or service interruptions may affect work before the completed project begins operating. Evaluating only the final condition can miss costs experienced during this period. A transition record should capture disruption and the adequacy of arrangements intended to address it.
Follow-up should distinguish continuity, adaptation and loss. A person may continue working but at different hours, with new expenses or a changed customer base. A simple employed-or-unemployed category may miss those consequences. Qualitative interviews can help explain changes that a short indicator cannot describe.
The purpose is not to assume that existing arrangements must remain identical. Regeneration can create new possibilities, but those possibilities should be examined alongside risks and actual experience. Tracking livelihoods over time provides evidence about whether promised opportunities become usable and whether households have the resources to make the transition. This helps connect spatial planning with the household economy.
9. Examining Residential Continuity and Missing Residents
Evaluations often depend on the people who remain available for follow-up. This creates a problem when some residents leave, cannot be contacted or were never included in the original record. Their absence may be closely related to the very outcomes the evaluation seeks to understand.
The proposed approach therefore records different forms of occupation at baseline, including rental and shared arrangements where participants consent to provide that information. It does not infer legal entitlement from residence. Its purpose is to identify the population whose experience should be considered when assessing the intervention.
Follow-up procedures should document contact attempts, refusals and unavailable participants. Researchers should avoid assuming that an unreachable household has experienced either a positive or negative outcome. They should report the extent of missing information and discuss how it may affect conclusions.
Where appropriate and authorised, repeated neighbourhood surveys can complement a household panel. A panel follows the same participants, while repeated surveys describe the population present at each observation. These approaches answer different questions. Using both can help distinguish changes among original residents from changes in the composition of the area.
The public report should make that distinction clear. Improved average conditions among current occupants do not necessarily establish improved conditions for the people originally affected. Residential continuity is consequently both an outcome question and a methodological concern. Taking it seriously prevents evaluation from overlooking households whose experience is difficult to observe but central to an inclusive account.
9.1 Worked illustration: uncertainty created by missing follow-up
Suppose an invented panel starts with 100 households. Eighty are reached later, and 56 of those report improvement under a predefined binary outcome. The observed improvement rate among respondents is 56 divided by 80, or 70 per cent. That calculation describes respondents; it does not establish the rate for all original households.
If none of the twenty missing households improved, the full-panel rate would be 56 per cent. If all twenty improved, it would be 76 per cent. Figure 4 displays this 56–76 per cent range alongside the respondent rate. It is an arithmetic bound under the stated assumptions, not a confidence interval and not an estimate of what actually happened to missing residents.
The width of the range reveals why follow-up deserves resources. Locating additional households may reduce uncertainty more usefully than adding elaborate modelling to the incomplete data. However, repeated contact must respect consent and refusal. The evaluation should record missingness without treating every uncontacted person as a problem to be pursued indefinitely.
Statistical adjustment would require further information and assumptions about how response relates to outcomes. Those assumptions should be stated and examined rather than hidden behind software output. Reporting the simple calculation first helps a non-specialist reader understand the remaining uncertainty and judge whether a stronger conclusion is justified.
Figure 4. Illustrative attrition bounds. With 56 improvements among 80 respondents from 100 original households, the respondent rate is 70%; the full-panel rate could lie between 56% and 76%. This range is not a confidence interval.
10. Evaluating Buildings Through Use, Comfort and Adaptation
Building evaluation should combine technical inspection with an understanding of use. Rooms, entrances and shared spaces support activities that may differ from the assumptions in the design brief. Occupant feedback can reveal where a feature works well, where adjustments are needed and where the intended operation is impractical.
Dhote, Onkar and Das (2012) examine vernacular settlements and habitats in central India, including spatial organisation and climatic responsiveness. Their discussion supports investigating underlying practices and adapting them to contemporary requirements. Sharma and Dhote (2003) provide an earlier bibliographic contribution on heritage buildings and thermal comfort; its original text was not examined here, and no specific results are attributed to it.
For evaluation, a promising design idea should be translated into an observable question. If a shared shaded space is intended to support everyday activity, the study can examine when it is used, by whom and under what conditions. Observation should be accompanied by explanation, since absence of use may have several causes.
Comfort monitoring should state the period, occupancy and conditions of measurement. Short observations cannot establish annual performance. Interviews should explain how residents adjust openings, move between spaces or manage privacy and security. These practices influence what the building actually delivers.
The goal is a balanced account of physical performance and lived suitability. Evaluators should avoid treating traditional appearance, new materials or technological sophistication as proof of success. Each claim requires evidence appropriate to the function and the conditions under which the building is occupied.
11. Connecting Green-Building Claims With Operating Evidence
Environmental design proposals often contain predicted savings or expected improvements. Evaluation should preserve the distinction between these expectations and observed performance. Installing equipment demonstrates delivery of an asset; it does not by itself show that the asset produces its intended benefit under everyday conditions.
Sharma, Singh, Kumar, Pandey and Dehalwar (2025) discuss green buildings in relation to sustainable neighbourhoods, including resource efficiency and occupant well-being. Their review offers a basis for examining environmental objectives across building and neighbourhood scales.
A practical assessment should ask what is being compared. Changes in occupancy, use, weather or service availability can affect consumption independently of an installed measure. A simple comparison of bills may be informative, but the report should explain relevant differences before attributing the change to design.
Maintenance evidence is also necessary. Records should identify faults, periods of non-operation, repair arrangements and user understanding. An efficient system on paper may deliver limited value if residents cannot operate it or obtain support. These are implementation questions rather than reasons to reject innovation automatically.
Neighbourhood connections should remain visible. Evaluators can examine whether building entrances, service areas and shared spaces work with surrounding movement and collection arrangements. The strongest assessment links expected environmental performance with actual operation, realistic costs and occupant experience. Its value lies in identifying what works, what needs correction and what future projects should avoid assuming without evidence.
12. Measuring Accessibility as a Complete Journey
Accessibility concerns the opportunities people can reach under realistic conditions. A transport route near a housing area is relevant, but so are waiting, transfers, operating hours and the approach to the stop. Evaluation should therefore examine complete journeys rather than relying only on network proximity.
Jaiswal, Dhote, Krishnan and Jain (2012) examine Ahmedabad’s Janmarg bus rapid transit system through a sustainable transport perspective, discussing coordinated infrastructure and operations. This historical case contributes to the rationale for integrated service assessment; it is not a current audit of the system.
The proposed evaluation begins by identifying destinations and times that matter to residents. Early work shifts, evening education and journeys involving dependants may require different service conditions. Representative journeys should be selected transparently and should not be presented as an exhaustive account of everyone’s mobility.
Data collection can combine participant accounts with observation of selected journeys. The record should distinguish walking, waiting, travel and transfer components, alongside cost and reported difficulty. This helps identify where a change occurs and which organisation could address the problem.
Accessibility outcomes should be interpreted alongside residential change. If a housing project moves households, evaluating only the new dwelling misses a potentially important effect on opportunity. If it improves local services, some journeys may become unnecessary. The evaluation should allow for both possibilities rather than assuming that more or faster travel is always the desired result.
12.1 Worked illustration: why the whole journey matters
Figure 5 compares three invented one-way journeys to the same destination. The initial journey contains fifteen minutes of access walking, twelve minutes waiting, twenty-five minutes in the vehicle and eight minutes of final walking: sixty minutes altogether. A vehicle-speed improvement reduces the vehicle component to twenty minutes, producing a fifty-five-minute journey. A coordinated access-and-service option uses eight, six, twenty-two and six minutes respectively, producing forty-two minutes.
The second option saves five minutes relative to the initial condition; the coordinated option saves eighteen. Its vehicle segment is two minutes longer than the speed-focused option, yet the complete journey is thirteen minutes shorter. This demonstrates why a transport assessment focused on vehicle speed can miss the contribution of access and waiting conditions.
These deterministic values do not represent observed averages or distributions. Actual assessment should record variability, missed services, transfers, crowding and journeys that cannot be completed. A mean travel time can conceal unreliability that matters greatly to workers with fixed reporting times. Repeated trips and user accounts would be needed before attributing performance to an operating service.
The graph also leaves monetary cost and physical difficulty separate. A shorter walk may still involve an inaccessible crossing, while a faster service may be unaffordable. Evaluators should resist converting every dimension into minutes unless they can justify the conversion and explain whose preferences it represents. Separate measures can preserve meaningful differences that a single total would obscure.
Figure 5. Illustrative complete-journey comparison. Segment values sum to 60, 55 and 42 minutes respectively. The example demonstrates the contribution of access and waiting; it does not report measured service performance.
13. Combining Passenger Feedback With Environmental Access Audits
Passenger experience and route conditions provide complementary evidence. A timetable or vehicle record may indicate operational performance, while users explain difficulties with information, waiting or boarding. An approach-route audit adds the conditions encountered before and after the ride.
Lodhi, Jaiswal and Sharma (2024) study bus-user satisfaction in Bhopal using a survey of 1,313 respondents and discrete choice models. Their findings identify comfort and safety among important concerns, alongside operational attributes. Yadav, Dehalwar and Sharma (2026) review environmental influences on first- and last-mile mode choice, identifying microclimatic conditions, environmental quality and infrastructure continuity as relevant considerations.
The evaluation proposed here combines these perspectives without assuming that one dataset explains every experience. Passenger surveys should be supplemented where necessary by consultation with non-users, including people who cannot reach the service. Otherwise, the assessment may describe only those who have already overcome its barriers.
Audits should examine continuous routes and the points where usability breaks down. A missing connection can matter even when most of the route is improved. Observations should state time and conditions, especially where rainfall or exposure may affect the experience.
Finally, each finding should connect with an action and an accountable organisation. Separate agencies may manage the service and the street, but passengers experience a single journey. Evaluating coordinated improvement is more informative than reporting isolated works without checking their combined effect.
14. Public Space and the Difference Between Proximity and Usability
Public-space evaluation should examine who can reach a space, how it is used and what prevents participation. Area and visitor totals provide useful information but do not describe all aspects of inclusion. A nearby destination can remain difficult to use because of its approach, entrances or management arrangements.
Lalramsangi, Garg and Sharma (2025) study route choices to public open spaces in Aizawl using space syntax. Their work highlights the relevance of hill-city conditions and the need to consider more than a flat representation of pedestrian routes.
An evaluation should consequently distinguish straight-line distance from usable access. Gradients, steps and indirect connections can change the effort involved. The appropriate information depends on the users and the setting; a single distance threshold should not be treated as proof of accessibility for everyone.
Observation should cover more than one period where practical. Different groups may use a space at different times, and a quiet visit does not necessarily indicate failure. Interviews can help explain patterns, including why some residents do not visit. Evaluation should avoid assuming that absence always reflects lack of interest.
Maintenance and management deserve the same attention as initial design. Cleaning, repairs and the handling of conflicts can influence continued usability. Reporting should identify responsible organisations and unresolved difficulties. The purpose is to understand whether the space supports meaningful opportunities for use, rather than to treat its physical completion as the end of the public responsibility.
15. Evaluating Environmental Services as Working Processes
Environmental services are delivered through connected tasks. Collection, transport, treatment, inspection and repair require coordination and dependable resources. An evaluation focused only on facilities can miss failures in the process that links them.
Sharma, Dehalwar and Singh (2024) review emerging solid-waste-management techniques, including recycling, composting and waste-to-energy approaches, together with their benefits and challenges. Their chapter offers a basis for examining options while retaining attention to local operating conditions.
A service evaluation should define the expected process and identify points where performance can be checked. For waste management, this may include collection regularity, handling arrangements and the destination of materials. Data should distinguish intended procedures from observed practice and explain the coverage of the observations.
Worker knowledge is particularly useful. People carrying out routine tasks can explain access constraints, equipment problems and inconsistencies that administrative summaries overlook. Consultation should respect their time and protect sensitive information. It should also distinguish organisational problems from individual blame.
User experience adds another perspective. Households may report missed collections or difficulties following instructions, while service teams identify the conditions that make compliance possible. Combining these accounts can support practical correction. The proposed outcome measure is dependable service, supported by evidence about failures and responses over time. A count of installed bins or purchased vehicles remains an output and should be reported as such.
Difficulty and time components of selected complete journeys.
Journey logs and interviews; specify destinations and observation times.
Comfort
Observed conditions and occupant-reported usability.
Monitoring plus interviews; identify season and occupancy.
Public space
Usable access and patterns of participation.
Route audits and observations; include reasons for non-use.
Service reliability
Documented interruptions and time to response.
Service records and user accounts; reconcile conflicting reports.
Participation
Documented influence of resident input on decisions.
Decision-response records; attendance does not demonstrate influence.
All indicators are proposed. Local teams must define units, periods, sampling, responsibilities and interpretation before collecting data. No city values or universal thresholds are assigned.
16. Equity, Disaggregation and the Danger of the Average
An average improvement can coexist with poor outcomes for particular groups. Inclusive evaluation should therefore ask how benefits and burdens are distributed. The relevant groupings depend on the intervention and the evidence available, rather than a fixed list applied without purpose.
Household circumstances that may matter include occupation arrangement, livelihood type, mobility requirements and care responsibilities. These characteristics can influence how a project is experienced. However, subgroup reporting should protect privacy and avoid presenting unstable estimates from very small numbers as dependable comparisons.
Disaggregation should be planned early. If the baseline does not collect information needed to distinguish relevant experiences, later analysis may be unable to answer important questions. The evaluation team should discuss these needs with residents and explain why particular information is requested.
Qualitative evidence can help interpret differences without pretending to establish their population prevalence. A detailed account may reveal an overlooked mechanism or difficulty. It should be presented as that kind of evidence, rather than as a substitute for a representative estimate.
Equity reporting also involves explaining trade-offs. A project may improve one group’s access while creating disruption for another. The evaluator’s task is to make these consequences visible and distinguish them from the policy judgement about how they should be addressed. Transparent reporting supports a more informed discussion than a single citywide score that conceals who benefits, who pays and whose experience remains uncertain.
17. Comparison, Attribution and Claims of Success
Before-and-after information can show that a condition changed, but it does not automatically show why. Wider service changes, economic conditions or household transitions may contribute. The evaluation design should reflect whether the objective is descriptive monitoring or a stronger claim about an intervention’s effect.
A comparison area may help, but only if its role is justified. Areas can differ in starting conditions, investment histories and population characteristics. Selecting a convenient comparison without examining these differences can introduce false confidence. The report should explain why the comparison is informative and where it remains imperfect.
Repeated observations can strengthen understanding of timing and persistence. They help distinguish a temporary disruption from a continuing problem or an early benefit from a durable improvement. Observation intervals should follow the expected process of change and the resources available, not an arbitrary desire for more data.
Where a stronger causal design is not feasible, evaluation can still provide value. It can document outcomes, investigate plausible explanations, compare experiences and identify operational failures. The limitation should be stated clearly, and the language of the conclusion should remain proportionate.
Success is therefore best reported as an evidence-based account with boundaries. A programme may meet construction targets, improve a measured service and leave other outcomes unresolved. Acknowledging that mixed picture is more useful than forcing the result into a simple successful-or-unsuccessful category. It directs attention to the next decision and the evidence needed to support it.
An additional safeguard is to specify the expected direction of change before examining results. If a programme is intended to reduce reported travel difficulty, that outcome should not be replaced after data collection merely because another measure looks more favourable. Changes to the evaluation plan may be justified, but the reasons should be recorded and the revised analysis distinguished from the original question.
Uncertainty can also be explored through deliberately different interpretations. Analysts can examine whether conclusions change when incomplete cases are described separately, when observation periods differ or when unusual values are retained and investigated. These checks should address plausible weaknesses in the evidence rather than become an exercise in searching for a preferred result. The public account should explain the practical implication: whether the finding appears stable, depends on a particular assumption or requires further information before action is justified.
17.1 Choosing a comparison design
Impact evaluation asks what would have happened without the intervention. Gertler and colleagues (2016) explain the importance of a credible counterfactual and introduce methods for constructing comparisons. Impact Evaluation in Practice. A before-and-after comparison alone generally cannot distinguish programme effects from other changes occurring over the same period.
For example, an evaluator might compare changes in travel time in an intervention area with changes in a comparison area. This difference-in-differences approach requires a defensible expectation that, without the intervention, the outcome trends would have been comparable. Pre-intervention observations can inform that judgement, while spillovers or another transport project affecting only one area may undermine it. A sophisticated estimator cannot compensate for an unsuitable comparison.
In urban projects, assignment is often related to deprivation, land availability or political priorities. These conditions also influence outcomes. Researchers should document the selection process and examine which differences their method can address. Where credible causal identification is unavailable, a transparent account of implementation and outcomes remains valuable, provided it does not claim a demonstrated impact.
Table 5. Matching the comparison design to the claim
Mechanisms do not establish population effect sizes.
Mixed-method evaluation
Outcome patterns and explanations together.
Each evidence stream needs a defined role and stated limits.
Analytical guide proposed for this paper. Counterfactual and difference-in-differences concepts draw on Gertler et al. (2016); design selection must reflect the actual intervention and available evidence.
18. Tables, Dashboards and Composite Scores
The way results are displayed affects how they are interpreted. Tables are useful for exact definitions and comparisons, while graphs can reveal distributions or differences more quickly. Both should identify their source, unit and scope. A polished display cannot compensate for an unclear denominator or an unsupported claim.
The figures in this article deliberately distinguish evidence types. The theme profile describes eleven selected publications; the numerical examples illustrate fully disclosed arithmetic; and the diagrams represent proposed relationships and management processes. None ranks cities or estimates programme benefits. That distinction should remain visible wherever the figures are reproduced, including presentations or extracts that separate a graph from the surrounding discussion.
Composite scores require additional caution. Combining affordability, accessibility and service reliability into one number involves choices about scaling and weights. It can also allow a favourable result in one domain to offset a serious problem elsewhere. Those choices should be justified rather than hidden in a formula.
For an initial evaluation, separate domain results are often easier to interpret. Decision-makers can see which conditions improved, which deteriorated and where evidence is missing. If an index is later developed, sensitivity analysis should examine how alternative reasonable choices affect rankings or conclusions.
Reporting should also distinguish proposed indicators from collected results. Table 4 is a menu for local adaptation, not a dataset. Its entries have no assigned city values because no new field survey was conducted. Maintaining this distinction allows the article to offer practical tools without creating the appearance of measurements that do not exist.
18.1 Digital evidence with a clear audit trail
A useful digital system links each reported indicator to its definition, source, collection date and revision history. A dashboard should allow the analyst to trace a summary back to the relevant records without exposing personal information publicly. The design starts with those relationships; purchasing a more complex platform is not a substitute for defining them.
Geographic information systems can connect service assets, route observations and neighbourhood boundaries. The team should record coordinate accuracy and the date of each mapped feature. A line representing a footpath should not automatically imply a continuous, accessible route. Field observations about steps, obstructions or opening hours may be essential to interpreting the mapped connection.
Administrative and sensor data also need contextual checks. A timestamped service entry may describe a scheduled visit rather than completed work. A device reading may reflect a faulty sensor or unusual placement. Automated flags can identify missing periods and implausible values, but their role is to prompt investigation. An unexplained algorithmic correction can make the evidence less transparent.
Public dashboards should use restrained visual conventions: explicit units, readable labels, comparable axes and visible missing categories. Colour should reinforce meaning without being the only way it is communicated. A chart should identify whether it presents measured observations, model estimates or an illustrative scenario. Version dates help readers avoid comparing figures drawn from incompatible reporting cycles.
Access arrangements should follow the purpose of the data. Identifying contact details used for follow-up can be stored separately from analysis records, with restricted access and a documented retention period. A public release can provide aggregate results and a methods note. This supports scrutiny while reducing unnecessary exposure of the households whose participation makes evaluation possible.
19. Governance, Maintenance and Learning After Delivery
Evaluation requires an organisation able to respond to what it finds. A report that documents service problems without identifying responsibility may have limited practical effect. The process should therefore connect evidence with a decision, a responsible body and a mechanism for follow-up.
Responsibilities should be assigned before handover. Shared spaces, installed systems and public access routes may involve different agencies or community arrangements. The evaluation should examine whether those arrangements are clear, adequately resourced and understood by the people expected to use them.
Resident participation should extend into interpretation. Public discussions can help explain why a measured change matters and whether proposed corrections address the actual difficulty. Participants should be told which decisions can change and how their comments will be considered. A record of responses is more informative than attendance totals alone.
Maintenance information should be treated as learning evidence. Repeated faults may indicate a design issue, an operating constraint or a mismatch between the asset and available support. Identifying the pattern can improve future procurement and design rather than merely recording each repair separately.
The proposed evaluation cycle consequently continues after delivery. It moves from a baseline to implementation checks, outcome review and corrective action. The intervals and responsibilities should be adapted to local capacity. The essential requirement is that findings can lead to a practical response and that the response is checked, creating a visible connection between research, management and residents’ experience.
Evaluation itself needs a realistic budget. Field visits, data management, interpretation and returning findings to participants take time. A programme that funds only a final report may lack the resources needed to investigate emerging problems or maintain contact with affected households. The evaluation plan should identify these tasks early and assign enough capacity to perform them consistently.
The budget should also distinguish routine monitoring from additional research. Service teams may already collect useful operational records, while household follow-up may require a separate arrangement. Reusing existing information can reduce duplication, provided its definitions and quality suit the evaluation question. Data collected for one administrative purpose should not be assumed to answer a different research question without review.
Corrective action should have a documented closure process. Recording a complaint as resolved is different from checking whether the user’s difficulty has ended. A proportionate follow-up can ask whether the service works, whether the repair lasted and whether the response created another problem. This closes the connection between evidence and action while producing practical information for later projects. It also gives residents a clearer account of what the programme has done with their contribution.
Table 6. Evaluation and response cycle
Stage
Main task
Responsible arrangement
Review output
Before selection
Define questions and revisit existing records.
Planning team with resident input.
Baseline and uncertainty statement.
Options appraisal
Compare benefits, burdens and dependencies.
Design and service teams; affected groups.
Transparent comparison of alternatives.
Transition
Track disruption and temporary arrangements.
Delivery team with a clear contact point.
Problems recorded and responses assigned.
After occupation
Check usability, costs and service operation.
Evaluator and operating organisations.
Outcome account with missing cases noted.
Maintenance
Investigate recurring faults and repair capacity.
Named asset and service managers.
Corrective actions and resource needs.
Learning review
Check whether corrections solved the problem.
Managers with user verification where appropriate.
Lessons for future design and delivery.
Proposed roles and stages, not a mandated timetable. Assign local organisations, resources and review intervals before implementation.
Figure 6. Proposed evaluation feedback cycle. Responsibility and corrective action connect reporting to implementation; verification returns the process to diagnosis and revised questions.
20. Research and Teaching Applications
The framework can support interdisciplinary teaching through clearly bounded exercises. Students might compare a mapped service with observed operation, document complete journeys or investigate how a dwelling supports everyday activities. Each task should have a manageable question and an output useful to the people who contribute information.
Research training should emphasise the distinction between description and inference. A small field exercise can produce valuable observations without supporting citywide estimates. Students should report selection procedures, observation periods and uncertainty. This makes modest work credible and provides a foundation for more demanding designs.
Universities can also contribute to indicator development. Proposed questions should be tested for clarity, relevance and feasibility before routine use. Repeated collection can help examine consistency, while consultation can reveal whether the information captures concerns residents consider important.
Future research could compare intervention approaches under documented starting conditions or follow households through transition and occupation. It could investigate how maintenance arrangements influence the durability of benefits. These studies would need designs appropriate to their claims and resources sufficient to retain meaningful follow-up.
The present article remains conceptual. Its literature is selected rather than comprehensive, and its proposed tools have not been validated as a universal evaluation system. Their value will depend on adaptation, testing and transparent revision. Reporting difficulties and unsuccessful applications would be as useful as reporting favourable results, because both contribute to understanding when an approach works and what it requires.
Teaching projects should include a clear agreement about what students can and cannot provide. Participants need to know whether the exercise is intended for learning, municipal decision support or a formal research study. Students should avoid implying that an interview guarantees assistance, eligibility or a design change. An honest account of purpose protects participants and improves the quality of the exchange.
Supervision should cover how findings are represented. A photograph may show a physical condition but reveal private information; a quotation may explain an experience but make a person identifiable. Decisions about inclusion should consider consent, necessity and potential consequences. Public outputs can often communicate the planning issue without exposing a household’s specific circumstances.
The final educational task is to return the findings in a usable form. A short local-language summary, an annotated map or a discussion with service staff may be more helpful than a lengthy technical report alone. Returning information allows participants to correct misunderstandings and helps students learn whether their interpretation matches lived experience. That feedback should be documented as part of the project’s learning, with unresolved disagreements retained where appropriate.
20.1 Priorities for empirical validation
The next research stage should test whether the proposed measures are understandable, repeatable and useful for decisions. An initial pilot could compare independently recorded route conditions, repeat selected household questions and examine disagreements between service records and user accounts. Such work would assess measurement performance before attempting to combine indicators or rank neighbourhoods.
A subsequent comparative study could follow different intervention approaches while retaining information on starting conditions and implementation differences. The research should identify the population to which its conclusions apply. A finding from one settlement type, season or service arrangement should not be transferred to another without examining the mechanism that might make the result relevant.
Validation should also examine practical burden. A technically informative indicator may require equipment, interview time or analytical capacity that local teams cannot sustain. Recording the cost and effort of collection allows researchers to compare a comprehensive instrument with a smaller routine monitoring set. The question is whether simplification preserves the information needed for responsible decisions.
Finally, future studies should report when evidence changes a project decision. Examples could include modifying a route, revising maintenance arrangements or addressing a recurring cost that residents identify. Documenting the response and its subsequent performance would test the framework’s practical contribution. Publication should include unresolved problems as well as improvements, creating an evidence base that can support learning across institutions and locations over successive implementation cycles.
21. Conclusion
Urban evaluation should explain whether development improves the conditions that matter in everyday life. Construction, expenditure and asset records remain necessary, but they should be connected with affordability, livelihoods, accessibility, comfort and reliable services. The evaluation question must extend from what was delivered to what changed, for whom and for how long.
The selected literature offers complementary perspectives on those relationships. Settlement typologies encourage contextual diagnosis; redevelopment and renewal studies support careful intervention choice; architectural research raises questions of use and comfort; and transport and environmental studies direct attention to complete service experiences.
The practical approach proposed here begins before selection, retains a revisitable baseline and continues through transition, occupation and maintenance. It separates outputs from outcomes, treats missing residents as an important evidence concern and avoids presenting aggregate improvement as proof of universal benefit. Its tables provide proposed tools and disclosed inputs, while its figures distinguish literature description, conceptual relationships and illustrative calculations.
For public agencies and educational institutions, the immediate opportunity is to make evaluation more usable and accountable. Clear definitions, proportionate claims and visible responsibility can help turn findings into corrections. A city programme deserves confidence when it can show how its decisions improve residents’ conditions and explain openly where the evidence or outcomes remain incomplete.
Evaluation should also preserve a clear record of revisions. When definitions, responsibilities or project arrangements change, documenting the reason allows future teams to interpret results consistently and understand which lessons remain applicable to the next stage of urban improvement.
Declarations and Source Notes
Article type: Conceptual article and narrative synthesis. No new household survey, city-performance dataset or intervention experiment was conducted.
Figures and data availability: Figures 1 and 6 are conceptual diagrams. Figure 2 describes the eleven urban references in Table 1 using one author-assigned primary theme per work. Figures 3–5 use constructed examples; their complete numerical inputs are disclosed in the text or tables. No original field dataset exists for this paper. These graphics must retain their explanatory labels when reproduced.
Tables: Table 1 documents the core urban reference set; Table 3 contains invented teaching inputs; Tables 2, 4, 5 and 6 present proposed analytical distinctions, indicator options, comparison designs and implementation arrangements. They require local adaptation and do not constitute validated standards.
Reference handling: The duplicate Bouddha/Charumitra redevelopment entry is consolidated. The journal version represents the supplied vernacular conference citation. Original text for Sharma and Dhote (2003) was not examined; no detailed findings are attributed to it.
Methodological scope: This expanded conceptual paper develops a selected-literature synthesis. It reports no systematic search, formal risk-of-bias assessment, pooled effect or empirical validation. The additional methodological sources are not included in the descriptive theme count.
References
Bouddha, C., Dhote, K. K., & Sharma, A. (2014). Slum redevelopment strategy: A way forward to urban environment management through inclusive approach. Research Journal of Engineering Sciences, 3(7), 28–37. Publisher record.
Dhote, K. K., Onkar, P., & Das, S. (2012). Identifying the sustainable practices from the vernacular architecture of tribes of central India. American Transactions on Engineering & Applied Sciences, 1(3), 237–251. Published full text.
Dhote, K. K., Silakri, R. K., & Onkar, P. (2013). Urban renewal and redevelopment: Identification of appropriate planning intervention for Indian cities. International Research Journal of Social Sciences, 2(7), 42–48. Published full text.
Gertler, P. J., Martinez, S., Premand, P., Rawlings, L. B., & Vermeersch, C. M. J. (2016). Impact evaluation in practice (2nd ed.). Inter-American Development Bank and World Bank. Publisher record.
Jaiswal, A., Dhote, K., Krishnan, R., & Jain, D. (2012). Bus rapid transit system: A milestone for sustainable transport: A case study of Janmarg BRTs, Ahmedabad, India. OIDA International Journal of Sustainable Development, 4(11), 45–62. Study record.
Lalramsangi, V., Garg, Y. K., & Sharma, S. N. (2025). Route choices to access public open spaces in hill cities. Environment and Urbanization ASIA, 16(2), 283–299. https://doi.org/10.1177/09754253251388721.
Lodhi, A. S., Jaiswal, A., & Sharma, S. N. (2024). Assessing bus users satisfaction using discrete choice models: A case of Bhopal. Innovative Infrastructure Solutions, 9, Article 437. https://doi.org/10.1007/s41062-024-01652-w.
Organisation for Economic Co-operation and Development. (2021). Applying evaluation criteria thoughtfully. OECD Publishing. https://doi.org/10.1787/543e84ed-en.
Sharma, A., & Dhote, K. K. (2003). Thermal comfort and heritage buildings. Institution of Engineers (India), Architectural Engineering, 84, 1–3. [Original full text not examined; bibliographic form retained from the supplied reference.]
Sharma, S. N., Dehalwar, K., & Singh, J. (2024). Emerging techniques of solid waste management for sustainable and safe living environment. In M. Nasr & A. Negm (Eds.), Solid waste management (pp. 29–51). Springer. https://doi.org/10.1007/978-3-031-60684-7_3.
Sharma, S. N., Singh, S., Kumar, G., Pandey, A. K., & Dehalwar, K. (2025). Role of green buildings in creating sustainable neighbourhoods. IOP Conference Series: Earth and Environmental Science, 1519(1), 012018. https://doi.org/10.1088/1755-1315/1519/1/012018.
Singh, P. O., Dhote, K. K., & Soni, N. (2013). Development of typologies of slum settlements: The case of a million plus city of India. WIT Transactions on Ecology and the Environment, 179, 153–164. In The Sustainable City VIII: Urban Regeneration and Sustainability. https://doi.org/10.2495/SC130131.
Yadav, K., Dehalwar, K., & Sharma, S. N. (2026). Exploring the environmental determinants of mode choice in first and last mile connectivity: Evidence from a systematic review. Innovative Infrastructure Solutions, 11, Article 204. https://doi.org/10.1007/s41062-026-02614-0.
Daily writing prompt
Have you ever regretted reading a book — which one and why?
Urban development programmes commonly report completed dwellings, infrastructure expenditure and installed facilities, yet these outputs do not establish whether residents experience lasting improvements. This article develops a practical approach to evaluating inclusive urban development in India through the relationships among housing, livelihoods, mobility, environmental comfort and service reliability. It draws on eleven selected publications addressing settlement typologies, redevelopment, urban renewal, vernacular architecture, heritage comfort, public transport, pedestrian access, green buildings and waste management. The approach is a conceptual synthesis, not a systematic review or an evaluation of a completed programme. Two descriptive graphs document the publication years and primary themes of the selected literature, while tables translate the discussion into proposed evaluation questions, indicators and reporting arrangements. The article distinguishes inputs, outputs, outcomes and distributional consequences; explains how baselines, comparison strategies and repeated observations can support interpretation; and examines the risks of composite scores, incomplete household records and unverified technology claims. It proposes an evaluation process that begins before intervention selection and continues through transition, occupation and maintenance. Special attention is given to recurring household costs, livelihood continuity, complete journeys, user experience and residents missing from routine administrative records. The resulting framework supports municipal decision-making, interdisciplinary education and future empirical research, while requiring local adaptation and validation.
A city improvement programme can complete its construction schedule while leaving important questions unanswered. Can households meet the cost of living in the new environment? Can workers reach their jobs at the necessary times? Do installed services operate reliably? These questions concern the experience of development, and they cannot be answered by expenditure and completion figures alone.
Evaluation should connect physical change with the daily activities it is intended to support. A drainage project should be examined through service performance and reported problems, while a housing intervention should be assessed through occupation, affordability and suitability for household use. The purpose is to understand whether the intended improvement occurs and for whom.
This article places evaluation at the centre of inclusive planning. It treats housing, movement and environmental quality as interconnected conditions. A change in residential location can affect travel costs; an unreliable service can consume household time; and a poorly designed approach route can reduce the practical usefulness of public transport. These relationships require more than separate departmental accounts.
The central argument is that evaluation should begin before a preferred intervention has been selected. Early investigation helps define the problem, compare alternatives and establish what later success would mean. When evaluation is added only at completion, the programme may lack a credible baseline or a clear explanation of its intended outcomes.
For students and practitioners, this offers a disciplined way to connect research with public decisions. The task is not to collect every available number. It is to identify meaningful questions, obtain dependable evidence and use the results to improve action. Evaluation becomes valuable when it changes a decision, corrects a failure or reveals a consequence that would otherwise remain unnoticed.
2. Evidence Base and the Purpose of the Graphs
The discussion uses eleven distinct publications selected for their relevance to neighbourhood conditions and urban intervention. Six works originate from the initial bibliography supplied for this series of articles; five complementary works were identified through the Track2Training research collection. A duplicated redevelopment reference is counted once, and the verified journal version represents the vernacular-architecture work.
The selection is purposive and should not be interpreted as a comprehensive literature search. Available publisher records, abstracts and accessible texts support the descriptions. Different publication types contribute different forms of evidence, and their findings are not combined into an estimated overall effect. Where original text was unavailable, detailed results are not attributed.
Figure 1 shows the years represented in this selected bibliography. Years without a selected publication are displayed as zero. This describes the reference set; it does not demonstrate changes in research activity across India or establish that particular periods lacked relevant work. Such conclusions would require a much broader and reproducible search.
Figure 2 assigns each publication one primary theme for descriptive counting. Several works span more than one topic, so this coding simplifies their scope. The complete assignment is provided in Table 1 to make that simplification visible. Theme counts reflect the choices made for this article, not the relative importance or maturity of urban research fields.
The graphs therefore serve an educational purpose: they show how a small body of literature can be described transparently without turning bibliographic counts into evidence of intervention effectiveness. The same restraint should apply when cities present dashboards. A visual display is useful only when readers understand the population, definitions and limitations behind it.
Table 1. Selected publications and primary-theme coding
Publication
Year
Primary theme
Focus
Sharma & Dhote
2003
Buildings and climate
Heritage and thermal comfort
Dhote, Onkar & Das
2012
Buildings and climate
Vernacular habitat
Jaiswal et al.
2012
Mobility and public space
Janmarg BRT
Singh et al.
2013
Housing and regeneration
Settlement typologies
Dhote, Silakri & Onkar
2013
Housing and regeneration
Intervention selection
Bouddha et al.
2014
Housing and regeneration
Inclusive redevelopment
Lodhi et al.
2024
Mobility and public space
Bus-user satisfaction
Sharma, Dehalwar & Singh
2024
Environmental services
Solid waste management
Lalramsangi et al.
2025
Mobility and public space
Open-space access
Sharma, Singh et al.
2025
Buildings and climate
Green neighbourhoods
Yadav et al.
2026
Mobility and public space
First and last mile
Source: reference metadata and author-assigned primary themes. Each distinct work is counted once; thematic categories simplify overlapping subjects.
Figure 1. Publication years of the selected reference set (n = 11). Zero denotes no selected item in that year; this is not a trend in the wider research literature.
Figure 2. Author-assigned primary themes (n = 11): mobility and public space, 4; housing and regeneration, 3; buildings and climate, 3; environmental services, 1. One primary theme per publication; see Table 1.
3. Distinguishing Inputs, Outputs, Outcomes and Wider Effects
Evaluation becomes clearer when different levels of achievement are separated. Inputs are the resources committed to an activity. Outputs are the immediate products delivered. Outcomes concern changes in the conditions or experiences that the activity seeks to improve. Wider effects extend beyond those immediate changes and generally require stronger evidence to establish.
For example, the budget and staff assigned to a pedestrian improvement programme are inputs. Completed crossings and repaired walking surfaces are outputs. Easier access to a bus stop is a potential outcome. A change in employment participation or household expenditure is a possible wider consequence, but it should not be inferred automatically from construction.
Each level answers a legitimate question. Financial records help establish whether resources were used as intended, and construction inspections help determine whether works meet the approved specification. These are necessary checks. They become misleading only when presented as sufficient proof that residents’ lives have improved.
A practical evaluation plan should state the connection expected between levels. If a new facility is intended to reduce travel difficulty, the programme should explain who will use it, which barriers it addresses and what other conditions must hold. An accessible stop, for instance, still depends on a service that reaches useful destinations at relevant times.
The evaluator should also record alternative explanations. Changes in household circumstances or wider service provision may influence the outcome independently of the project. The strength of the conclusion should match the design and evidence available. Describing a change is different from attributing it to an intervention, and both forms of reporting should be labelled accurately.
Table 2. Distinguishing levels of evaluation
Level
Question
Example evidence
Input
What resources were committed?
Budget, staff allocation and implementation capacity.
Output
What was delivered?
Verified dwellings, crossings or service assets completed.
Outcome
What changed for users?
Occupation costs, journey difficulty or service reliability.
Wider effect
What broader change can be supported?
Sustained opportunity or well-being changes, with attribution examined.
Proposed analytical distinction. Examples are evaluation questions and evidence types, not measured programme results.
4. Defining the Unit of Evaluation
The choice of unit determines what an evaluation can see. A project boundary is convenient for contracts, but residents may depend on destinations beyond it. A dwelling is useful for inspecting building conditions, but household activities can extend into shared spaces and nearby streets. A neighbourhood assessment should therefore combine several connected units.
Dhote, Silakri and Onkar (2013) emphasise understanding physical and social conditions before selecting renewal or redevelopment. Their intervention framework provides a relevant foundation for examining local circumstances rather than assuming that a single response fits every area. Read the urban-intervention study.
The approach proposed here distinguishes the household, dwelling, neighbourhood and journey. Household information explains affordability, work and care. Dwelling information describes the physical environment. Neighbourhood information captures shared services and public space. Journey information connects residents with opportunities outside the immediate area.
These units should be linked carefully rather than merged indiscriminately. An average neighbourhood service score cannot establish that every household receives a reliable service. Similarly, a good building inspection cannot show that the dwelling suits all occupants. Reporting at several levels makes those differences visible.
Boundaries should be documented at the start and retained for comparison where possible. If the area, population or service definition changes, the evaluation should explain how that affects interpretation. Otherwise, an apparent improvement may arise because the measurement unit changed rather than because conditions improved. Clear units are a basic requirement for a trustworthy account of urban change.
5. Using Settlement Typologies Without Losing Household Variation
Classification can help organise a complex urban area into categories relevant to action. It may distinguish service deficiencies, building conditions or site constraints. However, a typology should support investigation rather than replace it. The way categories are defined influences which problems become visible and which interventions appear appropriate.
Singh, Dhote and Soni (2013) develop a settlement typology through a Jabalpur case study, considering location, poverty, housing and services. Their matrix-based approach is intended to support intervention prioritisation. It shows the value of examining differences between settlements before making redevelopment choices. Read the typology study.
An evaluation can build on this principle by comparing outcomes within and across clearly defined starting conditions. A programme serving areas with severe service failures should not be compared casually with one addressing minor building defects. Baseline differences affect what improvement is feasible and how quickly it might occur.
Variation within a category remains important. Some households may have direct access to a service while others depend on shared or distant facilities. Renters may experience changes differently from owners. A category average can therefore conceal unequal outcomes, even when its overall direction appears favourable.
The proposed practice is to retain both the classification and the underlying observations. Evaluators should explain why a category exists, which indicators define it and how uncertainty is handled. Residents should have a route for correcting inaccurate information. Classification then becomes an accountable analytical step rather than a permanent label attached to a place.
6. Establishing a Baseline That Can Be Revisited
A baseline should describe the conditions that an intervention intends to change. Collecting information merely because it is easy to obtain can leave important outcomes unmeasured. The starting point should be a set of evaluation questions linked to the programme’s objectives and residents’ priorities.
The baseline should combine records, observation and household accounts where appropriate. Administrative information may identify a connection or facility, while users describe interruptions or access difficulties. Disagreement between sources should prompt investigation rather than an automatic preference for the more formal record.
Timing requires attention. A service observed during one season may operate differently at another time. Travel conditions can vary across weekdays, weekends and working hours. An evaluation should document its observation periods and avoid presenting a short survey as a complete account of annual conditions.
Repeatability also matters. Questions, measurement procedures and location records should be sufficiently clear for another team to revisit them. Changes in instruments or survey wording should be recorded so that later differences are not mistaken for real improvement. Baseline documentation is part of the evidence, not an administrative afterthought.
Finally, the baseline should be usable by the people making decisions. A concise summary can identify major deficiencies, uncertainty and groups requiring closer attention. Detailed records can support analysis without overwhelming public discussion. The aim is a starting account that is credible, understandable and capable of supporting future comparison, rather than a large dataset whose relationship to the project remains unclear.
7. Measuring Housing Affordability Beyond the Initial Price
Housing affordability should be examined through the continuing costs of occupation. The initial payment or allocation condition is only one component. Utilities, maintenance, repairs and changes in transport expenditure can influence whether a household can remain in the improved environment.
Bouddha, Dhote and Sharma (2014) connect redevelopment approaches with environmental management and residents’ well-being. Their review provides a relevant basis for considering improvement beyond physical shelter replacement. The evaluation questions developed here extend that inclusive perspective into recurring household costs. Read the redevelopment review record.
A practical survey should distinguish regular obligations from occasional expenses. It should ask how payments are managed, whether costs are predictable and whether households experience difficulty meeting them. Sensitive financial questions require clear explanations and appropriate privacy arrangements; exact income figures are not always necessary for every evaluation purpose.
Interpretation should consider household composition and income variability. The same expenditure may have different implications for households with different needs and resources. A single affordability threshold should not be introduced without explaining its basis, and any reported ratio should identify what costs and resources it includes.
A hypothetical relocation illustrates the connection with mobility. A dwelling with a lower direct payment may involve higher travel expenditure. The evaluation should record the combined change rather than declaring success from the housing figure alone. This is a proposed appraisal principle, not an observed result for a particular programme. Its purpose is to make transferred burdens visible.
8. Following Livelihoods Through the Transition
Livelihood evaluation should begin with how work depends on location, space and relationships. Some residents travel to a fixed workplace, while others work from home or serve nearby customers. The physical arrangement that supports income can be as important as the distance to an employment centre.
Before intervention, evaluators should document the activities residents wish to continue and the conditions that make them possible. Relevant questions may concern storage, customer access, deliveries, working hours and the combination of paid work with care responsibilities. These details can inform design and transition planning.
The construction period requires separate attention. Restricted access, temporary moves or service interruptions may affect work before the completed project begins operating. Evaluating only the final condition can miss costs experienced during this period. A transition record should capture disruption and the adequacy of arrangements intended to address it.
Follow-up should distinguish continuity, adaptation and loss. A person may continue working but at different hours, with new expenses or a changed customer base. A simple employed-or-unemployed category may miss those consequences. Qualitative interviews can help explain changes that a short indicator cannot describe.
The purpose is not to assume that existing arrangements must remain identical. Regeneration can create new possibilities, but those possibilities should be examined alongside risks and actual experience. Tracking livelihoods over time provides evidence about whether promised opportunities become usable and whether households have the resources to make the transition. This helps connect spatial planning with the household economy.
9. Examining Residential Continuity and Missing Residents
Evaluations often depend on the people who remain available for follow-up. This creates a problem when some residents leave, cannot be contacted or were never included in the original record. Their absence may be closely related to the very outcomes the evaluation seeks to understand.
The proposed approach therefore records different forms of occupation at baseline, including rental and shared arrangements where participants consent to provide that information. It does not infer legal entitlement from residence. Its purpose is to identify the population whose experience should be considered when assessing the intervention.
Follow-up procedures should document contact attempts, refusals and unavailable participants. Researchers should avoid assuming that an unreachable household has experienced either a positive or negative outcome. They should report the extent of missing information and discuss how it may affect conclusions.
Where appropriate and authorised, repeated neighbourhood surveys can complement a household panel. A panel follows the same participants, while repeated surveys describe the population present at each observation. These approaches answer different questions. Using both can help distinguish changes among original residents from changes in the composition of the area.
The public report should make that distinction clear. Improved average conditions among current occupants do not necessarily establish improved conditions for the people originally affected. Residential continuity is consequently both an outcome question and a methodological concern. Taking it seriously prevents evaluation from overlooking households whose experience is difficult to observe but central to an inclusive account.
10. Evaluating Buildings Through Use, Comfort and Adaptation
Building evaluation should combine technical inspection with an understanding of use. Rooms, entrances and shared spaces support activities that may differ from the assumptions in the design brief. Occupant feedback can reveal where a feature works well, where adjustments are needed and where the intended operation is impractical.
Dhote, Onkar and Das (2012) examine vernacular settlements and habitats in central India, including spatial organisation and climatic responsiveness. Their discussion supports investigating underlying practices and adapting them to contemporary requirements. Read the vernacular-architecture study. Sharma and Dhote (2003) provide an earlier bibliographic contribution on heritage buildings and thermal comfort; its original text was not examined here, and no specific results are attributed to it.
For evaluation, a promising design idea should be translated into an observable question. If a shared shaded space is intended to support everyday activity, the study can examine when it is used, by whom and under what conditions. Observation should be accompanied by explanation, since absence of use may have several causes.
Comfort monitoring should state the period, occupancy and conditions of measurement. Short observations cannot establish annual performance. Interviews should explain how residents adjust openings, move between spaces or manage privacy and security. These practices influence what the building actually delivers.
The goal is a balanced account of physical performance and lived suitability. Evaluators should avoid treating traditional appearance, new materials or technological sophistication as proof of success. Each claim requires evidence appropriate to the function and the conditions under which the building is occupied.
11. Connecting Green-Building Claims With Operating Evidence
Environmental design proposals often contain predicted savings or expected improvements. Evaluation should preserve the distinction between these expectations and observed performance. Installing equipment demonstrates delivery of an asset; it does not by itself show that the asset produces its intended benefit under everyday conditions.
Sharma, Singh, Kumar, Pandey and Dehalwar (2025) discuss green buildings in relation to sustainable neighbourhoods, including resource efficiency and occupant well-being. Their review offers a basis for examining environmental objectives across building and neighbourhood scales. Read the available green-buildings paper.
A practical assessment should ask what is being compared. Changes in occupancy, use, weather or service availability can affect consumption independently of an installed measure. A simple comparison of bills may be informative, but the report should explain relevant differences before attributing the change to design.
Maintenance evidence is also necessary. Records should identify faults, periods of non-operation, repair arrangements and user understanding. An efficient system on paper may deliver limited value if residents cannot operate it or obtain support. These are implementation questions rather than reasons to reject innovation automatically.
Neighbourhood connections should remain visible. Evaluators can examine whether building entrances, service areas and shared spaces work with surrounding movement and collection arrangements. The strongest assessment links expected environmental performance with actual operation, realistic costs and occupant experience. Its value lies in identifying what works, what needs correction and what future projects should avoid assuming without evidence.
12. Measuring Accessibility as a Complete Journey
Accessibility concerns the opportunities people can reach under realistic conditions. A transport route near a housing area is relevant, but so are waiting, transfers, operating hours and the approach to the stop. Evaluation should therefore examine complete journeys rather than relying only on network proximity.
Jaiswal, Dhote, Krishnan and Jain (2012) examine Ahmedabad’s Janmarg bus rapid transit system through a sustainable transport perspective, discussing coordinated infrastructure and operations. This historical case contributes to the rationale for integrated service assessment; it is not a current audit of the system. Read the Janmarg study record.
The proposed evaluation begins by identifying destinations and times that matter to residents. Early work shifts, evening education and journeys involving dependants may require different service conditions. Representative journeys should be selected transparently and should not be presented as an exhaustive account of everyone’s mobility.
Data collection can combine participant accounts with observation of selected journeys. The record should distinguish walking, waiting, travel and transfer components, alongside cost and reported difficulty. This helps identify where a change occurs and which organisation could address the problem.
Accessibility outcomes should be interpreted alongside residential change. If a housing project moves households, evaluating only the new dwelling misses a potentially important effect on opportunity. If it improves local services, some journeys may become unnecessary. The evaluation should allow for both possibilities rather than assuming that more or faster travel is always the desired result.
13. Combining Passenger Feedback With Environmental Access Audits
Passenger experience and route conditions provide complementary evidence. A timetable or vehicle record may indicate operational performance, while users explain difficulties with information, waiting or boarding. An approach-route audit adds the conditions encountered before and after the ride.
Lodhi, Jaiswal and Sharma (2024) study bus-user satisfaction in Bhopal using a survey of 1,313 respondents and discrete choice models. Their findings identify comfort and safety among important concerns, alongside operational attributes. Read the passenger-satisfaction study. Yadav, Dehalwar and Sharma (2026) review environmental influences on first- and last-mile mode choice, identifying microclimatic conditions, environmental quality and infrastructure continuity as relevant considerations. Read the first- and last-mile review.
The evaluation proposed here combines these perspectives without assuming that one dataset explains every experience. Passenger surveys should be supplemented where necessary by consultation with non-users, including people who cannot reach the service. Otherwise, the assessment may describe only those who have already overcome its barriers.
Audits should examine continuous routes and the points where usability breaks down. A missing connection can matter even when most of the route is improved. Observations should state time and conditions, especially where rainfall or exposure may affect the experience.
Finally, each finding should connect with an action and an accountable organisation. Separate agencies may manage the service and the street, but passengers experience a single journey. Evaluating coordinated improvement is more informative than reporting isolated works without checking their combined effect.
14. Public Space and the Difference Between Proximity and Usability
Public-space evaluation should examine who can reach a space, how it is used and what prevents participation. Area and visitor totals provide useful information but do not describe all aspects of inclusion. A nearby destination can remain difficult to use because of its approach, entrances or management arrangements.
Lalramsangi, Garg and Sharma (2025) study route choices to public open spaces in Aizawl using space syntax. Their work highlights the relevance of hill-city conditions and the need to consider more than a flat representation of pedestrian routes. Read the public-open-space study.
An evaluation should consequently distinguish straight-line distance from usable access. Gradients, steps and indirect connections can change the effort involved. The appropriate information depends on the users and the setting; a single distance threshold should not be treated as proof of accessibility for everyone.
Observation should cover more than one period where practical. Different groups may use a space at different times, and a quiet visit does not necessarily indicate failure. Interviews can help explain patterns, including why some residents do not visit. Evaluation should avoid assuming that absence always reflects lack of interest.
Maintenance and management deserve the same attention as initial design. Cleaning, repairs and the handling of conflicts can influence continued usability. Reporting should identify responsible organisations and unresolved difficulties. The purpose is to understand whether the space supports meaningful opportunities for use, rather than to treat its physical completion as the end of the public responsibility.
15. Evaluating Environmental Services as Working Processes
Environmental services are delivered through connected tasks. Collection, transport, treatment, inspection and repair require coordination and dependable resources. An evaluation focused only on facilities can miss failures in the process that links them.
Sharma, Dehalwar and Singh (2024) review emerging solid-waste-management techniques, including recycling, composting and waste-to-energy approaches, together with their benefits and challenges. Their chapter offers a basis for examining options while retaining attention to local operating conditions. Read the waste-management chapter.
A service evaluation should define the expected process and identify points where performance can be checked. For waste management, this may include collection regularity, handling arrangements and the destination of materials. Data should distinguish intended procedures from observed practice and explain the coverage of the observations.
Worker knowledge is particularly useful. People carrying out routine tasks can explain access constraints, equipment problems and inconsistencies that administrative summaries overlook. Consultation should respect their time and protect sensitive information. It should also distinguish organisational problems from individual blame.
User experience adds another perspective. Households may report missed collections or difficulties following instructions, while service teams identify the conditions that make compliance possible. Combining these accounts can support practical correction. The proposed outcome measure is dependable service, supported by evidence about failures and responses over time. A count of installed bins or purchased vehicles remains an output and should be reported as such.
Table 3. Proposed indicator menu for local adaptation
Difficulty and time components of selected complete journeys.
Journey logs and interviews; specify destinations and observation times.
Comfort
Observed conditions and occupant-reported usability.
Monitoring plus interviews; identify season and occupancy.
Public space
Usable access and patterns of participation.
Route audits and observations; include reasons for non-use.
Service reliability
Documented interruptions and time to response.
Service records and user accounts; reconcile conflicting reports.
Participation
Documented influence of resident input on decisions.
Decision-response records; attendance does not demonstrate influence.
All indicators are proposed. Local teams must define units, periods, sampling, responsibilities and interpretation before collecting data. No city values or universal thresholds are assigned.
16. Equity, Disaggregation and the Danger of the Average
An average improvement can coexist with poor outcomes for particular groups. Inclusive evaluation should therefore ask how benefits and burdens are distributed. The relevant groupings depend on the intervention and the evidence available, rather than a fixed list applied without purpose.
Household circumstances that may matter include occupation arrangement, livelihood type, mobility requirements and care responsibilities. These characteristics can influence how a project is experienced. However, subgroup reporting should protect privacy and avoid presenting unstable estimates from very small numbers as dependable comparisons.
Disaggregation should be planned early. If the baseline does not collect information needed to distinguish relevant experiences, later analysis may be unable to answer important questions. The evaluation team should discuss these needs with residents and explain why particular information is requested.
Qualitative evidence can help interpret differences without pretending to establish their population prevalence. A detailed account may reveal an overlooked mechanism or difficulty. It should be presented as that kind of evidence, rather than as a substitute for a representative estimate.
Equity reporting also involves explaining trade-offs. A project may improve one group’s access while creating disruption for another. The evaluator’s task is to make these consequences visible and distinguish them from the policy judgement about how they should be addressed. Transparent reporting supports a more informed discussion than a single citywide score that conceals who benefits, who pays and whose experience remains uncertain.
17. Comparison, Attribution and Claims of Success
Before-and-after information can show that a condition changed, but it does not automatically show why. Wider service changes, economic conditions or household transitions may contribute. The evaluation design should reflect whether the objective is descriptive monitoring or a stronger claim about an intervention’s effect.
A comparison area may help, but only if its role is justified. Areas can differ in starting conditions, investment histories and population characteristics. Selecting a convenient comparison without examining these differences can introduce false confidence. The report should explain why the comparison is informative and where it remains imperfect.
Repeated observations can strengthen understanding of timing and persistence. They help distinguish a temporary disruption from a continuing problem or an early benefit from a durable improvement. Observation intervals should follow the expected process of change and the resources available, not an arbitrary desire for more data.
Where a stronger causal design is not feasible, evaluation can still provide value. It can document outcomes, investigate plausible explanations, compare experiences and identify operational failures. The limitation should be stated clearly, and the language of the conclusion should remain proportionate.
Success is therefore best reported as an evidence-based account with boundaries. A programme may meet construction targets, improve a measured service and leave other outcomes unresolved. Acknowledging that mixed picture is more useful than forcing the result into a simple successful-or-unsuccessful category. It directs attention to the next decision and the evidence needed to support it.
An additional safeguard is to specify the expected direction of change before examining results. If a programme is intended to reduce reported travel difficulty, that outcome should not be replaced after data collection merely because another measure looks more favourable. Changes to the evaluation plan may be justified, but the reasons should be recorded and the revised analysis distinguished from the original question.
Uncertainty can also be explored through deliberately different interpretations. Analysts can examine whether conclusions change when incomplete cases are described separately, when observation periods differ or when unusual values are retained and investigated. These checks should address plausible weaknesses in the evidence rather than become an exercise in searching for a preferred result. The public account should explain the practical implication: whether the finding appears stable, depends on a particular assumption or requires further information before action is justified.
18. Tables, Dashboards and Composite Scores
The way results are displayed affects how they are interpreted. Tables are useful for exact definitions and comparisons, while graphs can reveal distributions or differences more quickly. Both should identify their source, unit and scope. A polished display cannot compensate for an unclear denominator or an unsupported claim.
The two graphs in this article illustrate a limited but verifiable use of visual evidence. They describe the eleven selected references and expose the coding behind the counts. They do not rank cities, estimate programme benefits or assign empirical strength to publication themes. That boundary should remain visible wherever the figures are reproduced.
Composite scores require additional caution. Combining affordability, accessibility and service reliability into one number involves choices about scaling and weights. It can also allow a favourable result in one domain to offset a serious problem elsewhere. Those choices should be justified rather than hidden in a formula.
For an initial evaluation, separate domain results are often easier to interpret. Decision-makers can see which conditions improved, which deteriorated and where evidence is missing. If an index is later developed, sensitivity analysis should examine how alternative reasonable choices affect rankings or conclusions.
Reporting should also distinguish proposed indicators from collected results. Table 3 is a menu for local adaptation, not a dataset. Its entries have no assigned city values because no new field survey was conducted. Maintaining this distinction allows the article to offer practical tools without creating the appearance of measurements that do not exist.
19. Governance, Maintenance and Learning After Delivery
Evaluation requires an organisation able to respond to what it finds. A report that documents service problems without identifying responsibility may have limited practical effect. The process should therefore connect evidence with a decision, a responsible body and a mechanism for follow-up.
Responsibilities should be assigned before handover. Shared spaces, installed systems and public access routes may involve different agencies or community arrangements. The evaluation should examine whether those arrangements are clear, adequately resourced and understood by the people expected to use them.
Resident participation should extend into interpretation. Public discussions can help explain why a measured change matters and whether proposed corrections address the actual difficulty. Participants should be told which decisions can change and how their comments will be considered. A record of responses is more informative than attendance totals alone.
Maintenance information should be treated as learning evidence. Repeated faults may indicate a design issue, an operating constraint or a mismatch between the asset and available support. Identifying the pattern can improve future procurement and design rather than merely recording each repair separately.
The proposed evaluation cycle consequently continues after delivery. It moves from a baseline to implementation checks, outcome review and corrective action. The intervals and responsibilities should be adapted to local capacity. The essential requirement is that findings can lead to a practical response and that the response is checked, creating a visible connection between research, management and residents’ experience.
Evaluation itself needs a realistic budget. Field visits, data management, interpretation and returning findings to participants take time. A programme that funds only a final report may lack the resources needed to investigate emerging problems or maintain contact with affected households. The evaluation plan should identify these tasks early and assign enough capacity to perform them consistently.
The budget should also distinguish routine monitoring from additional research. Service teams may already collect useful operational records, while household follow-up may require a separate arrangement. Reusing existing information can reduce duplication, provided its definitions and quality suit the evaluation question. Data collected for one administrative purpose should not be assumed to answer a different research question without review.
Corrective action should have a documented closure process. Recording a complaint as resolved is different from checking whether the user’s difficulty has ended. A proportionate follow-up can ask whether the service works, whether the repair lasted and whether the response created another problem. This closes the connection between evidence and action while producing practical information for later projects. It also gives residents a clearer account of what the programme has done with their contribution.
Table 4. Proposed evaluation and response cycle
Stage
Main task
Responsible arrangement
Review output
Before selection
Define questions and revisit existing records.
Planning team with resident input.
Baseline and uncertainty statement.
Options appraisal
Compare benefits, burdens and dependencies.
Design and service teams; affected groups.
Transparent comparison of alternatives.
Transition
Track disruption and temporary arrangements.
Delivery team with a clear contact point.
Problems recorded and responses assigned.
After occupation
Check usability, costs and service operation.
Evaluator and operating organisations.
Outcome account with missing cases noted.
Maintenance
Investigate recurring faults and repair capacity.
Named asset and service managers.
Corrective actions and resource needs.
Learning review
Check whether corrections solved the problem.
Managers with user verification where appropriate.
Lessons for future design and delivery.
Proposed roles and stages, not a mandated timetable. Assign local organisations, resources and review intervals before implementation.
20. Research and Teaching Applications
The framework can support interdisciplinary teaching through clearly bounded exercises. Students might compare a mapped service with observed operation, document complete journeys or investigate how a dwelling supports everyday activities. Each task should have a manageable question and an output useful to the people who contribute information.
Research training should emphasise the distinction between description and inference. A small field exercise can produce valuable observations without supporting citywide estimates. Students should report selection procedures, observation periods and uncertainty. This makes modest work credible and provides a foundation for more demanding designs.
Universities can also contribute to indicator development. Proposed questions should be tested for clarity, relevance and feasibility before routine use. Repeated collection can help examine consistency, while consultation can reveal whether the information captures concerns residents consider important.
Future research could compare intervention approaches under documented starting conditions or follow households through transition and occupation. It could investigate how maintenance arrangements influence the durability of benefits. These studies would need designs appropriate to their claims and resources sufficient to retain meaningful follow-up.
The present article remains conceptual. Its literature is selected rather than comprehensive, and its proposed tools have not been validated as a universal evaluation system. Their value will depend on adaptation, testing and transparent revision. Reporting difficulties and unsuccessful applications would be as useful as reporting favourable results, because both contribute to understanding when an approach works and what it requires.
Teaching projects should include a clear agreement about what students can and cannot provide. Participants need to know whether the exercise is intended for learning, municipal decision support or a formal research study. Students should avoid implying that an interview guarantees assistance, eligibility or a design change. An honest account of purpose protects participants and improves the quality of the exchange.
Supervision should cover how findings are represented. A photograph may show a physical condition but reveal private information; a quotation may explain an experience but make a person identifiable. Decisions about inclusion should consider consent, necessity and potential consequences. Public outputs can often communicate the planning issue without exposing a household’s specific circumstances.
The final educational task is to return the findings in a usable form. A short local-language summary, an annotated map or a discussion with service staff may be more helpful than a lengthy technical report alone. Returning information allows participants to correct misunderstandings and helps students learn whether their interpretation matches lived experience. That feedback should be documented as part of the project’s learning, with unresolved disagreements retained where appropriate.
21. Conclusion
Urban evaluation should explain whether development improves the conditions that matter in everyday life. Construction, expenditure and asset records remain necessary, but they should be connected with affordability, livelihoods, accessibility, comfort and reliable services. The evaluation question must extend from what was delivered to what changed, for whom and for how long.
The selected literature offers complementary perspectives on those relationships. Settlement typologies encourage contextual diagnosis; redevelopment and renewal studies support careful intervention choice; architectural research raises questions of use and comfort; and transport and environmental studies direct attention to complete service experiences.
The practical approach proposed here begins before selection, retains a revisitable baseline and continues through transition, occupation and maintenance. It separates outputs from outcomes, treats missing residents as an important evidence concern and avoids presenting aggregate improvement as proof of universal benefit. Its tables provide proposed tools, while its graphs describe only the selected reference set.
For public agencies and educational institutions, the immediate opportunity is to make evaluation more usable and accountable. Clear definitions, proportionate claims and visible responsibility can help turn findings into corrections. A city programme deserves confidence when it can show how its decisions improve residents’ conditions and explain openly where the evidence or outcomes remain incomplete.
Evaluation should also preserve a clear record of revisions. When definitions, responsibilities or project arrangements change, documenting the reason allows future teams to interpret results consistently and understand which lessons remain applicable to the next stage of urban improvement.
Declarations and Source Notes
Article type: Conceptual article and narrative synthesis. No new household survey, city-performance dataset or intervention experiment was conducted.
Figures: Both graphs are descriptive calculations from the eleven references listed below. Theme assignments are author-coded and mutually exclusive for counting, although the publications may span several themes. The graphs do not represent the wider literature or measured urban outcomes.
Tables: Table 1 documents the selected reference set. Tables 2–4 contain proposed evaluation tools and reporting arrangements that require local adaptation and validation.
Reference handling: The duplicate Bouddha/Charumitra redevelopment entry is consolidated. The journal version represents the supplied vernacular conference citation. Original text for Sharma and Dhote (2003) was not examined; no detailed findings are attributed to it.
References
Bouddha, C., Dhote, K. K., & Sharma, A. (2014). Slum redevelopment strategy: A way forward to urban environment management through inclusive approach. Research Journal of Engineering Sciences, 3(7), 28–37. Publisher record.
Dhote, K. K., Onkar, P., & Das, S. (2012). Identifying the sustainable practices from the vernacular architecture of tribes of central India. American Transactions on Engineering & Applied Sciences, 1(3), 237–251. Published full text.
Dhote, K. K., Silakri, R. K., & Onkar, P. (2013). Urban renewal and redevelopment: Identification of appropriate planning intervention for Indian cities. International Research Journal of Social Sciences, 2(7), 42–48. Published full text.
Jaiswal, A., Dhote, K., Krishnan, R., & Jain, D. (2012). Bus rapid transit system: A milestone for sustainable transport: A case study of Janmarg BRTs, Ahmedabad, India. OIDA International Journal of Sustainable Development, 4(11), 45–62. Study record.
Lalramsangi, V., Garg, Y. K., & Sharma, S. N. (2025). Route choices to access public open spaces in hill cities. Environment and Urbanization ASIA, 16(2), 283–299. https://doi.org/10.1177/09754253251388721.
Lodhi, A. S., Jaiswal, A., & Sharma, S. N. (2024). Assessing bus users satisfaction using discrete choice models: A case of Bhopal. Innovative Infrastructure Solutions, 9, Article 437. https://doi.org/10.1007/s41062-024-01652-w.
Sharma, A., & Dhote, K. K. (2003). Thermal comfort and heritage buildings. Institution of Engineers (India), Architectural Engineering, 84, 1–3. [Original full text not examined; bibliographic form retained from the supplied reference.]
Sharma, S. N., Dehalwar, K., & Singh, J. (2024). Emerging techniques of solid waste management for sustainable and safe living environment. In M. Nasr & A. Negm (Eds.), Solid waste management (pp. 29–51). Springer. https://doi.org/10.1007/978-3-031-60684-7_3.
Sharma, S. N., Singh, S., Kumar, G., Pandey, A. K., & Dehalwar, K. (2025). Role of green buildings in creating sustainable neighbourhoods. IOP Conference Series: Earth and Environmental Science, 1519(1), 012018. https://doi.org/10.1088/1755-1315/1519/1/012018.
Singh, P. O., Dhote, K. K., & Soni, N. (2013). Development of typologies of slum settlements: The case of a million plus city of India. WIT Transactions on Ecology and the Environment, 179, 153–164. In The Sustainable City VIII: Urban Regeneration and Sustainability. https://doi.org/10.2495/SC130131.
Yadav, K., Dehalwar, K., & Sharma, S. N. (2026). Exploring the environmental determinants of mode choice in first and last mile connectivity: Evidence from a systematic review. Innovative Infrastructure Solutions, 11, Article 204. https://doi.org/10.1007/s41062-026-02614-0.
A city is experienced through everyday journeys and routines: finding an affordable home, reaching work, collecting water, waiting for a bus, studying in a comfortable room and meeting neighbours in a public space. These activities connect housing, transport, architecture and environmental services. Planning becomes less effective when each is treated as a separate technical assignment. A newly constructed dwelling offers limited improvement if its occupants lose access to employment. A transport corridor cannot serve everyone equally when the walk to its stations is inaccessible.
Inclusive urban sustainability therefore begins with a practical question: can people live securely, move affordably and participate in urban life without enduring avoidable environmental burdens? Answering it requires attention to both physical infrastructure and the social relationships that allow neighbourhoods to function. It also requires understanding existing places before deciding how they should change.
The publications discussed here provide several entry points. Research associated with K. K. Dhote addresses settlement typologies, slum redevelopment, urban renewal, heritage comfort, vernacular architecture and bus rapid transit. Five further publications selected from the Track2Training research collection extend the discussion to passenger satisfaction, first- and last-mile travel, public open spaces, green buildings and waste management.
This article brings these themes together as an educational commentary. It does not present a systematic review or claim that every recommendation has been tested by the cited authors. Instead, it uses specific research contributions to develop a practical argument: urban improvement should be assessed through the combined effects of buildings, services, accessibility and decisions on residents’ everyday lives.
Understanding informal settlements before selecting interventions
The term “slum” appears throughout the cited literature, but it can conceal substantial differences between settlements. A neighbourhood with inadequate drainage may still have durable houses and strong employment connections. Another may face serious site hazards, insecure occupation and severe service deficiencies. Treating both as the same planning problem makes it difficult to identify proportionate solutions.
Singh, Dhote and Soni (2013) examine settlement typologies through a case study of Jabalpur. Their approach considers location, poverty, housing and services, using a matrix to help prioritise intervention. The research is useful because it directs attention towards differences between settlements before redevelopment choices are made. Read the settlement-typology study.
Building on that approach, a contemporary neighbourhood assessment should combine physical observation with residents’ accounts. A map might show a water connection, while interviews reveal that supply arrives unpredictably. A road may appear adequate in width, yet parked vehicles, seasonal flooding or poorly positioned steps can make movement difficult. Household conditions also differ within the same settlement.
Typologies should consequently support judgement rather than become permanent labels. Authorities should explain how categories are created, which indicators receive priority and how residents can correct errors. Classifying an area as highly deprived should strengthen its claim to improvement; it should not automatically become a justification for clearance.
For students, the central lesson is methodological. Begin with a question that classification can answer, collect evidence at an appropriate scale and recognise variation within each category. A useful typology guides a decision while remaining open to revision when new information becomes available.
Housing improvement must protect the wider conditions of living
Housing is more than an enclosed floor area. It can also provide space for earning income, caring for children, storing work equipment and maintaining relationships. Redevelopment proposals need to account for these functions if they are to improve living conditions beyond the physical quality of the dwelling.
Bouddha, Dhote and Sharma (2014) review approaches to slum redevelopment in relation to environmental management and inclusion. Their discussion connects the treatment of informal settlements with residents’ well-being and broader urban conditions. The reference supplied under “Charumitra, B.” identifies the same publication, rather than a second independent study. Read the publisher’s record.
The planning implication developed here is that alternatives should be compared through household consequences. In-situ upgrading, selective rebuilding and relocation can each create different benefits and burdens. Evaluation should consider service reliability, housing costs, travel expenditure, livelihood continuity and disruption during construction. The preferred option should emerge from this comparison and meaningful engagement with affected residents.
An illustrative household makes the issue clearer. A person who repairs garments at home may depend on nearby customers and a flexible ground-floor workspace. A replacement apartment could improve sanitation while creating difficulties for that livelihood. This example does not establish that apartments are unsuitable; it demonstrates why housing design needs information about actual activities.
Affordability should also be assessed after occupation. Maintenance charges, utility payments and additional transport costs can change what a household must spend each month. A credible redevelopment proposal should make those recurring obligations visible before residents are asked to evaluate it.
Choosing between renewal, repair and redevelopment
Cities contain buildings and neighbourhoods of different ages, conditions and cultural significance. Improvement can involve repairing structures, reorganising services, adapting buildings to new uses or replacing unsafe components. The scale of change should follow a diagnosis of the problem.
Dhote, Silakri and Onkar (2013) distinguish urban renewal and redevelopment and propose a framework for selecting appropriate interventions. Their paper considers physical and social infrastructure alongside community participation, emphasising the need to understand a locality before changing it. Read the urban-renewal paper.
A practical application would begin by identifying what already works. An older market might have adaptable shopfronts, a useful street network and established customer relationships, alongside drainage failures and deteriorating structures. Addressing those failures may require selective reconstruction and service improvements. The assessment should explain whether wholesale replacement would offer additional public benefits sufficient to justify its disruption.
Decision-making should also identify who receives those benefits. Higher land values or new commercial floorspace are incomplete measures when existing residents cannot remain or traders cannot return. Project evaluation should track occupancy, livelihood access and service quality, alongside financial and construction indicators.
Renewal is therefore best understood as a continuing public responsibility. Inspections, routine maintenance and timely repairs can prevent manageable defects from becoming major failures. Universities can support municipalities by documenting building conditions, mapping service problems and developing accessible options for discussion. Such work is especially valuable when it helps communities understand the choices available to them before a project becomes difficult to change.
Learning from vernacular architecture without romanticising it
Vernacular architecture offers a record of how communities have organised buildings around materials, climate, terrain and social practices. Its educational value lies in understanding those relationships. Copying a visual style without investigating how it functions misses much of that knowledge.
Dhote, Onkar and Das (2012) document tribal settlements and habitats in central India, considering site selection, settlement organisation, building materials and climatic responsiveness. Their published paper explicitly proposes adapting underlying principles to contemporary needs. This creates a useful bridge between documentation and design rather than a demand to reproduce historic forms unchanged. Read the published vernacular-architecture study.
For contemporary practice, the first question should be why a feature exists. Does a shaded transition space support social activity? Does the layout respond to terrain? How do occupants adjust openings or use different rooms across seasons? These questions encourage architecture students to observe buildings as occupied environments.
Any proposed adaptation must then be tested. Material durability, structural requirements, accessibility, sanitation and maintenance capacity remain essential. A traditional technique may need modification to meet present expectations or environmental conditions. Local availability alone does not demonstrate low environmental impact, just as industrial manufacture alone does not establish poor performance.
The people who maintain this knowledge should participate in its interpretation. Craftspeople and residents can explain construction sequences, repair practices and changes in household needs that measured drawings cannot capture. Collaborative documentation should credit their contribution and return useful information to the community. The goal is an informed exchange between established knowledge and contemporary evaluation, with benefits for those whose practices make the research possible.
Thermal comfort belongs in the discussion of housing quality
A dwelling can meet basic space requirements yet remain difficult to occupy during hot periods. Comfort deserves attention because residents experience buildings through temperature, air movement, light, noise and the ability to control their surroundings. Housing quality assessments should make room for these lived conditions.
Sharma and Dhote’s (2003) paper, Thermal comfort and heritage buildings, belongs to the earlier literature linking building heritage with environmental performance. Its bibliographic details are retained here, but the original text was not available for direct examination; no measured temperature reductions or specific experimental findings are attributed to it.
The broader design proposal is to evaluate comfort at several scales. Within a dwelling, shading and the arrangement of openings can be considered alongside occupancy, privacy and security. Across a building, layout affects the relationship between internal spaces and shared circulation. At neighbourhood scale, exposed surfaces and the availability of shaded routes shape the experience outside the home.
These considerations should be investigated through observation and measurement, rather than assumed from appearance. Students can compare indoor and outdoor conditions at consistent times, record building characteristics and ask occupants how they use spaces. Short monitoring exercises should be described as limited observations, not evidence of performance across an entire year.
Retrofit decisions also require attention to heritage significance and present use. A building should remain workable for its occupants while valued features are protected. The most useful proposal explains the problem, identifies reversible or carefully justified interventions and sets out how improvement will be checked after implementation. Comfort then becomes an accountable design objective.
Connecting green buildings with sustainable neighbourhoods
Green-building discussions become more useful when they extend beyond individual properties. A resource-efficient building still depends on the surrounding transport system, drainage network and public realm. Neighbourhood sustainability requires examining these connections rather than assuming that the performance of one building represents the entire area.
Sharma, Singh, Kumar, Pandey and Dehalwar (2025) review the role of green buildings in sustainable neighbourhoods, discussing resource efficiency, indoor environmental quality and community considerations. Their contribution provides a basis for connecting building decisions with wider urban objectives. Read the authors’ available paper.
The editorial argument here is that project boundaries should not define the limits of responsibility. Designers should ask how occupants reach everyday destinations, where stormwater goes and how waste is collected. They should also consider whether public-facing edges support comfortable movement or create barriers along otherwise useful routes.
Affordability must remain part of this assessment. A proposal should explain installation costs, recurring expenses and who will maintain its systems. Equipment that requires unavailable expertise can become a burden even when its design specification promises efficiency. Procurement should therefore consider repair arrangements, user understanding and realistic operating conditions.
Post-occupancy evaluation offers a way to learn from completed projects. Comparing expected and actual resource use can reveal operational difficulties, while resident feedback identifies problems that meters cannot explain. Results should inform subsequent design decisions. For educational institutions, documenting a modest improvement honestly can be more instructive than presenting an elaborate scheme without evidence about how it performs in everyday use.
Public transport as access to opportunity
Transport planning shapes access to education, employment, healthcare and social life. Its public value should be considered through the opportunities people can reach, the effort required and the reliability of the journey. A road network that moves vehicles efficiently may still serve people unevenly.
Jaiswal, Dhote, Krishnan and Jain (2012) examine Ahmedabad’s Janmarg bus rapid transit system as a case of sustainable transport. Their discussion addresses coordinated bus infrastructure and operations, offering a historical contribution to debates about improving urban public transport. The case should be read in its original period rather than treated as a current audit of the system. Read the Janmarg study record.
For present planning, the appropriate technology should follow local travel requirements and implementation capacity. Corridor design, operating arrangements, service coverage and transfer conditions need to be considered together. A capital investment does not remove the need for continuing attention to scheduling, maintenance and passenger information.
Housing decisions belong in the same conversation. Before selecting a redevelopment site, planners should examine the destinations residents use and the services available at relevant times. A route that operates near a site may not support early work shifts, evening classes or journeys involving several stops.
Students can explore accessibility through simple comparisons of complete journeys. Recording the walk, waiting period, in-vehicle time and transfers reveals what a passenger actually experiences. Such exercises should include people with different abilities and responsibilities. The aim is to understand whose needs a service meets and where its design or operation leaves gaps.
Passenger experience should guide service improvement
Transport performance becomes clearer when operational information is considered alongside passenger experience. Travellers can identify difficulties with boarding, waiting, information and comfort that a route map does not show. Their feedback needs to be collected systematically and connected to decisions.
Lodhi, Jaiswal and Sharma (2024) investigate bus-user satisfaction in Bhopal using a survey of 1,313 respondents and discrete choice models. The study identifies comfort and safety among the prominent concerns, alongside several operational and vehicle-related attributes. It illustrates the value of examining service quality from the user’s perspective. Read the Bhopal passenger-satisfaction study.
A practical response would connect each identified concern with an action that can be monitored. Problems with waiting might require investigation of service regularity; difficulties boarding might require reviewing the vehicle-stop interface. Passenger information should explain disruptions clearly and be available to people who do not use smartphones.
Survey design matters as well. Interviewing only current passengers can overlook people who stopped using the service or cannot access it. A more inclusive assessment could supplement onboard surveys with neighbourhood interviews and consultations with potential users. Findings should be separated by relevant characteristics where the sample supports meaningful comparison.
Researchers should also avoid interpreting every statistical association as a causal effect. A model helps organise evidence, but intervention choices still require operational understanding and follow-up evaluation. The educational opportunity lies in connecting analysis with a specific service problem, implementing a feasible response and checking whether passengers experience an improvement.
The first and last mile connect transport with urban design
Public transport journeys usually begin before passengers board and continue after they leave the vehicle. These access and egress segments connect transport planning with footpaths, crossings, shade, drainage and neighbourhood layout. Ignoring them can make a well-equipped service difficult to use.
Yadav, Dehalwar and Sharma (2026) review environmental influences on first- and last-mile mode choice. Their synthesis identifies microclimatic conditions, environmental quality and infrastructure continuity as relevant influences, while recognising differences in context and measurement across the literature. The study supports treating environmental exposure as part of accessibility assessment. Read the first- and last-mile review.
The practical proposal is to audit complete routes rather than isolated improvements. A short missing footpath section or an inconvenient crossing may interrupt an otherwise usable connection. Site visits should examine the route at times when people actually travel, including conditions after rainfall where relevant and safe to observe.
Audits should also investigate competing uses of street space. Vendors, pedestrians, loading activities and parked vehicles may occupy the same limited area. Design discussions should look for workable arrangements that support livelihoods and safe movement. Clearing one activity without understanding its role can simply transfer the problem elsewhere.
Coordinating access improvements with transit investment is therefore essential. The responsible agencies should agree on delivery, maintenance and complaint handling before construction finishes. For a resident, the journey is continuous even when administrative responsibilities are divided. Planning should make those divisions less visible in the everyday experience of using the city.
Public open spaces must be reachable and usable
Parks, squares and other public spaces offer settings for recreation, rest and interaction. Their value depends partly on whether people can reach them and feel able to use them. An attractive space behind difficult access routes may contribute little to residents who face mobility constraints.
Lalramsangi, Garg and Sharma (2025) study route choices to public open spaces in Aizawl using space syntax. Their work highlights the importance of considering hill-city conditions when analysing pedestrian movement, rather than relying entirely on a flat representation of the street network. Read the public-open-space study.
This suggests a useful planning question: what does proximity mean for different users? A destination that appears nearby may involve steps, steep gradients or an indirect route. Accessibility mapping should therefore be accompanied by observation and consultation. Where a fully accessible route cannot immediately be delivered, planners should explain constraints and examine alternative improvements rather than claim universal access.
The quality of the destination matters too. Seating, shade, understandable entrances and ongoing maintenance can be investigated through user feedback. Different groups may use a space at different times, so a single observation period can give an incomplete picture.
Public-space projects should include a clear plan for care after opening. Responsibilities for cleaning, repairs and responding to complaints need to be assigned. Student exercises can combine route mapping with observations of use and discussions with nearby residents. The strongest outputs connect spatial analysis with an achievable change that people can recognise in their daily surroundings.
Environmental services require both systems and stewardship
Waste management, drainage and water services are often most noticeable when they fail. Their routine operation nevertheless underpins neighbourhood quality. Environmental improvement requires attention to the entire service chain and the people responsible for keeping it functioning.
Sharma, Dehalwar and Singh (2024) discuss emerging solid-waste-management techniques, including recycling, composting and waste-to-energy approaches, together with their benefits and challenges. The chapter provides an entry point for understanding available options rather than a universal prescription for a particular technology. Read the waste-management chapter.
For local planning, technology selection should begin with evidence about waste streams, collection arrangements, available space and operating capacity. A treatment facility requires a workable supply and maintenance system. Household segregation requires instructions that people understand and collection practices that preserve the separation.
Environmental services also involve livelihoods. Waste pickers, collection workers and small recovery businesses should be considered when systems are redesigned. Consultation can reveal how material recovery currently works and what changes would affect income or working conditions. Proposed improvements should specify responsibilities and resources for worker protection and service continuity.
Educational projects can contribute through carefully scoped waste audits, service maps and interviews with workers. Students should state sampling limitations and avoid extending a short observation into an unsupported citywide estimate. The objective is to produce usable evidence: where collection gaps occur, what materials are being mixed and which operational changes deserve examination. A sound environmental proposal connects its technical choice with realistic arrangements for daily work.
Participation should change the decisions being made
Community participation is useful when residents can influence a proposal while meaningful choices remain open. A meeting held after the layout, budget and relocation arrangements have been fixed offers little room for that influence. Participation should therefore be designed around decisions, with clear explanations of what can change and what constraints require discussion.
An illustrative process could begin with separate conversations about housing, livelihoods and movement, followed by a shared review of priorities. Different meeting formats may be necessary because working hours, care responsibilities and confidence in public speaking affect who participates. Written submissions and smaller discussions can complement a large gathering. Attendance alone should not be treated as agreement.
The project team should then publish a simple response explaining which suggestions were incorporated, which require further investigation and which were not accepted, with reasons. This creates a record that residents can examine and gives future meetings a concrete purpose. Disagreements should remain visible rather than being removed from a polished account of consensus.
Students supporting such work need to understand the limits of their role. They should explain the purpose of interviews, seek consent and avoid suggesting that participation guarantees a housing entitlement or project benefit. Maps and reports should protect personal information. Returning an understandable account of the findings is part of responsible engagement, especially when communities have contributed substantial time and knowledge.
Digital tools should answer a defined public question
Geographic information systems, digital surveys and simple dashboards can help organise neighbourhood evidence. Their usefulness depends on the question being asked. A map intended to locate drainage complaints requires different information from a model intended to compare access to employment. Selecting the tool before defining the decision can produce impressive outputs with little practical value.
Consider a proposed student project comparing routes between a housing area and a bus stop. The team could map available paths, record barriers and discuss preferred routes with residents. Its digital output should show where information came from, when it was collected and which conditions remain uncertain. The result would support a focused conversation about improvements without pretending to represent every possible journey.
Data quality requires continuing attention. A blank area on a map may indicate missing information rather than the absence of residents or services. Informal addresses and changing street conditions require local checking. Automated classifications should be reviewed where errors could affect access to assistance or the priority assigned to a neighbourhood.
Digital access should also remain optional for public participation. Printed maps, telephone contact and face-to-face assistance allow people to contribute without a particular device or account. The strongest use of technology makes evidence easier to question and decisions easier to understand. It should leave municipal staff and residents better able to work with the information after the research team has departed.
Finance and maintenance determine whether improvements last
A neighbourhood proposal needs a financial account that extends beyond construction. Designers should identify recurring expenses, replacement needs and the organisation responsible for each asset. These obligations influence whether a facility remains useful after its opening, particularly where household contributions or municipal maintenance budgets are limited.
For example, a shared space with lighting, planting and seating requires arrangements for electricity, watering, cleaning and repairs. The initial design should reflect the resources available to perform those tasks. Choosing durable, understandable components may be appropriate where specialised repair services are difficult to obtain. This is a proposed decision principle, not a claim that any particular material or technology is always preferable.
Project appraisal should also make distribution visible. Who contributes money or land? Who experiences disruption? Who receives improved access, additional space or commercial benefit? A financially viable project may still require redesign if its burdens fall heavily on people with limited capacity to absorb them. Presenting those consequences openly helps residents and decision-makers compare alternatives.
Phasing offers another practical consideration. Delivering essential service improvements before more complex building work may provide earlier benefits, provided temporary arrangements remain safe and coordinated. Each stage should have a responsible organisation, a realistic operating budget and a way to report faults. Sustainable investment is partly the discipline of ensuring that promised improvements have people, resources and workable routines behind them.
Putting the connections into practice
An integrated neighbourhood programme should begin with a shared baseline. Housing conditions, service reliability, livelihood locations, travel difficulties and environmental exposure can be recorded together. Residents should have opportunities to correct the account before it becomes the basis for investment.
The next stage is to compare alternatives openly. Each option should explain expected benefits, disruption, household costs and maintenance requirements. Some actions may be immediate, such as addressing a service fault; others may require design development, funding or coordination across agencies. The programme should identify those dependencies and assign responsibility.
Evaluation should continue after delivery. Useful questions include whether households can afford occupation, whether journeys have become easier and whether services work consistently. Results should distinguish construction completion from actual improvement. Where outcomes fall short, the response should be correction and learning rather than reliance on the original project promise.
For Track2Training readers, these connections offer a productive educational agenda. Architecture, planning, engineering and social-science students can investigate the same neighbourhood from complementary perspectives, while sharing evidence with residents. The literature discussed here encourages careful diagnosis, attention to context and evaluation through lived experience. A sustainable city is built through repeated decisions that make secure housing, useful mobility and a healthy environment attainable together.
References
Bouddha, C., Dhote, K. K., & Sharma, A. (2014). Slum redevelopment strategy: A way forward to urban environment management through inclusive approach. Research Journal of Engineering Sciences, 3(7), 28–37. Publisher record.
Dhote, K. K., Onkar, P., & Das, S. (2012). Identifying the sustainable practices from the vernacular architecture of tribes of central India. American Transactions on Engineering & Applied Sciences, 1(3), 237–251. Published full text.
Dhote, K. K., Silakri, R. K., & Onkar, P. (2013). Urban renewal and redevelopment: Identification of appropriate planning intervention for Indian cities. International Research Journal of Social Sciences, 2(7), 42–48. Published full text.
Jaiswal, A., Dhote, K., Krishnan, R., & Jain, D. (2012). Bus rapid transit system: A milestone for sustainable transport: A case study of Janmarg BRTs, Ahmedabad, India. OIDA International Journal of Sustainable Development, 4(11), 45–62. Study record.
Lalramsangi, V., Garg, Y. K., & Sharma, S. N. (2025). Route choices to access public open spaces in hill cities. Environment and Urbanization ASIA, 16(2), 283–299. https://doi.org/10.1177/09754253251388721.
Lodhi, A. S., Jaiswal, A., & Sharma, S. N. (2024). Assessing bus users satisfaction using discrete choice models: A case of Bhopal. Innovative Infrastructure Solutions, 9, Article 437. https://doi.org/10.1007/s41062-024-01652-w.
Sharma, A., & Dhote, K. K. (2003). Thermal comfort and heritage buildings. Institution of Engineers (India), Architectural Engineering, 84, 1–3. [Original full text not examined; bibliographic form retained from the supplied reference.]
Sharma, S. N., Dehalwar, K., & Singh, J. (2024). Emerging techniques of solid waste management for sustainable and safe living environment. In M. Nasr & A. Negm (Eds.), Solid waste management (pp. 29–51). Springer. https://doi.org/10.1007/978-3-031-60684-7_3.
Sharma, S. N., Singh, S., Kumar, G., Pandey, A. K., & Dehalwar, K. (2025). Role of green buildings in creating sustainable neighbourhoods. IOP Conference Series: Earth and Environmental Science, 1519(1), 012018. https://doi.org/10.1088/1755-1315/1519/1/012018.
Singh, P. O., Dhote, K. K., & Soni, N. (2013). Development of typologies of slum settlements: The case of a million plus city of India. WIT Transactions on Ecology and the Environment, 179, 153–164. In The Sustainable City VIII: Urban Regeneration and Sustainability. https://doi.org/10.2495/SC130131.
Yadav, K., Dehalwar, K., & Sharma, S. N. (2026). Exploring the environmental determinants of mode choice in first and last mile connectivity: Evidence from a systematic review. Innovative Infrastructure Solutions, 11, Article 204. https://doi.org/10.1007/s41062-026-02614-0.
Daily writing prompt
If your pet could talk, what would be the first thing it says?
In India, the Directive Principles of State Policy (DPSP) provide a strong constitutional basis for planning policies concerning the informal sector—including street vendors, construction workers, domestic workers, home-based workers, waste pickers, small traders, and other workers outside formal employment arrangements.
Supports inclusive urban and regional planning and reduction of spatial and socio-economic inequality.
Article 39(a)
Adequate means of livelihood for all citizens
Supports livelihood-sensitive planning, vending spaces, informal markets and access to employment.
Article 39(b)
Distribution of material resources for the common good
Relevant to equitable access to land, public space, infrastructure and urban resources.
Article 39(c)
Prevent concentration of wealth and means of production
Provides a broader basis for economically inclusive development.
Article 39(d)
Equal pay for equal work
Particularly relevant to informal and casual workers facing wage disparities.
Article 39(e)
Protect workers’ health and strength from abuse
Supports safe workplaces and occupational-health considerations for informal workers.
Article 41
Right to work, education and public assistance within State capacity
Important for employment generation, livelihood programmes and social protection.
Article 42
Just and humane conditions of work and maternity relief
Supports worker facilities, safety, sanitation, childcare and welfare provisions.
Article 43
Living wage and decent standard of life for workers
Provides an important foundation for decent-work-oriented informal-sector policies.
Article 43A
Participation of workers in management
Relevant to participatory approaches and representation of workers in decisions affecting livelihoods.
Article 46
Promote educational and economic interests of weaker sections
Supports targeted inclusion of socially and economically disadvantaged informal workers.
Article 47
Improvement of nutrition, standard of living and public health
Connects informal-sector planning with housing, sanitation, health and basic services.
Application to urban and informal-sector planning
For urban planning, DPSP implies that informal activities should not simply be regarded as encroachments or activities to be removed. Planning can recognize the informal economy as part of the city’s livelihood and service system.
For example, Article 39(a), read with Articles 38 and 43, provides a constitutional rationale for incorporating street-vending zones, weekly markets, workspaces for home-based enterprises, affordable commercial spaces, worker housing and accessible public transport into development plans.
Article 42 is especially relevant to the physical planning of informal workplaces. Construction sites, informal markets and labour congregation points can be planned with drinking water, toilets, shade, lighting, childcare, occupational safety and emergency access.
Article 39(b) also has an important spatial-planning dimension. Urban land and public spaces are scarce resources, and planning should balance competing claims rather than allowing access to be determined exclusively by purchasing power. This supports consideration of equitable allocation of public space for livelihood activities.
DPSP → planning framework
A useful conceptual framework for research can be expressed as:
Directive Principles of State Policy → Social and Economic Justice → Right/Livelihood Opportunities → Recognition of Informal Economic Activities → Inclusive Land-Use and Spatial Planning → Basic Infrastructure + Affordable Workspace + Mobility → Social Security and Decent Working Conditions → Inclusive and Sustainable Urban Development
It is important academically to distinguish the DPSP from enforceable Fundamental Rights: Article 37 states that DPSPs are not enforceable by courts, but they are fundamental in the governance of the country and it is the State’s duty to apply them in making laws.
For a paper on “Informal Sector Planning in India,” Articles 38, 39(a), 39(b), 41, 42 and 43 would form the strongest core constitutional framework. These can then be connected with the 74th Constitutional Amendment/Article 243W and the Twelfth Schedule, municipal planning, street-vending legislation, social-security legislation and master/development plans.
Daily writing prompt
Have you ever regretted reading a book — which one and why?
For informal-sector planning, the SDGs do not have one standalone goal devoted exclusively to informality. Instead, informal workers, enterprises, street vendors, home-based workers, waste pickers, construction workers, informal settlements, and livelihood spaces are addressed across several goals. The most important are SDGs 1, 5, 8, 10, 11 and 12.
Extending social security and protection to informal workers
1.4 Equal rights to economic resources, basic services, property and land
Access to workspace, services, land, finance and livelihood infrastructure
1.5 Resilience of poor and vulnerable groups
Protecting informal workers from disasters, climate events and economic shocks
SDG 5 – Gender Equality
5.4 Recognize and value unpaid care and domestic work
Important for women domestic workers and home-based livelihood planning
5.a Equal rights to economic resources and property
Women’s access to land, finance and productive resources
SDG 8 – Decent Work and Economic Growth
8.3 Promote productive activities, decent job creation, entrepreneurship and formalization and growth of micro-, small- and medium-sized enterprises
One of the most directly relevant targets for informal-sector planning
8.5 Full and productive employment and decent work for all
Improving livelihood opportunities and working conditions
8.8 Protect labour rights and promote safe and secure working environments
Safety and occupational protection for informal workers
SDG 10 – Reduced Inequalities
10.2 Promote social, economic and political inclusion of all
Inclusion of informal workers in urban governance and planning
10.3 Ensure equal opportunity and reduce inequalities of outcome
Reducing discriminatory exclusion from urban opportunities and services
10.4 Fiscal, wage and social-protection policies for greater equality
Social security and income protection for informal workers
SDG 11 – Sustainable Cities and Communities
11.1 Access to adequate, safe and affordable housing and basic services and upgrading slums
Housing and services for low-income and informal-sector households
11.2 Safe, affordable, accessible and sustainable transport for all
Connecting informal workers with employment and markets
11.3 Inclusive and sustainable urbanization and participatory planning
Central target for integrating informal activities into urban planning
11.6 Reduce the adverse environmental impact of cities, including waste management
Particularly relevant to waste pickers and informal recycling
11.7 Universal access to safe, inclusive and accessible public spaces
Important for street vendors, informal markets and livelihood use of public space
SDG 12 – Responsible Consumption and Production
12.5 Reduce waste through prevention, reduction, recycling and reuse
Recognition and integration of informal waste pickers/recyclers
The three strongest targets for your topic
If you are developing a framework specifically for informal-sector planning in Indian cities, I would place three targets at its core:
SDG Target 8.3 — Economic/formalization dimension: encourages development-oriented policies supporting productive activities, decent jobs, entrepreneurship and the formalization and growth of micro-, small- and medium-sized enterprises.
SDG Target 11.3 — Spatial/planning dimension: calls for inclusive and sustainable urbanization and participatory, integrated and sustainable human-settlement planning.
SDG Target 10.2 — Equity dimension: calls for the social, economic and political inclusion of everyone irrespective of economic or other status.
Together they can produce a useful research framework:
For an Indian planning research paper/thesis, this SDG framework can be integrated very effectively with the Directive Principles of State Policy (Articles 38, 39, 41, 42 and 43), the 74th Constitutional Amendment, Street Vendors Act 2014, National Urban Livelihoods Mission, and city Master/Development Plans to develop measurable indicators for evaluating how well a city accommodates its informal sector.




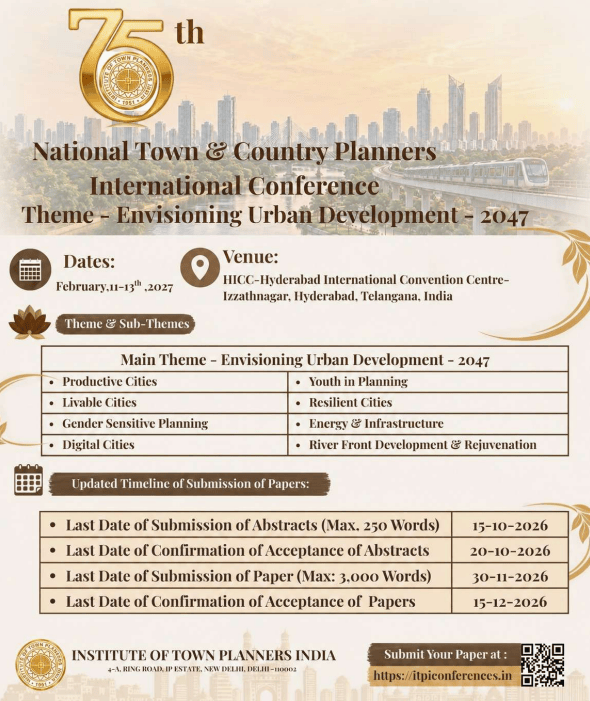
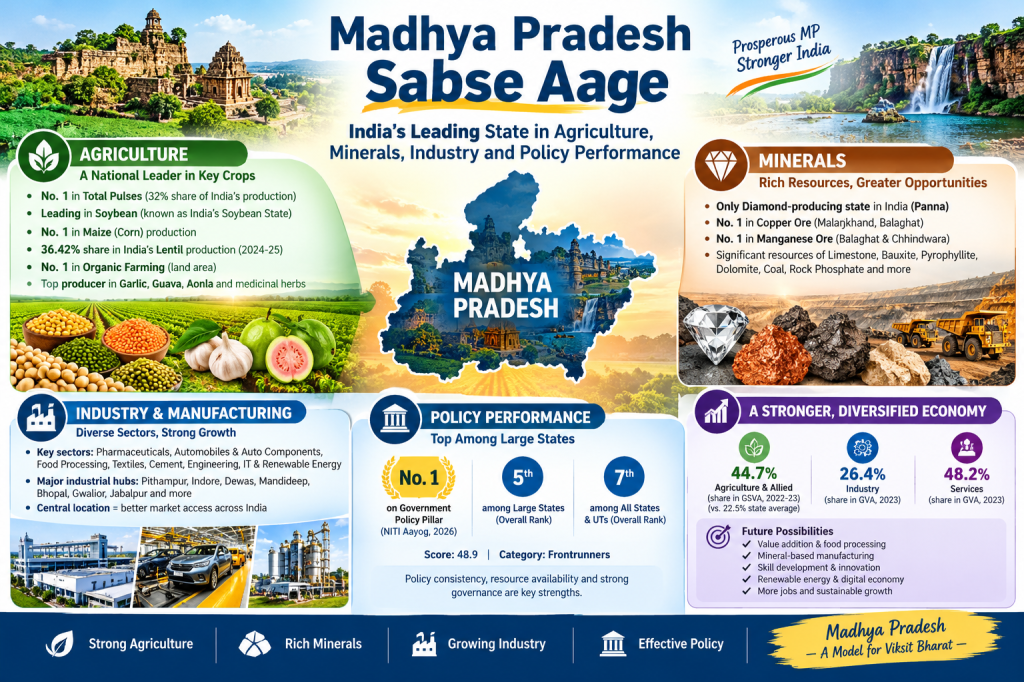




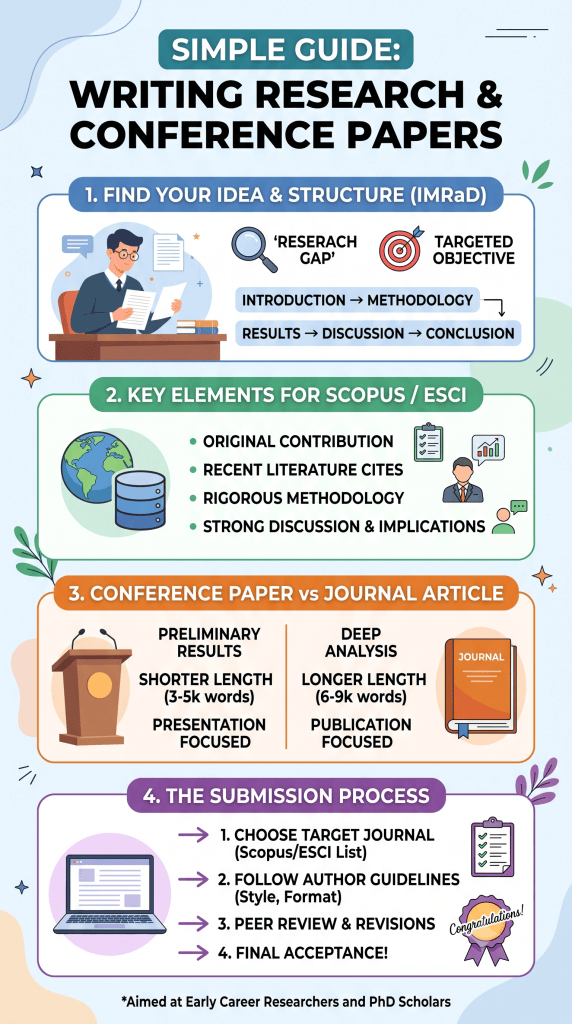


.jpg)
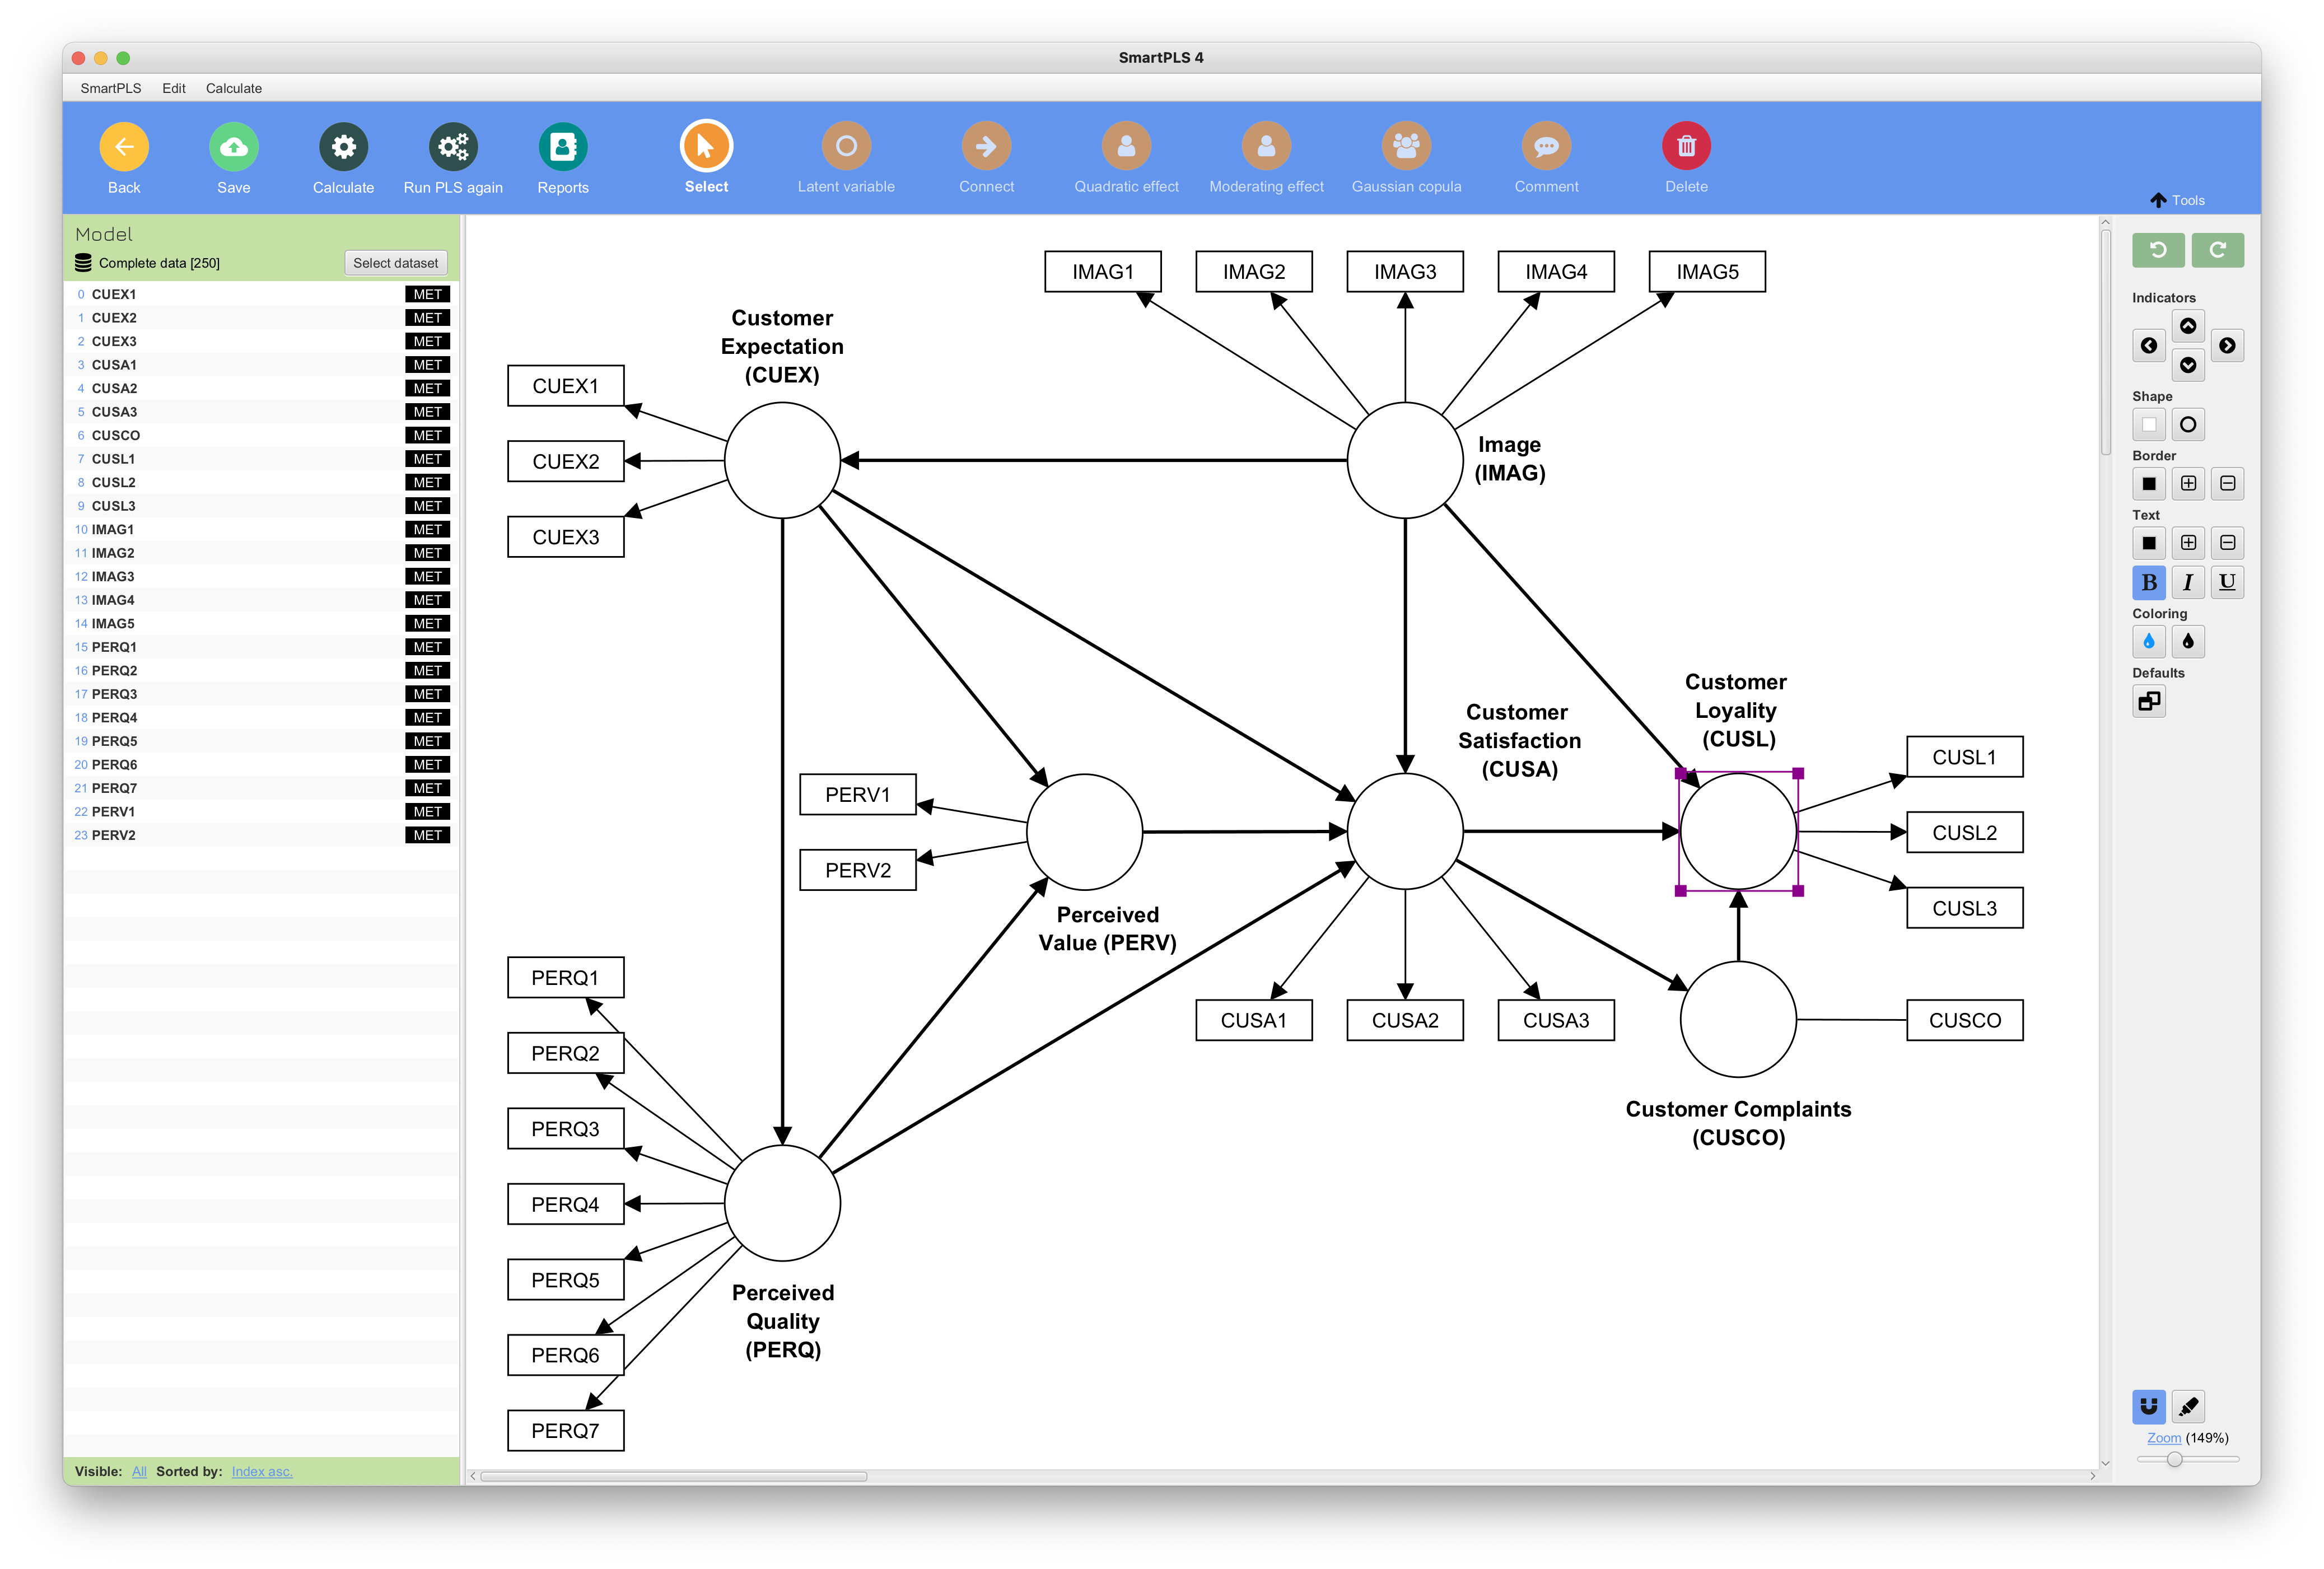
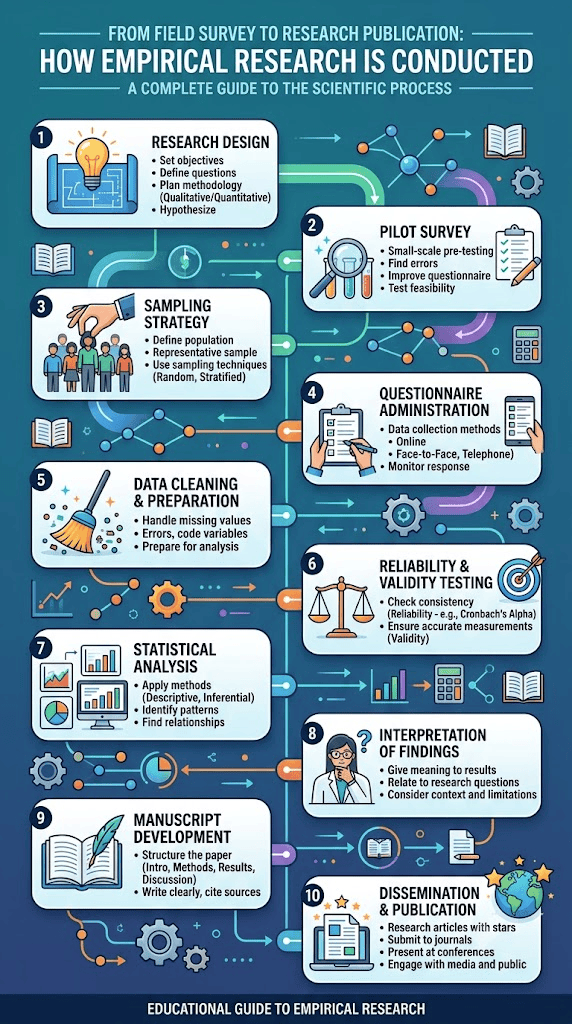
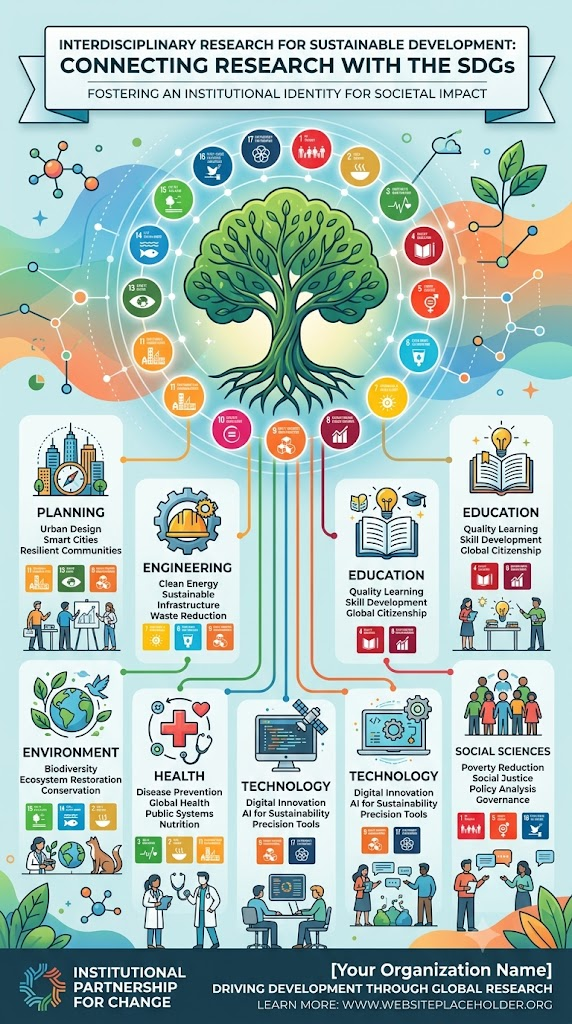
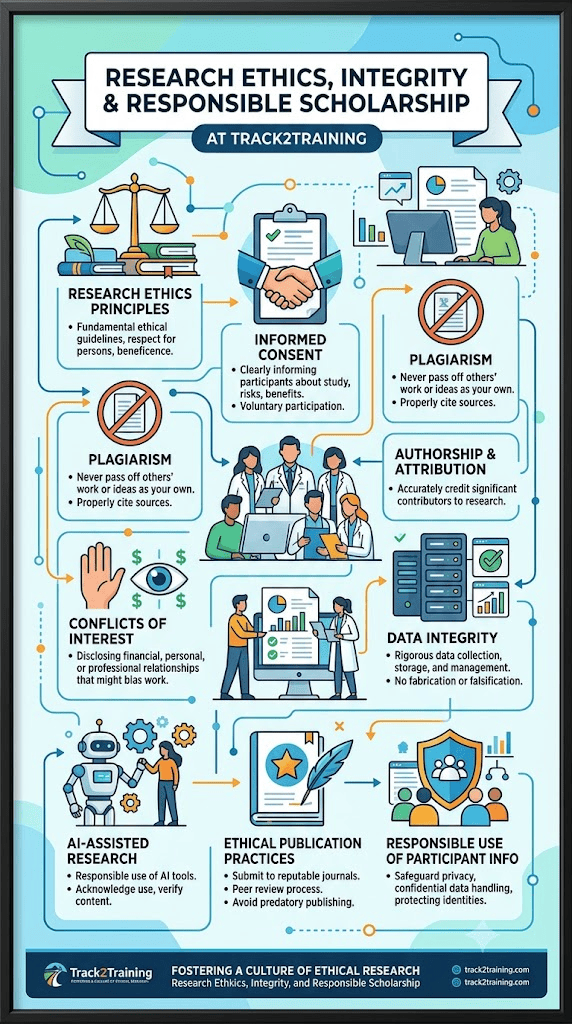
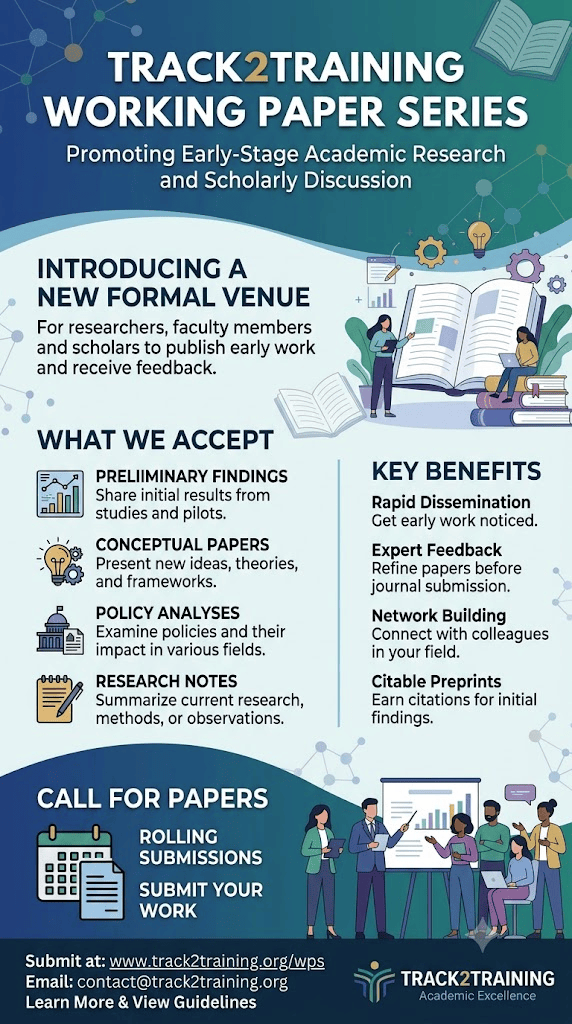
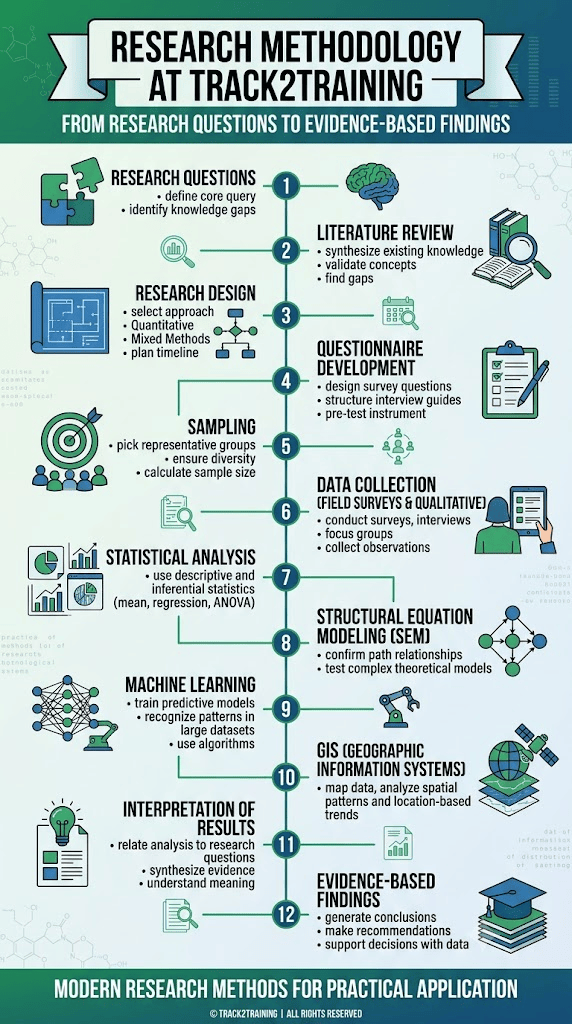
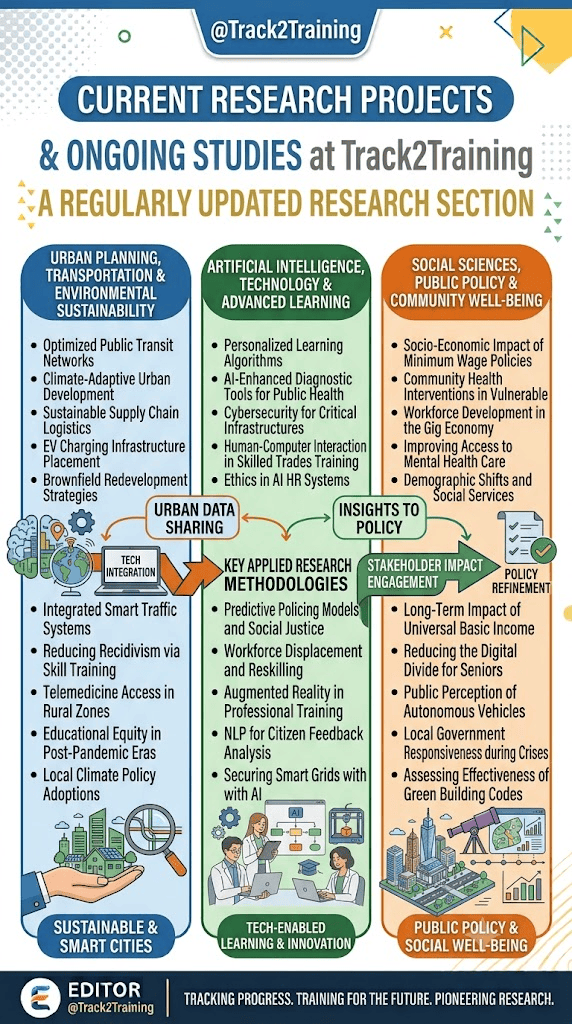
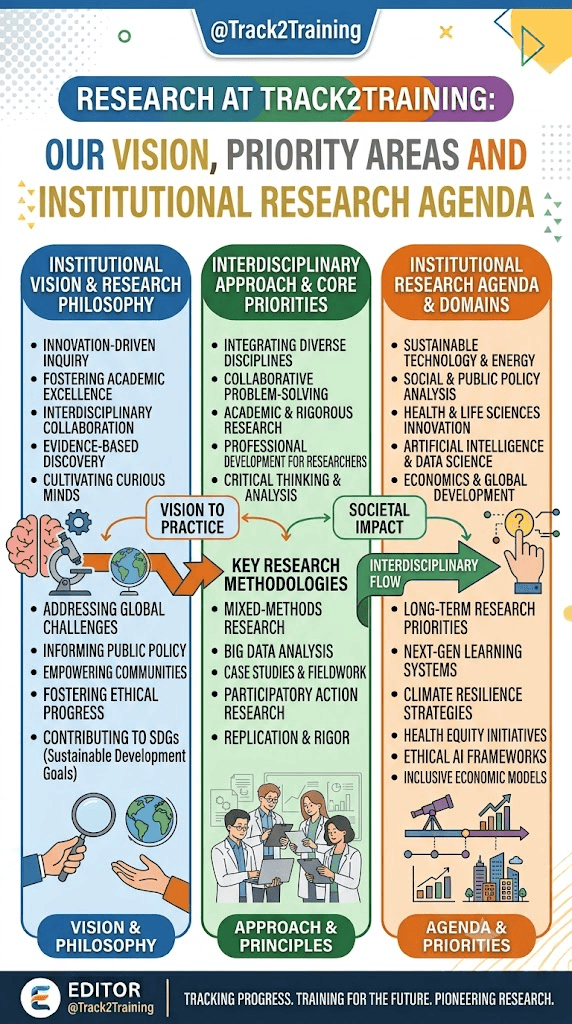
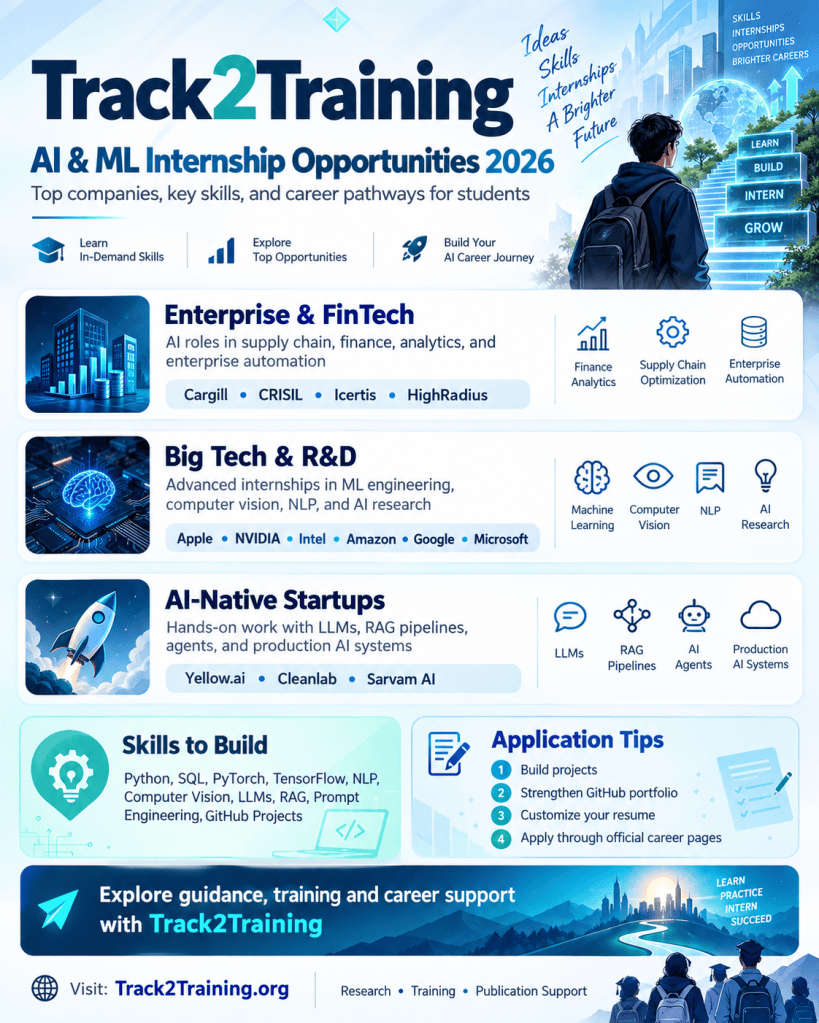
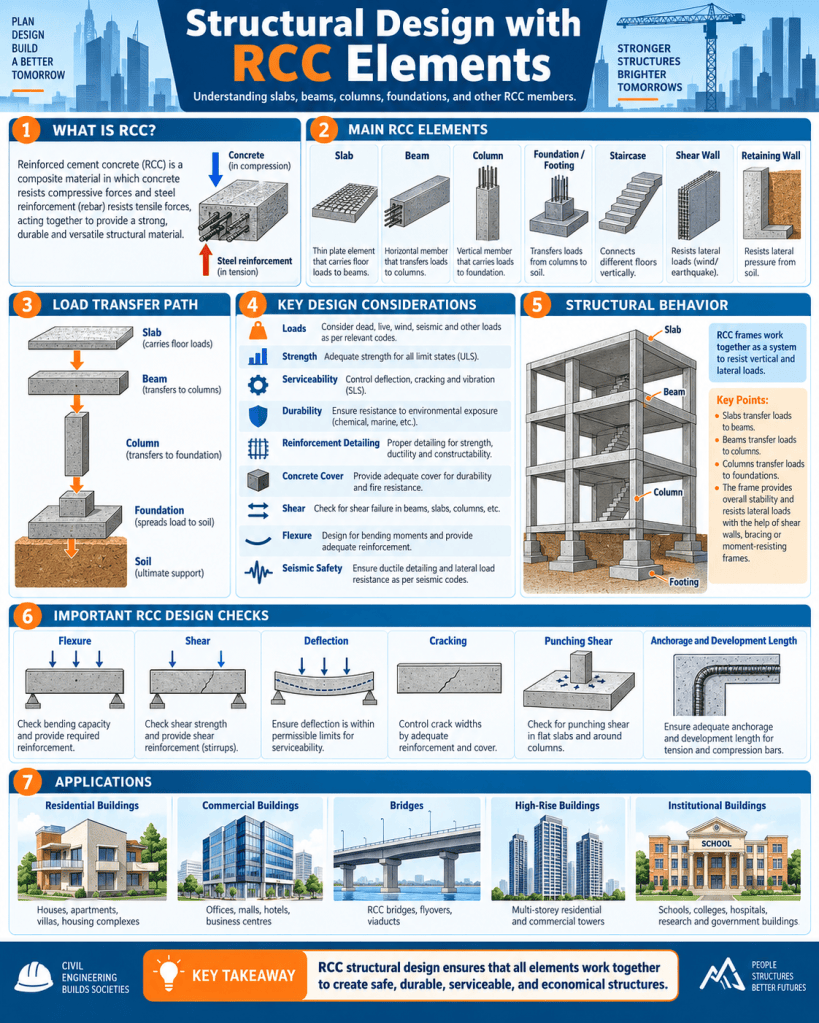
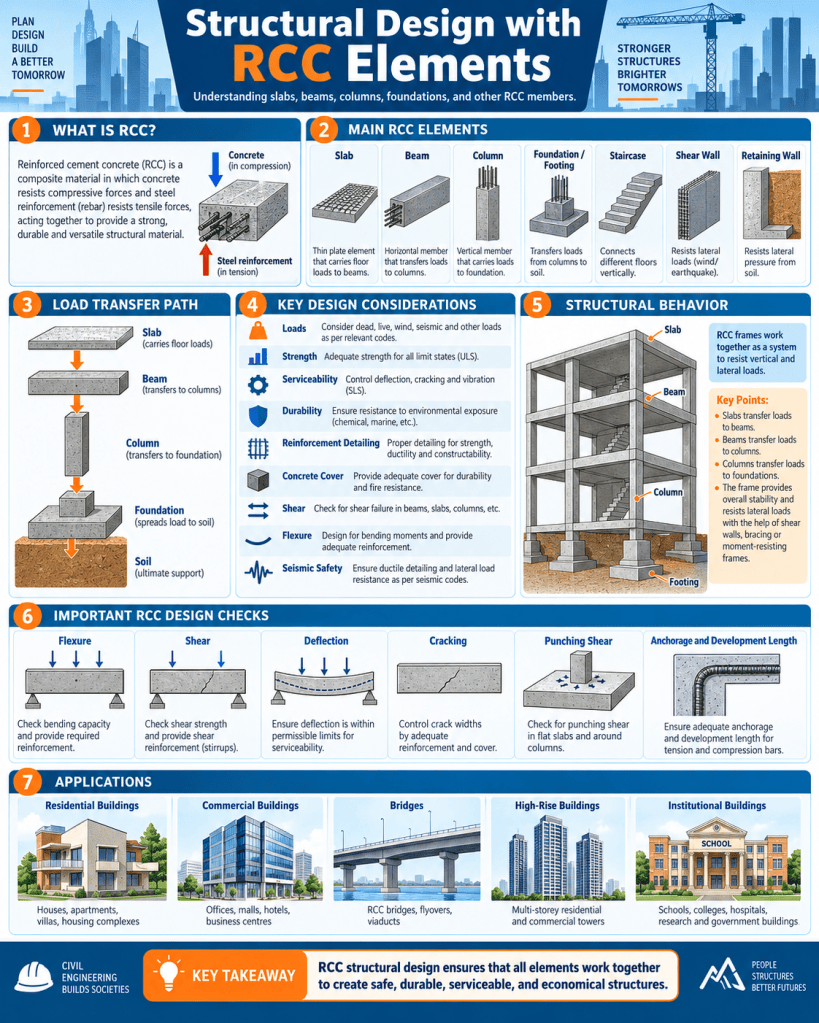













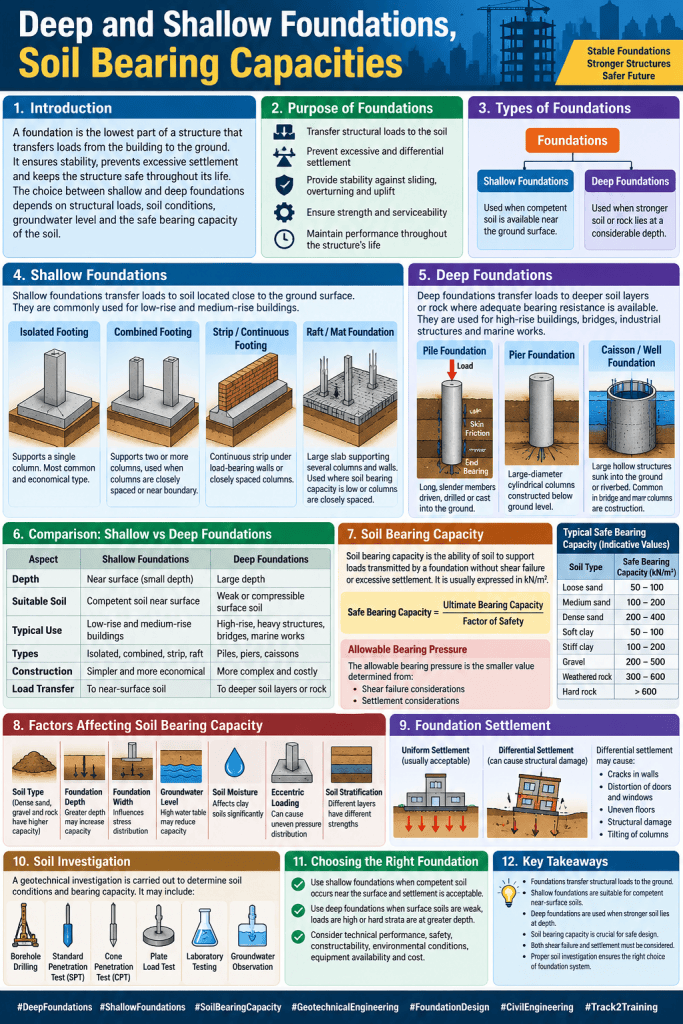


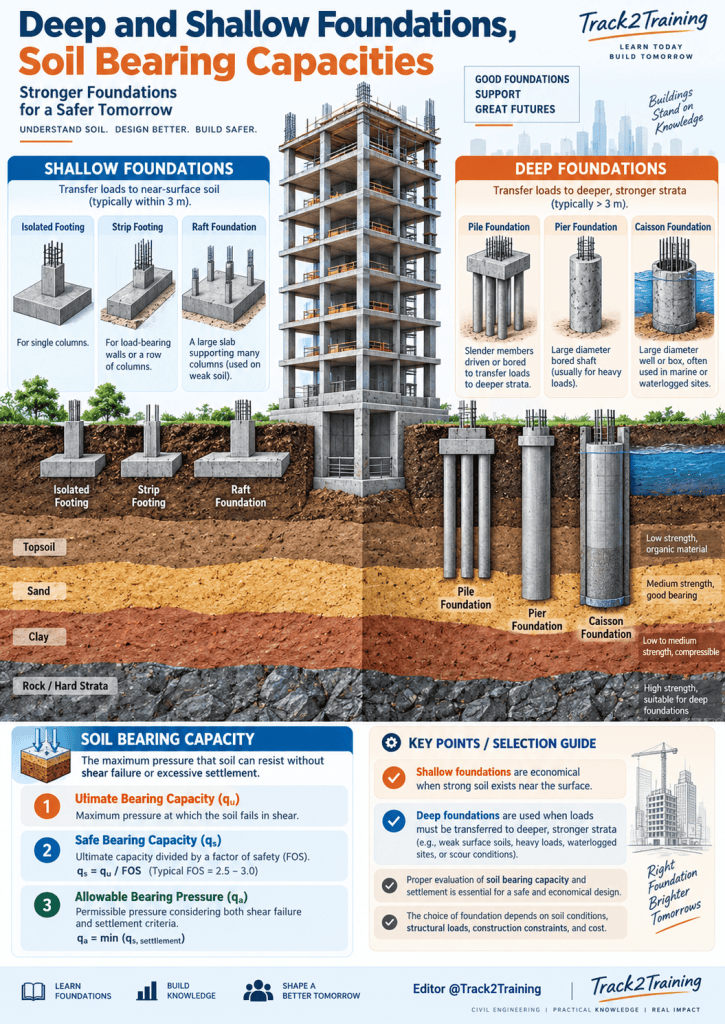





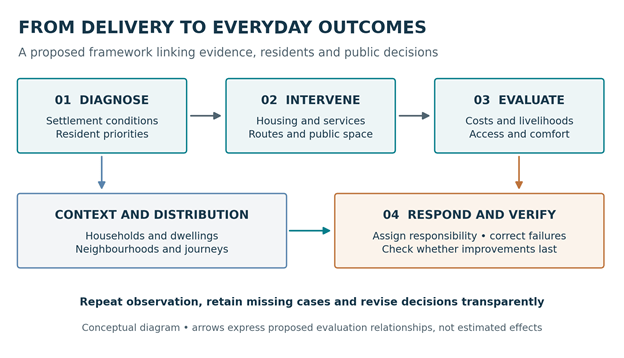
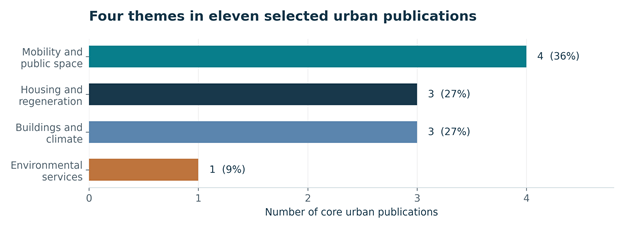
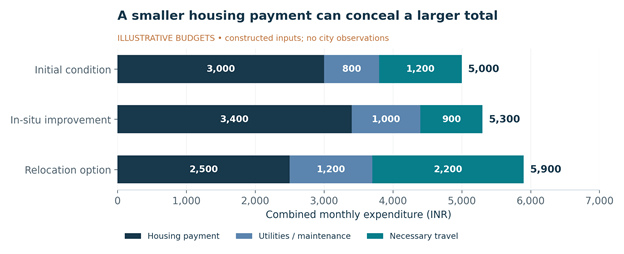
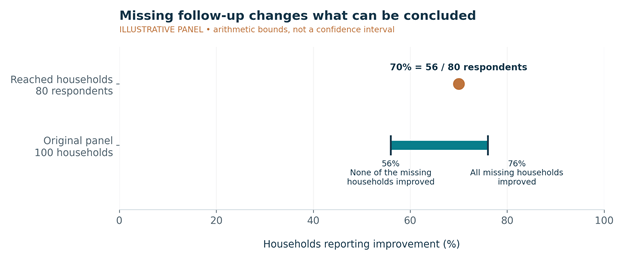
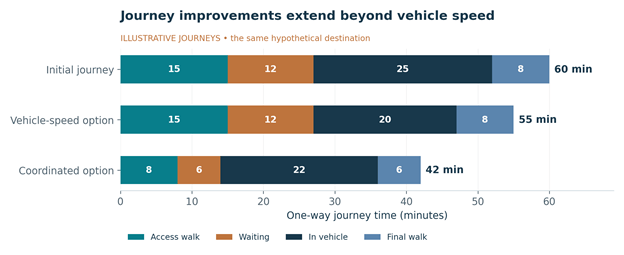
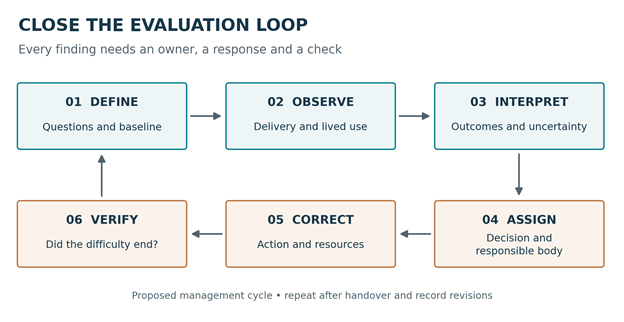


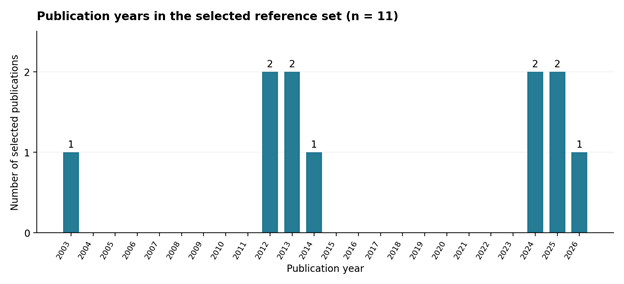
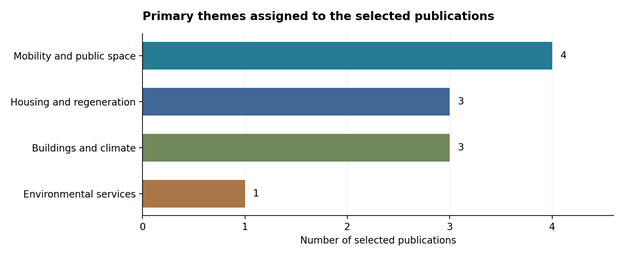






You must be logged in to post a comment.