
rban and regional planning is inherently a multi-scalar and multi-layered process that requires the integration of diverse spatial, economic, social, and environmental considerations. To ensure systematic development, planning activities are organized within a hierarchical framework of plans, where each level addresses specific spatial extents, functional priorities, and implementation mechanisms.
The hierarchy of plans provides a top-down strategic direction while enabling bottom-up implementation, ensuring coherence between macro-level policies and micro-level interventions. This structured approach is essential for achieving sustainable development, efficient land use, infrastructure optimization, and improved quality of life.
In the Indian context, the hierarchy of plans is influenced by legislative frameworks such as the Town and Country Planning Acts of various states, and national guidelines like the URDPFI Guidelines (Urban and Regional Development Plans Formulation and Implementation).
The major levels in the hierarchy include:
- Regional Plan
- Sub-Regional Plan
- Sectoral Plans
- Spatial (Development) Plans
- Town Planning Schemes
Each level differs in scale, scope, detail, and implementation mechanism, but they are interlinked and mutually reinforcing.
2. Concept of Hierarchical Planning
Hierarchical planning refers to a structured system in which plans are prepared at different spatial scales and levels of detail. The key characteristics include:
- Vertical Integration: Ensures alignment between national, regional, and local objectives
- Horizontal Coordination: Integrates sectors such as transport, housing, environment, and economy
- Progressive Detailing: Higher-level plans provide broad strategies, while lower-level plans focus on implementation
This hierarchy is essential to avoid fragmentation, duplication, and inconsistencies in planning decisions.
3. Regional Plan
3.1 Definition and Scope
A Regional Plan is a long-term strategic plan prepared for a large geographical area, typically encompassing multiple cities, towns, and rural areas. It aims to guide the overall spatial and economic development of the region.
3.2 Objectives
- Balanced regional development
- Reduction of inter-regional disparities
- Efficient allocation of resources
- Promotion of economic growth and employment
- Environmental conservation
3.3 Key Components
- Regional land use structure
- Settlement hierarchy (metropolitan cities, towns, villages)
- Transport and infrastructure networks
- Economic development zones
- Environmental and ecological zones
3.4 Time Horizon
Typically 20–25 years, with periodic revisions.
3.5 Example
- National Capital Region (NCR) Regional Plan
3.6 Role in Hierarchy
The regional plan serves as the foundation of the planning hierarchy, providing a macro-level framework within which all lower-level plans must operate.
4. Sub-Regional Plan
4.1 Definition
A Sub-Regional Plan is prepared for a smaller unit within a region, such as a district or group of districts, translating regional strategies into more localized actions.
4.2 Purpose
- Bridge between regional and local plans
- Address area-specific issues
- Provide detailed strategies for development
4.3 Key Features
- Identification of growth centers
- Infrastructure planning at district level
- Resource allocation and prioritization
- Integration of rural and urban development
4.4 Importance
Sub-regional planning is particularly important in large and diverse regions where uniform strategies may not be effective.
4.5 Example
- District Development Plans in various Indian states
4.6 Role in Hierarchy
Acts as an intermediate planning layer, refining regional policies and guiding sectoral and spatial plans.
5. Sectoral Plans
5.1 Definition
Sectoral plans focus on specific sectors such as:
- Transportation
- Housing
- Water supply
- Sanitation
- Environment
- Economic development
5.2 Objectives
- Address sector-specific challenges
- Improve service delivery
- Enhance efficiency and sustainability
5.3 Characteristics
- Thematic and specialized
- Prepared by technical agencies
- Can be standalone or integrated
5.4 Examples
- Comprehensive Mobility Plan (CMP)
- Housing for All Plan
- Water Supply Master Plan
5.5 Role in Hierarchy
Sectoral plans provide technical inputs to spatial and development plans and ensure that sectoral investments align with broader planning goals.
6. Spatial (Development) Plans
6.1 Definition
Spatial plans, often referred to as Master Plans or Development Plans, are statutory documents that guide the physical development and land use of urban areas.
6.2 Objectives
- Regulate land use
- Guide urban growth
- Ensure provision of infrastructure
- Promote orderly development
6.3 Key Components
- Land use zoning (residential, commercial, industrial, etc.)
- Transportation networks
- Public facilities and amenities
- Environmental management
6.4 Legal Status
Spatial plans are typically statutory in nature, meaning they are legally enforceable.
6.5 Time Horizon
Usually 15–20 years
6.6 Importance
They translate broader policies into specific land-use regulations, making them a critical tool for urban governance.
6.7 Role in Hierarchy
Spatial plans act as a link between strategic planning and implementation, incorporating inputs from regional, sub-regional, and sectoral plans.
7. Town Planning Schemes
7.1 Definition
Town Planning Schemes (TPS) are micro-level implementation tools used for the detailed planning and development of specific urban areas.
7.2 Key Features
- Land pooling and reconstitution
- Provision of infrastructure
- Redistribution of land parcels
- Cost recovery mechanisms
7.3 Objectives
- Ensure planned development
- Provide infrastructure efficiently
- Prevent unplanned growth
7.4 Process
- Declaration of scheme area
- Preparation of draft scheme
- Land pooling and redistribution
- Infrastructure development
- Final scheme implementation
7.5 Example
- Town Planning Schemes in Gujarat (e.g., Ahmedabad TPS)
7.6 Role in Hierarchy
TPS represents the lowest level of planning hierarchy, focusing on implementation and execution.
8. Interrelationships Among Different Plans
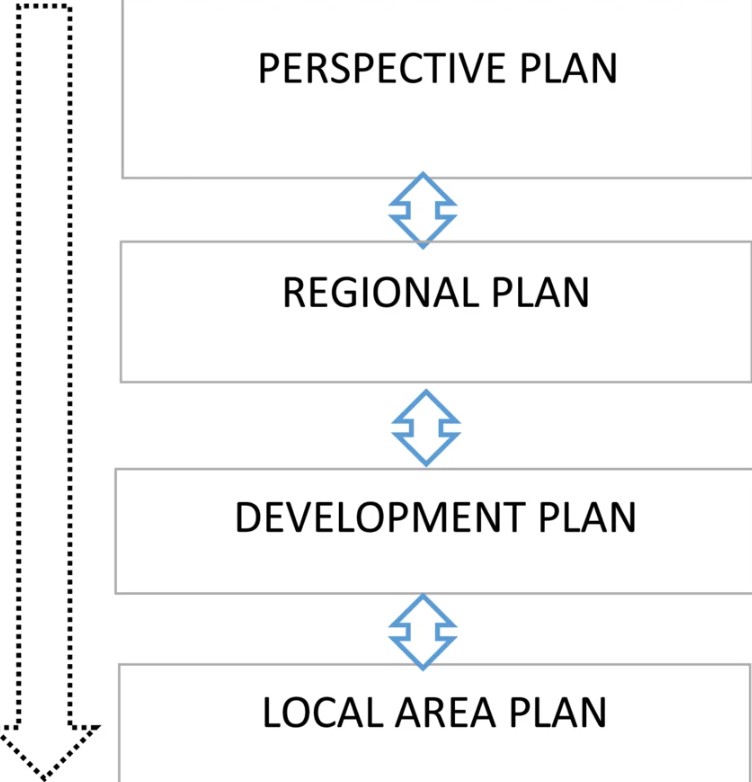
The hierarchy of plans functions through strong interconnections:
8.1 Top-Down Approach
- Regional Plan → Sub-Regional Plan → Spatial Plan → TPS
8.2 Bottom-Up Feedback
- Local-level issues inform higher-level plans
8.3 Integration of Sectoral Plans
- Sectoral plans provide inputs at all levels
8.4 Example
A regional transport strategy influences:
- Sub-regional road networks
- City-level transport plans
- Local street design in TPS
9. Importance of Hierarchical Planning
9.1 Ensures Coordination
Prevents conflicts between different levels of planning.
9.2 Promotes Efficiency
Optimizes use of resources and infrastructure.
9.3 Facilitates Implementation
Provides clear roles and responsibilities.
9.4 Enhances Sustainability
Integrates environmental considerations at all levels.
9.5 Supports Policy Integration
Aligns national, state, and local objectives.
10. Challenges in Hierarchical Planning
Despite its advantages, several challenges exist:
10.1 Lack of Coordination
Fragmentation between agencies and departments.
10.2 Data Limitations
Inadequate or outdated data affects planning accuracy.
10.3 Implementation Gaps
Weak enforcement of plans.
10.4 Political and Institutional Constraints
Frequent policy changes and institutional conflicts.
10.5 Public Participation Issues
Limited stakeholder involvement.
11. Indian Context of Planning Hierarchy
In India, the planning hierarchy is shaped by:
- State Town and Country Planning Acts
- 74th Constitutional Amendment
- URDPFI Guidelines
11.1 Key Observations
- Strong emphasis on Master Plans
- Limited integration of regional planning
- Increasing focus on participatory planning
12. Relevance to Contemporary Planning
12.1 Smart Cities and Integrated Planning
Modern planning emphasizes integration across levels.
12.2 Transit-Oriented Development (TOD)
TOD requires coordination across:
- Regional transport planning
- City-level land use planning
- Local area development
12.3 Sustainability and Climate Change
Hierarchical planning helps address:
- Urban resilience
- Environmental conservation
13. Conclusion
The hierarchy of plans is fundamental to the practice of urban and regional planning. It ensures that development is guided by a coherent framework, balancing strategic vision with practical implementation. Each level—regional, sub-regional, sectoral, spatial, and local—plays a distinct yet interconnected role in shaping sustainable and inclusive urban environments.
In the Indian context, strengthening the integration between these levels, improving institutional coordination, and enhancing public participation are essential for effective planning. As cities face increasing challenges such as rapid urbanization, climate change, and infrastructure deficits, a well-structured hierarchical planning system becomes indispensable.


You must be logged in to post a comment.