Climate-Resilient and Water-Sensitive Urban Development in India: Integrating Land Use, Mobility, Green Infrastructure, Digital Technologies and Inclusive Governance

Dr. Kavita Dehalwar

Abstract

Indian cities are undergoing rapid spatial, demographic, economic, and infrastructural transformation. This transformation is creating opportunities for economic development while simultaneously increasing exposure to heat, flooding, water scarcity, air pollution, mobility stress, infrastructure failure, and social inequality. Climate change intensifies these challenges because urban development frequently occurs through fragmented land-use decisions, increasing impervious surfaces, loss of natural drainage systems, inadequate public transport, encroachment on environmentally sensitive areas, and uneven access to services. Climate resilience therefore cannot be addressed through isolated engineering projects. It requires an integrated planning framework in which land use, housing, mobility, water management, green infrastructure, environmental quality, digital technologies, and social inclusion are considered as interconnected components of the urban system.

This article develops an integrated framework for climate-resilient and water-sensitive urban development in India. It examines the relationship between urban form and climate risk; the role of land-use planning in controlling exposure; water-sensitive urban design; urban green and blue infrastructure; climate-responsive housing; transit-oriented development; first- and last-mile accessibility; sustainable construction; artificial intelligence and spatial modelling; digital twins; participatory planning; and institutional and financial mechanisms for implementation. The discussion draws on research concerning transit-oriented development, land-use transportation interaction, urban growth modelling, green buildings, recycled construction materials, mobility behaviour, accessibility, urban water quality, artificial intelligence, digital twins, and social justice, together with international evidence from the IPCC, UN-Habitat, United Nations and World Bank.

The article argues that resilient urban development should move from a reactive disaster-management model toward a proactive spatial-development model. Rather than treating climate adaptation as an additional layer applied to conventional planning, resilience should become a fundamental criterion for decisions concerning where cities grow, how neighbourhoods are structured, how people move, how water is retained and reused, how buildings are designed, and how infrastructure investments are prioritized. Such an approach can help Indian cities pursue development while simultaneously reducing climate vulnerability, improving accessibility, strengthening ecological systems, and advancing social equity.

Keywords: climate resilience; water-sensitive urban design; Indian cities; urban planning; transit-oriented development; green infrastructure; digital twins; artificial intelligence; land-use transportation interaction; inclusive planning


1. Introduction

Urbanisation is one of the defining spatial processes of the twenty-first century. Cities concentrate employment, education, health services, infrastructure, innovation, markets, and cultural activity, but they also concentrate environmental pressures and social vulnerabilities. The challenge facing contemporary urban planning is therefore not simply to accommodate population growth but to determine how growth can occur without increasing exposure to climate hazards and environmental degradation.

The United Nations identifies inclusive, safe, resilient and sustainable cities as a central component of the Sustainable Development Goals. SDG 11 specifically links adequate housing, sustainable transport, participatory planning, disaster-risk reduction, environmental protection and access to public space. ๎ˆ

The scale of the challenge is substantial. Recent United Nations reporting indicates that more than half of the world’s population lives in urban areas, while approximately 1.1 billion people live in slums or slum-like conditions. The same evidence highlights persistent challenges concerning public transport accessibility, urban sprawl, air pollution and inadequate public spaces. ๎ˆ

Climate change makes these existing urban challenges more complex. The IPCC identifies increasing climate-related risks in cities and settlements and emphasizes that urbanisation, exposure and vulnerability interact with climate hazards. Rapid growth in vulnerability and exposure is particularly important in unplanned and informal settlements, low- and middle-income countries, and smaller and medium-sized urban centres. ๎ˆ

The problem is particularly relevant for India. Indian cities are expanding horizontally and vertically, while infrastructure systems often struggle to keep pace with population growth. The World Bank’s recent assessment of Indian cities argues that the country has an important opportunity to shape future urban growth in a climate-resilient manner because a large proportion of the infrastructure required for future urbanisation has yet to be built. ๎ˆ

This creates a critical planning opportunity. Climate resilience should not be understood only as the ability of an existing city to recover after floods, heatwaves or other disasters. It should also mean the ability to prevent the creation of future risk through better spatial planning. The location of new housing, the conversion of agricultural land, the preservation of wetlands, the alignment of transport corridors, the density of development, the design of streets and the management of stormwater can all influence future vulnerability.

Research on urban growth prediction demonstrates the importance of understanding the spatial consequences of development. Kumar et al. (2025), for example, examined urban growth prediction using a CA-ANN model and spatial analysis for planning policy in Indore. Such approaches demonstrate how spatial modelling can assist planners in anticipating patterns of urban expansion rather than responding only after development has occurred.

Similarly, Sharma and Dehalwar (2025) examined the role of land-use transportation interaction models in smart urban growth management. Land use and mobility are not independent systems: transport infrastructure influences development patterns, while development density and spatial distribution influence travel demand. This interaction is particularly important when planning climate-resilient cities because poorly coordinated development can increase automobile dependence, infrastructure costs, energy consumption and exposure to environmental hazards.

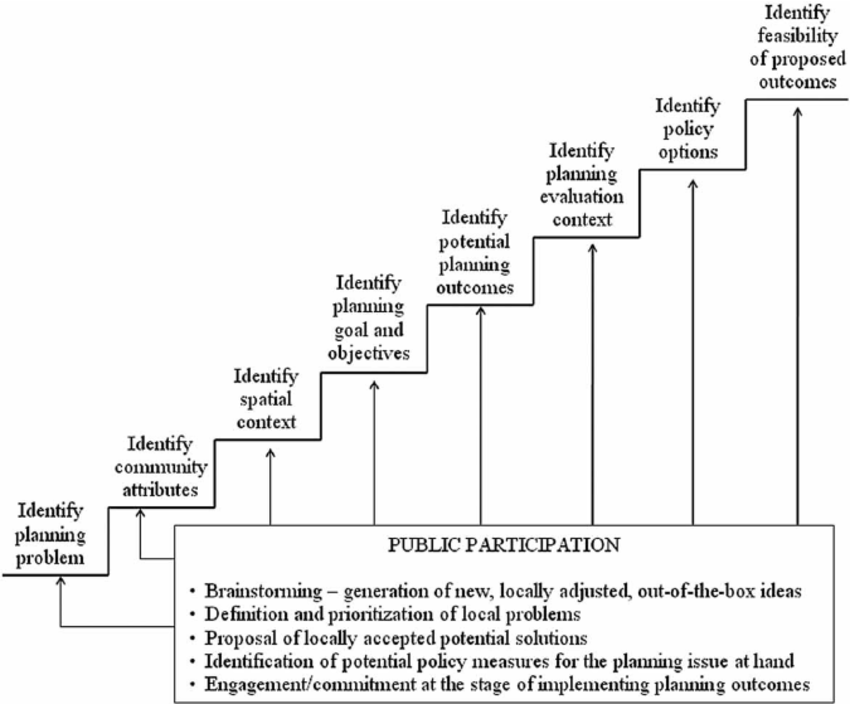
The central argument of this article is therefore that climate-resilient urban development requires integrated spatial planning. It must connect five major systems:

  1. land and urban form;
  2. water and ecological systems;
  3. mobility and transport;
  4. buildings and infrastructure; and
  5. people, institutions and digital technologies.

The objective is not to prescribe a single model for all Indian cities. Rather, it is to develop a planning framework that can be adapted to different geographical and socio-economic contexts.


2. From Conventional Urban Planning to Climate-Resilient Development

Traditional urban planning has often separated land use, transportation, housing, infrastructure, environment and disaster management into different sectors. This administrative separation can produce technically competent projects that nevertheless create problems elsewhere in the urban system.

For example, widening a road may improve vehicular capacity in the short term but encourage development along the corridor, increase impervious surfaces and generate additional traffic. Constructing a flood wall may protect one locality while transferring water-related risk to another. Replacing natural drainage channels with underground stormwater infrastructure may increase development capacity in the short term while reducing ecological storage. Expanding low-density housing into peripheral areas may provide additional housing but increase commuting distances and infrastructure costs.

The IPCC emphasizes precisely this interconnectedness. Urban morphology, infrastructure, land use, building design, transport, water systems and ecosystem services interact in determining climate risk. Urban expansion and the loss of green infrastructure can reduce adaptive capacity and increase exposure. ๎ˆ

UN-Habitat similarly describes urban resilience as an interconnected condition involving communities, markets, ecosystems, infrastructure and technology rather than a narrowly defined engineering characteristic. ๎ˆ

This suggests a shift from project-based resilience to system-based resilience.

2.1 Project-based resilience

A project-based approach generally asks:

  • How can flooding be controlled?
  • How can roads be widened?
  • How can buildings be cooled?
  • How can drainage capacity be increased?
  • How can emergency response be improved?

These questions remain important, but they are often addressed independently.

2.2 System-based resilience

A system-based approach instead asks:

  • Why is development occurring in flood-prone areas?
  • Why is runoff increasing?
  • How does road construction change land use?
  • How does density affect water demand?
  • How does transport accessibility affect housing location?
  • Which groups are most exposed?
  • How can green infrastructure provide several benefits simultaneously?
  • How can digital systems support integrated decision-making?

This approach recognizes that resilience is produced through the cumulative interaction of planning decisions.


3. Urban Growth and the Spatial Production of Climate Risk

Urban climate risk is not simply a natural phenomenon. A rainfall event becomes a disaster partly because of how land has been developed, where people live, how drainage systems have been designed and how emergency access is organized.

The IPCC reports that urbanisation can generate vulnerability and exposure that combine with climate hazards to create risk. It further identifies unplanned expansion, including peri-urban development, as an important driver of risk. ๎ˆ

This perspective is highly relevant to Indian cities, where peripheral development frequently occurs faster than infrastructure provision.

3.1 Urban sprawl

Urban sprawl can create several climate-related problems:

  • conversion of agricultural and ecological land;
  • increasing travel distances;
  • dependence on private vehicles;
  • higher infrastructure costs;
  • fragmentation of natural drainage;
  • greater stormwater runoff;
  • loss of vegetation;
  • increased energy consumption; and
  • uneven access to employment and services.

The problem is not simply that cities become larger. Rather, the spatial structure of growth determines whether expansion produces efficient and resilient urban systems.

3.2 Urban growth modelling

Spatial models can assist planning authorities in evaluating alternative growth scenarios. Cellular automata, artificial neural networks, remote sensing and GIS can identify patterns of development and simulate potential future expansion.

Kumar et al. (2025) demonstrated the relevance of CA-ANN modelling and spatial analysis for predicting urban growth and supporting planning policy in Indore. Such approaches can be expanded to include climate variables.

For example, a future urban-growth model could incorporate:

  • elevation;
  • slope;
  • flood susceptibility;
  • proximity to water bodies;
  • drainage networks;
  • vegetation;
  • road accessibility;
  • public transport;
  • employment centres;
  • population density;
  • land value; and
  • infrastructure capacity.

The resulting model would not merely predict where development is likely to occur. It could evaluate whether those locations are desirable from a climate-resilience perspective.

3.3 Land-use transportation interaction

The relationship between land use and transportation is equally important. Sharma and Dehalwar (2025) reviewed land-use transportation interaction models in the context of smart urban growth management. The key planning implication is that transport investments and land development should be coordinated.

A new high-capacity transport corridor can influence land values, density and development intensity. If planned appropriately, this can support compact, mixed-use and transit-oriented development. If poorly planned, it can encourage speculative development, congestion and uncontrolled peripheral expansion.


4. Water-Sensitive Urban Development

Water is one of the most important dimensions of climate-resilient urban planning. Indian cities face both extremes: intense rainfall and flooding in some periods and water scarcity in others.

A conventional urban drainage approach generally seeks to remove rainfall as rapidly as possible. A water-sensitive approach instead seeks to retain, infiltrate, treat, reuse and safely convey water within the urban system.

This represents a conceptual shift:

From โ€œdrain water awayโ€ to โ€œmanage water as an urban resource.โ€

4.1 Components of water-sensitive planning

A water-sensitive urban system can include:

  • rainwater harvesting;
  • permeable pavements;
  • bioswales;
  • rain gardens;
  • detention ponds;
  • retention ponds;
  • constructed wetlands;
  • urban forests;
  • restored streams;
  • green roofs;
  • wastewater reuse;
  • decentralized treatment;
  • groundwater recharge;
  • floodable public spaces; and
  • integrated stormwater management.

These measures should not be considered decorative environmental additions. They can become part of the city’s basic infrastructure.

4.2 Permeable surfaces

The replacement of conventional impermeable surfaces with permeable materials can reduce surface runoff and support groundwater recharge where soil and groundwater conditions permit.

Sharma et al. (2026) examined advanced materials for permeable paving, biocrete and piezoelectric materials in walkways to transit stations. Such research illustrates how infrastructure materials can be considered simultaneously in terms of environmental performance, mobility and technological innovation.

Similarly, Sharma et al. (2024) examined the life-cycle assessment of recycled and secondary materials in road construction. Life-cycle thinking is important because climate-resilient infrastructure should not be evaluated solely according to initial construction cost. Embodied energy, material extraction, durability, maintenance and end-of-life impacts also matter.

4.3 Urban wetlands and blue infrastructure

Urban water bodies, wetlands, streams and floodplains should be considered infrastructure.

Their functions can include:

  • flood storage;
  • groundwater recharge;
  • biodiversity conservation;
  • temperature regulation;
  • recreation;
  • landscape enhancement;
  • pollution reduction; and
  • ecological connectivity.

The destruction of these systems often creates long-term infrastructure liabilities. Once wetlands are filled or drainage channels are encroached upon, cities must compensate through increasingly expensive engineered systems.

4.4 Water quality and public health

Water resilience must also address water quality. Sharma, Dehalwar and Pandey (2026) examined measures for managing urban water quality for public health. This relationship is important because climate change can increase the risk of contamination during flooding and place additional pressure on water-treatment systems.

A water-sensitive city should therefore manage the complete water cycle:

rainfall โ†’ capture โ†’ storage โ†’ treatment โ†’ distribution โ†’ consumption โ†’ wastewater treatment โ†’ reuse/recharge.


5. Green and Blue Infrastructure as Urban Climate Infrastructure

Urban green infrastructure includes trees, parks, green corridors, wetlands, urban forests, green roofs and other vegetated systems. Blue infrastructure includes rivers, lakes, ponds, wetlands, canals and other water systems.

Together, these systems can form an ecological network.

The IPCC notes that urban expansion and degradation of green infrastructure can increase climate risk, while urban form can influence local temperatures and runoff. ๎ˆ

5.1 Urban heat mitigation

Vegetation can provide shade and evapotranspiration, while appropriately designed green spaces can improve outdoor thermal conditions.

However, simply increasing the number of parks is insufficient. The location, accessibility, species selection, canopy structure, water availability and maintenance regime all influence performance.

A climate-resilient green infrastructure strategy should prioritize:

  • high heat-exposure areas;
  • pedestrian routes;
  • schools;
  • hospitals;
  • public transport stops;
  • informal settlements;
  • dense residential areas; and
  • areas with limited private open space.

5.2 Public open spaces and mobility

Lalramsangi et al. (2025) examined route choices for accessing public open spaces in hill cities. Their work reinforces the importance of accessibility in evaluating public spaces.

A park cannot provide equitable climate benefits if vulnerable populations cannot reach it safely.

Thus, green infrastructure planning should be integrated with pedestrian and public transport networks.

5.3 Green corridors

Green corridors can connect:

  • parks;
  • water bodies;
  • neighbourhoods;
  • transit stations;
  • institutional areas;
  • ecological habitats; and
  • pedestrian and cycling networks.

Such corridors can simultaneously support biodiversity, recreation, active mobility and climate adaptation.


6. Climate-Resilient Housing and Neighbourhood Design

Housing is a central component of climate resilience because exposure is determined partly by where and how people live.

The United Nations identifies adequate, safe and affordable housing as a fundamental component of SDG 11. ๎ˆ

Climate-resilient housing should address:

  • heat;
  • flooding;
  • ventilation;
  • water availability;
  • sanitation;
  • energy demand;
  • structural safety;
  • accessibility;
  • affordability; and
  • social connectivity.

6.1 Passive design

Passive design can reduce dependence on mechanical cooling.

Important principles include:

  • orientation;
  • shading;
  • cross-ventilation;
  • appropriate window-to-wall ratios;
  • thermal insulation;
  • roof treatment;
  • courtyards;
  • vegetation;
  • daylighting; and
  • locally appropriate materials.

The most appropriate combination differs by climate zone.

6.2 Neighbourhood-scale resilience

Buildings should not be evaluated independently from their surroundings.

A climate-resilient neighbourhood requires:

  • shaded streets;
  • accessible public spaces;
  • drainage;
  • safe pedestrian routes;
  • emergency access;
  • nearby services;
  • public transport;
  • water infrastructure; and
  • community facilities.

This makes neighbourhood planning as important as building design.

6.3 Informal settlements

Informal settlements frequently face overlapping vulnerabilities: insecure tenure, inadequate drainage, poor-quality housing, limited water supply and limited access to emergency services.

The IPCC identifies informal and unplanned settlements as important locations of increasing climate vulnerability, particularly where adaptive capacity is limited. ๎ˆ

Consequently, climate adaptation should not rely exclusively on relocation. Depending on local conditions, upgrading may include:

  • drainage improvement;
  • water and sanitation;
  • street paving;
  • tree planting;
  • heat reduction;
  • housing improvement;
  • emergency access;
  • tenure security; and
  • improved public transport.

Dehalwar and Sharma (2023), in their analysis of slums in Bhopal, highlight the importance of understanding informal settlements through the combined dimensions of struggle, vulnerability and resilience rather than viewing them solely as spatial problems.


7. Transit-Oriented Development as a Climate Strategy

Transportation is simultaneously a mobility system, a land-use system and an environmental system.

Transit-oriented development (TOD) can contribute to climate-resilient urban development when it combines:

  • compact development;
  • mixed land uses;
  • public transport;
  • walking;
  • cycling;
  • reduced automobile dependence;
  • accessible public spaces; and
  • efficient infrastructure.

Sharma, Kumar and Dehalwar (2024) discussed the precursors of transit-oriented development, while Sharma and Dehalwar (2025) reviewed the relationship between TOD and economic development.

The climate significance of TOD is not limited to emissions reduction. Compact development can also reduce infrastructure duplication and shorten travel distances.

7.1 Density and accessibility

Density by itself is not a sufficient planning objective. High density without infrastructure can increase heat, congestion and environmental pressure.

The relevant concept is accessible density: density supported by transport, public space, water, sanitation, energy and social infrastructure.

7.2 Mixed land use

Mixed-use neighbourhoods can reduce the need for long-distance travel by bringing employment, retail, education and services closer to residents.

This can support:

  • walking;
  • cycling;
  • public transport;
  • shorter trips; and
  • more efficient use of infrastructure.

7.3 Transit stations as climate-resilient nodes

Transit stations can become multifunctional resilience nodes.

A station area may integrate:

  • public transport;
  • shaded pedestrian infrastructure;
  • bicycle facilities;
  • green space;
  • rainwater management;
  • public services;
  • emergency communication; and
  • commercial activity.

This creates a more integrated relationship between transport infrastructure and climate adaptation.


8. First- and Last-Mile Connectivity

A major weakness of many transit systems is the gap between the station and the traveller’s actual origin or destination.

Yadav, Dehalwar and Sharma (2025) reviewed factors affecting first- and last-mile accessibility in TOD. Their research highlights that transit accessibility depends on more than the presence of a station.

Relevant factors include:

  • walking distance;
  • street connectivity;
  • safety;
  • weather;
  • land use;
  • pedestrian infrastructure;
  • cycling;
  • feeder services;
  • affordability;
  • accessibility for older persons and persons with disabilities; and
  • perceived comfort.

Yadav et al. (2025) further examined user satisfaction with last-mile connectivity in Tier-2 Indian cities from a climate-sensitive perspective.

This is especially important in Indian cities because extreme heat, intense rainfall and poor pedestrian infrastructure can discourage walking even when distances are theoretically short.

8.1 Climate-sensitive accessibility

Accessibility planning should therefore incorporate environmental exposure.

A 700-metre walking route is not equivalent under:

  • shaded and tree-lined conditions;
  • exposed concrete pavement;
  • intense summer heat;
  • heavy rainfall;
  • poor drainage; or
  • unsafe pedestrian conditions.

Accessibility metrics should consequently move beyond distance and include thermal comfort, shade, drainage, safety and route quality.


9. Public Transport User Satisfaction and Inclusive Mobility

Transport resilience is also social resilience.

Lodhi, Jaiswal and Sharma (2024) examined bus-user satisfaction using discrete choice models in Bhopal. Such research demonstrates the importance of understanding mobility from the user’s perspective rather than evaluating transport systems solely through infrastructure indicators.

A resilient transport system should be:

  • affordable;
  • reliable;
  • safe;
  • accessible;
  • comfortable;
  • legible;
  • connected; and
  • adaptable to extreme weather.

Sharma and Dehalwar (2025) also examined the inclusivity of India’s National Urban Transport Policy for senior citizens. This highlights the need to recognize different user groups in transport planning.

Women, children, older persons, persons with disabilities, low-income workers and informal-sector workers may experience the same transport network differently.

Consequently, resilience indicators should be disaggregated by social group wherever appropriate.


10. Road Safety and Climate Resilience

Road safety is sometimes treated separately from climate adaptation, but the two systems interact.

Extreme rainfall can reduce visibility and traction. Flooding can obstruct roads. Heat can affect pavement conditions. Poorly planned emergency routes can delay evacuation.

Sharma, Singh and Dehalwar (2024) examined surrogate safety analysis and the use of advanced technologies for safer roads. Such approaches can complement traditional crash-based safety analysis by identifying potentially hazardous interactions.

Climate-resilient mobility planning should therefore integrate:

  • road safety;
  • flood susceptibility;
  • emergency accessibility;
  • pedestrian safety;
  • public transport;
  • traffic management; and
  • real-time information.

Automatic traffic counters, speed radar systems, GPS devices and traffic simulation platforms can support this process. PTV VISSIM and VISUM, for example, can be used to examine traffic and network scenarios where appropriate.


11. Green Buildings and Sustainable Neighbourhoods

Buildings represent a major component of urban energy demand and material consumption.

Sharma et al. (2025) examined the role of green buildings in creating sustainable neighbourhoods. The neighbourhood perspective is particularly important because building performance is influenced by surrounding urban form.

A green building surrounded by poorly designed streets and infrastructure may still produce significant environmental impacts.

11.1 Building-level strategies

Climate-responsive buildings can incorporate:

  • passive cooling;
  • natural ventilation;
  • solar energy;
  • energy-efficient appliances;
  • rainwater harvesting;
  • wastewater reuse;
  • low-carbon materials;
  • thermal insulation;
  • green roofs; and
  • efficient lighting.

11.2 Neighbourhood-level strategies

At the neighbourhood scale, planning can coordinate:

  • building orientation;
  • street geometry;
  • tree canopy;
  • open spaces;
  • water infrastructure;
  • renewable energy;
  • public transport; and
  • waste management.

This can generate cumulative benefits that individual building certification cannot achieve alone.


12. Circular Construction and Low-Carbon Infrastructure

Climate-resilient urban development must consider not only operational emissions but also construction materials.

The construction sector consumes substantial quantities of raw materials. Roads, buildings, drainage systems and public spaces therefore create long-term material footprints.

Sharma et al. (2024) examined life-cycle assessment of recycled and secondary materials in road construction. Life-cycle assessment can help planners compare alternatives according to environmental impacts over the entire material cycle.

A circular urban infrastructure strategy can prioritize:

  • recycled aggregates;
  • secondary construction materials;
  • material reuse;
  • design for disassembly;
  • local materials;
  • low-carbon concrete alternatives;
  • construction waste recovery; and
  • long-life infrastructure.

The principle should be:

build less wastefully, maintain better, reuse more, and replace only when necessary.


13. Artificial Intelligence for Climate-Resilient Urban Planning

Artificial intelligence can enhance urban planning by processing large and complex datasets.

Potential applications include:

  • urban growth prediction;
  • flood-risk mapping;
  • traffic forecasting;
  • travel-demand modelling;
  • infrastructure monitoring;
  • land-use classification;
  • heat-risk mapping;
  • water-demand prediction;
  • energy forecasting;
  • waste management; and
  • emergency response.

Sharma, Dehalwar, Jain and Pandey (2025) examined applications and prospects of AI tools in solid waste management. Ogbanga et al. (2025) explored artificial intelligence in social work and environmental sustainability. These studies demonstrate that AI applications increasingly extend beyond conventional engineering into social and environmental systems.

13.1 AI and urban growth

CA-ANN models can combine spatial relationships and machine-learning techniques to predict urban expansion. Such models could be extended by integrating climate-risk layers.

For example:

Urban growth suitability = f(accessibility, land value, existing development, infrastructure, elevation, flood risk, ecological sensitivity, climate exposure).

This can help planners identify locations where development is both economically feasible and environmentally appropriate.

13.2 AI and mobility

Yadav, Dehalwar and Sharma (2025/2026) proposed a user-centric machine-learning framework for predicting multimodal accessibility in TOD zones in Tier-2 Indian cities.

Such approaches can help shift mobility planning from infrastructure supply toward user-centred accessibility.

Sharma, Dehalwar and Yadav (2026) also examined advances in AI-based mobility modelling, demonstrating the growing potential for intelligent transport infrastructure.


14. Digital Twins and Urban Resilience

Digital twins represent another emerging opportunity.

A digital twin can integrate spatial, infrastructure, environmental and operational data to create a dynamic digital representation of an urban system.

Potential applications include:

  • flood simulation;
  • traffic management;
  • infrastructure monitoring;
  • energy modelling;
  • land-use scenario analysis;
  • emergency planning;
  • asset management; and
  • climate adaptation.

Sharma, Dehalwar and Yadav (2026) examined urban spatial digital twins in relation to sustainability and economic growth in TOD-based development.

The importance of digital twins lies not merely in creating a sophisticated visual model. Their value comes from connecting data to decisions.

14.1 From static GIS to dynamic urban intelligence

Traditional GIS may answer:

Where is the drainage network?

A digital twin could support a more complex question:

What happens to traffic, drainage, pedestrian movement and emergency accessibility if a particular rainfall event occurs while a major transport corridor is disrupted?

This represents a transition from descriptive mapping to scenario-based planning.

14.2 Digital twins and participatory planning

Digital twins should not be restricted to technical experts. Simplified visual interfaces can help communities understand proposed changes.

For example, residents could compare:

  • current development;
  • high-density development;
  • green infrastructure scenarios;
  • flood-risk scenarios; and
  • alternative transport networks.

This could make technical planning information more accessible.


15. People-Centred Smart Cities

Smart-city development should not equate technological sophistication with urban quality.

UN-Habitat’s World Smart Cities Outlook 2024 explicitly approaches smart-city development through a people-centred framework, examining technology in relation to sustainability, resilience, equity, social inclusion, accessibility and quality of life. ๎ˆ

This is important because digital technologies can also create exclusion.

Potential problems include:

  • digital divides;
  • unequal access to smartphones and internet services;
  • algorithmic bias;
  • lack of digital skills;
  • privacy concerns;
  • exclusion of digitally marginalized groups; and
  • dependence on proprietary systems.

A resilient smart city therefore needs both technological infrastructure and social capacity.


16. Participatory Planning and Local Knowledge

Climate resilience cannot be designed exclusively through top-down technical planning.

Residents possess knowledge about:

  • recurring flooding;
  • water shortages;
  • unsafe streets;
  • inaccessible transport;
  • local drainage;
  • heat exposure;
  • vulnerable households; and
  • informal coping systems.

Sharma (2012) examined participatory planning in plan preparation, highlighting the role of participation in planning processes.

Jain, Dehalwar and Sharma (2024) discussed Delphi research and expert-opinion surveys, demonstrating another mechanism through which expert knowledge can contribute to planning decisions.

A robust planning process can combine:

scientific data + professional expertise + local knowledge + community participation.

16.1 Participatory climate mapping

Community members can contribute to mapping:

  • flood locations;
  • waterlogging;
  • heat exposure;
  • unsafe routes;
  • inaccessible facilities;
  • damaged infrastructure; and
  • areas lacking shade.

This information can complement satellite imagery and municipal datasets.

16.2 Social justice

Climate resilience must also consider who receives protection and who bears costs.

Dehalwar and Sharma (2024) examined social injustice associated with spatial changes in vernacular settings. Their work reinforces the broader point that spatial transformation can produce uneven social consequences.

A resilience project should therefore ask:

  • Who benefits?
  • Who pays?
  • Who is displaced?
  • Who gains access?
  • Who loses access?
  • Which neighbourhoods receive investment?
  • Which groups participate in decision-making?

These are planning questions, not merely social-policy questions.


17. Gender, Social Inclusion and Resilience

Climate risks are socially differentiated.

Women, older persons, children, persons with disabilities, low-income residents, migrants and residents of informal settlements may experience climate hazards differently.

The World Cities Report 2024 emphasizes that climate change can exacerbate existing inequalities and that marginalized groups often have fewer resources with which to respond to impacts. ๎ˆ

This suggests that climate-resilient planning should incorporate social vulnerability mapping.

Possible indicators include:

  • age;
  • income;
  • disability;
  • housing quality;
  • access to transport;
  • access to healthcare;
  • access to water;
  • distance to emergency facilities; and
  • tenure conditions.

The objective should not be to label communities as vulnerable but to identify where public investment can reduce structural exposure.


18. Ruralโ€“Urban and Peri-Urban Resilience

Urban resilience cannot stop at municipal boundaries.

Peri-urban areas often contain:

  • agricultural land;
  • wetlands;
  • forests;
  • water bodies;
  • villages;
  • new housing;
  • industrial development; and
  • transport infrastructure.

Urban expansion can therefore create conflicts between development and ecological functions.

Chatterjee and Sharma (2020), in their review of Pradhan Mantri Gram Sadak Yojana, and Sharma et al. (2023), in their discussion of MGNREGA, illustrate the importance of infrastructure and development interventions beyond the conventional urban core.

An integrated resilience framework should connect:

village โ†’ peri-urban zone โ†’ urban core โ†’ metropolitan region.

This is especially important for water because watersheds do not follow administrative boundaries.


19. Climate-Resilient Infrastructure Financing

Even the most sophisticated plan cannot be implemented without finance.

UN-Habitat notes that cities frequently struggle to access adequate resources for climate action because of institutional, legal and financial constraints. It emphasizes the importance of long-term integrated planning and collaboration between local, regional and national governments and financial institutions. ๎ˆ

The urban climate-finance challenge is also visible at the national level. UN-Habitat’s analysis of 194 NDCs found that while many countries identified the need for finance for climate implementation, only a much smaller number specified urban-level financing requests. ๎ˆ

19.1 Financing mechanisms

Indian cities can potentially combine:

  • municipal revenues;
  • state government programmes;
  • national urban schemes;
  • climate funds;
  • development finance;
  • public-private partnerships;
  • land-value capture;
  • green bonds;
  • infrastructure funds; and
  • user charges.

However, financing mechanisms must be connected to measurable resilience outcomes.

19.2 Resilience budgeting

A resilience budget could classify investments according to outcomes such as:

InvestmentPrimary resilience outcome
Urban treesHeat reduction
Wetland restorationFlood storage
Public transportMobility resilience
Drainage improvementFlood-risk reduction
Rainwater harvestingWater security
Cool roofsHeat reduction
Pedestrian infrastructureAccessible mobility
Digital early-warning systemsDisaster preparedness
Green buildingsEnergy and thermal resilience
Informal-settlement upgradingSocial resilience

Such a framework could help municipalities demonstrate the multiple benefits of investments.


20. Integrating Climate Action into Urban Plans

UN-Habitat’s analysis of Nationally Determined Contributions demonstrates the importance of connecting national climate commitments with local urban action. The 2024 assessment found that 44 percent of the reviewed NDCs emphasized both adaptation and mitigation in urban contexts, with transport, mobility and waste prominent in mitigation discussions and infrastructure and water prominent in adaptation. ๎ˆ

The planning implication is that climate objectives should not exist only within separate climate action plans.

They should be integrated into:

  • master plans;
  • development plans;
  • mobility plans;
  • local area plans;
  • housing strategies;
  • infrastructure plans;
  • water plans;
  • disaster-management plans; and
  • capital investment programmes.

20.1 Climate-sensitive land-use zoning

Land-use plans can identify:

  • no-development ecological zones;
  • flood-sensitive areas;
  • areas suitable for densification;
  • transit-oriented development zones;
  • green corridors;
  • water-recharge zones;
  • urban agriculture areas; and
  • locations for critical infrastructure.

20.2 Scenario planning

Instead of preparing a single future land-use plan, planners can develop scenarios:

Scenario A: business-as-usual expansion.

Scenario B: compact TOD-oriented development.

Scenario C: green-blue infrastructure development.

Scenario D: climate-constrained growth.

These scenarios can then be compared using indicators such as:

  • land consumption;
  • travel distance;
  • emissions;
  • flood exposure;
  • water demand;
  • infrastructure cost;
  • accessibility; and
  • social inclusion.

21. A Proposed Integrated Framework for Indian Cities

Based on the preceding discussion, an integrated framework can be organized into eight interconnected layers.

Layer 1: Climate and hazard assessment

Map:

  • heat;
  • floods;
  • drought;
  • landslides;
  • extreme rainfall;
  • water stress;
  • air pollution; and
  • other relevant hazards.

Layer 2: Ecological structure

Identify:

  • rivers;
  • wetlands;
  • lakes;
  • forests;
  • green corridors;
  • agricultural land;
  • recharge zones; and
  • biodiversity areas.

Layer 3: Urban growth

Analyse:

  • existing density;
  • growth trends;
  • vacant land;
  • development pressure;
  • land values;
  • informal growth; and
  • peri-urban expansion.

Layer 4: Mobility

Map:

  • public transport;
  • walking;
  • cycling;
  • road networks;
  • first- and last-mile connectivity;
  • traffic congestion; and
  • accessibility to employment and services.

Layer 5: Built environment

Evaluate:

  • building density;
  • building age;
  • roof characteristics;
  • thermal performance;
  • construction materials;
  • energy use; and
  • housing vulnerability.

Layer 6: Social vulnerability

Identify:

  • low-income communities;
  • informal settlements;
  • elderly populations;
  • children;
  • persons with disabilities;
  • socially marginalized groups; and
  • communities with limited access to services.

Layer 7: Digital intelligence

Integrate:

  • GIS;
  • remote sensing;
  • IoT;
  • AI;
  • machine learning;
  • digital twins;
  • sensor networks; and
  • real-time dashboards.

Layer 8: Governance and finance

Connect:

  • municipal agencies;
  • state departments;
  • national programmes;
  • communities;
  • private sector;
  • academic institutions;
  • civil society; and
  • financing institutions.

The key principle is that none of these layers should be planned independently.


22. Indicators for Measuring Climate-Resilient Urban Development

A practical framework requires measurable indicators.

Environmental indicators

  • percentage of green cover;
  • tree-canopy coverage;
  • wetland area;
  • impervious-surface ratio;
  • stormwater retention capacity;
  • groundwater recharge potential;
  • water reuse percentage;
  • urban heat exposure; and
  • air-quality indicators.

Mobility indicators

  • public transport accessibility;
  • average first-mile distance;
  • average last-mile distance;
  • pedestrian-network coverage;
  • cycling-network coverage;
  • travel time;
  • transport affordability; and
  • road-safety indicators.

Housing indicators

  • percentage of housing with adequate ventilation;
  • heat exposure;
  • flood exposure;
  • water access;
  • sanitation;
  • housing affordability; and
  • structural safety.

Social indicators

  • accessibility of vulnerable populations;
  • participation in planning;
  • access to public spaces;
  • access to emergency facilities;
  • service inequality; and
  • displacement risk.

Governance indicators

  • climate-sensitive capital expenditure;
  • inter-agency coordination;
  • public participation;
  • data availability;
  • monitoring frequency; and
  • implementation progress.

23. Role of Universities and Research Institutions

Universities can play an important role in developing evidence-based urban resilience.

Research institutions can support municipalities through:

  • spatial analysis;
  • urban growth modelling;
  • transport modelling;
  • climate modelling;
  • material life-cycle assessment;
  • community surveys;
  • participatory planning;
  • AI applications;
  • digital twins; and
  • policy evaluation.

The combination of academic expertise and municipal datasets can produce locally relevant solutions rather than generic planning templates.

For example, a universityโ€“municipality partnership could establish a City Resilience Observatory that annually monitors:

  • land-use change;
  • tree cover;
  • flood locations;
  • urban heat;
  • public transport;
  • housing;
  • water demand;
  • infrastructure conditions; and
  • social vulnerability.

Such an observatory could support evidence-based plan revision.


24. Implementation Roadmap

A realistic implementation strategy can be organized into five phases.

Phase I: Baseline assessment

Prepare a citywide spatial database containing:

  • land use;
  • population;
  • infrastructure;
  • mobility;
  • water;
  • ecological assets;
  • climate hazards; and
  • social vulnerability.

Phase II: Risk and opportunity mapping

Identify:

  • high-risk areas;
  • climate refuges;
  • ecological assets;
  • redevelopment areas;
  • transit corridors;
  • potential green corridors; and
  • priority neighbourhoods.

Phase III: Integrated scenarios

Develop alternative spatial scenarios using GIS, urban-growth models, transport models and climate-risk analysis.

Phase IV: Investment prioritization

Rank projects according to transparent criteria such as:

  • population benefiting;
  • vulnerability reduction;
  • environmental benefits;
  • cost;
  • feasibility;
  • implementation period; and
  • co-benefits.

Importantly, such prioritization should remain transparent and context-specific rather than assuming that a single technical indicator can determine planning outcomes.

Phase V: Monitoring and adaptive management

Urban resilience is not a one-time project. Plans should be periodically updated using new:

  • satellite data;
  • climate data;
  • mobility data;
  • infrastructure information;
  • community feedback; and
  • performance indicators.

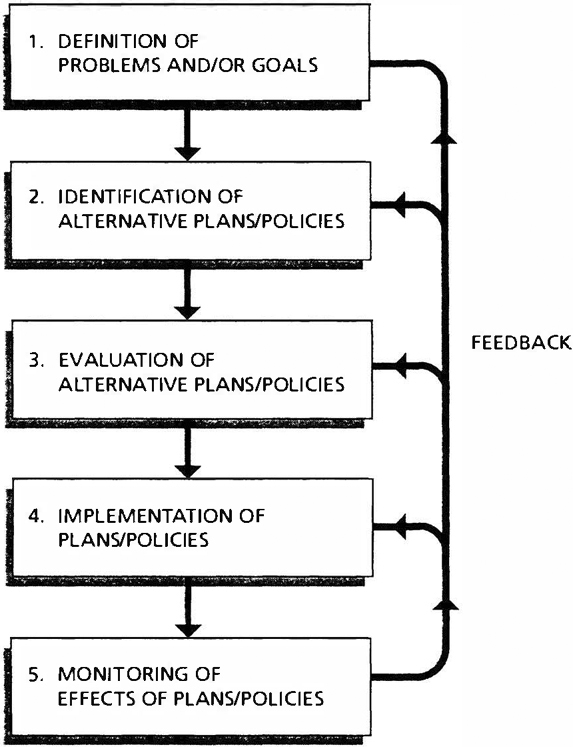
This creates an adaptive planning cycle:

Assess โ†’ Plan โ†’ Implement โ†’ Monitor โ†’ Learn โ†’ Adjust.


25. Key Challenges

Several challenges may limit implementation.

25.1 Institutional fragmentation

Different agencies may control:

  • roads;
  • water;
  • drainage;
  • land;
  • transport;
  • housing;
  • environment; and
  • disaster management.

Without coordination, integrated planning becomes difficult.

25.2 Data fragmentation

Data may exist in incompatible formats or at different spatial and temporal scales.

A city digital platform therefore requires:

  • common standards;
  • interoperable datasets;
  • metadata;
  • data governance; and
  • institutional ownership.

25.3 Financial limitations

Resilience projects often generate long-term benefits while requiring immediate investment.

Municipalities therefore need financial instruments that recognize long-term avoided losses and co-benefits.

25.4 Technical capacity

AI, digital twins and advanced modelling require skilled personnel. Technology without institutional capacity can produce systems that are difficult to maintain.

25.5 Social acceptance

Projects involving land-use regulation, redevelopment or infrastructure relocation may generate opposition. Participatory processes should therefore occur before major decisions become irreversible.


26. Discussion: From Resilient Projects to Resilient Urban Systems

The central lesson from the literature is that resilience is fundamentally spatial.

Where people live determines their exposure.
How neighbourhoods are connected determines accessibility.
How land is paved determines runoff.
How streets are shaded determines thermal comfort.
How wetlands are protected determines flood storage.
How transport and land use interact determines travel demand.
How buildings are designed determines energy demand.
How institutions share data determines the quality of decision-making.

The World Bank’s recent work on Indian cities reinforces this opportunity. It emphasizes that a substantial share of future urban infrastructure is yet to be constructed, meaning that current planning decisions can influence long-term resilience rather than merely retrofitting existing systems later. ๎ˆ

Similarly, the IPCC emphasizes that building for resilience and lower emissions is generally easier than retrofitting later because urban development can lock in vulnerabilities and emissions. ๎ˆ

This makes the next decades especially important for Indian planning.

The objective should not be to create cities that are completely protected from every hazard. Such a goal is unrealistic. Instead, cities should reduce avoidable exposure, strengthen adaptive capacity, improve ecological systems and ensure that vulnerable communities have greater access to protection and opportunity.


27. Conclusion

Climate-resilient and water-sensitive urban development requires a fundamental reconsideration of how Indian cities are planned. Climate change should not be treated as an environmental issue added to an otherwise conventional development framework. It should become a central criterion for decisions about land, infrastructure, transport, housing, water, public space and investment.

The evidence from the IPCC demonstrates that urban form, infrastructure and social vulnerability interact with climate hazards. ๎ˆ UN-Habitat similarly emphasizes that urban resilience depends on interconnected relationships among communities, ecosystems, infrastructure, markets and technologies. ๎ˆ

For India, the challenge is also an opportunity. Rapid urban expansion means that many future buildings, roads, neighbourhoods and infrastructure systems have not yet been constructed. The World Bank therefore identifies a significant opportunity to shape future urban growth through resilient infrastructure, housing, transport and municipal services. ๎ˆ

A resilient city should consequently be planned as an integrated system.

Its land-use system should reduce exposure.

Its water system should retain, reuse and safely manage water.

Its green infrastructure should reduce heat, manage runoff and improve ecological quality.

Its transport system should provide safe, affordable and climate-sensitive accessibility.

Its buildings should reduce energy demand and improve thermal comfort.

Its construction sector should increasingly adopt life-cycle and circular principles.

Its digital infrastructure should support evidence-based decisions without creating new forms of exclusion.

Its governance system should connect institutions, communities, researchers and financial actors.

Most importantly, resilience should be understood as a matter of people and place, not merely infrastructure. A technically sophisticated city is not necessarily a resilient city if vulnerable residents remain exposed to heat, flooding, inadequate housing, inaccessible transport or unsafe environments.

The future of Indian urban planning therefore lies in moving from fragmented sectoral interventions toward integrated, spatially informed and socially inclusive climate-resilient development. The combination of land-use planning, water-sensitive design, transit-oriented development, green infrastructure, life-cycle assessment, AI, digital twins, participatory planning and inclusive governance provides a pathway through which Indian cities can accommodate growth while reducing future environmental and social risks.

The ultimate objective is not simply to make cities capable of surviving climate shocks. It is to create urban systems that are adaptive, accessible, ecologically functional, economically productive and socially inclusive before the next shock occurs.


References

Chatterjee, S., & Sharma, S. N. (2020). Review of Pradhan Mantri Gram Sadak Yojana. Think India Journal, 23(1), 33โ€“42.

Dehalwar, K., & Sharma, S. N. (2023). Fate of slums of Bhopalโ€”a tale of struggle and resilience. Think India Journal, 26(4), 4.

Dehalwar, K., & Sharma, S. N. (2024a). Exploring the distinctions between quantitative and qualitative research methods. Think India Journal, 27(1), 7โ€“15.

Dehalwar, K., & Sharma, S. N. (2024b). Social injustice inflicted by spatial changes in vernacular settings: An analysis of published literature. ISVS e-journal, 11(9), 93โ€“113.

Intergovernmental Panel on Climate Change. (2022). Climate change 2022: Impacts, adaptation and vulnerability. Chapter 6: Cities, settlements and key infrastructure. IPCC. ๎ˆ

Jain, S., Dehalwar, K., & Sharma, S. N. (2024). Explanation of Delphi research method and expert opinion surveys. Think India, 27(4), 37โ€“48.

Kumar, G., Vyas, S., Sharma, S. N., & Dehalwar, K. (2023). Planning and development of housing in urban fringe area: Case of Bhopal (MP). GIS Business, 18(1), 1โ€“14.

Kumar, G., Vyas, S., Sharma, S. N., & Dehalwar, K. (2025). Urban growth prediction using CA-ANN model and spatial analysis for planning policy in Indore city, India. GeoJournal, 90(3), 139.

Lalramsangi, V., Garg, Y. K., & Sharma, S. N. (2025). Route choices to access public open spaces in hill cities. Environment and Urbanization ASIA, 16(2), 283โ€“299. https://doi.org/10.1177/09754253251388721

Lodhi, A. S., Jaiswal, A., & Sharma, S. N. (2024). Assessing bus usersโ€™ satisfaction using discrete choice models: A case of Bhopal. Innovative Infrastructure Solutions, 9(11), 437. https://doi.org/10.1007/s41062-024-01652-w

Ogbanga, M. M., Sharma, S. N., Pandey, A. K., & Singh, P. (2025). Artificial intelligence in social work to ensure environmental sustainability. In M. Nasr, A. Negm, & L. Peng (Eds.), Artificial intelligence applications for a sustainable environment. Springer. https://doi.org/10.1007/978-3-031-91199-6

Sharma, S. N. (2012). Participatory planning in plan preparation: A case of Delhi. EduPedia Publications (P) Ltd.

Sharma, S. N. (2019). Review of most used urban growth models. International Journal of Advanced Research in Engineering and Technology, 10.

Sharma, S. N., & Dehalwar, K. (2025a). A systematic literature review of transit-oriented development to assess its role in economic development of city. Transportation in Developing Economies, 11(2), 23. https://doi.org/10.1007/s40890-025-00245-1

Sharma, S. N., & Dehalwar, K. (2025b). Examining the inclusivity of India’s National Urban Transport Policy for senior citizens. In D. S.-K. Ting & J. A. Stagner (Eds.), Transforming healthcare infrastructure (pp. 115โ€“134). CRC Press. https://doi.org/10.1201/9781003513834-5

Sharma, S. N., & Dehalwar, K. (2025c). Review of landuse transportation interaction model in smart urban growth management. European Transport, (103), 1โ€“15.

Sharma, S. N., Chatterjee, S., & Dehalwar, K. (2023). Mahatma Gandhi National Rural Employment Guarantee Scheme: Challenges and opportunities. Think India Journal, 26(1), 7โ€“15.

Sharma, S. N., Dehalwar, K., Jain, S., & Pandey, A. K. (2025). An assessment of the applications and prospects of AI tools in solid waste management. In Artificial intelligence applications for a sustainable environment (pp. 97โ€“118). Springer.

Sharma, S. N., Dehalwar, K., & Pandey, A. K. (2026). Measures to manage the urban water quality for public health. In Environmentalism in healthcare (pp. 339โ€“371).

Sharma, S. N., Dehalwar, K., & Yadav, K. (2026a). Advances in AI-based mobility modelling: Toward intelligent transport infrastructure in smart cities. In AI-Based data mobility and intelligent modeling for smart cities (pp. 67โ€“106).

Sharma, S. N., Dehalwar, K., & Yadav, K. (2026b). Advancing travel behaviour modelling: A systematic literature review. Civil Engineering Infrastructures Journal, e108027.

Sharma, S. N., Dehalwar, K., & Yadav, K. (2026c). Urban spatial digital twin in sustainability to spur economic growth in transit-oriented development-based development. In Tenable engineering for a sustainable future (pp. 257โ€“300).

Sharma, S. N., Kumar, A., & Dehalwar, K. (2024). The precursors of transit-oriented development. Economic and Political Weekly, 59(14), 16โ€“20. https://doi.org/10.5281/zenodo.10939448

Sharma, S. N., Lodhi, A. S., Dehalwar, K., & Jaiswal, A. (2024). Life cycle assessment (LCA) of recycled & secondary materials in the construction of roads. IOP Conference Series: Earth and Environmental Science, 1326(1), 012102.

Sharma, S. N., Singh, D., & Dehalwar, K. (2024). Surrogate safety analysis: Leveraging advanced technologies for safer roads. Suranaree Journal of Science and Technology, 31(4), 010320, 1โ€“14. https://doi.org/10.55766/sujst-2024-04-e03837

Sharma, S. N., Singh, S., Kumar, G., Pandey, A. K., & Dehalwar, K. (2025). Role of green buildings in creating sustainable neighbourhoods. IOP Conference Series: Earth and Environmental Science, 1519(1), 012018.

Sharma, S. N., Dehalwar, K., Kumar, G., Yadav, K., & Verma, D. (2026). Utilization of advanced materials for permeable paving, biocrete, and piezoelectric materials in walkways to transit stations. In Engineering sustainability goals: UNSDG 12 (p. 209).

United Nations. (2015). Transforming our world: The 2030 Agenda for Sustainable Development. United Nations. ๎ˆ

United Nations Department of Economic and Social Affairs. (2023). Goal 11: Make cities and human settlements inclusive, safe, resilient and sustainable. United Nations. ๎ˆ

UN-Habitat. (2024a). World Cities Report 2024: Cities and climate action. United Nations Human Settlements Programme. ๎ˆ

UN-Habitat. (2024b). Urban content of NDCs: Local climate action explored through in-depth country analyses. United Nations Human Settlements Programme. ๎ˆ

UN-Habitat. (2024c). World Smart Cities Outlook 2024. United Nations Human Settlements Programme. ๎ˆ

UN-Habitat. (2024d). World Cities Report 2024: Financing interventions for climate change in cities. United Nations Human Settlements Programme. ๎ˆ

World Bank. (2025a). Towards resilient and prosperous cities in India. World Bank. ๎ˆ

World Bank. (2025b). India has a critical opportunity to drive resilient urban development. World Bank. ๎ˆ

Yadav, K., Dehalwar, K., & Sharma, S. N. (2025a). Assessing the factors affecting first and last mile accessibility in transit-oriented development: A literature review. GeoJournal, 90, 298. https://doi.org/10.1007/s10708-025-11546-8

Yadav, K., Dehalwar, K., Sharma, S. N., & Yadav, S. (2025b). Understanding user satisfaction in last-mile connectivity under transit-oriented development in Tier 2 Indian cities: A climate-sensitive perspective. IOP Conference Series: Earth and Environmental Science, 1579(1), 012006. https://doi.org/10.1088/1755-1315/1579/1/012006

Yadav, K., Dehalwar, K., & Sharma, S. N. (2025c). A user-centric machine learning framework for predicting multi-modal accessibility in transit-oriented development zones for sustainable urban construction in Tier-2 Indian cities. Asian Journal of Civil Engineering. https://doi.org/10.1007/s42107-025-01625-z

Yadav, K., Dehalwar, K., & Sharma, S. N. (2026). Exploring the environmental determinants of mode choice in first and last mile connectivity: Evidence from a systematic review. Innovative Infrastructure Solutions, 11(4), 204.

The genie grants you a wish. What is it?

View all responses

Social Justice and Inclusive Human Settlements in India: Integrating Housing, Mobility, Infrastructure, Environment, Participation and Emerging Technologies

Dr. Kavita Dehalwar

Abstract

India’s human settlements are undergoing profound transformation as a result of urbanisation, metropolitan expansion, migration, infrastructure investment, changing housing markets, environmental pressures and technological development. These transformations have generated substantial opportunities for economic growth and improved connectivity, but their benefits and costs are not distributed equally. Inequalities persist in access to housing, sanitation, transportation, public spaces, employment, environmental resources and decision-making. Social justice must therefore become a central objective of spatial planning rather than a supplementary concern addressed after physical development has occurred. This article examines inclusive human settlement planning in India through an integrated review of housing, informal settlements, urban-fringe development, sanitation, universal design, public transportation, first- and last-mile connectivity, transit-oriented development, public-space accessibility, gender, caste, rural development, participatory planning, environmental justice and emerging digital technologies. It draws extensively on the supplied research literature, including studies by Dehalwar, Sharma and their collaborators on social injustice, slums, housing, research methodology, womenโ€™s reservation, transport, urban growth, green buildings, life-cycle assessment, artificial intelligence, digital twins, rural employment, sanitation and accessibility. The article argues that social justice has distributive, recognitional, procedural and representational dimensions. It proposes an integrated framework in which housing, mobility, infrastructure, environment and participation are planned as interconnected systems. The article further argues that artificial intelligence, GIS, machine learning and digital twins can strengthen planning only when accompanied by representative data, community participation and institutional accountability. The future of Indian planning should therefore move from infrastructure-centred development towards people-centred, context-sensitive and evidence-based human settlement planning.

Keywords: social justice; inclusive human settlements; spatial inequality; housing; informal settlements; transport accessibility; universal design; participatory planning; environmental justice; artificial intelligence; India


1. Introduction

Human settlements are not merely collections of buildings, roads and infrastructure. They are complex spatial systems in which economic activity, social relationships, cultural practices, environmental processes and institutional structures interact. A neighbourhood provides not only shelter but also access to employment, education, healthcare, transportation, public spaces and social networks. Consequently, decisions about land use, housing, roads, public facilities and environmental infrastructure are simultaneously decisions about opportunity and inclusion.

The importance of inclusive settlement planning has become increasingly visible as urbanisation accelerates. The United Nations identifies inclusive, safe, resilient and sustainable cities as a central global development objective under Sustainable Development Goal 11. Current UN reporting emphasises that rapid urbanisation can outpace the provision of housing, infrastructure and services, while urban sprawl, informal settlements and unequal access to public transport remain major challenges. United Nations

These challenges are especially significant in India. Large metropolitan regions are expanding beyond conventional municipal boundaries; smaller cities are experiencing increasing development pressure; villages are becoming functionally integrated with urban economies; and peri-urban areas are being transformed by residential, commercial and infrastructure development. At the same time, informal settlements remain important sources of affordable housing and employment access for economically vulnerable populations.

Climate change adds another layer of complexity. UN-Habitat’s World Cities Report 2024 notes that climate impacts interact with existing inequalities and that poorer and marginalised urban groups frequently have fewer resources with which to respond to climate risks. The report also stresses that poorly designed climate interventions can themselves create exclusionary outcomes, particularly where informal settlements and vulnerable communities are overlooked. UN-Habitat The IPCC similarly identifies unplanned and informal settlements and smaller and medium-sized cities in low- and middle-income countries as important areas of increasing climate vulnerability and exposure. IPCC

The research supplied for this article provides a valuable India-specific basis for examining these questions. It includes research on social injustice caused by spatial changes in vernacular settings, the fate of slums in Bhopal, housing development in urban fringe areas, rural sanitation, universal design, women’s reservation, Dalit representation, rural employment, public transport, first- and last-mile accessibility, public-space access, green buildings, life-cycle assessment, urban growth modelling, artificial intelligence and digital twins. The bibliography supplied by the user records these works across the period 2012โ€“2027. Pasted text Pasted text

The central proposition of this article is that social justice should be embedded in the entire planning process. It should influence how problems are diagnosed, how alternatives are developed, how infrastructure is located, how investments are prioritised, how communities participate and how outcomes are evaluated.

The objective should not simply be to build more infrastructure or create more technologically advanced cities. It should be to create human settlements in which people with different incomes, ages, genders, abilities, occupations and social backgrounds can access opportunities and participate meaningfully in shaping the places where they live.


2. Social Justice as a Foundation of Human Settlement Planning

Social justice in spatial planning can be understood through four interconnected dimensions: distribution, recognition, participation and representation.

2.1 Distributive justice

Distributive justice concerns the allocation of resources and opportunities. In spatial planning, these include:

  • housing;
  • roads;
  • public transport;
  • schools;
  • healthcare;
  • sanitation;
  • parks;
  • water;
  • employment opportunities; and
  • environmental amenities.

A settlement can be physically developed while remaining socially unequal if infrastructure and opportunities are concentrated in selected areas.

2.2 Recognitional justice

Recognitional justice requires planners to recognise differences between social groups. Older adults, women, children, persons with disabilities, migrants, informal workers and socially marginalised communities may experience the same urban environment differently.

A staircase, for example, may represent convenient circulation for one person but a major barrier for another.

2.3 Procedural justice

Procedural justice concerns who participates in decisions. Residents should have opportunities to contribute to planning rather than merely being informed after decisions are finalised.

2.4 Representational justice

Representational justice concerns institutional power. Dehalwar and Sharma’s work on women’s reservation and the research of Verma, Yadav, and Sharma on Dalit representation demonstrate that social inclusion is also a question of access to institutions and decision-making power. Pasted text Pasted text

These dimensions cannot be separated. Poor distribution may result from weak representation. Lack of recognition may lead to inappropriate infrastructure. Limited participation can result in plans that fail to understand local needs.

Consequently, an inclusive planning framework should address all four.


3. Spatial Transformation and Social Injustice

Physical transformation is an essential characteristic of urban development, but it is not socially neutral.

Dehalwar and Sharma (2024), in their study โ€œSocial injustice inflicted by spatial changes in vernacular settings: An analysis of published literature,โ€ examine how changes in spatial environments can produce social consequences. The study is particularly relevant to settlements where traditional forms, social networks and cultural relationships are altered by development. Pasted text

Traditional neighbourhoods often contain forms of social infrastructure that are difficult to quantify. Streets may function as social spaces. Courtyards may support community interaction. Local markets may support informal employment. Religious or cultural spaces may contribute to collective identity.

When redevelopment replaces these systems, the physical quality of the new environment does not necessarily compensate for the loss of social relationships.

This creates a fundamental planning question:

Should successful redevelopment be measured only by what replaces the existing physical environment, or also by what happens to the community that occupied it?

A socially just approach requires the second question to be considered.

Spatial transformation should therefore be evaluated in terms of:

  • displacement;
  • affordability;
  • cultural continuity;
  • access to social networks;
  • livelihood impacts;
  • accessibility;
  • public-space changes; and
  • community participation.

4. Urbanisation and Uneven Development

Urbanisation generates economic opportunities, but its benefits are spatially uneven.

Areas with better transportation, employment and infrastructure tend to attract investment. Property values may increase, commercial activities may intensify and development may accelerate. At the same time, communities with lower incomes may face affordability pressures.

This produces a paradox: improved infrastructure can simultaneously improve accessibility and increase displacement pressure.

Planning must therefore consider the distributional consequences of infrastructure investment.

Kumar, Vyas, Sharma, and Dehalwar (2023) examined planning and development of housing in the urban fringe area of Bhopal, providing an example of the complexity of peripheral urban development. Pasted text

Urban fringes are particularly important because they often contain:

  • agricultural land;
  • villages;
  • informal settlements;
  • plotted developments;
  • institutional uses;
  • industrial areas;
  • new housing projects; and
  • emerging transport corridors.

These areas require planning at a scale larger than individual municipal jurisdictions.


5. The Urban Fringe as a Zone of Social Transformation

The urban fringe is not simply an undeveloped area waiting for urban expansion.

It is often an existing social and economic landscape.

Agricultural households may depend on land for livelihood. Villages may possess established community institutions. Informal settlements may provide affordable housing to workers employed in nearby cities.

When development occurs, some landowners may benefit from rising land values, while agricultural labourers may lose employment opportunities. Existing residents may gain access to infrastructure but face increased costs.

The transition from rural to urban land use can therefore produce differentiated outcomes.

A socially just metropolitan strategy should include:

  1. protection of essential agricultural land;
  2. recognition of existing villages;
  3. infrastructure provision for peripheral communities;
  4. affordable housing;
  5. public-transport connectivity;
  6. protection of livelihoods;
  7. environmental management; and
  8. community participation.

6. Predicting Urban Growth: From Modelling to Inclusive Planning

Urban growth modelling can help planners anticipate development.

Kumar, Vyas, Sharma, and Dehalwar (2025) examined urban growth prediction using a CAโ€“ANN model and spatial analysis for planning policy in Indore city. The supplied bibliography records the article in GeoJournal. Pasted text

CAโ€“ANN approaches combine spatial transition modelling with artificial neural-network techniques. Such approaches can support identification of potential growth areas and relationships among land-use variables.

However, predictive modelling should not be treated as an automatic substitute for planning.

A model may indicate that development is likely in a particular location. It does not determine:

  • whether development should occur there;
  • who will benefit;
  • who may be displaced;
  • whether infrastructure is adequate;
  • whether the land is environmentally suitable; or
  • whether the development is socially equitable.

The next generation of urban-growth modelling should therefore incorporate social indicators alongside physical variables.

Possible social variables include:

  • income;
  • housing affordability;
  • accessibility;
  • service coverage;
  • tenure;
  • population vulnerability;
  • environmental exposure; and
  • displacement risk.

This would transform urban growth modelling from a prediction tool into a more comprehensive equity-aware planning tool.


7. Informal Settlements: Vulnerability and Resilience

Informal settlements are often located where formal housing markets fail to meet demand.

They can provide proximity to employment at costs that are accessible to low-income households. At the same time, they may lack formal tenure, sanitation, drainage, road infrastructure and adequate housing.

Dehalwar and Sharma (2023), in โ€œFate of slums of Bhopalโ€”a tale of struggle and resilience,โ€ emphasise the complexity of these communities. Pasted text

The concept of resilience is important.

Residents frequently create:

  • informal economic networks;
  • mutual-support systems;
  • local associations;
  • shared services;
  • flexible housing arrangements; and
  • informal transportation systems.

These should not automatically be viewed as failures of planning. They can also represent adaptive responses to formal-system limitations.

Consequently, planning interventions should seek to understand existing community capacities before replacing them.


8. In-Situ Upgrading Versus Relocation

Relocation is sometimes necessary when settlements occupy locations exposed to severe hazards or when essential infrastructure cannot safely be provided.

However, relocation can have unintended effects.

A household may receive improved physical housing but lose:

  • proximity to employment;
  • access to schools;
  • social networks;
  • local markets;
  • childcare support;
  • familiar transportation routes.

Thus, housing improvement should not be assessed only by the physical quality of the dwelling.

Where feasible, in-situ upgrading may provide an alternative.

Upgrading can include:

  • water supply;
  • sanitation;
  • drainage;
  • street improvements;
  • lighting;
  • waste management;
  • housing improvement;
  • public spaces; and
  • tenure regularisation.

The most appropriate strategy depends on local conditions and environmental risk.


9. Housing as a Spatial Right

Housing is frequently treated as a construction problem: how many houses should be built and at what cost?

A social-justice perspective asks a broader question:

Where should housing be located, for whom, and with what access to opportunity?

Housing located far from employment may be inexpensive but generate substantial transportation costs.

A household’s real housing burden can therefore be expressed conceptually as:

Total household spatial burden = housing cost + transport cost + service cost + time cost.

The time component is particularly important.

Long commutes reduce time available for:

  • childcare;
  • education;
  • recreation;
  • community participation; and
  • rest.

Housing planning should therefore be coordinated with transportation planning.


10. Housing Diversity

Indian households have diverse structures.

They include:

  • nuclear families;
  • joint families;
  • elderly households;
  • single-person households;
  • women-headed households;
  • migrants;
  • students;
  • informal workers; and
  • temporary workers.

Housing policies based on a single household model can therefore exclude important groups.

Flexible housing design can provide adaptability over time.

Universal design can further ensure that housing remains usable as household circumstances change.

The principle should be housing adaptability rather than housing uniformity.


11. Sanitation and Dignity

Sanitation is a fundamental component of human settlement quality.

Sharma’s work on rural sanitation and his earlier work on best practices for total sanitation demonstrate that sanitation is not simply an infrastructure issue. Pasted text Pasted text

A complete sanitation system requires:

  • toilets;
  • water;
  • wastewater collection;
  • treatment;
  • safe disposal;
  • maintenance;
  • monitoring; and
  • behavioural support.

The absence of any component can compromise the entire system.

Sanitation is also connected to social dignity.

Inadequate sanitation can affect women, children, older adults and people with disabilities differently.

Therefore, sanitation planning should incorporate:

  • safety;
  • privacy;
  • accessibility;
  • gender;
  • location; and
  • maintenance.

12. Water Quality and Public Health

Water-quality management represents another dimension of social justice.

Sharma, Dehalwar, and Pandey (2026) examine measures to manage urban water quality for public health. The supplied publication list identifies the work within Environmentalism in Healthcare. Pasted text

Water pollution can create unequal health burdens because communities with fewer resources may have fewer alternatives when local water quality deteriorates.

Urban water planning should therefore integrate:

  • source protection;
  • drainage;
  • wastewater treatment;
  • monitoring;
  • public-health surveillance; and
  • community awareness.

Water quality should be understood as a settlement-level issue rather than solely as a technical utility function.


13. Universal Design and Inclusive Environments

Agarwal and Sharma (2014) examined universal design to ensure an equitable society. Pasted text

Universal design is essential because accessibility barriers are often embedded in ordinary physical systems.

Examples include:

  • stairs without ramps;
  • narrow footpaths;
  • inaccessible bus stops;
  • high kerbs;
  • insufficient seating;
  • poorly designed crossings;
  • inadequate signage.

Universal design should be integrated into planning from the beginning.

It should apply to:

  • buildings;
  • housing;
  • streets;
  • parks;
  • transport;
  • government facilities;
  • schools; and
  • healthcare.

14. Ageing and Transport Inclusion

Older adults often face declining mobility, increased sensitivity to environmental conditions and greater dependence on accessible transport.

Sharma and Dehalwar (2025) examined the inclusivity of India’s National Urban Transport Policy for senior citizens. Pasted text

Age-friendly mobility requires:

  • accessible vehicles;
  • low-floor boarding;
  • safe crossings;
  • appropriate seating;
  • shorter walking distances;
  • clear information;
  • adequate lighting; and
  • reliable services.

Planning for older adults also benefits other groups.

A footpath designed for an elderly pedestrian can also improve mobility for children, persons with disabilities and people carrying goods.


15. Public Transport and User Experience

Lodhi, Jaiswal, and Sharma (2024) examined bus-user satisfaction using discrete choice models in Bhopal. Pasted text

The study highlights the value of user-oriented transport research.

Transport systems should not be evaluated only according to:

  • traffic speed;
  • road capacity;
  • vehicle throughput.

They should also be assessed through:

  • waiting time;
  • comfort;
  • affordability;
  • reliability;
  • safety;
  • accessibility;
  • information; and
  • connectivity.

A system that moves vehicles efficiently but fails to meet user needs is not necessarily successful from a human-mobility perspective.


16. First- and Last-Mile Connectivity

Yadav, Dehalwar, and Sharma (2025) examined the factors affecting first- and last-mile accessibility in transit-oriented development. Pasted text

The first and last mile is often where the accessibility of public transport succeeds or fails.

A major transit station may be located within a neighbourhood, but residents may still be unable to use it because of:

  • missing sidewalks;
  • unsafe roads;
  • excessive distance;
  • poor crossings;
  • steep terrain;
  • extreme heat;
  • lack of feeder services.

Yadav et al. (2025) also studied user satisfaction in last-mile connectivity in Tier-2 Indian cities from a climate-sensitive perspective. Pasted text

This perspective is particularly valuable because climate conditions influence walking and cycling.


17. Climate-Sensitive Accessibility

Transportation planning increasingly needs to consider environmental comfort.

Extreme heat, rainfall and flooding can make walking and cycling difficult even when the physical network exists.

Yadav, Dehalwar, and Sharma (2026) examined environmental determinants of mode choice in first- and last-mile connectivity. Pasted text

This work suggests that accessibility is not purely a spatial variable.

A route can be physically available but functionally inaccessible during certain environmental conditions.

Therefore, climate-sensitive transport planning should consider:

  • shade;
  • vegetation;
  • drainage;
  • sheltered waiting areas;
  • surface quality;
  • heat exposure;
  • flood risk.

This is particularly important in Indian cities experiencing increasing heat stress.


18. Public Open Spaces and Social Inclusion

Public spaces are essential for recreation, social interaction and public life.

Lalramsangi, Garg, and Sharma (2025) studied route choices to access public open spaces in hill cities. Pasted text

Their work illustrates that access is influenced by spatial configuration and route characteristics.

In hilly cities, actual walking effort can differ substantially from straight-line distance.

Therefore, public-space accessibility assessment should include:

  • slope;
  • stairs;
  • route directness;
  • pedestrian safety;
  • lighting;
  • seating;
  • shade;
  • connectivity.

Public-space provision should thus move beyond the simple calculation of area per capita.


19. Transit-Oriented Development and Equity

Transit-oriented development integrates transport and land use around transit corridors.

Sharma and Dehalwar (2025) reviewed the role of TOD in economic development, while Yadav et al. (2025) examined first- and last-mile accessibility within TOD environments.

TOD can improve:

  • accessibility;
  • public transport use;
  • pedestrian movement;
  • mixed land use;
  • development efficiency.

However, increased accessibility can also increase land values.

This creates an important social-justice concern.

If existing low-income residents cannot afford rising rents or property taxes, they may be displaced from areas that have received public investment.

Therefore, inclusive TOD should consider:

  • affordable housing;
  • tenant protection;
  • local employment;
  • public-space access;
  • universal design;
  • community participation.

Transit-oriented development should not be understood solely as a density strategy.


20. Land Useโ€“Transport Interaction

Sharma and Dehalwar (2025) reviewed land-use transportation interaction models in smart urban growth management. Pasted text

Land use and transportation form a feedback system.

Transportation infrastructure influences land values and development patterns.

Land-use patterns influence travel demand.

This interaction has important implications for social equity.

If affordable housing is located far from employment, transport demand increases.

If transport investment is concentrated in wealthy areas, existing inequalities may be reinforced.

Integrated land-useโ€“transport planning can instead support more balanced spatial development.


21. Travel Behaviour and Social Inclusion

Travel behaviour is influenced by more than individual preference.

It can reflect:

  • income;
  • gender;
  • age;
  • employment;
  • household structure;
  • accessibility;
  • safety;
  • environmental conditions.

Sharma and Dehalwar’s research on travel behaviour and TOD, together with Yadav et al.’s work on multimodal accessibility, indicates the importance of understanding travel as part of a broader spatial system.

The user-centric machine-learning framework developed by Yadav, Dehalwar, and Sharma (2026) further explores prediction of multimodal accessibility in TOD zones. Pasted text

Such methods can help identify populations facing poor accessibility.

However, machine learning should be complemented by qualitative evidence to understand why accessibility is low.


22. Gender and the Spatial Experience of the City

Women and men may experience the same urban space differently.

Women’s mobility can be influenced by:

  • safety;
  • childcare;
  • household responsibilities;
  • employment;
  • social norms;
  • public transport conditions.

Dehalwar and Sharma’s (2024) work on politics in the name of women’s reservation introduces an institutional dimension to this discussion. Pasted text

Gender inclusion requires both:

spatial inclusion, through safer and more accessible environments,

and

institutional inclusion, through meaningful participation in decision-making.

Women should therefore not be viewed solely as beneficiaries of planning. They should be recognised as active participants in shaping plans.


23. Caste, Representation and Access to Power

Social justice in India cannot be adequately discussed without considering caste-based inequality.

Verma, Yadav, and Sharma (2026) examined Dalit representation deficits across state, market and cultural institutions. Pasted text

The relevance to planning is that access to space and access to institutions are interconnected.

A community may physically live near a public institution but still lack effective influence over decisions.

This suggests that spatial planning should consider:

  • representation;
  • institutional access;
  • participation;
  • social exclusion;
  • resource distribution.

Planning processes should actively seek participation from groups that have historically had limited institutional power.


24. Rural Employment and Spatial Justice

Human settlement planning must include rural areas.

Sharma, Chatterjee, and Dehalwar (2023) examined the Mahatma Gandhi National Rural Employment Guarantee Scheme, highlighting challenges and opportunities in rural employment. Pasted text

Employment security affects settlement resilience.

Similarly, research on rural road connectivity examines how infrastructure can reduce spatial isolation.

Rural roads can improve:

  • access to markets;
  • education;
  • healthcare;
  • employment;
  • government services.

However, connectivity should be accompanied by services and economic opportunities.


25. Ruralโ€“Urban Integration

Urban and rural areas increasingly form interconnected systems.

People may:

  • live in villages and work in cities;
  • produce agricultural goods for urban markets;
  • commute between settlements;
  • access urban healthcare;
  • migrate temporarily for employment.

Metropolitan expansion can therefore transform rural livelihoods.

Regional planning should coordinate:

  • land use;
  • agriculture;
  • transportation;
  • housing;
  • environmental protection;
  • employment;
  • public services.

This approach can reduce fragmented development.


26. Participatory Planning

Sharma’s work on participatory planning in plan preparation provides an important basis for community-centred planning.

Participation can reveal information that conventional datasets cannot capture.

Residents can identify:

  • unsafe areas;
  • informal paths;
  • seasonal flooding;
  • local markets;
  • community assets;
  • transport problems;
  • inaccessible services.

Participation should therefore be considered a form of planning knowledge.

However, participation must be meaningful.

A process in which decisions have already been made before public consultation is limited.

Effective participation requires early involvement and feedback mechanisms.


27. Quantitative and Qualitative Evidence

Dehalwar and Sharma (2024) examined the distinction between quantitative and qualitative research methods. Pasted text

Quantitative methods can answer:

  • How many?
  • Where?
  • How often?
  • What relationship exists?
  • What pattern is visible?

Qualitative methods can answer:

  • Why?
  • How is the problem experienced?
  • What does a space mean to residents?
  • Why does a service remain inaccessible?

Both forms of knowledge are valuable.

For example, GIS may identify a neighbourhood with poor access to healthcare. Interviews may reveal that the actual barrier is not physical distance but unaffordable transportation.

Mixed-method research can therefore provide a more complete understanding of social inequality.


28. Delphi Research and Expert Knowledge

Jain, Dehalwar, and Sharma (2024) discussed the Delphi research method and expert opinion surveys. Pasted text

Delphi methods can be useful when planning involves uncertainty or competing priorities.

Potential applications include:

  • prioritising social-justice indicators;
  • identifying accessibility criteria;
  • evaluating planning scenarios;
  • developing resilience frameworks;
  • assessing policy alternatives.

Expert judgement should complement rather than replace community knowledge.

A robust planning process can combine:

expert evidence + statistical evidence + spatial evidence + community evidence.


29. Environmental Justice

Environmental benefits and environmental risks are not equally distributed.

Low-income communities may experience:

  • greater flood exposure;
  • poor drainage;
  • pollution;
  • inadequate waste management;
  • limited green space.

UN-Habitat’s World Cities Report 2024 specifically highlights the interaction between climate change and pre-existing inequalities and notes that vulnerable populations can face disproportionate impacts. UN-Habitat

The report also cautions that climate infrastructure can have exclusionary consequences when informal settlements and poorer households are not incorporated into planning. UN-Habitat

This reinforces the importance of social-impact assessment.

Environmental interventions should therefore be evaluated according to:

  • who benefits;
  • who bears costs;
  • who is displaced;
  • who participates; and
  • whether vulnerable groups are protected.

30. Climate Change and Inclusive Human Settlements

Climate change is increasingly transforming the planning context.

Flooding, heatwaves, drought and extreme rainfall can affect infrastructure and public health.

The IPCC identifies urbanisation, exposure and climate hazards as interacting drivers of urban risk, with vulnerability particularly significant in informal and unplanned settlements and in smaller and medium-sized urban areas. IPCC

This is highly relevant to India.

A climate-resilient settlement requires:

  • drainage;
  • heat mitigation;
  • resilient infrastructure;
  • emergency access;
  • green infrastructure;
  • water management;
  • safe housing.

But resilience should also be socially distributed.

A settlement cannot be considered resilient if only affluent neighbourhoods have access to protective infrastructure.

UN-Habitat’s 2024 report explicitly connects climate action with poverty reduction, resilient infrastructure, public health and social inclusion. UN-Habitat


31. Green Buildings and Neighbourhood Sustainability

Sharma, Singh, Kumar, Pandey, and Dehalwar (2025) examined the role of green buildings in creating sustainable neighbourhoods. Pasted text

Green buildings can improve:

  • energy efficiency;
  • water efficiency;
  • indoor environmental quality;
  • resource conservation.

However, a green building is not necessarily a socially inclusive building.

A socially sustainable building should also be:

  • affordable;
  • accessible;
  • connected to public transport;
  • integrated with public space;
  • suitable for diverse users.

The neighbourhood context is therefore essential.


32. Life-Cycle Thinking in Infrastructure

Sharma, Lodhi, Dehalwar, and Jaiswal (2024) examined life-cycle assessment of recycled and secondary materials in road construction. Pasted text

Life-cycle assessment allows planners to evaluate environmental impacts beyond initial construction.

The same principle can be extended to social planning.

Infrastructure should be evaluated throughout its life cycle:

planning โ†’ construction โ†’ operation โ†’ maintenance โ†’ adaptation โ†’ replacement.

At each stage, planners can consider:

  • environmental impact;
  • cost;
  • accessibility;
  • disruption;
  • maintenance;
  • employment;
  • resilience.

Such a framework encourages long-term rather than short-term decision-making.


33. Solid Waste Management and Social Equity

Solid waste management is a basic urban service.

Sharma, Dehalwar, Jain, and Pandey (2025) examined AI applications and prospects in solid waste management. Pasted text

AI can potentially improve:

  • collection routes;
  • scheduling;
  • waste classification;
  • recycling;
  • monitoring.

However, waste management is also a social system involving workers and communities.

Planning should therefore consider:

  • occupational health;
  • worker safety;
  • dignity;
  • protective equipment;
  • location of waste facilities;
  • community exposure.

Technological optimisation should not replace attention to human conditions.


34. Artificial Intelligence and Socially Responsible Planning

AI is increasingly used for prediction, classification and optimisation.

The supplied research includes work on:

  • AI and social work;
  • AI and solid waste;
  • machine learning and accessibility;
  • urban growth prediction;
  • digital twins;
  • mobility modelling.

Ogbanga et al. (2025) discuss AI in social work for environmental sustainability, illustrating the broader potential of AI to connect technological systems with social and environmental objectives. Pasted text

However, AI systems inherit limitations from their data.

If informal settlements are underrepresented in datasets, AI may underestimate their needs.

If mobility datasets primarily represent smartphone users, travel patterns among digitally excluded populations may be missed.

Socially responsible AI therefore requires:

  • representative datasets;
  • transparency;
  • validation;
  • human oversight;
  • explainability;
  • continuous evaluation.

35. Digital Twins and Urban Equity

Sharma and Dehalwar’s work on urban spatial digital twins and sustainability in TOD-based development demonstrates the growing role of digital representation in urban planning. Pasted text

Digital twins can potentially integrate:

  • land use;
  • buildings;
  • transportation;
  • infrastructure;
  • environmental data;
  • population;
  • energy;
  • water.

They can support scenario testing.

For example, planners could examine how a new transport corridor might affect accessibility and land-use development.

But digital twins should also represent social realities.

A settlement that is poorly represented in the digital model can become poorly represented in the planning process.

Thus, the principle should be:

No digital representation without social representation.


36. People-Centred Smart Cities

UN-Habitat’s World Smart Cities Outlook 2024 explicitly frames smart-city development around people-centred approaches and examines technology through the lenses of sustainability, resilience, equity, social inclusion, accessibility and quality of life. UN-Habitat

This perspective is important because smart-city programmes can otherwise become technology-centred.

A smart city should not simply contain:

  • sensors;
  • cameras;
  • digital platforms;
  • AI;
  • automated systems.

It should also improve:

  • accessibility;
  • public services;
  • transparency;
  • safety;
  • environmental quality;
  • participation;
  • quality of life.

Technology should therefore be judged according to social outcomes.


37. Infrastructure and Social Resilience

Infrastructure is often discussed in engineering terms, but infrastructure also shapes social resilience.

Roads determine emergency access.

Drainage influences flood vulnerability.

Public transport influences employment access.

Water systems influence public health.

Public spaces influence social interaction.

Digital networks influence access to information.

Consequently, infrastructure should be understood as social infrastructure as well as physical infrastructure.

UN-Habitat’s World Cities Report 2024 emphasises that infrastructure deficits increase climate vulnerability and that infrastructure planning should incorporate underlying social and environmental conditions. UN-Habitat

This supports an integrated infrastructure-planning approach.


38. A Comprehensive Framework for Socially Just Human Settlements

The research reviewed in this article can be synthesised into an integrated framework with ten dimensions.

38.1 Housing justice

Adequate, affordable and secure housing.

38.2 Mobility justice

Affordable, safe and reliable mobility.

38.3 Accessibility justice

Universal access to buildings, streets and public spaces.

38.4 Infrastructure justice

Equitable distribution of essential services.

38.5 Environmental justice

Fair distribution of environmental benefits and risks.

38.6 Gender justice

Safe mobility, sanitation, public spaces and representation.

38.7 Social representation

Inclusion of historically marginalised communities.

38.8 Participatory justice

Meaningful community participation.

38.9 Ruralโ€“urban justice

Balanced access to development opportunities across regions.

38.10 Digital justice

Inclusive data and accountable technological systems.

These dimensions should be assessed together rather than independently.


39. Measuring Inclusive Human Settlements

A socially just settlement requires measurable indicators.

DimensionIndicators
HousingAffordability, tenure, overcrowding
MobilityTransit access, travel time, fare burden
WalkingFootpath coverage, crossing safety
Universal designAccessible buildings and streets
SanitationToilet, water and wastewater access
Public spacePark access, distribution and safety
GenderSafety, mobility, participation
Social inclusionService accessibility by social group
EnvironmentFlood exposure, heat, air quality
EmploymentJob accessibility
ParticipationCommunity involvement
RepresentationParticipation of marginalised groups
Digital inclusionData and service accessibility
GovernanceTransparency and accountability

Such indicators can be mapped using GIS and combined with household surveys and participatory research.


40. Spatial Accessibility as a Unifying Concept

Accessibility provides a useful bridge between housing, transport, land use and social justice.

A household’s quality of life depends not only on where it lives but on what it can reach.

Accessibility can be measured in terms of:

  • employment;
  • education;
  • healthcare;
  • public transport;
  • public spaces;
  • markets;
  • recreation.

This suggests a shift from location-based planning to access-based planning.

Instead of asking:

How many facilities exist?

planners should also ask:

How many people can reach these facilities conveniently, affordably and safely?

This is particularly relevant to the research on multimodal accessibility, first- and last-mile connectivity and public-space route choices.


41. From Equality to Equity

Equality and equity are not identical.

If every neighbourhood receives one park of the same size, this represents equality of provision.

But if one neighbourhood has a much larger population and no existing green space, identical provision may not be equitable.

Similarly, identical bus frequencies may not produce equal accessibility if some areas have large elderly populations or difficult terrain.

Equity requires context-sensitive allocation.

This principle should guide:

  • housing;
  • public transport;
  • parks;
  • sanitation;
  • healthcare;
  • infrastructure investment.

42. Vulnerability as a Multidimensional Concept

Vulnerability is rarely caused by one characteristic.

It can emerge from combinations of:

  • poverty;
  • age;
  • disability;
  • gender;
  • insecure housing;
  • environmental exposure;
  • lack of transport;
  • social exclusion.

A low-income elderly person living in an informal settlement on a flood-prone site may face multiple overlapping vulnerabilities.

Planning therefore needs multidimensional vulnerability assessments.

Such assessments can combine demographic, spatial, environmental and accessibility data.


43. The Importance of Local Context

There is no universal model of an inclusive settlement.

Planning approaches should respond to:

  • climate;
  • topography;
  • settlement morphology;
  • economic conditions;
  • social structure;
  • cultural practices;
  • governance;
  • infrastructure.

The research on hill-city public-space access demonstrates the significance of topography. The Bhopal studies illustrate the importance of local housing and informal-settlement conditions. The Tier-2-city transport studies demonstrate the need for context-sensitive mobility planning.

Therefore, context-sensitive planning should be considered a core principle.


44. Governance and Multi-Level Planning

Human settlement problems frequently cross administrative boundaries.

Housing, transport, water, waste and environmental systems often operate across municipal jurisdictions.

UN-Habitat’s World Cities Report 2024 highlights the importance of multi-level governance and stronger collaboration among national, regional and local governments, communities and civil-society actors. UN-Habitat

This is particularly important in metropolitan regions.

A fragmented governance structure can produce:

  • disconnected transportation;
  • uneven infrastructure;
  • uncontrolled fringe development;
  • inconsistent environmental management.

Metropolitan planning mechanisms can help coordinate these systems.


45. Planning Education and Professional Practice

The changing complexity of human settlements requires a broader planning skill set.

Future planners need competence in:

  • GIS;
  • spatial modelling;
  • statistics;
  • qualitative research;
  • transport planning;
  • housing;
  • environmental planning;
  • universal design;
  • participatory planning;
  • AI;
  • digital twins.

However, technical competence must be accompanied by ethical and social awareness.

A planner should be capable of asking:

  • Who benefits?
  • Who bears the cost?
  • Who is missing from the data?
  • Who participates?
  • Who may be displaced?
  • What happens over the long term?

These questions should become integral to professional planning practice.


46. Future Research Agenda

The literature points towards several important research directions.

46.1 Equity-sensitive urban-growth modelling

CAโ€“ANN and other predictive models should incorporate social vulnerability and accessibility.

46.2 Housingโ€“transport affordability

Future studies should examine housing and transportation costs together.

46.3 Informal settlement resilience

More longitudinal research is needed on upgrading and relocation outcomes.

46.4 Gender-sensitive transport

Research should examine women’s mobility patterns in smaller Indian cities.

46.5 Age-friendly planning

Older adults should be incorporated into transport and public-space planning research.

46.6 Climate-sensitive accessibility

Heat, flooding and extreme rainfall should be incorporated into accessibility models.

46.7 Socially responsible AI

Researchers should assess data gaps, bias and representation.

46.8 Digital twins and participation

Digital twins should incorporate community-generated information.

46.9 Environmental justice

Green infrastructure should be evaluated for distributional consequences.

46.10 Ruralโ€“urban transformation

More integrated studies should examine how metropolitan expansion affects rural communities.


47. Policy Implications

Several policy directions emerge from the analysis.

47.1 Integrate housing and transport planning

Affordable housing should be located with consideration of employment and public transportation.

47.2 Protect vulnerable communities during redevelopment

Redevelopment should assess displacement and livelihood impacts.

47.3 Strengthen in-situ upgrading

Where environmental and structural conditions permit, settlement improvement should be considered alongside relocation.

47.4 Mainstream universal design

Accessibility should be integrated into all infrastructure planning.

47.5 Strengthen public participation

Participation should occur before major decisions are finalised.

47.6 Improve representation

Planning institutions should incorporate the perspectives of marginalised communities.

47.7 Integrate climate and social planning

Climate adaptation should not unintentionally exclude vulnerable residents.

47.8 Use technology responsibly

AI and digital twins should improve planning without replacing community knowledge or institutional accountability.

47.9 Strengthen metropolitan governance

Urban and peri-urban development should be coordinated across administrative boundaries.

47.10 Develop social-justice indicators

Planning agencies should monitor distributional outcomes rather than only project completion.


48. Conclusion

The future of India’s human settlements will be shaped by the interaction of urbanisation, housing, transportation, environmental change, infrastructure investment, demographic transformation and technology. These processes cannot be planned independently.

The extensive body of research considered in this article demonstrates the multidimensional character of social justice.

Research on spatial injustice demonstrates that physical transformation can alter social relationships and cultural identity. Research on Bhopal’s slums demonstrates that informal settlements contain both vulnerability and resilience. Housing research demonstrates the importance of urban-fringe development. Sanitation research demonstrates the connection between infrastructure, health and dignity. Universal-design research establishes accessibility as a fundamental element of equitable environments.

Transport research adds another dimension. Bus-user satisfaction demonstrates the importance of understanding mobility from the user’s perspective. First- and last-mile studies demonstrate that major transit systems cannot function effectively without local accessibility. Research on public-space route choices demonstrates that spatial configuration influences everyday access. Work on senior citizens highlights the importance of age-sensitive mobility. Land-useโ€“transport interaction research demonstrates that housing and mobility cannot be planned independently.

The institutional dimension is equally important. Research on women’s reservation and Dalit representation demonstrates that social justice also involves representation and access to power. Participatory planning research highlights the importance of community knowledge. Methodological research on quantitative and qualitative methods and Delphi techniques provides tools for generating more comprehensive planning evidence.

The environmental dimension further reinforces the argument. Green-building research, life-cycle assessment, water-quality research, waste-management research and climate-resilience literature all demonstrate that environmental sustainability has social consequences.

Climate change makes this integration even more urgent. UN-Habitat emphasises that climate impacts can intensify existing inequalities and that vulnerable communities must be incorporated into climate action. UN-Habitat The IPCC likewise identifies urbanisation, exposure and limited adaptive capacity as interacting dimensions of urban climate risk. IPCC

The emerging digital transformation of planning provides both opportunities and challenges. CAโ€“ANN modelling, machine learning, AI and digital twins can improve spatial analysis and scenario development. However, these tools are only as inclusive as the data and institutions behind them. A digital system that excludes informal settlements, low-income households or digitally marginalised communities can reproduce rather than reduce inequality.

The concept of the people-centred smart city is therefore particularly relevant. UN-Habitat’s World Smart Cities Outlook 2024 places equity, accessibility, social inclusion, sustainability and quality of life alongside technological innovation. UN-Habitat

The central argument of this article is consequently that inclusive human settlement planning must integrate spatial, social, environmental, economic and technological dimensions.

The planning profession should move:

from infrastructure provision to equitable accessibility;

from housing construction to housing security and location;

from transport movement to accessibility;

from public consultation to meaningful participation;

from physical inclusion to social inclusion;

from isolated projects to integrated settlement systems;

from technology-centred smart cities to people-centred smart cities;

from short-term project evaluation to life-cycle assessment;

from urban-only planning to ruralโ€“urban integration; and

from development-centred planning to people-centred development.

A socially just settlement is not necessarily the settlement with the largest number of roads, buildings, technologies or infrastructure projects. It is a settlement in which diverse residents can access essential opportunities and participate meaningfully in decisions affecting their lives.

This requires planners to understand that spatial accessibility is a social issue, housing is a mobility issue, transportation is an equity issue, environmental resilience is a justice issue, technology is a governance issue and participation is a planning requirement.

The ultimate goal should be to create human settlements where people can live with dignity, security, accessibility, opportunity, participation and resilience.

Such an approach provides a stronger foundation for sustainable urban and regional development in India and offers a pathway towards settlements that are not merely more efficient or technologically advanced, but more inclusive and responsive to the people who inhabit them.


References

Agarwal, S., & Sharma, S. N. (2014). Universal design to ensure equitable society. International Journal of Engineering and Technical Research, 2(1).

Chatterjee, S., & Sharma, S. N. (2020). Review of Pradhan Mantri Gram Sadak Yojana. Think India Journal, 23(1), 33โ€“42.

Dehalwar, K., & Sharma, S. N. (2023). Fate of slums of Bhopalโ€”a tale of struggle and resilience. Think India Journal, 26(4), 4.

Dehalwar, K., & Sharma, S. N. (2024). Exploring the distinctions between quantitative and qualitative research methods. Think India Journal, 27(1), 7โ€“15.

Dehalwar, K., & Sharma, S. N. (2024). Politics in the name of women’s reservation. Contemporary Voice of Dalit. https://doi.org/10.1177/2455328X241262562

Dehalwar, K., & Sharma, S. N. (2024). Social injustice inflicted by spatial changes in vernacular settings: An analysis of published literature. ISVS e-journal, 11(9), 93โ€“113.

Jain, S., Dehalwar, K., & Sharma, S. N. (2024). Explanation of Delphi research method and expert opinion surveys. Think India, 27(4), 37โ€“48.

Kumar, G., Vyas, S., Sharma, S. N., & Dehalwar, K. (2023). Planning and development of housing in urban fringe area: Case of Bhopal (MP). GIS Business, 18(1), 1โ€“14.

Kumar, G., Vyas, S., Sharma, S. N., & Dehalwar, K. (2025). Urban growth prediction using CA-ANN model and spatial analysis for planning policy in Indore city, India. GeoJournal, 90(3), 139.

Lalramsangi, V., Garg, Y. K., & Sharma, S. N. (2025). Route choices to access public open spaces in hill cities. Environment and Urbanization ASIA, 16(2), 283โ€“299. https://doi.org/10.1177/09754253251388721

Lodhi, A. S., Jaiswal, A., & Sharma, S. N. (2024). Assessing bus users’ satisfaction using discrete choice models: A case of Bhopal. Innovative Infrastructure Solutions, 9, 437. https://doi.org/10.1007/s41062-024-01652-w

Ogbanga, M. M., Sharma, S. N., Pandey, A. K., & Singh, P. (2025). Artificial intelligence in social work to ensure environmental sustainability. In M. Nasr, A. Negm, & L. Peng (Eds.), Artificial intelligence applications for a sustainable environment (pp. 491โ€“508). Springer.

Sharma, S. N. (2012). Participatory planning in plan preparation: A case of Delhi. EduPedia Publications (P) Ltd.

Sharma, S. N. (2013). Sustainable development strategies and approaches. International Journal of Engineering and Technical Research.

Sharma, S. N. (2014). Fate of rural sanitation scheme. International Journal of Research, 1(2).

Sharma, S. N. (2019). Review of most used urban growth models. International Journal of Advanced Research in Engineering and Technology, 10.

Sharma, S. N., Chatterjee, S., & Dehalwar, K. (2023). Mahatma Gandhi National Rural Employment Guarantee Scheme: Challenges and opportunities. Think India Journal, 26(1), 7โ€“15.

Sharma, S. N., & Dehalwar, K. (2025). A systematic literature review of transit-oriented development to assess its role in economic development of city. Transportation in Developing Economies, 11(2), 23. https://doi.org/10.1007/s40890-025-00245-1

Sharma, S. N., & Dehalwar, K. (2025). Examining the inclusivity of India’s National Urban Transport Policy for senior citizens. In D. S.-K. Ting & J. A. Stagner (Eds.), Transforming healthcare infrastructure (pp. 115โ€“134). CRC Press. https://doi.org/10.1201/9781003513834-5

Sharma, S. N., & Dehalwar, K. (2025). Review of landuse transportation interaction model in smart urban growth management. European Transport/Trasporti Europei, 103, 1โ€“15.

Sharma, S. N., & Dehalwar, K. (2025). A systematic literature review of transit-oriented development to assess its role in economic development of city. Transportation in Developing Economies, 11(2), 23. https://doi.org/10.1007/s40890-025-00245-1

Sharma, S. N., Dehalwar, K., Jain, S., & Pandey, A. K. (2025). An assessment of the applications and prospects of AI tools in solid waste management. In Artificial intelligence applications for a sustainable environment (pp. 97โ€“118). Springer.

Sharma, S. N., Dehalwar, K., & Pandey, A. K. (2026). Measures to manage the urban water quality for public health. In Environmentalism in healthcare (pp. 339โ€“371).

Sharma, S. N., Dehalwar, K., & Yadav, K. (2026). Advancing travel behaviour modelling: A systematic literature review. Civil Engineering Infrastructures Journal, e108027.

Sharma, S. N., Dehalwar, K., & Yadav, K. (2026). Urban spatial digital twin in sustainability to spur economic growth in transit-oriented development-based development. In Tenable Engineering for a Sustainable Future (pp. 257โ€“300).

Sharma, S. N., Dehalwar, K., & Yadav, K. (2026). Advances in AI-based mobility modelling: Toward intelligent transport infrastructure in smart cities. In AI-Based Data Mobility and Intelligent Modeling for Smart Cities (pp. 67โ€“106).

Sharma, S. N., Dehalwar, K., Kumar, G., Yadav, K., & Verma, D. (2026). Utilization of advanced materials for permeable paving, biocrete, and piezoelectric materials in walkways to transit stations. In Engineering sustainability goals: UNSDG 12 (p. 209).

Sharma, S. N., Lodhi, A. S., Dehalwar, K., & Jaiswal, A. (2024). Life cycle assessment (LCA) of recycled & secondary materials in the construction of roads. IOP Conference Series: Earth and Environmental Science, 1326(1), 012102.

Sharma, S. N., Singh, S., Kumar, G., Pandey, A. K., & Dehalwar, K. (2025). Role of green buildings in creating sustainable neighbourhoods. IOP Conference Series: Earth and Environmental Science, 1519(1), 012018.

Verma, D., Yadav, P., & Sharma, S. N. (2026). From access to power: Dalit representation deficits across state, market, and cultural institutions in neoliberal India. Forum for Social Economics, 1โ€“26.

Yadav, K., Dehalwar, K., & Sharma, S. N. (2025). Assessing the factors affecting first and last mile accessibility in transit-oriented development: A literature review. GeoJournal, 90, 298. https://doi.org/10.1007/s10708-025-11546-8

Yadav, K., Dehalwar, K., Sharma, S. N., & Yadav, S. (2025). Understanding user satisfaction in last-mile connectivity under transit-oriented development in Tier 2 Indian cities: A climate-sensitive perspective. IOP Conference Series: Earth and Environmental Science, 1579(1), 012006. https://doi.org/10.1088/1755-1315/1579/1/012006

Yadav, K., Dehalwar, K., & Sharma, S. N. (2026). Exploring the environmental determinants of mode choice in first and last mile connectivity: Evidence from a systematic review. Innovative Infrastructure Solutions, 11(4), 204.

United Nations. (2015). Transforming our world: The 2030 Agenda for Sustainable Development. United Nations.

United Nations Human Settlements Programme (UN-Habitat). (2022). World cities report 2022: Envisaging the future of cities. UN-Habitat.

United Nations Human Settlements Programme (UN-Habitat). (2024). World cities report 2024: Cities and climate action. UN-Habitat. UN-Habitat report page

United Nations Human Settlements Programme (UN-Habitat). (2024). World smart cities outlook 2024. UN-Habitat. UN-Habitat Smart Cities Outlook

United Nations Development Programme, United Nations Human Settlements Programme, & University of Southern Denmark. (2024). Urban content of NDCs: Local climate action explored through in-depth country analyses. UN-Habitat. Urban Content of NDCs report

World Health Organization. (2021). Global report on ageism. World Health Organization.

Intergovernmental Panel on Climate Change. (2022). Cities, settlements and key infrastructure. In Climate change 2022: Impacts, adaptation and vulnerability. Cambridge University Press. IPCC Chapter 6
:::

If you could start a new business right now, what would it be?

View all responses

Social Justice and Inclusive Human Settlements in India: Integrating Housing, Mobility, Infrastructure, Participation and Emerging Technologies

Dr. Kavita Dehalwar

Abstract

The transformation of human settlements in India is occurring through rapid urbanisation, peri-urban expansion, changing housing markets, infrastructure development, migration, technological transformation and environmental change. These processes have created substantial opportunities for economic development, improved connectivity and better access to services, but they have also produced persistent inequalities in housing, sanitation, transportation, public space, employment, environmental quality and political participation. Social justice in human settlement planning therefore requires more than the provision of physical infrastructure. It requires an integrated understanding of how spatial decisions affect different social groups and how access to opportunities is distributed across space. This article examines the relationship between social justice and spatial development in India by synthesising research on social injustice in vernacular settings, informal settlements, housing in urban fringe areas, sanitation, universal design, women’s representation, caste-based representation, rural employment, public transport, first- and last-mile accessibility, transit-oriented development, public-space accessibility, land-useโ€“transport interaction, green buildings, life-cycle assessment, urban growth modelling, artificial intelligence and digital twins. The article argues that housing, mobility, infrastructure, environment and participation should be treated as interconnected components of an inclusive human-settlement system. It proposes a framework based on distributive justice, recognitional justice, procedural justice, representational justice, spatial accessibility, affordability, environmental justice and technological accountability. The article further argues that emerging analytical technologies can improve planning decisions only when combined with qualitative knowledge, participatory processes and careful attention to data gaps. The future of Indian planning should therefore move from infrastructure-centred development towards people-centred, context-sensitive and evidence-based spatial development in which diverse communities can access opportunities, participate in decision-making and live with dignity, security and resilience.

Keywords: social justice; inclusive human settlements; spatial inequality; housing; informal settlements; transport accessibility; universal design; participatory planning; urbanisation; India; environmental justice; artificial intelligence


1. Introduction

Human settlements are among the most important physical manifestations of social, economic, political and cultural relationships. Houses, streets, neighbourhoods, transportation networks, public spaces, markets, institutions and environmental infrastructure together constitute the places in which people live their everyday lives. Consequently, planning decisions about land use and infrastructure are simultaneously decisions about access, opportunity, identity, safety and social inclusion.

India is experiencing profound transformation in its human settlements. Metropolitan regions are expanding beyond traditional municipal boundaries; villages are becoming incorporated into urban systems; Tier-2 and Tier-3 cities are experiencing increasing development pressures; informal settlements continue to provide housing for economically vulnerable households; and transportation systems are being reconfigured around new patterns of employment and consumption. At the same time, digital technologies, artificial intelligence, machine learning, geographic information systems and digital twins are changing how planners understand and manage urban systems.

The challenge is that development does not affect all populations equally.

A new road may improve accessibility for some communities while dividing another neighbourhood. A new transit corridor may reduce travel time but also increase land values. A housing project may provide formal dwellings but locate households far from employment. A new green space may improve environmental quality but increase development pressure around its boundaries. A redevelopment programme may improve physical infrastructure while weakening existing social networks.

These examples demonstrate that spatial development cannot be evaluated only through physical or economic indicators. It must also be evaluated in terms of social justice.

Dehalwar and Sharma (2024), in their study Social injustice inflicted by spatial changes in vernacular settings: An analysis of published literature, highlight the importance of examining the social consequences of spatial transformation. Their work provides a valuable starting point for understanding the relationship between physical change and social inequality.

Similarly, Dehalwar and Sharma’s (2023) research on the Fate of slums of Bhopalโ€”a tale of struggle and resilience brings attention to the lived experiences of communities in informal settlements.

The wider research portfolio supplied for this article also contains studies on housing, sanitation, public transport, universal design, rural employment, womenโ€™s reservation, Dalit representation, public-space accessibility, green buildings, urban growth modelling, artificial intelligence and digital twins. These works provide complementary perspectives on the relationship between spatial development and social outcomes.

This article argues that social justice should be treated as a fundamental planning objective rather than a supplementary social consideration. An inclusive human settlement is not simply one with adequate infrastructure. It is one in which different groups can access opportunities, services and public spaces; participate in decisions; retain social and cultural relationships; and benefit equitably from development.


2. Conceptualising Social Justice in Spatial Planning

Social justice in planning can be understood through several related dimensions.

2.1 Distributive justice

Distributive justice concerns how land, housing, infrastructure, public services and environmental benefits are distributed. A city in which high-income neighbourhoods have excellent infrastructure while low-income communities experience inadequate sanitation or transportation demonstrates spatially unequal distribution.

2.2 Recognitional justice

Recognitional justice requires planners to acknowledge differences among communities. Older adults, children, persons with disabilities, women, migrants, informal workers and socially marginalised groups may have different spatial requirements.

2.3 Procedural justice

Procedural justice concerns participation in decision-making. People affected by planning decisions should have meaningful opportunities to express their priorities and influence outcomes.

2.4 Representational justice

Representational justice concerns institutional power. Dehalwar and Sharma’s (2024) work on women’s reservation and Verma, Yadav, and Sharma’s (2026) study of Dalit representation demonstrate the importance of considering who participates in institutions and who has access to decision-making power.

These four dimensions are interconnected. Infrastructure distribution may be unequal because certain communities have limited political representation. Similarly, a group may have formal access to a service but remain excluded because the service does not recognise its specific needs.

Therefore, socially just planning should combine physical, social and institutional analysis.


3. Spatial Transformation and Social Inequality

Spatial transformation is an inevitable component of urbanisation. Agricultural land becomes urban land, villages become incorporated into metropolitan regions, traditional neighbourhoods experience redevelopment, and new transport infrastructure restructures accessibility.

However, spatial transformation is not socially neutral.

Dehalwar and Sharma (2024) argue, through their examination of published literature on social injustice in vernacular settings, that spatial changes can have consequences extending beyond physical form. Traditional spatial arrangements can contain social relationships, cultural practices and collective identities. When such environments are transformed without adequate understanding of their social significance, physical redevelopment can produce social disruption.

This issue is particularly relevant to Indian cities, where traditional neighbourhoods and villages are increasingly exposed to market-led development.

The transformation of settlement morphology can alter:

  • patterns of social interaction;
  • access to common spaces;
  • local livelihoods;
  • cultural identity;
  • pedestrian routes;
  • housing affordability;
  • property ownership; and
  • community networks.

Consequently, planners should assess not only what physical development will be constructed but also what existing social systems may be affected.

This requires a more comprehensive approach to impact assessment.


4. Urbanisation, Metropolitan Expansion and the Urban Fringe

The urban fringe is one of the most rapidly changing components of India’s settlement system.

Kumar, Vyas, Sharma, and Dehalwar (2023) examined the planning and development of housing in the urban fringe area of Bhopal, highlighting the importance of understanding peripheral development.

Urban fringe areas often contain multiple land-use systems simultaneously:

  • agricultural land;
  • villages;
  • informal settlements;
  • plotted housing;
  • institutional campuses;
  • industrial development;
  • commercial corridors; and
  • new residential projects.

This mixture produces complex planning challenges.

Agricultural land may be converted into housing, while existing villages become surrounded by new development. Landowners may receive financial benefits from land conversion, but agricultural labourers may lose livelihoods. Existing residents may experience improved infrastructure but also rising property taxes, land values and living costs.

Urban fringe development can therefore create both opportunities and vulnerabilities.

One solution is to strengthen metropolitan-scale planning that coordinates land use, transportation, housing, environmental protection and rural development.

Rather than treating villages at the urban edge as residual spaces awaiting urbanisation, planners should recognise them as existing communities with their own social and economic systems.


5. Predictive Urban Growth and Socially Responsible Planning

Predictive modelling provides an important tool for managing urban growth.

Kumar, Vyas, Sharma, and Dehalwar (2025) examined urban growth prediction using a CAโ€“ANN model and spatial analysis for planning policy in Indore city. The work demonstrates how Cellular Automata and Artificial Neural Networks can be used to understand potential spatial patterns of urban expansion. The supplied bibliography records this work in GeoJournal, 90(3).

Predictive models can assist planners in identifying:

  • potential growth corridors;
  • areas of future land conversion;
  • infrastructure requirements;
  • development pressure zones;
  • areas requiring environmental protection; and
  • potential conflicts between growth and existing land uses.

However, a prediction is not a planning recommendation.

A model can estimate where urban growth may occur, but it cannot independently determine whether such growth is equitable. Social variables should therefore be incorporated into scenario analysis.

For example, a growth scenario could be evaluated using:

  • accessibility to employment;
  • housing affordability;
  • service coverage;
  • environmental risk;
  • displacement potential;
  • public-transport access; and
  • proximity to schools and healthcare.

The combination of predictive modelling and social indicators can produce more socially responsible planning scenarios.


6. Informal Settlements and the Politics of Recognition

Informal settlements are frequently described through deficiencies: inadequate housing, poor sanitation, insecure tenure and limited infrastructure. Such descriptions are factually important but incomplete.

Dehalwar and Sharma (2023), through their study of slums in Bhopal, emphasise the dimensions of struggle and resilience.

Residents of informal settlements often create extensive social and economic systems. These can include:

  • informal employment networks;
  • neighbourhood associations;
  • shared childcare;
  • informal credit;
  • community support;
  • local markets; and
  • adaptive housing practices.

Therefore, the destruction or relocation of an informal settlement can result in the loss of social capital.

A planning approach centred solely on physical improvement may fail to recognise these assets.

Where feasible, in-situ upgrading can be considered. Such upgrading can include:

  • water supply;
  • sanitation;
  • drainage;
  • road improvement;
  • street lighting;
  • waste management;
  • housing improvement;
  • tenure security; and
  • public-space development.

Relocation may still be necessary in locations subject to severe environmental hazards, but where relocation is required, social and livelihood impacts should be carefully assessed.


7. Housing, Affordability and Spatial Opportunity

Housing is more than shelter. It determines the location from which households access employment, education, healthcare and social networks.

The housing question therefore has both physical and spatial dimensions.

Kumar et al. (2023) demonstrate the importance of understanding housing development within the wider transformation of urban fringe areas.

Sharma and Dehalwar’s work on housing design and planning similarly indicates the importance of integrating housing with broader settlement planning.

Housing affordability should ideally be evaluated through a broader concept of housing burden.

A household’s effective housing cost may include:

housing cost + transportation cost + utility cost + maintenance cost + opportunity cost of location.

This is particularly important when affordable housing is located far from employment.

A household may pay less for housing but spend significantly more on transportation. Long commuting times can also reduce time available for childcare, education and community participation.

Consequently, affordable housing policies should be coordinated with:

  • employment location;
  • public transport;
  • pedestrian infrastructure;
  • schools;
  • healthcare;
  • markets; and
  • public spaces.

8. Housing Diversity and Inclusive Settlement Design

Housing policy often assumes a standard household structure. However, Indian cities contain highly diverse household arrangements.

These include:

  • nuclear families;
  • joint families;
  • elderly households;
  • women-headed households;
  • single-person households;
  • students;
  • migrants;
  • informal workers; and
  • temporary workers.

A single housing typology cannot adequately address all these needs.

Inclusive housing should therefore consider flexibility, affordability, accessibility and adaptability.

Universal design should also be integrated into housing from the beginning.

Agarwal and Sharma (2014), in their work on universal design to ensure equitable society, emphasise the importance of designing environments that support wider social inclusion.

Universal design can reduce the need for costly future modifications and can support people across different stages of life.


9. Sanitation as a Question of Social Justice

Sanitation is one of the clearest examples of the connection between infrastructure and human dignity.

Sharma’s work on the fate of rural sanitation schemes illustrates the importance of sanitation beyond the construction of physical facilities.

Similarly, the work on best practices for ensuring total sanitation indicates that successful sanitation requires more than isolated infrastructure.

A complete sanitation system requires:

  1. access to safe toilets;
  2. adequate water;
  3. collection;
  4. treatment;
  5. safe disposal;
  6. maintenance;
  7. behavioural support; and
  8. institutional accountability.

Inadequate sanitation can disproportionately affect poorer communities.

It can also create environmental externalities by contaminating water bodies and groundwater.

Sharma, Dehalwar, and Pandey (2026) examined measures to manage urban water quality for public health, connecting environmental water management with health. The supplied publication list identifies the chapter in Environmentalism in Healthcare.

Sanitation should consequently be integrated into spatial planning, public-health policy and environmental management.


10. Universal Design and an Age-Friendly City

Universal design is an essential component of inclusive planning.

Agarwal and Sharma’s (2014) work provides a foundation for considering universal design as a mechanism for equitable society.

The concept should be applied across:

  • buildings;
  • streets;
  • public transport;
  • parks;
  • government offices;
  • educational institutions;
  • healthcare facilities; and
  • public spaces.

Accessibility includes more than wheelchair access.

An inclusive environment should also accommodate:

  • older adults;
  • children;
  • pregnant women;
  • people carrying goods;
  • people with temporary injuries;
  • people with visual or hearing impairments; and
  • people with reduced mobility.

Sharma and Dehalwar (2025) examined the inclusivity of India’s National Urban Transport Policy for senior citizens, highlighting the mobility requirements of older populations.

Age-friendly planning is increasingly important because longer life expectancy changes the demographic structure of settlements.

A city that is accessible to older adults is often also more convenient for children, families and people with temporary mobility limitations.


11. Public Transport and Transport Justice

Transportation is a central mechanism through which spatial inequality is experienced.

Lodhi, Jaiswal, and Sharma (2024) examined bus-user satisfaction using discrete choice models in Bhopal.

The importance of such research lies in its user-centred perspective.

Traditional transport planning often prioritises:

  • traffic speed;
  • road capacity;
  • vehicle movement; and
  • intersection performance.

However, users experience transport systems through:

  • waiting time;
  • reliability;
  • comfort;
  • affordability;
  • safety;
  • accessibility; and
  • connectivity.

A transport system can be technically efficient while remaining socially unsatisfactory.

Therefore, transport evaluation should combine engineering indicators with user-experience indicators.


12. First- and Last-Mile Accessibility

Public transport cannot provide complete mobility unless people can reach transit stations and destinations.

Yadav, Dehalwar, and Sharma (2025) examined factors affecting first- and last-mile accessibility in transit-oriented development through a literature review. The study is particularly relevant because the success of transit-oriented development depends on the connections between high-capacity transit and local neighbourhoods.

First- and last-mile barriers can include:

  • missing footpaths;
  • unsafe crossings;
  • long distances;
  • steep gradients;
  • poor lighting;
  • inadequate cycling infrastructure;
  • unreliable feeder services; and
  • lack of universal accessibility.

The issue becomes particularly important in Indian Tier-2 cities, where transit systems may be less extensive than those of large metropolitan regions.

Yadav et al. (2025) also examined user satisfaction in last-mile connectivity under TOD in Tier-2 Indian cities from a climate-sensitive perspective.

This expands the concept of accessibility by recognising that climate conditions influence walking and cycling decisions.

Heat, rain and extreme weather can become significant barriers to active mobility.


13. Environmental Determinants of Mobility

Mobility choices are influenced not only by travel time and cost but also by environmental conditions.

Yadav, Dehalwar, and Sharma (2026) examined environmental determinants of mode choice in first- and last-mile connectivity through a systematic review.

This line of research is important for socially inclusive mobility because environmental conditions can affect different groups differently.

For example:

  • elderly people may be more sensitive to heat;
  • children may face greater safety risks;
  • people with disabilities may face greater difficulty with poor surfaces;
  • women may be more sensitive to perceived safety;
  • low-income households may have fewer alternatives to walking.

Consequently, transport planning should include environmental comfort and safety as part of accessibility.


14. Public Open Spaces and Spatial Accessibility

Public open spaces contribute to health, recreation and social interaction.

Lalramsangi, Garg, and Sharma (2025) studied route choices to access public open spaces in hill cities, demonstrating that accessibility depends upon spatial configuration and route characteristics.

The research is especially relevant to hilly settlements, where conventional measures of distance may fail to capture the actual difficulty of movement.

A destination may be geographically close but difficult to reach because of:

  • steep slopes;
  • stairs;
  • indirect routes;
  • narrow paths;
  • barriers; or
  • poor connectivity.

This suggests that accessibility analysis should consider actual routes rather than only Euclidean distance.

Public-space planning should therefore integrate spatial analysis with user experience.


15. Transit-Oriented Development and Social Equity

Transit-oriented development has become an important planning strategy for integrating land use and transportation.

Sharma and Dehalwar (2025) conducted a systematic literature review of TOD and its relationship with economic development. Their work is relevant to understanding the broader economic implications of transit-oriented urban development.

Yadav et al. (2025) further examine first- and last-mile accessibility within TOD environments.

However, TOD should also be assessed through social justice.

Improved transit accessibility can increase land values. This can produce benefits for property owners while creating affordability pressures for renters and low-income households.

Therefore, socially inclusive TOD should consider:

  • affordable housing;
  • existing residents;
  • displacement risk;
  • pedestrian accessibility;
  • universal design;
  • public-space provision;
  • employment access; and
  • community participation.

TOD should not simply become a strategy for increasing development intensity around stations.

Its broader objective should be to create accessible and mixed-use communities.


16. Land Useโ€“Transport Interaction and Spatial Equity

Land-use and transport systems influence one another.

Sharma and Dehalwar (2025) reviewed land-use transportation interaction models in smart urban growth management.

This relationship is central to social justice.

Land-use decisions determine:

  • where people live;
  • where jobs are located;
  • where schools are built;
  • where healthcare is available; and
  • where public transport demand emerges.

Transport decisions then influence land values, development density and investment.

If these systems are planned independently, spatial inequality can increase.

For example, low-income housing may be developed without corresponding employment or transport infrastructure. Alternatively, transport investment may be concentrated in already prosperous areas.

Integrated land-use and transport planning can reduce such mismatches.


17. Gender and Inclusive Planning

Gender influences how people experience urban space.

Women’s mobility can be affected by:

  • safety;
  • household responsibilities;
  • childcare;
  • employment patterns;
  • transport availability; and
  • social norms.

Dehalwar and Sharma’s (2024) research on politics in the name of women’s reservation provides an important institutional dimension to gender inclusion.

Representation matters because planning priorities are shaped by institutions.

However, numerical representation alone does not guarantee substantive participation.

Gender-responsive planning can include:

  • safe streets;
  • adequate lighting;
  • accessible sanitation;
  • safe public transport;
  • childcare facilities;
  • mixed-use development;
  • inclusive public spaces; and
  • meaningful participation in planning.

Women’s mobility should also be analysed through trip chaining rather than only conventional home-to-work commuting.


18. Caste and Spatial Inclusion

Caste is an important dimension of social inequality in India.

Spatial planning cannot be separated from wider social structures that influence access to resources and institutions.

Verma, Yadav, and Sharma (2026), in their study From access to power: Dalit representation deficits across state, market, and cultural institutions in neoliberal India, examine representation from an institutional perspective.

The planning implication is that spatial access and institutional access are interconnected.

A community may have physical proximity to public facilities but still experience exclusion if it lacks meaningful representation.

Planning research should therefore investigate both:

Where are services located?

and

Who has the capacity to influence their provision?

Participatory planning can help address this gap, but participation must be structured to ensure that marginalised groups are not dominated by more powerful stakeholders.


19. Rural Employment and Human Settlement Equity

Rural development is an integral part of the social-justice agenda.

Sharma, Chatterjee, and Dehalwar (2023) examined the Mahatma Gandhi National Rural Employment Guarantee Scheme, identifying challenges and opportunities associated with rural employment.

Employment programmes can contribute to settlement resilience by providing household income while supporting local infrastructure.

Similarly, Chatterjee and Sharma’s (2020) review of the Pradhan Mantri Gram Sadak Yojana highlights the importance of rural connectivity.

Rural roads can improve access to:

  • markets;
  • schools;
  • healthcare;
  • employment; and
  • government services.

However, physical connectivity alone is insufficient.

Infrastructure should be accompanied by service availability and livelihood opportunities.

This reinforces the need to consider rural and urban development as part of a continuous regional system.


20. Ruralโ€“Urban Continuum

The distinction between rural and urban areas is increasingly difficult to maintain in rapidly developing regions.

Villages around metropolitan areas can become economically dependent on cities. Residents may commute to urban employment while maintaining rural housing. Agricultural land may be converted to residential use. Urban infrastructure may extend into rural administrative areas.

This creates a ruralโ€“urban continuum.

Planning at the metropolitan scale should therefore consider:

  • rural livelihoods;
  • agricultural land;
  • migration;
  • housing;
  • transportation;
  • environmental resources;
  • public services; and
  • peri-urban governance.

Failure to recognise these relationships can produce fragmented development.


21. Participatory Planning and Community Knowledge

Participatory planning provides an institutional mechanism for incorporating community knowledge.

Sharma’s work on participatory planning in plan preparation provides a foundation for this approach.

Residents often understand their neighbourhoods through everyday experience.

They know:

  • where water accumulates;
  • which paths are unsafe;
  • where informal markets operate;
  • which public spaces are important;
  • where transport services are unreliable;
  • which services are difficult to reach; and
  • which local institutions provide community support.

Such information may not be visible in conventional planning datasets.

Participation can therefore improve both social legitimacy and technical understanding.

However, participation must be meaningful.

A public meeting in which residents are informed of a predetermined project is not equivalent to participation in which alternatives are discussed.

Meaningful participation should occur throughout:

  1. problem identification;
  2. priority setting;
  3. option development;
  4. plan formulation;
  5. implementation; and
  6. monitoring.

22. Quantitative and Qualitative Research in Planning

Dehalwar and Sharma (2024) examined the distinctions between quantitative and qualitative research methods, an issue with direct relevance to social-justice research.

Quantitative approaches can identify patterns of inequality through:

  • census data;
  • GIS;
  • surveys;
  • statistical analysis;
  • accessibility modelling; and
  • spatial indicators.

Qualitative methods can reveal:

  • perceptions;
  • experiences;
  • social relationships;
  • cultural meanings;
  • institutional barriers; and
  • community priorities.

Neither approach is sufficient in every situation.

A mixed-method approach can identify both the spatial pattern of inequality and the mechanisms producing it.

For example, GIS may demonstrate that a neighbourhood is far from healthcare facilities. Interviews may reveal that the real problem is not distance alone but unaffordable transportation.

This demonstrates why social-justice planning requires methodological pluralism.


23. Delphi Methods and Expert Knowledge

Jain, Dehalwar, and Sharma (2024) examined the Delphi research method and expert opinion surveys.

Delphi methods can be useful where planning decisions involve uncertainty and require structured expert judgement.

Potential applications include:

  • identifying social-justice indicators;
  • evaluating accessibility criteria;
  • prioritising infrastructure;
  • assessing urban-growth scenarios;
  • developing resilience strategies; and
  • evaluating planning policies.

Expert opinion should not replace community knowledge. Instead, expert judgement and community experience can complement one another.


24. Environmental Justice

Environmental risks and benefits are often spatially uneven.

Low-income communities may be located in areas with:

  • flooding;
  • pollution;
  • inadequate drainage;
  • waste facilities;
  • poor air quality; or
  • limited green space.

At the same time, environmental improvements may generate new inequalities if they increase property values and displace existing communities.

This creates a central planning question:

How can environmental improvement be achieved without reproducing social exclusion?

The answer requires environmental impact assessment to be combined with social-impact assessment.

Green infrastructure should therefore be evaluated according to:

  • environmental benefits;
  • distribution of benefits;
  • distribution of costs;
  • affordability;
  • displacement risk; and
  • accessibility.

25. Green Buildings and Social Sustainability

Sharma, Singh, Kumar, Pandey, and Dehalwar (2025) examined the role of green buildings in creating sustainable neighbourhoods.

Green buildings can contribute to:

  • energy efficiency;
  • water conservation;
  • indoor environmental quality;
  • reduced resource consumption; and
  • lower environmental impacts.

However, social sustainability requires broader consideration.

A green building should also be:

  • accessible;
  • affordable;
  • connected to transportation;
  • integrated with public spaces; and
  • suitable for diverse users.

Green development should therefore not be limited to technological features such as energy systems or materials.

The neighbourhood context matters.


26. Life-Cycle Assessment and Equitable Infrastructure

Sharma, Lodhi, Dehalwar, and Jaiswal (2024) examined life-cycle assessment of recycled and secondary materials in road construction.

Life-cycle assessment can improve infrastructure planning by considering impacts across the full life of materials and projects.

From a social-justice perspective, life-cycle thinking can be extended beyond environmental impacts.

Infrastructure should also be evaluated in terms of:

  • maintenance;
  • accessibility;
  • long-term affordability;
  • resilience;
  • employment;
  • community disruption; and
  • future adaptability.

A road that is inexpensive to construct but difficult to maintain may impose future costs on municipalities and communities.

Thus, long-term infrastructure planning is also a question of intergenerational justice.


27. Waste Management and Social Inclusion

Waste management is both an environmental and social service.

Sharma, Dehalwar, Jain, and Pandey (2025) examined applications and prospects of AI tools in solid waste management, illustrating the growing use of technology in environmental-service delivery.

AI can potentially improve:

  • route optimisation;
  • collection scheduling;
  • waste classification;
  • monitoring;
  • recycling;
  • demand prediction; and
  • resource efficiency.

However, technological solutions must be evaluated alongside the social conditions of waste workers and communities.

Waste-management planning should address occupational health, safety, dignity and access to protective equipment.

The distribution of waste facilities also requires environmental-justice analysis.


28. Artificial Intelligence and Social Justice

AI is increasingly entering planning, infrastructure and environmental management.

The supplied bibliography includes work on AI in solid waste management, AI in social work for environmental sustainability, machine learning for accessibility and AI-supported urban growth prediction.

Ogbanga, Sharma, Pandey, and Singh (2025), for example, examine artificial intelligence in social work to ensure environmental sustainability.

The relevance to planning lies in the possibility of using AI to connect environmental and social information.

However, AI systems depend on data.

If data exclude:

  • informal settlements;
  • informal workers;
  • low-income households;
  • women;
  • people without digital access; or
  • rural populations,

then algorithmic outputs may reproduce existing inequalities.

Therefore, socially responsible AI requires:

  1. representative data;
  2. transparency;
  3. validation;
  4. human oversight;
  5. community accountability; and
  6. monitoring of unequal impacts.

29. Digital Twins and Inclusive Urban Management

Digital twins offer a more dynamic approach to urban planning.

Sharma and Dehalwar (2026) examined the role of urban spatial digital twins in sustainability and transit-oriented development.

Digital twins can potentially integrate:

  • land use;
  • transportation;
  • buildings;
  • environmental conditions;
  • infrastructure;
  • population;
  • energy;
  • water; and
  • real-time sensor data.

Such systems can help planners test alternative scenarios.

For example, a digital twin could be used to examine how a new transit station might influence:

  • accessibility;
  • traffic;
  • development density;
  • land values;
  • public-space use; and
  • environmental conditions.

However, social variables must be included.

A technically advanced digital twin that does not adequately represent informal settlements or vulnerable populations may produce misleading planning scenarios.

The future of digital planning should therefore combine computational representation with participatory representation.


30. Social Justice and Smart Urban Growth

Smart growth should not simply mean data-driven growth.

A genuinely smart settlement should be capable of identifying inequalities and responding to them.

Sharma’s earlier review of commonly used urban growth models provides a foundation for understanding how different modelling approaches can contribute to urban planning.

The next generation of smart planning should integrate:

spatial intelligence + social intelligence + environmental intelligence + institutional intelligence.

Spatial intelligence identifies patterns.

Social intelligence identifies lived experiences.

Environmental intelligence identifies ecological risks.

Institutional intelligence identifies governance constraints.

Only their combination can support socially just planning.


31. A Framework for Inclusive Human Settlement Planning

Based on the literature discussed above, an integrated framework can be developed around ten dimensions.

31.1 Housing justice

Every household should have access to adequate, affordable and secure housing.

31.2 Mobility justice

Residents should have affordable, safe and accessible transportation.

31.3 Accessibility justice

Public buildings, streets and spaces should be usable by diverse populations.

31.4 Environmental justice

Environmental risks and benefits should be distributed equitably.

31.5 Infrastructure justice

Basic infrastructure should be provided according to need rather than market value alone.

31.6 Gender justice

Planning should account for women’s safety, mobility and participation.

31.7 Social and caste inclusion

Historically marginalised groups should have access to resources and decision-making.

31.8 Participatory justice

Communities should meaningfully influence development decisions.

31.9 Ruralโ€“urban justice

Development opportunities should not be concentrated exclusively in metropolitan areas.

31.10 Digital justice

Technology-driven planning should ensure representation and accessibility in data and decision-making.


32. Indicators for Measuring Socially Just Settlements

The framework can be operationalised through measurable indicators.

DimensionPossible Indicators
HousingHousing affordability, tenure security, crowding
TransportPublic transport coverage, fare burden, travel time
WalkingFootpath coverage, crossing safety, route accessibility
Universal designAccessible buildings, ramps, tactile systems
SanitationToilet access, wastewater treatment, drainage
Public spacePark accessibility, open-space distribution
GenderSafety, women’s mobility, representation
Social inclusionAccess to services across social groups
EnvironmentFlood exposure, air quality, green-space access
EmploymentJob accessibility, livelihood security
ParticipationCommunity involvement in planning
Digital inclusionData coverage, access to digital services
GovernanceRepresentation, transparency, accountability

These indicators should not be treated as a universal checklist. Their selection should be adapted to local context.


33. From Equality to Equity

An important distinction in social planning is between equality and equity.

Equality means providing the same intervention to everyone.

Equity means responding according to different levels of need.

For example, providing one bus stop per kilometre across every neighbourhood may appear equal. However, a settlement with many older adults or persons with disabilities may require more accessible and closely connected services.

Similarly, providing identical housing units to every household may not be equitable if household sizes and needs differ.

Equity therefore requires differentiated planning.

This does not mean arbitrary discrimination. It means recognising existing inequalities and designing interventions to address them.


34. Planning for Vulnerability

Vulnerability is multidimensional.

A household may be vulnerable because of:

  • low income;
  • insecure tenure;
  • disability;
  • age;
  • gender;
  • caste-based exclusion;
  • environmental exposure;
  • lack of transport;
  • lack of digital access; or
  • insecure employment.

Multiple vulnerabilities can overlap.

For example, an elderly person living alone in a peripheral settlement may experience simultaneous challenges related to mobility, healthcare access, transportation and social isolation.

Planning should therefore move beyond single-category vulnerability assessments.

A multi-dimensional vulnerability framework can provide a more realistic understanding of settlement conditions.


35. The Role of Local Context

There is no single model of an inclusive Indian settlement.

Planning solutions must respond to:

  • climate;
  • topography;
  • settlement morphology;
  • economic structure;
  • cultural practices;
  • governance;
  • infrastructure;
  • demographic composition.

Research on public-space accessibility in hill cities demonstrates why topography matters. Research on Bhopal’s slums demonstrates the importance of local socio-economic conditions. Research on Tier-2 cities demonstrates why transport solutions developed for major metropolitan areas cannot automatically be transferred elsewhere.

Context-sensitive planning is therefore essential.


36. Implications for Planning Education

Planning education should also respond to the changing understanding of social justice.

Students of architecture and planning should be trained in:

  • spatial analysis;
  • GIS;
  • statistics;
  • qualitative research;
  • participatory planning;
  • transport planning;
  • housing;
  • environmental planning;
  • universal design;
  • social-impact assessment;
  • AI and digital technologies.

But technical skills should be combined with ethical reasoning.

A planner must understand not only how to model a city but also how planning decisions affect people.

The research methodology works of Dehalwar and Sharma (2024) and Jain et al. (2024) are relevant here because they reinforce the importance of methodological understanding in planning research.


37. Future Research Directions

The literature suggests several priorities for future research.

37.1 Spatial inequality mapping

More detailed GIS-based studies are required to map inequality at neighbourhood and settlement scales.

37.2 Housing and transport integration

Research should examine housing affordability together with transportation costs.

37.3 Informal-settlement upgrading

Longitudinal research is needed to evaluate the social outcomes of in-situ upgrading versus relocation.

37.4 Gender-responsive mobility

More research is needed on women’s mobility in Tier-2 and Tier-3 cities.

37.5 Age-friendly transportation

Research should examine how older adults interact with changing transport systems.

37.6 Accessibility and climate

Future studies should integrate heat, rainfall and other environmental conditions into accessibility modelling.

37.7 Socially responsible AI

AI research should examine representation, algorithmic bias and the exclusion of marginalised populations.

37.8 Digital twins

Digital twins should incorporate social and participatory dimensions.

37.9 Environmental justice

Green infrastructure should be evaluated for potential displacement and unequal distribution of benefits.

37.10 Ruralโ€“urban transformation

More integrated research is required on metropolitan expansion and the transformation of rural livelihoods.


38. Conclusion

The future of India’s human settlements depends not only on how rapidly cities and regions develop but also on how equitably the benefits of development are distributed.

The research considered in this article demonstrates that social justice is inherently spatial. Housing determines access to opportunity. Transportation determines mobility. Public spaces influence social interaction. Sanitation influences health and dignity. Urban growth affects land and livelihoods. Environmental interventions influence both resilience and land values. Political representation affects whose priorities are incorporated into planning.

The supplied research portfolio provides a particularly useful multidisciplinary foundation for understanding these relationships.

Dehalwar and Sharma’s (2024) research on spatial injustice demonstrates that changes to physical environments can produce social consequences. Their study of Bhopal’s slums demonstrates that informal settlements should be understood through both vulnerability and resilience. Housing research in Bhopal’s urban fringe demonstrates the complexity of peripheral development. Research on universal design establishes accessibility as a foundation of equitable environments. Research on women’s reservation and Dalit representation highlights the institutional dimension of justice.

Transport research further expands the argument. Bus-user satisfaction research demonstrates the importance of user experience. First- and last-mile research demonstrates that transit accessibility depends on local connections. Research on public-space route choices demonstrates the importance of spatial configuration. Work on senior citizens highlights age-sensitive mobility. Research on land-useโ€“transport interaction demonstrates the interdependence between spatial development and mobility.

The environmental dimension is equally important. Research on green buildings, recycled road materials, water quality and waste management demonstrates that sustainability must be integrated with social outcomes.

Finally, the increasing use of CAโ€“ANN models, machine learning, AI and digital twins offers powerful new tools for planning. However, these technologies should be understood as decision-support mechanisms rather than replacements for planning judgement, community knowledge and institutional accountability.

The central proposition of this article is therefore that inclusive human settlement planning requires the integration of spatial, social, environmental, economic and technological perspectives.

Planning for social justice does not mean providing identical environments to everyone. It means recognising differences in need and ensuring that all groups have meaningful access to opportunities, services and decision-making.

A socially just settlement should provide adequate housing, accessible transportation, safe public spaces, sanitation, employment opportunities and environmental quality. It should also protect communities from unnecessary displacement and provide meaningful mechanisms for participation.

The future planning paradigm should therefore move:

from infrastructure provision to accessibility;

from housing construction to housing security;

from mobility to meaningful access;

from consultation to participation;

from physical inclusion to social inclusion;

from technological efficiency to accountable innovation;

from isolated urban planning to ruralโ€“urban integration; and

from development-centred planning to people-centred planning.

India’s cities and regions are too diverse to be governed by a single universal spatial model. The appropriate approach is one that combines advanced analytical tools with local knowledge, community participation and social sensitivity.

The ultimate measure of a settlement should not simply be how efficiently it functions, how rapidly it grows or how technologically advanced it becomes. It should also be whether people of different backgrounds, incomes, ages, abilities and social circumstances can live there with dignity, security, accessibility, participation and opportunity.

That is the foundation of socially just and inclusive human settlements.


References

Agarwal, S., & Sharma, S. N. (2014). Universal design to ensure equitable society. International Journal of Engineering and Technical Research, 2(1).

Chatterjee, S., & Sharma, S. N. (2020). Review of Pradhan Mantri Gram Sadak Yojana. Think India Journal, 23(1), 33โ€“42.

Dehalwar, K., & Sharma, S. N. (2023). Fate of slums of Bhopalโ€”a tale of struggle and resilience. Think India Journal, 26(4), 4.

Dehalwar, K., & Sharma, S. N. (2024). Exploring the distinctions between quantitative and qualitative research methods. Think India Journal, 27(1), 7โ€“15.

Dehalwar, K., & Sharma, S. N. (2024). Politics in the name of women’s reservation. Contemporary Voice of Dalit. https://doi.org/10.1177/2455328X241262562

Dehalwar, K., & Sharma, S. N. (2024). Social injustice inflicted by spatial changes in vernacular settings: An analysis of published literature. ISVS e-journal, 11(9), 93โ€“113.

Jain, S., Dehalwar, K., & Sharma, S. N. (2024). Explanation of Delphi research method and expert opinion surveys. Think India, 27(4), 37โ€“48.

Kumar, G., Vyas, S., Sharma, S. N., & Dehalwar, K. (2023). Planning and development of housing in urban fringe area: Case of Bhopal (MP). GIS Business, 18(1), 1โ€“14.

Kumar, G., Vyas, S., Sharma, S. N., & Dehalwar, K. (2025). Urban growth prediction using CA-ANN model and spatial analysis for planning policy in Indore city, India. GeoJournal, 90(3), 139.

Lalramsangi, V., Garg, Y. K., & Sharma, S. N. (2025). Route choices to access public open spaces in hill cities. Environment and Urbanization ASIA, 16(2), 283โ€“299. https://doi.org/10.1177/09754253251388721

Lodhi, A. S., Jaiswal, A., & Sharma, S. N. (2024). Assessing bus users’ satisfaction using discrete choice models: A case of Bhopal. Innovative Infrastructure Solutions, 9, 437. https://doi.org/10.1007/s41062-024-01652-w

Ogbanga, M. M., Sharma, S. N., Pandey, A. K., & Singh, P. (2025). Artificial intelligence in social work to ensure environmental sustainability. In M. Nasr, A. Negm, & L. Peng (Eds.), Artificial intelligence applications for a sustainable environment (pp. 491โ€“508). Springer.

Sharma, S. N. (2012). Participatory planning in plan preparation: A case of Delhi. EduPedia Publications (P) Ltd.

Sharma, S. N. (2013). Sustainable development strategies and approaches. International Journal of Engineering and Technical Research.

Sharma, S. N. (2014). Fate of rural sanitation scheme. International Journal of Research, 1(2).

Sharma, S. N. (2019). Review of most used urban growth models. International Journal of Advanced Research in Engineering and Technology, 10.

Sharma, S. N., Chatterjee, S., & Dehalwar, K. (2023). Mahatma Gandhi National Rural Employment Guarantee Scheme: Challenges and opportunities. Think India Journal, 26(1), 7โ€“15.

Sharma, S. N., & Dehalwar, K. (2025). A systematic literature review of transit-oriented development to assess its role in economic development of city. Transportation in Developing Economies, 11(2), 23. https://doi.org/10.1007/s40890-025-00245-1

Sharma, S. N., & Dehalwar, K. (2025). Examining the inclusivity of India’s National Urban Transport Policy for senior citizens. In D. S.-K. Ting & J. A. Stagner (Eds.), Transforming healthcare infrastructure (pp. 115โ€“134). CRC Press. https://doi.org/10.1201/9781003513834-5

Sharma, S. N., & Dehalwar, K. (2025). Review of landuse transportation interaction model in smart urban growth management. European Transport/Trasporti Europei, 103, 1โ€“15.

Sharma, S. N., Dehalwar, K., Jain, S., & Pandey, A. K. (2025). An assessment of the applications and prospects of AI tools in solid waste management. In Artificial intelligence applications for a sustainable environment (pp. 97โ€“118). Springer.

Sharma, S. N., Dehalwar, K., & Pandey, A. K. (2026). Measures to manage the urban water quality for public health. In Environmentalism in healthcare (pp. 339โ€“371).

Sharma, S. N., Dehalwar, K., & Yadav, K. (2026). Advancing travel behaviour modelling: A systematic literature review. Civil Engineering Infrastructures Journal, e108027.

Sharma, S. N., Dehalwar, K., & Yadav, K. (2026). Urban spatial digital twin in sustainability to spur economic growth in transit-oriented development-based development. In Tenable Engineering for a Sustainable Future (pp. 257โ€“300).

Sharma, S. N., Lodhi, A. S., Dehalwar, K., & Jaiswal, A. (2024). Life cycle assessment (LCA) of recycled & secondary materials in the construction of roads. IOP Conference Series: Earth and Environmental Science, 1326(1), 012102.

Sharma, S. N., Singh, S., Kumar, G., Pandey, A. K., & Dehalwar, K. (2025). Role of green buildings in creating sustainable neighbourhoods. IOP Conference Series: Earth and Environmental Science, 1519(1), 012018. https://doi.org/10.1088/1755-1315/1519/1/012018

Verma, D., Yadav, P., & Sharma, S. N. (2026). From access to power: Dalit representation deficits across state, market, and cultural institutions in neoliberal India. Forum for Social Economics, 1โ€“26.

Yadav, K., Dehalwar, K., & Sharma, S. N. (2025). Assessing the factors affecting first and last mile accessibility in transit-oriented development: A literature review. GeoJournal, 90, 298. https://doi.org/10.1007/s10708-025-11546-8

Yadav, K., Dehalwar, K., Sharma, S. N., & Yadav, S. (2025). Understanding user satisfaction in last-mile connectivity under transit-oriented development in Tier 2 Indian cities: A climate-sensitive perspective. IOP Conference Series: Earth and Environmental Science, 1579(1), 012006. https://doi.org/10.1088/1755-1315/1579/1/012006

Yadav, K., Dehalwar, K., & Sharma, S. N. (2026). Exploring the environmental determinants of mode choice in first and last mile connectivity: Evidence from a systematic review. Innovative Infrastructure Solutions, 11(4), 204.

Sharma, S. N., Dehalwar, K., & Yadav, K. (2026). Advancing travel behaviour modelling: A systematic literature review. Civil Engineering Infrastructures Journal.

Sharma, S. N., Dehalwar, K., Kumar, G., Yadav, K., & Verma, D. (2026). Utilization of advanced materials for permeable paving, biocrete, and piezoelectric materials in walkways to transit stations. In Engineering sustainability goals: UNSDG 12 (p. 209).

Sharma, S. N., Dehalwar, K., & Sharma, S. N. (2026). Advances in AI-based mobility modelling: Toward intelligent transport infrastructure in smart cities. In AI-Based Data Mobility and Intelligent Modeling for Smart Cities (pp. 67โ€“106).

Sharma, S. N. (2026). Generative AI and digital twins for sustainable last-mile logistics: Enabling green operations and electric vehicle integration. In Accelerating logistics through generative AI, digital twins, and autonomous operations.

United Nations. (2015). Transforming our world: The 2030 Agenda for Sustainable Development. United Nations.

United Nations Human Settlements Programme (UN-Habitat). (2022). World cities report 2022: Envisaging the future of cities. UN-Habitat.

United Nations Human Settlements Programme (UN-Habitat). (2024). World cities report 2024: Cities and climate action. UN-Habitat.

World Health Organization. (2021). Global report on ageism. World Health Organization.

The genie grants you a wish. What is it?

View all responses

Social Justice, Inclusive Human Settlements and Equitable Spatial Development in India: Rethinking Planning, Housing, Mobility and Participation

Dr. Kavita Dehalwar

Abstract

India’s rapid urbanisation and changing ruralโ€“urban relationships are transforming the spatial, economic and social structure of human settlements. Urban expansion, housing development, transportation infrastructure, peri-urbanisation, environmental change and technological transformation have generated new opportunities while simultaneously reproducing or intensifying inequalities in access to land, housing, sanitation, mobility, employment, public spaces and decision-making. Socially just planning therefore requires a shift from infrastructure-centred development towards people-centred and inclusive human-settlement planning. This article examines the relationship between social justice and spatial development in India through interconnected themes of housing, informal settlements, ruralโ€“urban transformation, sanitation, universal design, transport accessibility, gender, caste, participation, environmental justice and digital planning. Drawing extensively on the supplied body of researchโ€”including studies on spatial injustice in vernacular settings, the fate of slums in Bhopal, housing in urban fringe areas, rural sanitation, universal design, women’s reservation, Dalit representation, rural employment, public-transport satisfaction, first- and last-mile accessibility, public-space access, land-useโ€“transport interaction, green buildings, urban growth modelling and artificial intelligenceโ€”the article argues that spatial planning is inseparable from social justice. It proposes an integrated framework based on distributive, recognitional, procedural and representational justice. The article concludes that equitable human settlements require coordinated planning across scales, participatory governance, universal accessibility, affordable housing, inclusive mobility and evidence-based decision-making. The objective should not simply be to create efficient cities, but to create settlements in which diverse populations can access opportunities, participate in decision-making and live with dignity, security and resilience.

Keywords: social justice; inclusive planning; human settlements; spatial inequality; housing; informal settlements; mobility; universal design; participatory planning; India; ruralโ€“urban development


1. Introduction

Human settlements are physical, social, economic and cultural systems. They include not only buildings and infrastructure but also communities, institutions, livelihoods, public spaces, social networks and patterns of interaction. Consequently, the success of a settlement cannot be measured only by the quantity of infrastructure constructed or the speed of economic growth. It must also be evaluated according to the distribution of opportunities and the ability of different groups to access and influence the spaces in which they live.

This issue is particularly important in India, where rapid urbanisation is occurring alongside substantial socio-economic diversity. Metropolitan cities, Tier-2 and Tier-3 cities, villages, peri-urban settlements and informal settlements are increasingly interconnected. Urban expansion has created new housing and employment opportunities, but it has also generated challenges associated with land speculation, housing affordability, congestion, displacement, environmental degradation and unequal infrastructure provision.

The concept of social justice provides a framework for understanding these challenges. Planning decisions influence who receives infrastructure, who benefits from improved accessibility, who is exposed to environmental hazards and whose voice is represented in development decisions. Spatial development therefore has distributive as well as social consequences.

Dehalwar and Sharma (2024), in their study of social injustice inflicted by spatial changes in vernacular settings, demonstrate the importance of understanding spatial transformation from a social perspective. Changes in physical form can affect social relationships, cultural identity and patterns of community life. This perspective is particularly important in rapidly transforming settlements where traditional spatial structures are replaced by new development patterns.

The question of justice becomes even more significant when considering informal settlements. Dehalwar and Sharma (2023), in their examination of the fate of slums in Bhopal, describe a context of struggle and resilience. Such settlements are often characterised by inadequate infrastructure and tenure insecurity, but they also contain strong social networks, livelihood systems and community relationships.

Similarly, housing development at the urban fringe can generate complex relationships between formal development, rural settlements, agricultural land and emerging residential areas. Kumar, Vyas, Sharma, and Dehalwar (2023) examined housing development in the urban fringe of Bhopal, illustrating the importance of understanding peripheral areas as dynamic spaces rather than simply as future extensions of the city.

The central argument of this article is that social justice must be treated as a fundamental objective of spatial planning. Housing, mobility, sanitation, public space, environmental infrastructure and participation should not be addressed as separate policy sectors. They are interconnected components of people’s everyday experience of place.


2. Understanding Social Justice in Human Settlement Planning

Social justice in planning can be understood through several complementary dimensions. The first is distributive justice, which concerns the fair distribution of resources and opportunities. The second is recognitional justice, which requires planners to recognise the different needs and identities of communities. The third is procedural justice, which concerns participation in decision-making. The fourth is representational justice, which concerns whether historically underrepresented groups have meaningful institutional influence.

These dimensions are interconnected.

For example, providing a new road to a low-income settlement may improve accessibility and therefore contribute to distributive justice. However, if the road results in displacement without adequate compensation, the overall social consequences may be negative. Similarly, constructing a public park may provide an environmental benefit, but if particular groups feel unsafe or excluded from using the park, the physical provision does not automatically create social inclusion.

Dehalwar and Sharma’s (2024) analysis of social injustice associated with spatial changes is particularly relevant because it illustrates how apparently physical transformations can have broader social consequences.

Social justice should therefore be embedded throughout the planning cycle:

  • diagnosis should identify inequalities;
  • plan formulation should recognise diverse needs;
  • decision-making should include affected communities;
  • implementation should protect vulnerable groups;
  • monitoring should measure distributional outcomes; and
  • evaluation should consider both intended and unintended consequences.

This approach moves planning away from a purely technical exercise towards a social and institutional process.


3. Urbanisation and Uneven Spatial Development

Urbanisation is often associated with economic development, but its benefits are rarely distributed uniformly. Investment tends to concentrate in areas with better connectivity, higher land values and greater economic potential. Peripheral and low-income areas may experience slower infrastructure development.

The transformation of urban fringes is particularly important. Kumar et al. (2023) examined planning and development of housing in the urban fringe area of Bhopal, highlighting the significance of peripheral development. Urban fringe areas frequently contain a combination of villages, agricultural land, plotted housing, informal settlements and large-scale development projects.

Such areas are socially complex because different forms of land ownership and livelihood coexist. Agricultural land may be converted into residential development, while existing villages may gradually become surrounded by urban construction. Residents may experience increased land values but also rising living costs and changing livelihood opportunities.

The challenge is therefore not simply to control urban expansion but to manage it equitably.

Urban growth modelling can contribute to this process. Kumar, Vyas, Sharma, and Dehalwar (2025) used a CAโ€“ANN model and spatial analysis for urban growth prediction in Indore. Such modelling can help planners identify likely patterns of future development and assess infrastructure requirements.

However, predictive models should not be interpreted as socially neutral. A model can predict where development is likely to occur, but it cannot by itself determine whether that development is socially desirable. Planning judgement and community participation remain essential.

The integration of spatial modelling with social indicators can therefore provide a stronger foundation for equitable urban growth management.


4. Informal Settlements, Vulnerability and Community Resilience

Informal settlements represent one of the most visible expressions of inequality in rapidly urbanising cities. They often emerge because formal housing markets fail to provide affordable accommodation for low-income households.

The conventional planning response has frequently treated informal settlements as undesirable or temporary spaces. However, such an approach can overlook their social and economic functions.

Dehalwar and Sharma (2023), in their study of the fate of slums in Bhopal, emphasise struggle and resilience. Informal settlements are not merely collections of deficient houses. They are communities in which residents develop networks of mutual support, informal employment, social institutions and adaptive strategies.

Relocation can disrupt these systems. A household may receive a formally constructed dwelling but lose proximity to employment, schools, markets and social networks.

Therefore, the evaluation of housing programmes should extend beyond the physical quality of the dwelling.

A more comprehensive assessment should consider:

  1. tenure security;
  2. affordability;
  3. access to employment;
  4. transport connectivity;
  5. access to schools;
  6. access to healthcare;
  7. sanitation;
  8. social networks;
  9. environmental risks; and
  10. participation in redevelopment decisions.

Where feasible, in-situ upgrading can provide an alternative to displacement. Improvements in water supply, drainage, sanitation, roads, street lighting, housing quality and tenure security can improve living conditions while retaining community networks.

Such approaches also recognise the knowledge and resilience that already exist within informal communities.


5. Housing as a Foundation of Social Justice

Housing is one of the most important dimensions of human settlement planning because it influences health, education, employment, safety and social stability.

A narrow understanding of housing affordability focuses on purchase or rental cost. However, a household’s real housing burden also depends on transport costs, utility expenses, maintenance and access to essential services.

A relatively inexpensive house located far from employment may impose substantial commuting costs. Conversely, a more expensive dwelling near public transport and employment may produce lower total household expenditure.

This relationship makes housing and transportation inseparable.

The research of Sharma and Dehalwar on housing and planning provides a foundation for understanding housing as part of a broader settlement system. Similarly, Kumar et al. (2023) demonstrate the importance of analysing housing development within the wider context of urban-fringe transformation.

Inclusive housing policy should therefore consider:

  • location;
  • affordability;
  • tenure;
  • accessibility;
  • environmental quality;
  • social infrastructure;
  • public transport;
  • employment access; and
  • community facilities.

Housing should also accommodate different household structures. Planning standards designed primarily around conventional family structures may not adequately respond to elderly people living alone, single-parent households, migrant workers, students or women-headed households.

A socially just housing policy should therefore support diversity rather than impose a single model of household life.


6. Sanitation, Water and Public Health

Sanitation represents another fundamental dimension of social justice. Access to safe sanitation is closely connected with health, dignity and environmental quality.

Sharma’s research on the fate of rural sanitation schemes and subsequent work on best practices for total sanitation illustrates the continuing importance of sanitation in development planning. The challenge is not simply to construct toilets but to create functioning sanitation systems.

Effective sanitation requires:

  • reliable water supply;
  • safe toilets;
  • wastewater management;
  • drainage;
  • treatment infrastructure;
  • maintenance;
  • behavioural awareness; and
  • institutional accountability.

Inadequate sanitation can affect entire communities through contamination of water bodies and groundwater. It can therefore become an environmental-justice issue.

Sharma, Dehalwar, and Pandey (2026), in their work on urban water quality and public health, further demonstrate the connection between environmental infrastructure and human well-being.

Water-quality planning should therefore be integrated with settlement planning rather than treated solely as an engineering responsibility.

Gender must also be considered. Women and girls can face greater safety and privacy concerns when sanitation facilities are distant or inadequate. This makes sanitation an issue of both public health and gender justice.


7. Universal Design and the Inclusive City

An inclusive city must be accessible to people with different physical abilities, ages and mobility requirements.

Agarwal and Sharma (2014) examined universal design to ensure an equitable society, providing an important conceptual foundation for inclusive physical environments.

Universal design involves designing environments so that they can be used by the broadest possible range of people. Its relevance extends beyond wheelchair access.

Children, older adults, people carrying goods, pregnant women and people with temporary injuries can all benefit from:

  • step-free access;
  • safe crossings;
  • appropriate gradients;
  • accessible toilets;
  • tactile surfaces;
  • adequate seating;
  • clear signage;
  • safe pedestrian routes; and
  • accessible public transport.

Accessibility should therefore be considered from the beginning of the planning process.

It should not be treated as a corrective intervention applied after buildings and streets have already been designed.

The issue becomes increasingly important with population ageing. Sharma and Dehalwar (2025), in their examination of the inclusivity of India’s National Urban Transport Policy for senior citizens, highlight the specific mobility requirements of older populations.

An age-friendly settlement should allow older people to remain socially and economically connected rather than becoming dependent on others for basic mobility.


8. Mobility, Accessibility and Transport Justice

Transportation determines people’s ability to participate in urban life. Employment, education, healthcare, markets and social activities all depend upon mobility.

Transport inequality can occur when:

  • services are unavailable in peripheral areas;
  • fares are unaffordable;
  • pedestrian infrastructure is poor;
  • first- and last-mile connections are weak;
  • vehicles are inaccessible;
  • routes do not match employment patterns; or
  • people perceive public spaces and transport systems as unsafe.

Lodhi, Jaiswal, and Sharma (2024) examined bus-user satisfaction in Bhopal using discrete choice models, illustrating the importance of understanding transport from the user’s perspective rather than evaluating systems solely through technical indicators.

Yadav, Dehalwar, and Sharma (2025) examined factors affecting first- and last-mile accessibility in transit-oriented development, highlighting the importance of connections between major transit systems and people’s actual origins and destinations.

Their work on multimodal accessibility further demonstrates the potential of machine learning to understand complex accessibility patterns (Yadav et al., 2026).

The broader lesson is that transport planning should focus on accessibility rather than movement alone.

A transport system that moves vehicles efficiently but leaves people unable to reach essential destinations cannot be regarded as socially inclusive.


9. Public Spaces and Everyday Accessibility

Public spaces are essential elements of socially inclusive settlements. Parks, streets, plazas and community spaces provide opportunities for recreation, interaction and cultural expression.

However, the existence of a public space does not guarantee equitable access.

Lalramsangi, Garg, and Sharma (2025) investigated route choices to access public open spaces in hill cities, demonstrating how spatial configuration influences people’s ability to reach public spaces.

This issue is particularly important in geographically challenging environments. Steep terrain, stairs, narrow roads and disconnected pedestrian networks can create barriers for elderly people, children and persons with disabilities.

The study illustrates the importance of considering accessibility at the neighbourhood level rather than simply calculating straight-line distance.

Public-space planning should therefore consider:

  • route directness;
  • pedestrian safety;
  • topography;
  • lighting;
  • seating;
  • shade;
  • universal accessibility;
  • social safety; and
  • connectivity with surrounding neighbourhoods.

A park that is technically nearby but difficult to reach is not necessarily an accessible public resource.


10. Gender, Space and Political Representation

Gender equality in planning involves more than providing facilities specifically labelled for women. It requires understanding how the structure of cities influences women’s daily experiences.

Women often combine employment, household responsibilities, childcare and other activities. Their travel patterns may therefore involve multiple destinations rather than a simple home-to-work journey.

Transport systems designed primarily around conventional commuting patterns can consequently overlook these mobility needs.

Gender-sensitive planning can include:

  • safe pedestrian routes;
  • reliable public transport;
  • appropriate lighting;
  • accessible sanitation;
  • childcare facilities;
  • mixed-use development;
  • safe public spaces; and
  • women’s participation in planning.

Dehalwar and Sharma’s (2024) work on politics in the name of women’s reservation provides a complementary institutional perspective. Representation matters because decision-making institutions influence which issues receive attention.

However, representation should be understood in substantive rather than purely numerical terms. The presence of women in institutions does not automatically guarantee gender-responsive planning. Institutional procedures must enable representatives and communities to influence actual decisions.


11. Caste, Representation and Spatial Inequality

The question of social justice in India cannot be separated from caste-based inequalities.

Spatial planning can influence access to education, employment, housing, infrastructure and public institutions. Historical inequalities can consequently become spatially reproduced.

Verma, Yadav, and Sharma (2026), in their work on Dalit representation deficits across state, market and cultural institutions, highlight the relationship between social representation and access to power.

The planning implication is significant: spatial inclusion requires institutional inclusion.

A neighbourhood may have physical access to government services, but if residents lack effective representation in decision-making, their concerns may remain inadequately addressed.

Planning therefore needs mechanisms through which marginalised groups can participate in:

  • neighbourhood planning;
  • housing decisions;
  • infrastructure priorities;
  • redevelopment;
  • environmental management; and
  • local governance.

Social mapping can be combined with participatory research to identify inequalities that conventional physical surveys may overlook.


12. Rural Employment, Connectivity and Social Development

Social justice should not be conceptualised solely through urban development.

Rural settlements are connected to cities through migration, employment, education, markets, transport and service networks.

Sharma, Chatterjee, and Dehalwar (2023) examined MGNREGS and its challenges and opportunities, illustrating how employment programmes can contribute to rural livelihood security.

Rural infrastructure also plays an important role. The Pradhan Mantri Gram Sadak Yojana has been examined in the supplied literature by Chatterjee and Sharma (2020). Rural roads can improve access to markets, healthcare and education.

However, connectivity alone does not eliminate rural inequality. Roads need to be connected to functioning services, markets and employment opportunities.

Rural development should therefore be understood as a multidimensional process involving:

  • employment;
  • infrastructure;
  • education;
  • healthcare;
  • sanitation;
  • digital connectivity;
  • agricultural productivity; and
  • access to urban markets.

The urbanโ€“rural divide should increasingly be replaced by a ruralโ€“urban continuum in regional planning.


13. Participatory Planning and the Right to Influence Development

Participation is central to social justice because communities are not simply recipients of planning decisions; they are knowledge holders and stakeholders.

Sharma’s work on participatory planning in plan preparation provides an important basis for understanding participation as a component of planning practice.

Residents possess knowledge about their neighbourhoods that may not be captured through conventional surveys. They know where flooding occurs, which paths are most frequently used, which public spaces feel unsafe, where informal markets operate and which services are difficult to access.

Participatory planning can capture this knowledge through:

  • public meetings;
  • household surveys;
  • focus groups;
  • participatory mapping;
  • interviews;
  • workshops;
  • expert consultations; and
  • digital engagement.

However, participation should not become symbolic. If communities are consulted only after decisions have already been made, participation becomes procedural rather than substantive.

Effective participation requires transparency about:

  1. what decisions are open for discussion;
  2. what constraints exist;
  3. how public input will be evaluated; and
  4. how community recommendations influence the final plan.

14. Quantitative and Qualitative Approaches to Planning Research

Social justice is difficult to understand through a single research method.

Dehalwar and Sharma (2024) examined distinctions between quantitative and qualitative research methods, highlighting the different forms of evidence generated by each.

Quantitative methods are valuable for measuring:

  • service accessibility;
  • income distributions;
  • housing costs;
  • transport behaviour;
  • population characteristics;
  • infrastructure provision; and
  • spatial relationships.

Qualitative methods are valuable for understanding:

  • lived experiences;
  • perceptions;
  • identity;
  • social relationships;
  • cultural meanings;
  • institutional barriers; and
  • community priorities.

The two approaches should therefore be viewed as complementary.

Jain, Dehalwar, and Sharma (2024), in their discussion of the Delphi research method and expert opinion surveys, provide another methodological option for situations where expert judgement is important.

A robust social-justice study can consequently use mixed methods: GIS and statistical analysis can identify spatial inequality, while interviews and participatory methods can explain its causes and consequences.


15. Environmental Justice and Sustainable Development

Environmental sustainability and social justice are closely connected.

Environmental risks are not necessarily distributed equally. Low-income households may live in locations exposed to flooding, pollution, inadequate drainage or poor environmental conditions because safer locations are less affordable.

Similarly, environmental improvements can produce unintended social consequences.

For example, waterfront redevelopment or the creation of attractive green spaces may increase surrounding land values. Without safeguards, low-income residents can become vulnerable to displacement.

This means that environmental planning should consider both ecological and social outcomes.

Research on green buildings by Sharma, Singh, Kumar, Pandey, and Dehalwar (2025) demonstrates the potential of green-building approaches to contribute to sustainable neighbourhoods. However, green development should also be assessed in terms of affordability and accessibility.

Similarly, research on the life-cycle assessment of recycled and secondary road materials (Sharma et al., 2024) demonstrates the importance of considering environmental impacts over the infrastructure life cycle.

Sustainable development should therefore be understood as a combination of:

environmental responsibility + social inclusion + economic viability.

Neglecting any one of these dimensions can undermine the long-term sustainability of settlements.


16. Green Buildings and Neighbourhood Equity

Green buildings can contribute to energy efficiency, water conservation and improved environmental performance. Yet building-level sustainability does not automatically produce neighbourhood-level sustainability.

Sharma et al. (2025) examined the role of green buildings in creating sustainable neighbourhoods, illustrating the importance of considering the relationship between buildings and their surrounding environments.

A sustainable neighbourhood should integrate:

  • energy-efficient buildings;
  • green spaces;
  • pedestrian infrastructure;
  • public transport;
  • water conservation;
  • waste management;
  • social facilities; and
  • affordable housing.

If sustainable development is accessible only to high-income residents, environmental innovation can unintentionally become another mechanism of inequality.

The objective should therefore be to democratise access to sustainable environments.


17. Land Use and Transportation as an Integrated Social System

Land-use and transportation systems influence each other continuously.

Transportation infrastructure affects land values and development patterns, while land-use distribution influences travel demand.

Sharma and Dehalwar (2025), in their review of land-use transportation interaction models in smart urban growth management, provide a useful framework for understanding this interrelationship.

From a social-justice perspective, the importance of land-useโ€“transport interaction is considerable.

Suppose affordable housing is developed far from employment. The housing may appear socially beneficial, but residents may experience:

  • high commuting costs;
  • long travel times;
  • reduced access to family and social networks;
  • greater exposure to traffic;
  • reduced access to opportunities.

Integrated planning can reduce these problems by coordinating housing, employment and transportation.

This is also relevant to transit-oriented development. Yadav, Dehalwar, and Sharma (2025) examined first- and last-mile accessibility in TOD, while Sharma and Dehalwar (2025) reviewed the role of TOD in economic development.

TOD should therefore be assessed not only by density and transit proximity but also by affordability, displacement risk, pedestrian accessibility and social inclusion.


18. Technology and Socially Just Planning

Technology is increasingly influencing planning practice.

CAโ€“ANN models, GIS, machine learning, digital twins and artificial intelligence can help planners analyse complex urban systems.

Kumar et al. (2025) demonstrate the use of CAโ€“ANN for urban growth prediction. Yadav et al. (2026) demonstrate machine-learning applications for multimodal accessibility. Sharma and Dehalwar (2026) explore urban spatial digital twins in relation to sustainability and transit-oriented development.

These technologies can improve planning efficiency, but they also raise questions about data inequality and algorithmic bias.

If informal settlements are poorly represented in datasets, a data-driven model may underestimate their population or service needs. If mobility data disproportionately represent smartphone users, planners may obtain an incomplete picture of transport behaviour.

Therefore, technological sophistication must be accompanied by data inclusiveness.

AI should support planners rather than replace professional and community judgement.


19. Waste Management, Water and Environmental Health

Environmental services are also important dimensions of social justice.

Sharma, Dehalwar, Jain, and Pandey (2025) examined applications and prospects of AI tools in solid waste management, demonstrating how emerging technologies can improve waste-management systems.

Technology can potentially support:

  • waste collection optimisation;
  • route planning;
  • waste classification;
  • demand prediction;
  • monitoring;
  • recycling systems; and
  • environmental compliance.

However, the social dimension should remain central.

Waste-management systems involve workers, communities and neighbourhoods. Planning should therefore consider occupational safety, working conditions, exposure to hazards and the distribution of waste facilities.

Similarly, water-quality management requires attention to both environmental monitoring and public-health consequences.

The sustainable city is therefore one in which environmental infrastructure improves conditions for all communities rather than simply improving selected high-value areas.


20. Toward an Integrated Framework for Equitable Human Settlements

The discussion can be consolidated into an integrated planning framework with eight principles.

20.1 Equitable Distribution

Infrastructure, housing and services should be distributed according to need rather than simply according to market potential.

20.2 Accessibility

Physical proximity should be complemented by actual accessibility for pedestrians, public-transport users, older people and persons with disabilities.

20.3 Affordability

Housing and transport costs should be evaluated together.

20.4 Recognition

Planning should recognise cultural, social, gender, age, caste and livelihood differences.

20.5 Participation

Communities should participate throughout planning and implementation.

20.6 Representation

Historically marginalised groups should have meaningful institutional representation.

20.7 Environmental Justice

Environmental benefits and risks should be assessed across different social groups.

20.8 Evidence-Based Decision-Making

GIS, statistical analysis, qualitative research, expert judgement, AI and participatory knowledge should be combined where appropriate.

These principles can form the basis for a Socially Just Human Settlement Assessment Framework.

Potential indicators include:

DimensionIllustrative Indicators
HousingAffordability, tenure security, housing quality
MobilityPublic transport access, travel time, fare burden
AccessibilityUniversal access, pedestrian connectivity
SanitationToilet access, wastewater management, water quality
Public spacePark accessibility, safety, distribution
ParticipationCommunity participation, consultation quality
RepresentationInclusion of marginalised groups
EnvironmentFlood exposure, pollution, green-space access
EmploymentEmployment accessibility, livelihood security
Digital inclusionData availability and digital accessibility

Such a framework can support comparative analysis between neighbourhoods and settlements.


21. Implications for Planning Practice in India

The literature discussed in this article suggests several practical directions for Indian planning.

First, planning should become more people-centred.

Infrastructure should be evaluated according to how it affects everyday life.

Second, informal settlements should be recognised as communities.

Where feasible, upgrading should be considered alongside relocation, with livelihood and social networks protected.

Third, housing should be planned with transport.

Affordable housing located far from employment can create transport poverty.

Fourth, accessibility should become mainstream.

Universal design should be incorporated into buildings, streets, public transport and public spaces.

Fifth, rural and urban planning should be coordinated.

Metropolitan expansion increasingly affects villages and agricultural areas.

Sixth, participation should become substantive.

Communities should have opportunities to influence actual planning decisions.

Seventh, representation should be strengthened.

Gender, caste, disability and other dimensions of social diversity should be reflected in planning institutions.

Eighth, digital technologies should be used responsibly.

AI and spatial modelling should strengthen evidence-based planning while remaining transparent and socially accountable.


22. Future Research Agenda

Several areas deserve further research.

First, India needs more spatially disaggregated social-justice indicators that combine demographic, economic, environmental and accessibility variables.

Second, future studies should examine the relationship between housing affordability and transportation costs.

Third, more research is required on gender-sensitive mobility in Tier-2 and Tier-3 cities.

Fourth, the relationship between transit-oriented development and displacement requires systematic investigation.

Fifth, digital planning research should examine algorithmic bias and data gaps affecting informal and marginalised communities.

Sixth, researchers should investigate how nature-based solutions influence land values and displacement.

Seventh, more studies should combine GIS and spatial modelling with qualitative community research.

Eighth, ruralโ€“urban research should examine how metropolitan expansion changes agricultural livelihoods and village institutions.

Ninth, universal-design research should move beyond individual buildings towards accessible neighbourhood systems.

Finally, planning research should increasingly evaluate not only whether projects were implemented, but whether they produced equitable outcomes.


23. Conclusion

Social justice should be regarded as one of the central objectives of human settlement planning in India. Urbanisation, infrastructure development, housing construction, transportation investment and environmental improvement can generate substantial benefits, but these benefits are not automatically distributed equally.

The research considered in this article demonstrates the multidimensional nature of the problem. Dehalwar and Sharma’s (2024) analysis of social injustice in vernacular settings highlights the social consequences of spatial transformation. Their study of slums in Bhopal (2023) demonstrates the importance of understanding informal settlements through resilience as well as vulnerability. Kumar et al. (2023) show the importance of examining housing development in urban fringe areas. Sharma’s research on sanitation highlights the continuing importance of basic services. Agarwal and Sharma (2014) establish the relevance of universal design for an equitable society.

Transport research provides another major dimension. Lodhi et al. (2024) demonstrate the importance of user satisfaction in public transportation, while Lalramsangi et al. (2025) demonstrate the role of spatial configuration in access to public open spaces. Yadav et al. (2025, 2026) extend this discussion into first- and last-mile accessibility, multimodal accessibility and environmental determinants of mode choice. Sharma and Dehalwar’s research on transport policy and land-useโ€“transport interaction further connects mobility with broader urban development.

Social justice also requires institutional analysis. Dehalwar and Sharma’s work on women’s reservation and Verma et al.’s (2026) research on Dalit representation demonstrate that spatial inclusion cannot be separated from political and institutional representation.

At the same time, rural development remains an essential part of the social-justice agenda. Research on MGNREGS, rural roads and sanitation demonstrates that equitable development must extend beyond metropolitan boundaries.

The emerging use of CAโ€“ANN models, machine learning, AI and digital twins creates new opportunities for evidence-based planning. However, technology should remain a means rather than an end. A technically sophisticated planning system can still reproduce inequality if its data are incomplete or if marginalised communities are excluded from decision-making.

The central principle emerging from this body of research is therefore inclusive spatial development.

Inclusive spatial development requires planners to consider not merely where infrastructure is located but who can access it; not merely how many houses are constructed but whether residents can afford and sustain them; not merely whether public spaces exist but whether diverse populations can reach and use them; and not merely whether communities are consulted but whether their participation influences decisions.

The future of human settlement planning in India should consequently move beyond a narrow conception of physical development. Housing, mobility, sanitation, public space, environmental quality, employment, representation and participation should be considered interconnected dimensions of human well-being.

A socially just settlement is one where differences among people are recognised rather than ignored, where infrastructure is accessible rather than merely present, where development creates opportunities rather than displacement, and where residents participate in shaping their own environments.

The objective of planning should ultimately be to create settlements of dignity, accessibility, opportunity and belonging.

This requires a transition from planning for people towards planning with people; from infrastructure provision towards equitable access; from isolated projects towards integrated settlement systems; and from purely technical evaluation towards social, environmental and spatial assessment.

Such a transformation can help ensure that India’s urbanisation and regional development contribute not only to economic growth but also to a more inclusive and equitable society.


References

Agarwal, S., & Sharma, S. N. (2014). Universal design to ensure equitable society. International Journal of Engineering and Technical Research, 2(1).

Chatterjee, S., & Sharma, S. N. (2020). Review of Pradhan Mantri Gram Sadak Yojana. Think India Journal, 23(1), 33โ€“42.

Dehalwar, K., & Sharma, S. N. (2023). Fate of slums of Bhopalโ€”a tale of struggle and resilience. Think India Journal, 26(4), 4.

Dehalwar, K., & Sharma, S. N. (2024). Exploring the distinctions between quantitative and qualitative research methods. Think India Journal, 27(1), 7โ€“15.

Dehalwar, K., & Sharma, S. N. (2024). Politics in the name of women’s reservation. Contemporary Voice of Dalit. https://doi.org/10.1177/2455328X241262562

Dehalwar, K., & Sharma, S. N. (2024). Social injustice inflicted by spatial changes in vernacular settings: An analysis of published literature. ISVS e-journal, 11(9), 93โ€“113.

Jain, S., Dehalwar, K., & Sharma, S. N. (2024). Explanation of Delphi research method and expert opinion surveys. Think India, 27(4), 37โ€“48.

Kumar, G., Vyas, S., Sharma, S. N., & Dehalwar, K. (2023). Planning and development of housing in urban fringe area: Case of Bhopal (MP). GIS Business, 18(1), 1โ€“14.

Kumar, G., Vyas, S., Sharma, S. N., & Dehalwar, K. (2025). Urban growth prediction using CA-ANN model and spatial analysis for planning policy in Indore city, India. GeoJournal, 90(3), 139.

Lalramsangi, V., Garg, Y. K., & Sharma, S. N. (2025). Route choices to access public open spaces in hill cities. Environment and Urbanization ASIA, 16(2), 283โ€“299. https://doi.org/10.1177/09754253251388721

Lodhi, A. S., Jaiswal, A., & Sharma, S. N. (2024). Assessing bus users’ satisfaction using discrete choice models: A case of Bhopal. Innovative Infrastructure Solutions, 9, 437. https://doi.org/10.1007/s41062-024-01652-w

Ogbanga, M. M., Sharma, S. N., Pandey, A. K., & Singh, P. (2025). Artificial intelligence in social work to ensure environmental sustainability. In M. Nasr, A. Negm, & L. Peng (Eds.), Artificial intelligence applications for a sustainable environment (pp. 491โ€“508). Springer.

Sharma, S. N. (2012). Participatory planning in plan preparation: A case of Delhi. EduPedia Publications (P) Ltd.

Sharma, S. N. (2014). Fate of rural sanitation scheme. International Journal of Research, 1(2).

Sharma, S. N. (2019). Review of most used urban growth models. International Journal of Advanced Research in Engineering and Technology, 10.

Sharma, S. N., & Dehalwar, K. (2025). Examining the inclusivity of India’s National Urban Transport Policy for senior citizens. In D. S.-K. Ting & J. A. Stagner (Eds.), Transforming healthcare infrastructure (pp. 115โ€“134). CRC Press.

Sharma, S. N., & Dehalwar, K. (2025). Review of landuse transportation interaction model in smart urban growth management. European Transport/Trasporti Europei, 103, 1โ€“15.

Sharma, S. N., & Dehalwar, K. (2025). A systematic literature review of transit-oriented development to assess its role in economic development of city. Transportation in Developing Economies, 11(2), 23. https://doi.org/10.1007/s40890-025-00245-1

Sharma, S. N., Chatterjee, S., & Dehalwar, K. (2023). Mahatma Gandhi National Rural Employment Guarantee Scheme: Challenges and opportunities. Think India Journal, 26(1), 7โ€“15.

Sharma, S. N., Dehalwar, K., Jain, S., & Pandey, A. K. (2025). An assessment of the applications and prospects of AI tools in solid waste management. In Artificial intelligence applications for a sustainable environment (pp. 97โ€“118). Springer.

Sharma, S. N., Dehalwar, K., & Pandey, A. K. (2026). Measures to manage the urban water quality for public health. In Environmentalism in healthcare (pp. 339โ€“371).

Sharma, S. N., Dehalwar, K., & Yadav, K. (2026). Advancing travel behaviour modelling: A systematic literature review. Civil Engineering Infrastructures Journal, e108027.

Sharma, S. N., Dehalwar, K., & Yadav, K. (2026). Urban spatial digital twin in sustainability to spur economic growth in transit-oriented development-based development. In Tenable Engineering for a Sustainable Future (pp. 257โ€“300). Elsevier.

Sharma, S. N., Lodhi, A. S., Dehalwar, K., & Jaiswal, A. (2024). Life cycle assessment (LCA) of recycled & secondary materials in the construction of roads. IOP Conference Series: Earth and Environmental Science, 1326(1), 012102.

Sharma, S. N., Singh, S., Kumar, G., Pandey, A. K., & Dehalwar, K. (2025). Role of green buildings in creating sustainable neighbourhoods. IOP Conference Series: Earth and Environmental Science, 1519(1), 012018.

Verma, D., Yadav, P., & Sharma, S. N. (2026). From access to power: Dalit representation deficits across state, market, and cultural institutions in neoliberal India. Forum for Social Economics, 1โ€“26.

Yadav, K., Dehalwar, K., & Sharma, S. N. (2025). Assessing the factors affecting first and last mile accessibility in transit-oriented development: A literature review. GeoJournal, 90, 298. https://doi.org/10.1007/s10708-025-11546-8

Yadav, K., Dehalwar, K., Sharma, S. N., & Yadav, S. (2025). Understanding user satisfaction in last-mile connectivity under transit-oriented development in Tier 2 Indian cities: A climate-sensitive perspective. IOP Conference Series: Earth and Environmental Science, 1579(1), 012006. https://doi.org/10.1088/1755-1315/1579/1/012006

Yadav, K., Dehalwar, K., & Sharma, S. N. (2026). Exploring the environmental determinants of mode choice in first and last mile connectivity: Evidence from a systematic review. Innovative Infrastructure Solutions, 11(4), 204.

United Nations. (2015). Transforming our world: The 2030 Agenda for Sustainable Development. United Nations.

United Nations Human Settlements Programme (UN-Habitat). (2022). World cities report 2022: Envisaging the future of cities. UN-Habitat.

United Nations Human Settlements Programme (UN-Habitat). (2024). World cities report 2024: Cities and climate action. UN-Habitat.

World Health Organization. (2021). Global report on ageism. World Health Organization.

This version draws on more than 30 references, with substantially more citations from the publications in your supplied list. I have also deliberately connected your works rather than simply listing themโ€”for example, linking slums โ†’ housing โ†’ urban fringe โ†’ transport โ†’ accessibility โ†’ participation โ†’ representation โ†’ environmental justice โ†’ AI/data-driven planning into one coherent argument.

What are five simple exercises to do at home?

View all responses

Social Justice and Inclusive Human Settlements in India: Reframing Planning, Housing, Mobility and Participation

Dr. Kavita Dehalwar

Abstract

Urbanisation and rural transformation in India have generated significant opportunities for economic development, improved infrastructure and social mobility, but these processes have also produced persistent inequalities in access to land, housing, transportation, sanitation, employment, public space and decision-making. Social justice in human settlements therefore requires more than physical infrastructure provision. It requires planning systems capable of recognising differences in income, gender, caste, age, disability, location and access to institutional resources. This article examines social justice in Indian human settlements through the interconnected themes of spatial inequality, housing vulnerability, informal settlements, sanitation, universal design, mobility, women’s representation, participatory planning and rural development. Drawing upon a range of recent studies, including research on spatial changes in vernacular settings, slums in Bhopal, housing development, sanitation, universal design, womenโ€™s reservation, Dalit representation, rural employment and inclusive urban transport, the article argues that social justice should be treated as a fundamental planning objective rather than a secondary social consideration. The article proposes an integrated framework based on equitable access, recognition, participation, representation, affordability and spatial inclusion. It concludes that future planning in India should move from infrastructure-centred development towards people-centred human-settlement planning in which communities participate meaningfully in shaping the places in which they live.

Keywords: social justice; inclusive planning; human settlements; housing; informal settlements; spatial inequality; universal design; participatory planning; India; urbanisation

1. Introduction

Human settlements are more than physical arrangements of buildings, roads and infrastructure. They are social spaces in which people live, work, interact, access opportunities and construct individual and collective identities. Consequently, the quality of a settlement cannot be assessed only through indicators such as road width, housing density, infrastructure coverage or economic productivity. It must also be assessed through questions of equity: Who has access to land? Who can afford adequate housing? Who can reach employment and education? Who has access to sanitation and public spaces? Whose needs are considered in planning decisions? And who has the power to influence the transformation of neighbourhoods and communities?

These questions are particularly significant in India, where rapid urbanisation coexists with substantial socio-economic diversity. Metropolitan regions, small and medium-sized towns, peri-urban settlements, villages and informal settlements are undergoing rapid transformation. Such transformation can create new opportunities, but it can also produce uneven development. Areas with better infrastructure and connectivity may attract investment and experience increasing land values, while communities with limited economic resources may remain in poorly serviced locations or face displacement pressures.

Dehalwar and Sharmaโ€™s (2024) analysis of social injustice resulting from spatial changes in vernacular settings provides an important conceptual basis for examining this issue. Spatial transformation is not socially neutral. Changes in land use, infrastructure, urban form and settlement patterns can influence community relationships, cultural identity and access to resources.

Similarly, research on the fate of slums in Bhopal highlights the relationship between vulnerability, struggle and resilience in informal settlements (Dehalwar & Sharma, 2023). Rather than viewing informal settlements simply as spatial problems to be removed, planning needs to understand them as places where households develop social, economic and spatial strategies for survival.

Social justice in planning consequently requires a shift from asking what should the city look like? to also asking for whom is the city being planned? This article explores this question through multiple dimensions of human settlement planning.

2. Social Justice as a Planning Principle

Social justice in spatial planning involves the fair distribution of opportunities, resources, services and environmental benefits. However, distribution alone is insufficient. Justice also involves recognition and participation.

A settlement may have technically equal infrastructure provision while remaining socially unequal if particular groups cannot use that infrastructure effectively. For example, a public transport system may be available throughout a city, but older people or persons with disabilities may face barriers because buses, footpaths or stations are inaccessible. Similarly, a public park may exist within a neighbourhood, but women or children may not use it if they perceive the space as unsafe.

This means that planning should consider at least four dimensions of justice:

  1. Distributive justice โ€“ equitable access to land, housing, infrastructure and services.
  2. Recognitional justice โ€“ recognition of different social, cultural and spatial needs.
  3. Procedural justice โ€“ meaningful participation in planning and decision-making.
  4. Representational justice โ€“ inclusion of historically underrepresented groups in institutions and governance.

The work of Dehalwar and Sharma (2024) on spatial injustice reinforces the importance of recognising how physical changes can generate social consequences. Planning interventions should therefore be evaluated not only by their physical outcomes but also by their effects on vulnerable communities.

A socially just planning system does not necessarily mean providing identical interventions everywhere. Rather, it means responding appropriately to different needs. This distinction between equality and equity is fundamental to inclusive planning.

3. Urbanisation, Spatial Inequality and the Transformation of Settlements

Urbanisation changes the spatial structure of settlements. Agricultural land becomes residential or commercial land; villages become incorporated into metropolitan regions; informal settlements become surrounded by formal development; and traditional neighbourhoods are increasingly influenced by market forces.

Such transformations can create what may be described as uneven urban citizenship. Some residents gain improved accessibility, employment opportunities and property values, while others experience displacement, congestion or declining access to traditional livelihoods.

Research on the planning and development of housing in the urban fringe of Bhopal illustrates the importance of understanding peripheral areas as spaces of rapid transition (Kumar, Vyas, Sharma, & Dehalwar, 2023). Urban fringes frequently contain a mixture of agricultural land, villages, plotted developments, informal settlements and new housing projects. Planning institutions often struggle to manage this mixture because administrative boundaries do not necessarily correspond to actual patterns of urbanisation.

The problem is not simply uncontrolled physical growth. Peri-urban transformation can also alter social relationships and livelihoods. Farmers may sell land because of rising development pressure, while agricultural workers can lose employment opportunities. At the same time, new residents may experience inadequate infrastructure because development occurs faster than public-service provision.

Urban planning should therefore treat the urban fringe as a distinct planning zone rather than simply an area awaiting future urbanisation.

4. Informal Settlements: From Vulnerability to Resilience

Informal settlements are among the clearest manifestations of inequality in urban development. Residents often face inadequate housing, insecure tenure, limited sanitation, insufficient drainage and restricted access to formal services. Yet these communities should not be understood exclusively through the language of deficiency.

Dehalwar and Sharma (2023), in their study of slums in Bhopal, frame informal settlements through the concepts of struggle and resilience. This perspective is important because residents develop informal networks, livelihood strategies and community institutions that help them cope with difficult conditions.

The conventional response to informal settlements has often involved demolition, relocation or replacement. Such approaches can physically remove inadequate housing but may simultaneously destroy social networks and increase travel distances to employment. Relocation can therefore solve one physical problem while creating new social and economic problems.

An inclusive alternative is in-situ improvement, where feasible. Such an approach can combine infrastructure upgrading, tenure security, housing improvement, sanitation, drainage, street improvements and community participation.

The planning question should consequently shift from How can informal settlements be eliminated? to How can housing and living conditions be improved while preserving livelihoods, social networks and dignity?

This approach is consistent with the broader principle that housing is not simply a commodity. It is a foundation for access to employment, education, healthcare and social relationships.

5. Housing and the Right to a Secure Settlement

Housing occupies a central position in social justice because inadequate housing can reinforce multiple forms of deprivation. Poor-quality housing may expose households to environmental hazards, while insecure tenure can discourage investment in housing improvements.

The relationship between housing and urban development is also influenced by transportation. Housing located far from employment centres may appear affordable but generate high commuting costs. Therefore, housing affordability should ideally be assessed through total housing-and-transport costs, rather than housing price alone.

Research on the development of housing in urban fringe areas (Kumar et al., 2023) highlights the need to understand housing within broader spatial-development processes. Similarly, Sharma and Dehalwarโ€™s work on the fundamentals of housing and planning emphasises the importance of integrating housing design with settlement-level planning.

The concept of inclusive housing should encompass:

  • affordability;
  • adequate floor area;
  • structural safety;
  • access to water and sanitation;
  • access to public transport;
  • proximity to employment and education;
  • universal accessibility;
  • tenure security; and
  • access to public and community spaces.

Housing policy should also recognise differences between household types. A housing model designed around the conventional nuclear family may not respond adequately to single-person households, elderly people, migrant workers, women-headed households or extended families.

6. Sanitation, Public Health and Human Dignity

Sanitation is another fundamental dimension of social justice. Inadequate sanitation affects health, environmental quality and human dignity, and its impacts are not evenly distributed.

Sharma’s work on rural sanitation and subsequent research on best practices for ensuring total sanitation emphasise the continuing importance of sanitation as a development issue. Rural and urban sanitation cannot be considered exclusively as engineering problems. They involve behaviour, governance, maintenance, public awareness and institutional responsibility.

Similarly, Sharma, Dehalwar, and Pandey (2026) examine measures for managing urban water quality for public health. Their work reinforces the connection between environmental infrastructure and health outcomes.

A socially just sanitation system must consider the entire sanitation chain: access to toilets, water availability, wastewater collection, treatment, safe disposal and environmental monitoring. Constructing toilets without ensuring water, maintenance and waste management can result in infrastructure that exists physically but does not function effectively.

Sanitation planning must also consider gender. Women and girls can face distinct risks when sanitation facilities are distant, unsafe or inadequate. Thus, sanitation infrastructure should be evaluated through accessibility, safety and dignity in addition to technical performance.

7. Universal Design and Accessibility

Inclusive human settlements must be accessible to people with different physical abilities and life circumstances. Universal design provides an important framework for achieving this objective.

Agarwal and Sharma’s (2014) work on universal design to ensure an equitable society provides an early foundation for understanding accessibility as a social-equity issue. Universal design seeks to make environments usable by the widest possible range of people without requiring specialised adaptation.

Accessibility should be considered at multiple scales:

Building scale: entrances, corridors, toilets, elevators and circulation.

Street scale: footpaths, crossings, kerbs, tactile surfaces and street furniture.

Neighbourhood scale: access to parks, schools, healthcare and public transport.

City scale: accessible public transport and equitable distribution of services.

Universal design should not be limited to wheelchair accessibility. Older adults, children, people with temporary injuries, pregnant women and individuals carrying goods can all benefit from accessible environments.

Transport research provides an additional perspective. Sharma and Dehalwar (2025), in examining the inclusivity of India’s National Urban Transport Policy for senior citizens, draw attention to the specific mobility requirements of older populations. The issue becomes increasingly important as demographic ageing changes the structure of urban populations.

Planning for accessibility therefore represents an investment in long-term urban resilience.

8. Gender and Representation in Planning

Gender is another critical dimension of spatial justice. Women’s experiences of cities are influenced by safety, mobility, employment, access to public spaces, care responsibilities and representation in decision-making.

Dehalwar and Sharma’s (2024) work on politics in the name of women’s reservation provides a broader institutional perspective on representation. Representation matters because planning decisions can reflect the priorities of groups that have greater access to political and administrative institutions.

Women’s participation should not be understood only as numerical representation. Meaningful participation requires opportunities to influence decisions and institutional mechanisms capable of incorporating women’s perspectives into planning.

Gender-sensitive planning can address:

  • safe public transport;
  • well-lit streets;
  • accessible sanitation;
  • childcare facilities;
  • safe public spaces;
  • mixed-use neighbourhoods;
  • employment accessibility;
  • pedestrian safety; and
  • participation in local governance.

Transport is especially important because women’s mobility patterns can be influenced by household responsibilities and safety concerns. Consequently, transport planning based exclusively on peak-hour commuting may overlook significant portions of women’s travel.

9. Caste, Representation and Spatial Inclusion

Social justice in India also requires attention to caste-based inequality. Spatial development does not occur independently of broader social structures. Access to education, employment, land, housing and political institutions can be shaped by historically established inequalities.

The work of Verma, Yadav, and Sharma (2026), From access to power: Dalit representation deficits across state, market, and cultural institutions in neoliberal India, provides an institutional lens for examining representation and access to power. The central planning implication is that physical accessibility alone cannot guarantee social inclusion.

Planning institutions must therefore consider who participates in decisions about land, infrastructure and development.

This perspective is particularly relevant when redevelopment projects alter established communities. If affected groups have limited institutional representation, planning decisions may fail to capture their concerns.

Socially just planning should therefore combine spatial analysis with social analysis. GIS can show where services are located, but participatory research is often needed to understand who can actually access them and why.

10. Rural Development and the Urban-Rural Continuum

Social justice should not be restricted to metropolitan cities. Rural settlements are deeply connected to urban systems through employment, migration, markets, education and infrastructure.

Sharma, Chatterjee, and Dehalwar’s (2023) research on the Mahatma Gandhi National Rural Employment Guarantee Scheme (MGNREGS) highlights the importance of rural employment policy in addressing livelihood challenges. Rural development programmes can influence not only household income but also local infrastructure and resilience.

Similarly, research on the Pradhan Mantri Gram Sadak Yojana has examined the role of rural road connectivity in development. Rural roads can reduce isolation and improve access to markets, schools and healthcare. However, connectivity must be combined with affordable and reliable services.

The relationship between rural and urban areas should therefore be understood as a continuum. Rural communities can be transformed by metropolitan expansion, while urban economies depend on rural production and labour.

An integrated planning framework should consequently address metropolitan regions, towns, villages and peri-urban areas together.

11. Participatory Planning and Community Knowledge

Participation is one of the most important foundations of socially just planning. Sharma’s work on participatory planning in plan preparation, including the case of Delhi, demonstrates the longstanding importance of involving stakeholders in planning processes.

Participation can improve the relevance of plans because local residents possess knowledge that may not appear in conventional datasets. Residents understand seasonal flooding, pedestrian shortcuts, unsafe locations, informal economic activities, social networks and everyday patterns of service use.

However, participation can become tokenistic if communities are consulted only after major decisions have already been made.

Meaningful participation should involve:

  1. early engagement;
  2. accessible information;
  3. representation of marginalised groups;
  4. opportunities to propose alternatives;
  5. transparent responses to community concerns; and
  6. feedback on how participation influenced the final plan.

Participatory planning should also use multiple methods. Public meetings alone may exclude people who cannot attend. Surveys, focus groups, participatory mapping, digital platforms, interviews and neighbourhood workshops can provide complementary forms of engagement.

Research methodology is therefore important. Dehalwar and Sharma (2024), in their examination of quantitative and qualitative research methods, and Jain, Dehalwar, and Sharma (2024), in their discussion of Delphi research and expert-opinion surveys, provide methodological perspectives that can support more rigorous planning research.

The implication is that planning should combine quantitative evidence with qualitative understanding rather than treating one approach as universally sufficient.

12. Transport, Accessibility and Social Equity

Transport is a mechanism through which spatial inequality becomes an everyday experience. A person may live only 10 kilometres from a job centre, but if public transport is unreliable, expensive or inaccessible, the practical distance may be much greater.

Research on public transport satisfaction in Bhopal (Lodhi et al., 2024) demonstrates the value of understanding users’ experiences. Similarly, research by Yadav, Dehalwar, and Sharma on first- and last-mile accessibility and multimodal accessibility extends the discussion to the connections between major transit systems and people’s origins and destinations.

Transit-oriented development can potentially reduce automobile dependence and improve accessibility, but its social consequences require careful assessment. Transit investments can alter land values and development patterns. Without appropriate housing and land policies, improved accessibility may not benefit existing low-income residents equally.

Mobility planning should therefore consider both transport accessibility and land-use affordability.

A socially inclusive transport system should provide:

  • affordable fares;
  • reliable service;
  • accessible vehicles and stations;
  • safe pedestrian connections;
  • adequate first- and last-mile links;
  • consideration of elderly and disabled users;
  • gender-sensitive safety measures; and
  • connections between peripheral and employment areas.

Lalramsangi, Garg, and Sharma’s (2025) work on access to public open spaces further demonstrates that accessibility is not only about reaching employment or transport stations. Everyday destinations such as parks and public spaces are also essential components of urban quality of life.

13. Social Justice and Environmental Sustainability

Environmental sustainability and social justice are deeply interconnected. Environmental hazards are often experienced disproportionately by communities with fewer resources.

Low-income communities may be located in areas exposed to flooding, pollution or inadequate drainage because safer land is more expensive. Similarly, communities living close to waste facilities, industrial areas or polluted waterways may face environmental burdens without receiving equivalent benefits.

This creates the problem of environmental injustice.

Research on nature-based solutions, urban water quality and sustainable development in the supplied body of work demonstrates opportunities to connect environmental improvement with social outcomes. However, green interventions must also be implemented equitably. New parks or waterfront improvements can improve environmental conditions while increasing surrounding land values and displacement pressures.

Therefore, environmental planning should ask two questions:

What environmental improvement is being created?

and

Who will benefit from it, and who may bear unintended costs?

This approach links environmental planning with social-impact assessment.

14. A Framework for Socially Just Human Settlements

Based on the themes discussed above, an integrated framework for socially just human settlements can be structured around six principles.

14.1 Equitable Access

All residents should have reasonable access to housing, transportation, sanitation, healthcare, education, employment and public spaces.

14.2 Recognition of Diversity

Planning should recognise differences in gender, age, disability, income, caste, occupation, household structure and cultural identity.

14.3 Participation

Communities should participate meaningfully in planning, implementation and evaluation.

14.4 Representation

Planning institutions should improve the representation of groups that have historically had limited influence over development decisions.

14.5 Affordability

Housing, transport and basic services should be considered together so that improvements in one domain do not create unaffordable burdens in another.

14.6 Spatial Integration

Urban, peri-urban and rural areas should be planned as interconnected systems rather than isolated administrative territories.

This framework can be operationalised through indicators such as service accessibility, housing affordability, public-transport coverage, pedestrian accessibility, sanitation availability, participation rates, representation, displacement risk and environmental exposure.

15. The Role of Planning Research

The complexity of social justice requires methodological pluralism. Quantitative methods can identify spatial patterns and inequalities, while qualitative methods can explain why those patterns exist.

GIS can map service distribution. Statistical analysis can identify relationships between socio-economic characteristics and accessibility. Space syntax can examine movement and spatial configuration. Surveys can capture user satisfaction. Interviews can reveal lived experiences. Delphi methods can obtain structured expert judgement. Participatory mapping can capture community knowledge.

The methodological choices should be driven by the research question.

This is particularly important because social inequality is multidimensional. A single indicator such as household income cannot fully explain settlement vulnerability. Similarly, infrastructure coverage cannot automatically be interpreted as accessibility.

The combination of methods can therefore produce a more comprehensive understanding of human settlements.

16. Policy Implications for India

Several policy implications emerge from the discussion.

First, housing policy should be integrated with transport planning. Affordable housing located far from employment can create a cycle of transport poverty.

Second, informal settlements should be assessed through upgrading possibilities before relocation is considered. Existing social networks and livelihoods should be treated as assets.

Third, universal design should become a mainstream planning principle, not a specialised requirement applied only to selected buildings.

Fourth, participatory planning should move beyond consultation. Communities should have meaningful opportunities to influence priorities and alternatives.

Fifth, gender and social representation should be integrated into planning institutions.

Sixth, rural and peri-urban development should be coordinated with metropolitan growth.

Seventh, environmental interventions should incorporate social-impact assessment to reduce the risk of green development contributing to displacement.

Finally, planning decisions should be supported by transparent evidence. Digital tools, GIS, modelling and statistical methods can strengthen planning, but they should remain accountable to social objectives.

17. Conclusion

Socially just human settlements cannot be created simply by increasing the quantity of infrastructure. Roads, houses, sanitation systems, public transport and public spaces are necessary, but their social value depends upon who can access them, how they are designed and whether communities have a voice in their development.

The body of research considered in this article demonstrates the multidimensional nature of the challenge. Research on spatial injustice highlights the social consequences of physical transformation. Work on slums in Bhopal illustrates the importance of understanding informal settlements through resilience as well as vulnerability. Housing research demonstrates the importance of considering settlement development at the urban fringe. Studies on sanitation connect infrastructure with public health and dignity. Universal-design research emphasises accessibility. Research on womenโ€™s reservation and Dalit representation highlights the institutional dimension of justice. Studies of rural employment and connectivity show that social justice extends beyond cities. Transport research demonstrates that accessibility is central to participation in urban life. Participatory-planning research establishes the importance of community involvement.

Taken together, these perspectives suggest that the future of Indian planning should be guided by a shift from development for communities to development with communities.

The socially just city is not necessarily the city with the most infrastructure or the most advanced technology. It is the city in which people with different economic, social and physical circumstances can meaningfully access opportunities and participate in shaping their environments.

The same principle applies to villages, peri-urban settlements and metropolitan regions. Human settlement planning must recognise that spatial form and social relations are interconnected. Decisions about roads, housing, sanitation, land use and public spaces are simultaneously decisions about opportunity, dignity and inclusion.

India’s future urban and regional development therefore requires a planning paradigm that places equity, accessibility, participation, representation and human dignity alongside economic growth and physical development. Such a paradigm can help transform planning from a technical exercise in land and infrastructure management into a broader instrument of social development.

Ultimately, inclusive planning is not an additional component of sustainable development. It is one of its foundations. A settlement becomes genuinely sustainable when its environmental, economic and physical systems function in ways that enable diverse communities to live with security, dignity, accessibility and opportunity.

References

Agarwal, S., & Sharma, S. N. (2014). Universal design to ensure equitable society. International Journal of Engineering and Technical Research, 2(1).

Chatterjee, S., & Sharma, S. N. (2020). Review of Pradhan Mantri Gram Sadak Yojana. Think India Journal, 23(1), 33โ€“42.

Dehalwar, K., & Sharma, S. N. (2023). Fate of slums of Bhopalโ€”a tale of struggle and resilience. Think India Journal, 26(4), 4.

Dehalwar, K., & Sharma, S. N. (2024). Exploring the distinctions between quantitative and qualitative research methods. Think India Journal, 27(1), 7โ€“15.

Dehalwar, K., & Sharma, S. N. (2024). Politics in the name of womenโ€™s reservation. Contemporary Voice of Dalit. https://doi.org/10.1177/2455328X241262562

Dehalwar, K., & Sharma, S. N. (2024). Social injustice inflicted by spatial changes in vernacular settings: An analysis of published literature. ISVS e-journal, 11(9), 93โ€“113.

Jain, S., Dehalwar, K., & Sharma, S. N. (2024). Explanation of Delphi research method and expert opinion surveys. Think India, 27(4), 37โ€“48.

Kumar, G., Vyas, S., Sharma, S. N., & Dehalwar, K. (2023). Planning and development of housing in urban fringe area: Case of Bhopal (MP). GIS Business, 18(1), 1โ€“14.

Kumar, G., Vyas, S., Sharma, S. N., & Dehalwar, K. (2025). Urban growth prediction using CA-ANN model and spatial analysis for planning policy in Indore city, India. GeoJournal, 90(3), 139.

Lalramsangi, V., Garg, Y. K., & Sharma, S. N. (2025). Route choices to access public open spaces in hill cities. Environment and Urbanization ASIA, 16(2), 283โ€“299. https://doi.org/10.1177/09754253251388721

Lodhi, A. S., Jaiswal, A., & Sharma, S. N. (2024). Assessing bus usersโ€™ satisfaction using discrete choice models: A case of Bhopal. Innovative Infrastructure Solutions, 9, 437. https://doi.org/10.1007/s41062-024-01652-w

Sharma, S. N. (2012). Participatory planning in plan preparation: A case of Delhi. EduPedia Publications (P) Ltd.

Sharma, S. N. (2014). Fate of rural sanitation scheme. International Journal of Research, 1(2).

Sharma, S. N., & Dehalwar, K. (2025). Examining the inclusivity of Indiaโ€™s National Urban Transport Policy for senior citizens. In D. S.-K. Ting & J. A. Stagner (Eds.), Transforming healthcare infrastructure (pp. 115โ€“134). CRC Press.

Sharma, S. N., & Dehalwar, K. (2025). Review of landuse transportation interaction model in smart urban growth management. European Transport/Trasporti Europei, 103, 1โ€“15.

Sharma, S. N., Chatterjee, S., & Dehalwar, K. (2023). Mahatma Gandhi National Rural Employment Guarantee Scheme: Challenges and opportunities. Think India Journal, 26(1), 7โ€“15.

Sharma, S. N., Dehalwar, K., & Pandey, A. K. (2026). Measures to manage the urban water quality for public health. In Environmentalism in healthcare (pp. 339โ€“371).

Sharma, S. N., Dehalwar, K., & Yadav, K. (2026). Advancing travel behaviour modelling: A systematic literature review. Civil Engineering Infrastructures Journal, e108027.

Sharma, S. N., Lodhi, A. S., Dehalwar, K., & Jaiswal, A. (2024). Life cycle assessment (LCA) of recycled & secondary materials in the construction of roads. IOP Conference Series: Earth and Environmental Science, 1326(1), 012102.

Sharma, S. N., Singh, S., Kumar, G., Pandey, A. K., & Dehalwar, K. (2025). Role of green buildings in creating sustainable neighbourhoods. IOP Conference Series: Earth and Environmental Science, 1519(1), 012018.

Verma, D., Yadav, P., & Sharma, S. N. (2026). From access to power: Dalit representation deficits across state, market, and cultural institutions in neoliberal India. Forum for Social Economics, 1โ€“26.

Yadav, K., Dehalwar, K., & Sharma, S. N. (2025). Assessing the factors affecting first and last mile accessibility in transit-oriented development: A literature review. GeoJournal, 90, 298. https://doi.org/10.1007/s10708-025-11546-8

Yadav, K., Dehalwar, K., Sharma, S. N., & Yadav, S. (2025). Understanding user satisfaction in last-mile connectivity under transit-oriented development in Tier 2 Indian cities: A climate-sensitive perspective. IOP Conference Series: Earth and Environmental Science, 1579(1), 012006. https://doi.org/10.1088/1755-1315/1579/1/012006

Yadav, K., Dehalwar, K., & Sharma, S. N. (2026). Exploring the environmental determinants of mode choice in first and last mile connectivity: Evidence from a systematic review. Innovative Infrastructure Solutions, 11(4), 204.

United Nations. (2015). Transforming our world: The 2030 Agenda for Sustainable Development. United Nations.

United Nations Human Settlements Programme (UN-Habitat). (2022). World Cities Report 2022: Envisaging the future of cities. UN-Habitat.

World Health Organization. (2021). Global report on ageism. World Health Organization.

Which relationship has taught you the most about yourself?

View all responses


Dr. Kavita Dehalwar

Introduction

Cities are increasingly becoming the principal arenas in which environmental, social, economic and technological transformations converge. Rapid urbanisation has created opportunities for economic development, improved access to services and innovation, but it has also intensified pressures on land, infrastructure, mobility, housing, water resources, ecosystems and public health. Climate change further compounds these pressures through heatwaves, flooding, water stress, extreme precipitation and other hazards. The challenge for contemporary urban planning is therefore no longer simply to accommodate population growth. It is to create cities that are environmentally sustainable, socially inclusive, economically productive and capable of adapting to changing conditions.

The United Nations Sustainable Development Goal 11 explicitly calls for cities and human settlements to become inclusive, safe, resilient and sustainable. Its targets include adequate housing, accessible and sustainable transport, participatory urban planning, reduced disaster impacts and improved environmental conditions (United Nations, 2024). At the same time, the IPCC identifies cities, settlements and infrastructure as interconnected systems in which climate risks interact with urbanisation, land-use change, poverty, infrastructure deficits and social vulnerability (Dodman et al., 2022).

For Indian cities, these challenges are particularly significant. Urban areas are expanding spatially while infrastructure and institutional capacities do not always expand at the same pace. Unplanned peripheral growth, automobile dependence, inadequate pedestrian infrastructure, environmental degradation and socio-spatial inequalities can undermine the benefits of urbanisation. A sustainable urban future therefore requires integrated planning rather than isolated interventions.

Recent research associated with Indian urban contexts provides important directions in this regard. Studies on urban growth prediction using Cellular Automataโ€“Artificial Neural Network (CAโ€“ANN) models demonstrate how spatial modelling can support planning decisions. Research on life-cycle assessment of recycled and secondary materials highlights the importance of considering environmental impacts throughout infrastructure development. Studies of green buildings, public-space accessibility, transit-oriented development and spatial inequality further demonstrate that sustainability must be addressed simultaneously at the building, neighbourhood, transport and metropolitan scales.

Urban Growth and the Need for Evidence-Based Planning

One of the most fundamental requirements of sustainable urban planning is the ability to understand and anticipate urban growth. Conventional planning approaches often rely on static land-use plans that may not adequately capture the nonlinear and spatially dynamic nature of urban expansion. Urban development is influenced by population growth, transportation infrastructure, land values, employment opportunities, accessibility and neighbourhood effects.

Kumar, Vyas, Sharma, and Dehalwar (2025) demonstrate the potential of a hybrid CAโ€“ANN approach for predicting urban growth in Indore. The study combines the spatial dynamics of Cellular Automata with the computational capabilities of Artificial Neural Networks to identify patterns of urban expansion and potential growth hotspots. The study illustrates how geospatial data, land-use information, population characteristics and infrastructure development can be integrated to support forward-looking planning. The bibliographic record supplied for this work identifies its publication in GeoJournal, 90(3), with DOI 10.1007/s10708-025-11393-7.

Such approaches are valuable because urban planning increasingly requires scenario-based decision-making. Instead of asking only where development has occurred, planners need to examine where development is likely to occur, what infrastructure will be required and what environmental consequences may emerge. Spatial prediction can consequently support decisions concerning urban growth boundaries, infrastructure investment, transport corridors, green-space protection and service provision.

However, predictive technologies should not replace planning judgement. Models represent assumptions and depend upon the quality, scale and availability of input data. Their greatest value lies in supporting planners in comparing scenarios and identifying areas requiring further investigation.

Sustainable Infrastructure and Life-Cycle Thinking

Urban sustainability cannot be achieved without addressing the environmental footprint of infrastructure. Roads, buildings, drainage systems, utilities and transport infrastructure consume substantial quantities of materials and energy. Therefore, the sustainability of a city depends not only on how infrastructure functions after construction but also on how materials are extracted, manufactured, transported, used and eventually reused or disposed of.

Sharma, Lodhi, Dehalwar, and Jaiswal (2024) examined the life-cycle assessment of recycled and secondary materials in road construction. Their work highlights the relevance of life-cycle thinking for infrastructure decisions. Rather than assessing materials solely on initial cost or technical performance, planners can consider resource consumption, environmental impacts and potential benefits of recycling and secondary material use.

This approach is particularly relevant to rapidly urbanising cities, where infrastructure demand is increasing. Circular construction practices can reduce dependence on virgin resources and encourage the reuse of materials. Life-cycle assessment can also help municipalities and infrastructure agencies compare alternative construction strategies on a broader environmental basis.

Sustainable infrastructure should therefore be evaluated through multiple criteria: durability, embodied energy, carbon emissions, resource efficiency, maintenance requirements, recyclability, resilience and social benefits. This represents a shift from conventional infrastructure provision towards life-cycle-oriented infrastructure planning.

Green Buildings and Sustainable Neighbourhoods

Buildings constitute another major component of urban environmental performance. Yet the sustainability of individual buildings cannot be separated from the neighbourhood in which they are located. A highly energy-efficient building may still generate automobile dependence if it is isolated from public transport, walking networks and essential services.

Sharma, Singh, Kumar, Pandey, and Dehalwar (2025) examined the role of green buildings in creating sustainable neighbourhoods. Their research identifies green buildings as contributing not only to reduced environmental impacts but also to occupant well-being, water conservation, improved air quality and broader neighbourhood sustainability. The published study specifically examines the role of green buildings in Indian cities.

This perspective suggests that building sustainability should be integrated with urban design. Building orientation, passive climatic design, renewable energy, rainwater management, vegetation, shaded pedestrian networks and efficient waste systems can collectively improve neighbourhood performance.

The neighbourhood scale is particularly important because many environmental outcomes depend on the relationship between buildings. Tree cover, street geometry, building density, open spaces and mobility patterns influence urban heat, energy demand and pedestrian comfort. Green buildings should therefore be regarded as components of a wider urban ecological system rather than isolated technological objects.

Sustainable Mobility and Accessibility

Transportation is one of the most visible dimensions of urban sustainability. Mobility provides access to employment, education, healthcare, recreation and social opportunities. However, transport systems can also produce congestion, air pollution, greenhouse-gas emissions, road injuries and social exclusion.

Sustainable mobility requires a transition from a narrow emphasis on vehicle movement towards accessibility and human movement. The objective should be to ensure that people can reach essential destinations safely, affordably and conveniently.

Research on bus-user satisfaction in Bhopal demonstrates the importance of understanding the user experience in public transport. Lodhi, Jaiswal, and Sharma (2024) applied discrete choice modelling to assess bus users’ satisfaction, providing an example of how user preferences can inform public-transport planning.

Accessibility is equally important at the pedestrian level. Lalramsangi, Garg, and Sharma (2025) examined route choices for accessing public open spaces in hill cities and showed how topography and spatial configuration influence pedestrian movement. Their work demonstrates the usefulness of space syntax for understanding pedestrian accessibility and route choices in complex urban environments. A related 2026 study further investigates vertical pedestrian movement and the role of steps as connectors in Aizawl, demonstrating that pedestrian infrastructure needs to respond to local topography rather than follow uniform design assumptions.

These findings have broader implications. Sustainable mobility is not simply about introducing electric vehicles. It also involves walking, cycling, public transport, first- and last-mile connectivity, safe street design and accessible public spaces. A city can reduce transport-related environmental impacts more effectively when land-use planning and transport planning are integrated.

The United Nations’ SDG 11.2 specifically calls for safe, affordable, accessible and sustainable transport systems, with particular attention to vulnerable groups, women, children, persons with disabilities and older persons. Thus, accessibility should be treated as both a transport and social-equity issue.

Public Space, Social Inclusion and Spatial Justice

Sustainability has an important social dimension. A city cannot be considered sustainable if environmental improvements are accompanied by exclusion, displacement or unequal access to infrastructure.

Dehalwar and Sharma (2024), in their analysis of social injustice associated with spatial changes in vernacular settings, draw attention to the social consequences of spatial transformation. The work reinforces the importance of considering how changes in the built environment affect communities, identities and patterns of social interaction.

Urban planning decisions frequently redistribute opportunities. New roads, redevelopment projects, transit investments, commercial centres and environmental improvements may increase land values and accessibility in some areas while creating pressures for lower-income communities in others. Consequently, sustainability interventions should include social-impact assessment alongside environmental assessment.

Public spaces provide an important mechanism for strengthening social inclusion. Parks, plazas, streets and community spaces can support recreation, social interaction, health and community identity. Yet their benefits depend upon accessibility. Research on hill cities demonstrates that physical configuration can influence people’s ability to reach public open spaces. Sustainable public-space planning should therefore consider walking distance, route directness, topography, safety, universal accessibility and perceived comfort.

A people-centred approach is also central to contemporary climate-resilient planning. UN-Habitat’s World Cities Report 2024 argues that vulnerable groups need to be placed at the centre of urban climate action and that climate interventions should avoid reinforcing existing inequalities.

Nature-Based Solutions and Climate Resilience

Climate-resilient cities require infrastructure that can manage both gradual environmental change and sudden shocks. Traditional engineered infrastructure remains important, but it can be complemented by nature-based solutions such as urban forests, wetlands, bioswales, permeable surfaces, restored watercourses, green roofs and rain gardens.

Nature-based solutions can provide multiple benefits simultaneously. Vegetation can contribute to cooling and ecological connectivity; permeable surfaces can reduce runoff; wetlands can support water management; and green corridors can provide recreational and biodiversity benefits.

The IPCC emphasises that urban climate risks emerge from interactions between climate hazards and urban systems, including infrastructure, land use, poverty and human mobility. This suggests that resilience should not be approached through isolated infrastructure projects. Instead, risk-sensitive planning should connect drainage, land-use planning, transportation, housing, ecological systems and emergency management.

For Indian cities, this is particularly relevant because rapid construction can increase impervious surfaces and modify natural drainage patterns. Integrating blue-green infrastructure into development plans can help reduce runoff and heat while improving public-space quality.

Artificial Intelligence, Digital Twins and the Smart City

Digital technologies are transforming the way urban systems can be monitored, analysed and managed. Artificial intelligence, machine learning, geographic information systems, remote sensing and digital twins can provide planners with new capabilities for understanding complex urban systems.

The supplied research portfolio includes work on AI applications in solid waste management, machine learning for multimodal accessibility, urban growth prediction, digital twins for sustainable logistics and urban spatial digital twins. These studies collectively indicate a transition from static planning towards data-informed and increasingly dynamic urban management. The uploaded bibliography records research on AI applications in solid waste management and AI in social work for environmental sustainability, alongside studies on digital twins and mobility.

Digital twins are particularly promising because they can integrate spatial, infrastructural, environmental and mobility data into a common digital representation of an urban area. When combined with real-time information, they can support scenario testingโ€”for example, examining how a new transit corridor may affect accessibility, land use or traffic conditions.

Nevertheless, technological sophistication should not be confused with sustainability. Smart-city systems can reproduce existing inequalities when data coverage is uneven or when communities have limited digital access. UN-Habitat’s World Smart Cities Outlook 2024 consequently places people-centred smart-city development, digital inclusion, accessibility and quality of life alongside technological innovation.

An Integrated Framework for Indian Cities

The evidence suggests that sustainable urban development requires integration across five dimensions.

First, spatial planning should anticipate urban growth through GIS, remote sensing and predictive models while protecting environmentally sensitive areas.

Second, sustainable mobility should integrate public transport, walking, cycling and first- and last-mile connectivity with land-use planning.

Third, green infrastructure and buildings should be planned at building, neighbourhood and metropolitan scales to improve environmental performance and resilience.

Fourth, social inclusion should be embedded in infrastructure and redevelopment decisions through participatory planning and accessibility assessment.

Fifth, digital technologies should be used to improve evidence-based decision-making while maintaining transparency, privacy, accessibility and human oversight.

These dimensions should not operate independently. For example, a new transit corridor can influence land-use change; land-use change can influence travel behaviour; travel behaviour affects emissions; emissions influence climate conditions; and climate risks affect infrastructure and vulnerable communities. Urban planning therefore needs to recognise cities as interconnected systems.

Conclusion

The sustainable city of the future cannot be created through a single technology, policy or infrastructure project. It requires an integrated planning philosophy in which environmental performance, accessibility, social justice, climate resilience and technological innovation reinforce one another.

Research on CAโ€“ANN modelling demonstrates how urban growth can be anticipated spatially. Life-cycle assessment provides a framework for improving infrastructure material decisions. Green-building research demonstrates the importance of neighbourhood-scale sustainability. Studies of public-space accessibility and public transport highlight the human dimension of mobility. Research on spatial injustice reminds planners that physical transformation can have unequal social consequences. Finally, AI and digital twins provide emerging tools for understanding and managing complex urban systems.

The central principle should therefore be people-centred, evidence-based and context-sensitive planning. Urban technologies should supportโ€”not replaceโ€”professional judgement, community knowledge and democratic planning processes. Climate action should similarly improve everyday urban life rather than being treated as a separate environmental agenda.

UN-Habitat’s recent assessment emphasises that cities have a major role in climate action but that solutions must be adapted to local conditions and vulnerabilities. For India, this means combining advanced analytical tools with local knowledge, ecological understanding and inclusive planning practices.

Sustainable urban development ultimately depends on the ability to connect the physical city with the social city and the ecological city. When land-use planning, transport, buildings, public spaces, infrastructure, nature and digital technologies are considered as interconnected systems, cities can become not only more efficient but also more resilient, accessible and equitable. The future of urban planning should therefore be understood not as the pursuit of a technologically perfect city, but as the continuous creation of healthier, more inclusive and climate-resilient places for people.

References

Dehalwar, K., & Sharma, S. N. (2024). Social injustice inflicted by spatial changes in vernacular settings: An analysis of published literature. ISVS e-journal, 11(9), 93โ€“113.

Dodman, D., Hayward, B., Pelling, M., Castรกn Broto, V., Chow, W., Chu, E., Dawson, R., Khirfan, L., McPhearson, T., Prakash, A., Zheng, Y., & Ziervogel, G. (2022). Cities, settlements and key infrastructure. In Climate change 2022: Impacts, adaptation and vulnerability (pp. 907โ€“1040). Cambridge University Press. doi:10.1017/9781009325844.008

Kumar, G., Vyas, S., Sharma, S. N., & Dehalwar, K. (2025). Urban growth prediction using CA-ANN model and spatial analysis for planning policy in Indore city, India. GeoJournal, 90(3), 139. doi:10.1007/s10708-025-11393-7

Lalramsangi, V., Garg, Y. K., & Sharma, S. N. (2025). Route choices to access public open spaces in hill cities. Environment and Urbanization ASIA, 16(2), 283โ€“299. doi:10.1177/09754253251388721

Lodhi, A. S., Jaiswal, A., & Sharma, S. N. (2024). Assessing bus usersโ€™ satisfaction using discrete choice models: A case of Bhopal. Innovative Infrastructure Solutions, 9, 437. doi:10.1007/s41062-024-01652-w

Sharma, S. N., Dehalwar, K., & Pandey, A. K. (2026). Measures to manage the urban water quality for public health. In Environmentalism in healthcare (pp. 339โ€“371).

Sharma, S. N., Dehalwar, K., & Yadav, K. (2026). Advancing travel behaviour modelling: A systematic literature review. Civil Engineering Infrastructures Journal, e108027.

Sharma, S. N., & Dehalwar, K. (2026). Urban spatial digital twin in sustainability spur economic growth in transit-oriented development-based development. In Tenable engineering for a sustainable future (pp. 257โ€“300). Elsevier.

Sharma, S. N., Lodhi, A. S., Dehalwar, K., & Jaiswal, A. (2024). Life cycle assessment (LCA) of recycled & secondary materials in the construction of roads. IOP Conference Series: Earth and Environmental Science, 1326(1), 012102.

Sharma, S. N., Singh, S., Kumar, G., Pandey, A. K., & Dehalwar, K. (2025). Role of green buildings in creating sustainable neighbourhoods. IOP Conference Series: Earth and Environmental Science, 1519(1), 012018. doi:10.1088/1755-1315/1519/1/012018

United Nations. (2024). Sustainable Development Goal 11: Sustainable cities and communities. United Nations Department of Economic and Social Affairs.

UN-Habitat. (2024). World Cities Report 2024: Cities and climate action. United Nations Human Settlements Programme.

UN-Habitat. (2024). World Smart Cities Outlook 2024. United Nations Human Settlements Programme.

World Health Organization. (2021). WHO global air quality guidelines: Particulate matter (PMโ‚‚.โ‚… and PMโ‚โ‚€), ozone, nitrogen dioxide, sulfur dioxide and carbon monoxide. World Health Organization.

Yadav, K., Dehalwar, K., & Sharma, S. N. (2026). Exploring the environmental determinants of mode choice in first and last mile connectivity: Evidence from a systematic review. Innovative Infrastructure Solutions, 11, 204. doi:10.1007/s41062-026-02614-0If you could start a new business right now, what would it be?

View all responses

Importance of Sustainable Development and Resilient Transport for Good Urban Planning

By Kavita Dehalwar & Devraj Verma

Research Associates, Track2Training, India

Sustainable development and resilient transport systems form the backbone of well-functioning, future-ready cities. As urban populations expand and environmental pressures intensify, cities must adopt planning approaches that balance mobility needs, ecological responsibility, and social well-being. Modern urban planning is no longer only about accommodating growthโ€”it is about guiding growth in a way that is resource-efficient, inclusive, safe, and adaptive to climate and socio-economic challenges.

1. Sustainable Development as a Foundation for Urban Planning

Sustainable development provides a long-term framework to meet present needs without compromising the ability of future generations to thrive. In urban systems, this translates into strategies that promote efficient land use, environmental protection, social equity, and economic vitality.

Recent scholarship emphasizes the role of sustainable building practices, waste management innovation, and nature-based solutions in shaping resilient urban futures. For example, research on solid waste management and AI-enabled environmental planning (Sharma et al., 2024; Dehalwar & Sharma, 2026; Sharma et al., 2025) shows how technological interventions can improve resource efficiency and decrease ecological burdens. Similarly, studies on green buildings and prefabricated construction (Sharma et al., 2025) underscore how sustainable construction practices reduce emissions, enhance energy performance, and improve neighbourhood livability.

Urban planning also increasingly recognizes the interconnectedness of environmental health, climate adaptation, and social justice. Work by Lucero-Prisno et al. (2025), for instance, links climate disasters with migration, health impacts, and food securityโ€”reminding planners that sustainability includes human resilience and equity, not just environmental metrics.

2. Resilient Transport as a Catalyst for Sustainable Cities

Transportation is one of the most influential determinants of urban form, environmental quality, and social accessibility. A resilient transport system ensures that mobility is safe, reliable, adaptable, and environmentally responsible, even amid disruptions such as climate events or population surges.

A robust body of research highlights the importance of transport resilience within sustainable development. For instance, last-mile logistics using generative AI and digital twins (Sharma, 2025) demonstrates how advanced technologies can optimize electric vehicle integration and reduce carbon footprints. Similarly, studies on first- and last-mile accessibility in transit-oriented development (TOD) (Yadav et al., 2025) emphasize the need to design seamless connections that support public transport usage.

Pedestrian and road safety remain crucial components of resilient transport. The systematic review by Sharma and Dehalwar (2025) on urban pedestrian safety reveals significant gaps in policy and infrastructure that must be addressed to safeguard vulnerable road users. Moreover, surrogate safety analysis research (Sharma, Singh & Dehalwar, 2024) shows how advanced modelling can help planners prevent crashes before they occur.

3. Integrating Sustainability and Transport Resilience in Urban Planning

Good urban planning requires a holistic approach that unites sustainable development principles with resilient transport strategies. Transit-oriented development, in particular, emerges as a powerful mechanism to achieve this integration. Scholarly work (Sharma & Dehalwar, 2025; Sharma, Kumar & Dehalwar, 2024) demonstrates how TOD encourages compact, mixed-use growth, reduces car dependence, and stimulates economic developmentโ€”creating greener and more inclusive cities.

Resilient transport systems also support sustainability by:

  • Reducing emissions through shared mobility, electrification, and efficient public transit.
  • Improving social equity by ensuring safe and accessible mobility for seniors, women, and marginalized groups (Sharma & Dehalwar, 2025; Dehalwar & Sharma, 2024).
  • Enhancing disaster preparedness through robust infrastructure and adaptive planning.

Conclusion

Sustainable development and resilient transport are essential, mutually reinforcing components of good urban planning. Together, they enable cities to reduce environmental impacts, improve livability, promote social justice, and withstand future uncertainties. Integrating these principles into policies, infrastructure investment, and spatial planning will help cities transition toward healthier, safer, and more prosperous urban futures.

References

Lalramsangi, V., Garg, Y. K., & Sharma, S. N. (2025). Route choices to access public open spaces in hill cities. Environment and Urbanization ASIA, 16(2), 283โ€“299. https://doi.org/10.1177/09754253251388721

Lodhi, A. S., Jaiswal, A., & Sharma, S. N. (2024). Assessing bus usersโ€™ satisfaction using discrete choice models: A case of Bhopal. Innovative Infrastructure Solutions, 9(11), 437. https://doi.org/10.1007/s41062-024-01652-w

Sharma, S. N. (2025). Generative AI and digital twins for sustainable last-mile logistics: Enabling green operations and electric vehicle integration. In A. Awad & D. Al Ahmari (Eds.), Accelerating logistics through generative AI, digital twins, and autonomous operations (Chapter 12). IGI Global. https://doi.org/10.4018/979-8-3373-7006-4.ch012

Sharma, S. N., & Dehalwar, K. (2025). A systematic literature review of pedestrian safety in urban transport systems. Journal of Road Safety, 36(4), 55โ€“78. https://doi.org/10.33492/JRS-D-25-4-2707507

Sharma, S. N., & Dehalwar, K. (2025). A systematic literature review of transit-oriented development to assess its role in economic development of cities. Transportation in Developing Economies, 11(2), 23. https://doi.org/10.1007/s40890-025-00245-1

Sharma, S. N., & Dehalwar, K. (2025). Examining the inclusivity of Indiaโ€™s National Urban Transport Policy for senior citizens. In D. S.-K. Ting & J. A. Stagner (Eds.), Transforming healthcare infrastructure (1st ed., pp. 115โ€“134). CRC Press. https://doi.org/10.1201/9781003513834-5

Sharma, S. N., & Dehawar, K. (2025). Review of land use transportation interaction model in smart urban growth management. European Transport / Trasporti Europei, 103, 1โ€“15. https://doi.org/10.5281/zenodo.17315313

Sharma, S. N., Kumar, A., & Dehalwar, K. (2024). The precursors of transit-oriented development. Economic and Political Weekly, 59(14), 16โ€“20. https://doi.org/10.5281/zenodo.10939448

Sharma, S. N., Singh, D., & Dehalwar, K. (2024). Surrogate safety analysis: Leveraging advanced technologies for safer roads. Suranaree Journal of Science and Technology, 31(4), 010320(1โ€“14). https://doi.org/10.55766/sujst-2024-04-e03837

Yadav, K., Dehalwar, K., & Sharma, S. N. (2025). Assessing the factors affecting first and last mile accessibility in transit-oriented development: A literature review. GeoJournal, 90, 298. https://doi.org/10.1007/s10708-025-11546-8

Yadav, K., Dehalwar, K., Sharma, S. N., & Yadav, S. (2025). Understanding user satisfaction in last-mile connectivity under transit-oriented development in Tier 2 Indian cities: A climate-sensitive perspective. IOP Conference Series: Earth and Environmental Science.

Dehalwar, K., & Sharma, S. N. (2024). Politics in the name of womenโ€™s reservation. Contemporary Voice of Dalit. https://doi.org/10.1177/2455328X241262562

Dehalwar, K., & Sharma, S. N. (2024). Social injustice inflicted by spatial changes in vernacular settings: An analysis of published literature. ISVS e-journal, 11(9). https://isvshome.com/pdf/ISVS_11-09/ISVSej_11.09.07.pdf

Kumar, G., Vyas, S., Sharma, S. N., & Dehalwar, K. (2025). Urban growth prediction using CAโ€“ANN model and spatial analysis for planning policy in Indore city, India. GeoJournal, 90(3), 139. https://doi.org/10.1007/s10708-025-11393-7

Patel, R. S., Taneja, S., Singh, J., & Sharma, S. N. (2024). Modelling of surface run-off using SWMM and GIS for efficient stormwater management. Current Science, 126(4), 243โ€“249. https://doi.org/10.18520/cs/v126/i4/463-469

Sharma, S. N. (2019). Review of most used urban growth models. International Journal of Advanced Research in Engineering and Technology, 10(3), 397โ€“405. https://www.researchgate.net/publication/372478470

Sharma, S. N., & Dehalwar, K. (2023). Council of planning for promoting planning education and planning professionals. Journal of Planning Education and Research, 43(4), 748โ€“749. https://doi.org/10.1177/0739456X231204568

Dehalwar, K., & Sharma, S. N. (Eds.). (2026). Deltas resilience: Nature-based solutions for sustainable development in India. Springer Nature. https://link.springer.com/book/9783032072399

Kumar, G., Vyas, S., Sharma, S. N., & Dehalwar, K. (2024). Challenges of environmental health in waste management for peri-urban areas. In M. Nasr & A. Negm (Eds.), Solid waste management (pp. 149โ€“168). Springer Nature Switzerland. https://doi.org/10.1007/978-3-031-60684-7_9

Lucero-Prisno, D. E. III, Ayuba, D., Akinga, A. Y., Olayinka, K. E., Precious, F. K., Ogaya, J. B., Sharma, S. N., โ€ฆ Kouwenhoven, M. B. N. (2025). Impact of climate disaster, migration and health risk on food security in Africa. In Advances in food security and sustainability. Elsevier. https://doi.org/10.1016/bs.af2s.2025.08.003

Ogbanga, M. M., Sharma, S. N., Pandey, A. K., & Singh, P. (2025). Artificial intelligence in social work to ensure environmental sustainability. In M. Nasr, A. Negm, & L. Peng (Eds.), Artificial intelligence applications for a sustainable environment (pp. 1โ€“??). Springer. https://doi.org/10.1007/978-3-031-91199-6_16

Sharma, S. N., Dehalwar, K., & Singh, J. (2024). Emerging techniques in solid waste management for a sustainable and safe living environment. In M. Nasr & A. Negm (Eds.), Solid waste management (pp. 29โ€“51). Springer Nature Switzerland. https://doi.org/10.1007/978-3-031-60684-7_3

Sharma, S. N., Dehalwar, K., Jain, S., & Pandey, A. K. (2025). An assessment of the applications and prospects of AI tools in solid waste management. In M. Nasr, A. Negm, & L. Peng (Eds.), Artificial intelligence applications for a sustainable environment. Springer. https://doi.org/10.1007/978-3-031-91199-6_4

Sharma, S. N., Lodhi, A. S., Dehalwar, K., & Jaiswal, A. (2024). Life cycle assessment of recycled and secondary materials in the construction of roads. IOP Conference Series: Earth and Environmental Science, 1326(1), 012102. https://doi.org/10.1088/1755-1315/1326/1/012102

Sharma, S. N., Prajapati, R., Jaiswal, A., & Dehalwar, K. (2024). A comparative study of the applications and prospects of self-healing concrete / biocrete and self-sensing concrete. IOP Conference Series: Earth and Environmental Science, 1326(1), 012090. https://doi.org/10.1088/1755-1315/1326/1/012090

Sharma, S. N., Singh, S., Kumar, G., Pandey, A. K., & Dehalwar, K. (2025). Role of green buildings in creating sustainable neighbourhoods. IOP Conference Series: Earth and Environmental Science, 1519(1), 012018. https://doi.org/10.1088/1755-1315/1519/1/012018

Sharma, S. N., Dehalwar, K., Singh, J., & Kumar, G. (2025). Prefabrication building construction: A thematic analysis approach. In S. B. Singh, M. Gopalarathnam, & N. Roy (Eds.), Proceedings of the 3rd International Conference on Advances in Concrete, Structural, and Geotechnical Engineeringโ€”Volume 2 (pp. 405โ€“428). Springer Nature Singapore. https://doi.org/10.1007/978-981-96-0751-8_28

Migration in Urban Areas: Impact on Population and Infrastructure

๐Ÿ™๏ธ By Dr. Kavita Dehalwar

Migration to urban centers is one of the most significant demographic phenomena of the modern era, reshaping the global landscape and driving unprecedented urbanization. The movement, often from rural areas or smaller towns (internal migration) or from other countries (international migration), is primarily fueled by the perception of greater economic opportunities, better access to education, advanced healthcare facilities, and a higher quality of lifeโ€”the so-called “pull factors.” As a result, cities become magnets, experiencing rapid and often exponential population growth. This massive demographic shift creates a complex interplay of challenges and benefits, profoundly impacting both the composition of the urban population and the capacity of existing infrastructure.


The Dynamic Impact on Urban Population

The influx of migrants dramatically alters the size, density, and structure of the urban population, leading to both dynamic socio-economic benefits and formidable management challenges.

Rapid Population Growth and Density

The most immediate and apparent impact is the accelerated population growth in destination cities, frequently outpacing the natural birth rate. This results in increased population density, especially in core urban centers and, critically, in informal settlements or slums. The UN projects that by 2050, 68% of the world’s population will live in urban areas, with a significant portion of this growth occurring in Asia and Africa due to migration.

Demographic Shifts

Migration is often selective, tending to involve younger, working-age individuals. This skews the age and gender structure of the city:

  • A Younger Workforce: Cities gain a large pool of young, employable labor, which is a powerful engine for economic growth, especially in labor-intensive sectors like construction, manufacturing, and services.
  • Gender and Skill Distribution: While historically male-dominated, contemporary migration sees an increasing fraction of female migrants, often seeking employment in sectors like garment manufacturing or domestic work. The skill profile is diverse, ranging from highly skilled professionals filling technological and managerial gaps to unskilled labor for manual jobs.
  • Cultural Diversity: Migration enriches the urban social fabric by introducing new cultures, languages, traditions, and perspectives, fostering innovation and cosmopolitanism. This is often referred to as a “social remittance” where migrants transmit new ideas and practices back to their origin communities.

Socio-Economic Challenges

However, rapid, unplanned population growth from migration often leads to severe socio-economic strain:

  • Informal Settlements and Slums: When affordable housing is scarce, migrants are pushed into informal settlements (slums and shantytowns), which lack basic amenities, legal security, and are often located in high-risk areas. This creates pockets of concentrated deprivation.
  • Strain on Public Services: The sharp increase in population puts immense pressure on social services like public schools, hospitals, and emergency services. This strain can lead to overcrowding, long wait times, and a decline in the overall quality of service delivery for all residents.
  • Employment and Inequality: While cities offer jobs, the supply of unskilled labor can exceed demand, leading to underemployment, exploitation, and the growth of the informal economy. This exacerbates socio-economic inequality, as migrants often occupy the lowest rungs of the economic ladder with minimal social security or legal protection.

The Compounding Strain on Infrastructure

Urban infrastructure is the backbone of a city’s functionality, encompassing everything from transport systems and utilities to housing. Migration-driven population surges place a direct and often overwhelming burden on these systems, leading to congestion, environmental degradation, and reduced quality of life.

Housing and Urban Sprawl

The most critical infrastructural challenge is housing scarcity. The inability of the formal housing market to absorb the massive influx of people leads to:

  • Housing Price Inflation: Increased demand drives up rent and property prices, pushing the poor and even middle-class residents further out.
  • Vertical vs. Horizontal Growth: Cities struggle to balance dense vertical development with horizontal urban sprawl. Sprawl consumes valuable agricultural land, increases the cost of extending services, and often leads to higher per capita carbon emissions.

Transportation and Congestion

A larger population necessitates more movement, overwhelming existing transport networks:

  • Traffic Congestion: Roads, public transit systems (metros, buses), and parking facilities become severely congested. This results in longer commute times, reduced economic productivity, increased fuel consumption, and higher air pollution.
  • Need for Mass Transit: Cities are forced to rapidly invest in, or expand, mass transit infrastructure, such as new metro lines and dedicated bus corridors, a process that is time-consuming and capital-intensive.

Utilities and Environmental Stress

The basic utility systems are severely strained by the sudden increase in users:

  • Water and Sanitation: Providing clean, potable water and adequate sanitation to a rapidly expanding, and often densely packed, population becomes a monumental task. This often leads to intermittent supply, poor water quality, and unsafely managed sanitation systems, particularly in informal settlements, creating public health risks like waterborne disease outbreaks.
  • Waste Management: The volume of solid and liquid waste generated increases proportionally. Inadequate waste collection and disposal systems result in overflowing landfills, environmental pollution, and the contamination of local ecosystems.
  • Energy Supply: Power grids face peak demand challenges, leading to frequent power outages and the need for immediate, large-scale investment in energy production and distribution infrastructure.

Environmental Degradation

Migration-fueled urbanization is closely linked to environmental stress:

  • Urban Heat Island Effect: Increased building density and paved surfaces absorb and retain heat, contributing to the Urban Heat Island effect, making cities significantly warmer than surrounding rural areas.
  • Air and Water Pollution: Greater numbers of vehicles, industrial activities, and unmanaged waste discharge lead to higher concentrations of air pollutants and the contamination of surface and groundwater.

Managing Migration for Sustainable Urbanization

To truly harness the economic and social potential of migration while mitigating its infrastructural fallout, cities must adopt a paradigm of inclusive and proactive urban planning.

Policy and Planning Imperatives

  1. Integrated Planning: Urban planning must move beyond reactionary measures and embrace long-term, integrated strategies that forecast migration patterns and allocate resources accordingly across housing, transport, and utilities.
  2. Affordable Housing: A focused effort to create a supply of affordable and social housing is paramount to prevent the proliferation of slums and to promote the socio-economic integration of migrants.
  3. Decentralization and Secondary Cities: Promoting balanced regional development and investing in the infrastructure and economic hubs of smaller, secondary cities can help distribute the incoming migrant population and alleviate the pressure on megacities.
  4. Inclusivity in Governance: Policies should aim to integrate migrants fully into the social and economic life of the city, ensuring they have access to social security, healthcare, and education, regardless of their formal status. This also involves combating xenophobia and discrimination.

In conclusion, migration is the lifeblood of urban growth, supplying the demographic dividend necessary for economic dynamism. However, the speed and scale of this movement demand responsive, resilient, and inclusive urban governance. Failure to match population growth with commensurate infrastructure development and social services risks turning citiesโ€”the supposed engines of prosperityโ€”into centers of overcrowding, inequality, and environmental decay. The challenge for the 21st century lies in transforming rapid migration from a source of strain into a force for sustainable and equitable urban development.

References

Tacoli, C., McGranahan, G., & Satterthwaite, D. (2015).ย Urbanisation, rural-urban migration and urban povertyย (Vol. 1). London: Human Settlements Group, International Institute for Environment and Development.

Bogin, B. (1988). Rural-to-urban migration.ย Biological aspects of human migration, (2), 90.

Mazumdar, D. (1987). Rural-urban migration in developing countries. Inย Handbook of regional and urban economicsย (Vol. 2, pp. 1097-1128). Elsevier.

Selod, H., & Shilpi, F. (2021). Rural-urban migration in developing countries: Lessons from the literature.ย Regional Science and Urban Economics,ย 91, 103713.

Bhattacharya, P. C. (1993). Ruralโ€“urban migration in economic development.ย Journal of economic surveys,ย 7(3), 243-281.

Sharma, S. N., & Dehalwar, K. (2023). Ethnographic Study of Equity in Planningโ€“Case of Slums of Ranchi.ย Available at SSRN 5400581.

Sharma, S. N. (2024). Role of Demography & Rahul Gandhi in Karnataka State Election Results. Track2Training.

Dehalwar, K., & Sharma, S. N. (2024). Social Injustice Inflicted by Spatial Changes in Vernacular Settings: An Analysis of Published Literature.

Lucero-Prisno, D. E., Ayuba, D., Akinga, A. Y., Olayinka, K. E., Precious, F. K., Ogaya, J. B., … & Kouwenhoven, M. B. N. (2025). Impact of climate disaster, migration and health risk on food security in Africa.ย Advances in Food Security and Sustainability.

Ogbanga, M. M., & Sharma, S. N. (2024). Climate Change and Mental Heat. EduPub. New Delhi

Kumar, G., Vyas, S., Sharma, S. N., & Dehalwar, K. (2023). Planning and Development of Housing in Urban Fringe Area: Case of Bhopal (MP).ย GIS Business,ย 18(1), 1-14.

Sharma, S. N., Chatterjee, S., & Dehalwar, K. (2023). Mahatma Gandhi National Rural Employment Guarantee Scheme: Challenges and Opportunities.ย Think India Journal,ย 26(1), 7-15.

Dehalwar, K., & Sharma, S. N. (2023). Fundamentals of Area Appreciation and Space Perceptions.

Kumar, G., Vyas, S., Sharma, S. N., & Dehalwar, K. (2025). Urban growth prediction using CA-ANN model and spatial analysis for planning policy in Indore city, India.ย GeoJournal,ย 90(3), 139.

Sharma, S. N. (2005). Evaluation of the JnNURM Programme of Government of India for Urban Renewal.ย Think India Journal,ย 8(2), 1-7.

Kumar, G., & Sharma, S. N. (2022). Evolution of Affordable Housing in India.

Sharma, S. N. (2018). Review of National Urban Policy Framework 2018.ย Think India Journal,ย 21(3), 74-81.

Dehalwar, K., & Sharma, S. N. (2023). Fundamentals of Area Appreciation and Space Perceptions A Textbook for Students of Architecture and Planning.ย Available at SSRN 5437257.

Lodhia, A. S., Jaiswalb, A., & Sharmac, S. N. (2023). An Investigation into the Recent Developments in Intelligent Transport System. Inย Proceedings of the Eastern Asia Society for Transportation Studiesย (Vol. 14).

Population Policy Document of the United Nations

The United Nations (UN) has been at the forefront of shaping global population policies since the mid-20th century. Recognizing the interlinkages between population growth, sustainable development, health, and human rights, the UN provides guidelines and frameworks through international conferences, resolutions, and agencies. The central philosophy underpinning UN population policy is that population issues must be addressed within the broader context of development, human dignity, and gender equality.

Photo by NastyaSensei on Pexels.com

2. Historical Background

  • 1945 onwards: The UN began monitoring global demographic trends through the Population Division of the Department of Economic and Social Affairs (UNDESA).
  • 1954: First World Population Conference (Rome) initiated global discourse on demographic concerns.
  • 1974 (Bucharest): World Population Plan of Action adopted โ€“ emphasized that “development is the best contraceptive.”
  • 1984 (Mexico City): Renewed focus on integrating population with development and family planning.
  • 1994 (Cairo): International Conference on Population and Development (ICPD) became a landmark, shifting the focus from population control to reproductive health, rights, and choices.

3. Key Elements of UN Population Policy Framework

The UN population policy framework is not a single fixed document, but rather a set of guiding principles consolidated through conferences, resolutions, and agency reports (especially by UNFPA โ€“ United Nations Population Fund). Its core elements include:

  1. Human Rights and Reproductive Health
    • Every individual has the right to decide freely and responsibly the number, spacing, and timing of their children.
    • Access to family planning, safe childbirth, and reproductive health services must be universal.
  2. Gender Equality and Empowerment of Women
    • Womenโ€™s education, participation in decision-making, and economic empowerment are central to population policy.
  3. Sustainable Development Linkages
    • Population issues (fertility, mortality, migration, ageing) are integrated with the 2030 Agenda for Sustainable Development (SDGs).
    • Policies emphasize balance between human numbers and available resources.
  4. Migration and Urbanization
    • Recognizes the importance of internal and international migration, urban growth, and their social, economic, and environmental implications.
  5. Ageing Population
    • Encourages states to prepare policies for ageing societies, focusing on health, social security, and intergenerational equity.
  6. Youth and Adolescents
    • Expands access to education, reproductive health, and employment opportunities to harness the demographic dividend.

4. Institutional Framework

  • United Nations Population Division (UNDESA): Provides demographic data and research.
  • UNFPA (United Nations Population Fund): Leads implementation of UN population programs, including reproductive health, family planning, and gender equality.
  • Commission on Population and Development (CPD): A functional commission of ECOSOC, reviews and monitors implementation of ICPD Programme of Action.

5. ICPD Programme of Action (1994) โ€“ A Cornerstone Document

  • Endorsed by 179 countries in Cairo.
  • Shifted focus from demographic targets (population control) to individual well-being and human rights.
  • Set goals for:
    • Universal access to reproductive health services by 2015 (later aligned with SDGs).
    • Reducing infant, child, and maternal mortality.
    • Universal primary education.
    • Closing gender gaps in education and employment.

6. Population and the SDGs

The UNโ€™s current population policy framework is deeply integrated with the Sustainable Development Goals (2015โ€“2030):

  • Goal 3: Ensure healthy lives and promote well-being (maternal and child health, reproductive health).
  • Goal 5: Achieve gender equality and empower women and girls.
  • Goal 10: Reduce inequality (including migration and mobility issues).
  • Goal 11: Make cities and human settlements inclusive and sustainable (urban population challenges).

7. Criticisms and Challenges

  • Some critics argue UN population policies are overly influenced by Western development models.
  • Implementation varies across countries due to cultural, religious, and political contexts.
  • Funding gaps, especially in reproductive health and family planning, slow progress.
  • Rising challenges such as climate change, migration crises, and global ageing require constant adaptation of the framework.

8. Conclusion

The Population Policy documents of the UN represent a dynamic framework, evolving from early concerns about โ€œpopulation controlโ€ to a rights-based approach centered on health, gender equality, and sustainable development. The ICPD Programme of Action (1994) remains the most influential milestone, guiding governments, civil society, and development partners toward a vision where population issues are integrated with human rights and sustainable futures.

Salient Features of the National Commission on Urbanisation Report (1988)

1. Recognition of Urbanization as an Opportunity

  • Urbanization was seen as an inevitable and positive force for Indiaโ€™s development.
  • Cities were identified as โ€œengines of economic growthโ€ and not just as centers of population pressure.
  • Stressed that urbanization could drive modernization, innovation, and employment.
Photo by Artem Podrez on Pexels.com

2. Spatial Strategy for Urban Development

  • Proposed a spatial reorganization of settlements to reduce over-concentration in large cities.
  • Identified a hierarchy of settlements:
    • National Priority Cities (NPUs): 329 cities strategically important for balanced development.
    • Urban Corridors: Linear clusters of cities along major transport routes (Delhiโ€“Kanpur, Mumbaiโ€“Pune, Chennaiโ€“Bangalore, etc.).
    • Emerging Growth Centers: Smaller towns to act as regional hubs to check excessive migration to metros.

3. Balanced Urban-Rural Linkages

  • Emphasized strengthening urbanโ€“rural linkages by promoting market towns and service centers.
  • Advocated for Integrated Regional Planning, treating rural and urban as complementary rather than separate.

4. Focus on Metropolitan Cities

  • Recognized the dominant role of metros like Delhi, Mumbai, Kolkata, and Chennai.
  • Called for planned management of metropolitan regions to tackle congestion, housing shortages, and infrastructure deficits.
  • Stressed regional planning authorities for metro areas.

5. Equity and Inclusivity

  • Highlighted the problems of slums, poverty, and informal sector workers in cities.
  • Urged policies for affordable housing, slum improvement, and social infrastructure.
  • Stressed inclusive urbanization to prevent widening social inequalities.

6. Institutional and Administrative Reforms

  • Recommended strengthening urban local bodies (ULBs).
  • Called for decentralization of governance and greater role of municipalities in planning, finance, and service delivery.
  • Suggested capacity-building programmes for urban administrators.

7. Urban Infrastructure and Finance

  • Identified infrastructure deficit as the biggest urban challenge (housing, water supply, sanitation, transport).
  • Suggested mobilization of municipal finance through:
    • Property tax reforms.
    • User charges for services.
    • Access to capital markets (municipal bonds).
  • Advocated public-private partnerships (PPPs) in infrastructure.

8. Housing and Land Policy

  • Suggested removal of artificial constraints like the Urban Land Ceiling and Regulation Act (ULCRA).
  • Called for land-use planning reforms to ensure adequate land supply for housing.
  • Focus on low-cost housing and upgradation of existing slums rather than eviction.

9. Transport and Mobility

  • Stressed the importance of urban transport systems (mass transit, bus services, non-motorized transport).
  • Recommended integrated transport planning at regional level.

10. Environmental Concerns

  • Highlighted the dangers of unchecked urban expansion on ecology.
  • Stressed protection of water bodies, green spaces, and urban environment.
  • Called for sustainable waste management and pollution control measures.

Significance of the NCU Report

  • First comprehensive national-level urban policy framework.
  • Influenced later programmes: 74th Constitutional Amendment (1992), IDSMT scheme expansion, and eventually JNNURM (2005).
  • Shifted thinking from seeing urbanization as a problem to recognizing it as a driver of growth.

โœ… In summary:
The NCU Report emphasized balanced spatial development, strengthening smaller towns, empowering urban local bodies, inclusive housing policies, and sustainable infrastructure financing. It remains one of the most important reference points for Indiaโ€™s urban policy.

Urbanization in India through Five-Year Plans

Urbanization has been a gradually evolving focus in Indiaโ€™s Five-Year Plans. While early plans emphasized rural development, later ones began recognizing cities as engines of growth.

Photo by Sofiia Asmi on Pexels.com

1. First to Third Five-Year Plans (1951โ€“66)

  • Focus: Agriculture, community development, rural growth.
  • Urbanization received minimal attention, mainly in the form of housing schemes (e.g., Housing Boards).
  • Third Plan (1961โ€“66): First recognition of urban problems like housing shortages, slums, and basic amenities.

2. Fourth and Fifth Plans (1969โ€“79)

  • Acknowledged rapid urban growth and need for urban infrastructure investment.
  • Beginning of metropolitan planning (focus on Bombay, Delhi, Calcutta, Madras).
  • Housing, transport, and slum improvement were addressed in fragmented manner.

3. Sixth Plan (1980โ€“85)

  • Urbanization seen as unavoidable in the development process.
  • Proposed integrated urban development, strengthening small and medium towns.
  • Introduction of Integrated Development of Small and Medium Towns (IDSMT) Scheme (1980).

4. Seventh Plan (1985โ€“90)

  • National Commission on Urbanisation (NCU), 1986 was a milestone.
  • NCU stressed:
    • Strengthening urbanโ€“rural linkages.
    • Promoting growth centers.
    • Avoiding over-concentration in metros.
  • Recommendations influenced later programmes.

5. Eighth and Ninth Plans (1992โ€“2002)

  • Post-liberalization era โ†’ urbanization seen as key for economic growth.
  • Urban Land Ceiling Act (ULCRA) repealed (1999) to improve land supply.
  • Emphasis on private sector participation in housing and infrastructure.

6. Tenth Plan (2002โ€“07)

  • Explicit focus on urban governance and service delivery.
  • Stressed 74th Constitutional Amendment implementation.
  • Recommended reforms in municipal finance, user charges, and capacity-building.

7. Eleventh Plan (2007โ€“12)

  • Marked a paradigm shift โ†’ saw urbanization as a positive force.
  • Introduced Jawaharlal Nehru National Urban Renewal Mission (JNNURM, 2005).
    • Largest urban reform programme (infrastructure, housing, e-governance).
    • Stressed reforms-based funding (property tax, rent control, ULB empowerment).
  • Focus on inclusive cities and urban poor (BSUP โ€“ Basic Services to the Urban Poor).

8. Twelfth Plan (2012โ€“17)

  • Recognized that urban areas contribute >60% of GDP.
  • Called for โ€œfaster, more inclusive and sustainable growthโ€ in urbanization.
  • Proposed urban transport, housing, water, sanitation, governance reforms.
  • Suggested new urban policy framework but it did not fully materialize.

Latest Attempts at Urbanization Policy in India

Even though India does not yet have a formal, comprehensive National Urban Policy, multiple initiatives post-2014 act as de facto frameworks:


1. Smart Cities Mission (2015โ€“present)

  • Develop 100 smart cities with ICT-enabled governance, efficient mobility, sustainable environment, and quality of life.
  • Focus on area-based development + pan-city solutions.

2. AMRUT (Atal Mission for Rejuvenation and Urban Transformation, 2015)

  • Focus on basic services (water supply, sewerage, drainage, green spaces).
  • Covers 500 cities โ†’ more inclusive than Smart Cities Mission.

3. PMAYโ€“Urban (Pradhan Mantri Awas Yojana, 2015)

  • Housing for All by 2022 (now extended).
  • Addresses housing shortages for the urban poor, EWS, LIG, and MIG groups.

4. HRIDAY (Heritage City Development and Augmentation Yojana, 2015)

  • Focused on heritage conservation + urban infrastructure in historic cities.

5. National Urban Transport Policy (2006, revised efforts ongoing)

  • Prioritizes public transport and non-motorized transport.

6. Draft National Urban Policy Framework (NUPF, 2018)

  • Released by MoHUA & NITI Aayog.
  • Suggested a โ€œ10-pillar frameworkโ€ for cities:
    • Integrated spatial planning, mobility, housing, environment, inclusivity, local governance, municipal finance, technology.
  • Aims to provide strategic direction for future policies.

Summary

PeriodUrbanization Policy Highlights
1950sโ€“70sRural bias, limited urban focus, start of metropolitan planning
1980sRecognition of urban challenges, IDSMT scheme, NCU report (1986)
1990sLiberalization, urban reforms, private participation
2000sJNNURM, governance reforms, slum improvement
2010sInclusive, sustainable urbanization; Smart Cities, AMRUT, PMAY
LatestNUPF 2018 (draft), multi-mission approach instead of single national policy

โœ… In essence:
Urbanization policy in India evolved from a rural-centered planning era to recognizing cities as growth engines. The latest attempts (Smart Cities, AMRUT, PMAY, NUPF) show a multi-pronged, mission-driven approach rather than a single national policy document.

Settlement System and Related Concepts

1. Settlement System

Photo by Miki Czetti on Pexels.com

A settlement system refers to the organized pattern of distribution, size, functions, and relationships among human settlements (villages, towns, cities, metropolises) within a region or country.

  • Settlements are arranged in a hierarchical order:
    • Hamlets โ†’ Villages โ†’ Small Towns โ†’ Medium Towns โ†’ Cities โ†’ Metropolises โ†’ Megacities โ†’ Megalopolis
  • The system reflects:
    • Spatial linkages (ruralโ€“urban interaction)
    • Functional linkages (administrative, economic, cultural)
    • Dependency relationships (villages depending on towns, towns on cities, etc.)

2. Census Classification of Settlements (India)

(a) Rural Settlements

  • All places that do not qualify as urban under Census criteria.
  • Usually depend on agriculture and allied activities.

(b) Urban Settlements

As per Census of India:

  1. Statutory Towns: Places with a municipality, corporation, cantonment board, or notified area committee.
  2. Census Towns: Places meeting all 3 conditions:
    • Minimum population of 5,000
    • At least 75% of male workers in non-agricultural pursuits
    • Population density of 400 persons/sq. km or more

(c) Categories of Urban Settlements by Population Size (Census 2011):

  • Class I: 100,000 and above
  • Class II: 50,000 โ€“ 99,999
  • Class III: 20,000 โ€“ 49,999
  • Class IV: 10,000 โ€“ 19,999
  • Class V: 5,000 โ€“ 9,999
  • Class VI: less than 5,000

3. Primate City

  • A primate city is the largest city in a country or region, which is disproportionately larger than the second-largest city and dominates political, economic, and cultural life.
  • Term popularized by Mark Jefferson (1939).
  • Characteristics:
    • Much larger than next-ranking cities
    • Concentrates national functions (administration, trade, education, culture)
    • Often the capital city
  • Examples:
    • India: Delhi (political primacy), Mumbai (economic primacy)
    • France: Paris dominates over all other French cities

4. Rankโ€“Size Rule

  • Proposed by G.K. Zipf (1949).
  • States that:
    • โ€œThe population of a city is inversely proportional to its rank in the hierarchy.โ€
    • The 2nd largest city will have ยฝ the population of the largest,
    • The 3rd largest city will have โ…“, and so on.
  • Indicates a balanced urban system (as opposed to primate city dominance).
  • In India, the rank-size distribution is distorted by primacy of Delhi and Mumbai.

5. Urbanization

  • Definition: The process by which a growing proportion of a countryโ€™s population comes to live in towns and cities.
  • Measured by the percentage of urban population in total population.
  • Urbanization in India (Census data):
    • 1951 โ†’ 17.3%
    • 2001 โ†’ 27.8%
    • 2011 โ†’ 31.2%
    • Projected 2036 โ†’ ~40%
  • Drivers in India:
    • Industrialization
    • Migration (pushโ€“pull factors)
    • Economic opportunities in services/IT
    • Government policies (Smart Cities, AMRUT)

6. Industrialization

  • Industrialization refers to the shift from agrarian to industrial economy, concentrating industries in certain towns and cities.
  • Impact on urbanization:
    • Creation of industrial towns: Jamshedpur, Rourkela, Bhilai, Durgapur.
    • Growth of employment and in-migration โ†’ urban expansion.
    • Emergence of slums due to mismatch between population growth and infrastructure.
  • Industrialization has been the key driver of urban growth globally and in India (especially post-independence).

7. Urban Development

  • Urban development is a broader concept than urbanization. It refers not only to the growth of towns and cities but also to the improvement of infrastructure, services, quality of life, and sustainability.
  • In India:
    • Planned cities: Chandigarh, Gandhinagar, Bhubaneswar.
    • Urban missions:
      • JNNURM (2005) โ†’ modernization of infrastructure
      • Smart Cities Mission (2015) โ†’ sustainable, tech-enabled development
      • PMAY โ†’ housing for all
      • AMRUT โ†’ water supply, sanitation, green spaces
  • Focus today is on sustainable urban development balancing economy, society, and environment.

8. Summary Diagram (Conceptual)

Settlement System Hierarchy:

Hamlet โ†’ Village โ†’ Small Town โ†’ Medium Town โ†’ City โ†’ Metropolis โ†’ Megacity โ†’ Megalopolis

  • Primate City: One dominates the system.
  • Rank-Size Rule: Balanced distribution of city sizes.
  • Urbanization: % of population in cities.
  • Industrialization: Economic driver of urban growth.
  • Urban Development: Planned, sustainable improvement of cities.

โœ… This set of concepts ties together the structure, classification, and dynamics of urban settlements in India and globally.

Role of Urban Areas as Settlements

Urban areas are more than just concentrations of population โ€“ they are settlements that perform multiple functions in the economic, social, cultural, and political life of a region. They act as nodes of development, centers of innovation, and focal points for human activities, linking local, regional, and global networks.

Photo by Tom Fisk on Pexels.com

1. Economic Role

Urban areas are engines of economic growth and provide opportunities beyond subsistence agriculture.

  • Industrial Production: Cities like Jamshedpur, Bhilai, and Surat function as hubs of steel, textiles, and diamond industries.
  • Trade and Commerce: Cities serve as marketplaces for agricultural produce, manufactured goods, and services (e.g., Mumbai as a financial capital, Delhi as a wholesale trade hub).
  • Service Economy: IT, banking, education, tourism, and healthcare thrive in urban centers (e.g., Bengaluru and Hyderabad as IT hubs).
  • Employment Opportunities: Cities attract rural migrants seeking jobs in industries, construction, transport, and services.

2. Social and Cultural Role

Urban settlements shape social structures, cultural life, and community interactions.

  • Centers of Learning: Universities and institutions located in cities (Delhi, Pune, Varanasi, Aligarh) make them knowledge hubs.
  • Cultural Exchange: Cities are melting pots of different communities, languages, and traditions (e.g., Mumbai, Kolkata).
  • Innovation and Modernization: Urban life fosters exposure to new ideas, lifestyles, gender roles, and progressive values.
  • Religious and Cultural Functions: Many cities like Varanasi, Haridwar, Amritsar, and Tirupati are pilgrimage and cultural centers.

3. Political and Administrative Role

Cities often function as seats of governance and administration.

  • National and State Capitals: New Delhi (national capital), Gandhinagar, Bhopal, Lucknow act as political-administrative centers.
  • Decision-Making Hubs: Government offices, courts, and political institutions are concentrated in cities.
  • Urban Local Governance: Cities have municipal corporations and urban local bodies for local administration, reflecting democratic decentralization.

4. Functional and Infrastructural Role

Urban areas are equipped with infrastructure and services that support both residents and surrounding rural populations.

  • Transport Nodes: Cities act as hubs of road, rail, air, and port connectivity (Nagpur as a transport hub, Mumbai as a port city).
  • Healthcare and Education: Hospitals, universities, and research centers in cities serve both urban and rural populations.
  • Markets and Supply Chains: Urban markets provide access to goods and services for nearby villages.

5. Environmental and Spatial Role

Urban settlements shape land use and interact with their environment.

  • Urbanโ€“Rural Linkages: Cities depend on rural areas for food, water, labor, and raw materials, while rural areas rely on cities for manufactured goods and services.
  • Spatial Hierarchy of Settlements: Urban areas form the upper nodes in the settlement hierarchy (village โ†’ town โ†’ city โ†’ metropolis โ†’ megalopolis).
  • Peri-Urban Expansion: The growth of suburbs and peri-urban areas blurs the ruralโ€“urban divide (e.g., Gurgaon near Delhi, Navi Mumbai near Mumbai).

6. Global Role

Some Indian cities have become globally significant.

  • Global Cities: Mumbai, Delhi, Bangalore, and Hyderabad are integrated into global finance, trade, IT, and culture.
  • Tourism and International Relations: Cities like Agra (Taj Mahal) and Jaipur (heritage) attract global tourism.
  • Diaspora and Connectivity: Cities are bases of international migration and cultural linkages.

7. Conclusion

Urban areas as settlements serve as multifunctional hubsโ€”economic engines, cultural melting pots, administrative centers, and nodes of connectivity. They not only provide services and opportunities to their residents but also sustain and transform surrounding rural regions. Thus, urban settlements are critical in shaping regional development, social change, and national growth.

Census Definition of Urban Places in India & Functional Classification of Urban Centres

Urban settlements in India are officially classified by the Census of India using population size, density, and occupational structure. Beyond this, concepts like metropolis, megalopolis, and functional classification are used in urban studies.

Photo by Laurens den Besten on Pexels.com

1. Census Definition of Urban Places (India)

According to the Census of India, an area is classified as urban if it meets the following:

  • Statutory Towns:
    All places with a municipality, corporation, cantonment board, or notified town area committee, irrespective of size.
  • Census Towns:
    Places fulfilling all three conditions:
    1. Population of at least 5,000
    2. 75% of male working population engaged in non-agricultural pursuits
    3. Population density of at least 400 persons per sq. km

2. Categories of Urban Places (Census & Urban Studies)

(a) Town

  • Smallest statutory or census urban unit.
  • Population range: 5,000 โ€“ 1,00,000 (approx.).

(b) City

  • Larger than a town.
  • Population of 1,00,000 and above.

(c) Town Groups / Urban Agglomeration (UA)

  • A continuous urban spread consisting of:
    • A statutory town and its adjoining outgrowths (OGs), or
    • Two or more physically contiguous towns, with or without outgrowths.
  • Example: Greater Mumbai UA, Delhi UA, Kolkata UA.

(d) Standard Urban Area (SUA) (introduced in Census 1971, later dropped)

  • Meant to represent the functional region of a city.
  • Composed of a core city + surrounding urban and rural areas linked to it socio-economically.

(e) Metropolis

  • Urban settlement with a population over 1 million (10 lakh).
  • Examples: Ahmedabad, Hyderabad, Pune, Lucknow.

(f) Mega City

  • As per Census of India: Cities with population over 10 million (1 crore).
  • Examples: Mumbai, Delhi, Kolkata, Bangalore, Chennai.

(g) Megalopolis (concept from Jean Gottmann, 1961)

  • A huge urban region formed by the merging of several metropolitan areas into a continuous urban corridor.
  • Example (India): Delhiโ€“Meerutโ€“Ghaziabadโ€“Faridabadโ€“Gurgaon urban belt (NCR); also Mumbaiโ€“Pune corridor.

3. Functional Classification of Urban Places

Urban settlements are not only defined by size but also by their functions. Functional classification groups cities based on their dominant economic and social roles.

Major Functional Categories:

  1. Administrative Towns
    • Perform political/administrative functions.
    • Examples: New Delhi (national capital), Gandhinagar, Chandigarh, Bhubaneswar.
  2. Industrial Towns
    • Dominated by manufacturing and industries.
    • Examples: Jamshedpur (steel), Bhilai, Durgapur, Rourkela, Kanpur (textiles).
  3. Commercial Towns
    • Specialize in trade, markets, banking, transport.
    • Examples: Mumbai (finance, trade), Ahmedabad, Kolkata.
  4. Transport Towns
    • Grow at nodal points of rail, road, air, or waterways.
    • Examples: Itarsi, Katni (rail junctions), Kandla (port), Nagpur (roadโ€“rail hub).
  5. Cultural/Religious Towns
    • Centers of pilgrimage, heritage, or cultural activity.
    • Examples: Varanasi, Haridwar, Tirupati, Amritsar.
  6. Educational Towns
    • Developed around universities and academic institutions.
    • Examples: Varanasi (BHU), Aligarh (AMU), Pune, Kota.
  7. Mining Towns
    • Developed near mineral resource sites.
    • Examples: Dhanbad (coal), Singrauli, Jharia.
  8. Tourist Towns
    • Rely on tourism as the main economic activity.
    • Examples: Agra (Taj Mahal), Jaipur, Udaipur, Shimla, Goa.
  9. Multi-functional Metropolitan Cities
    • Large urban centres with mixed functions: administrative, commercial, industrial, cultural.
    • Examples: Mumbai, Delhi, Bangalore, Chennai, Kolkata.

4. Conclusion

The Census of India provides a statistical and legal definition of urban places, ranging from towns to megacities, while urban geographers extend the concept to megalopolises and functional types. Together, these classifications help us understand the size, spread, and role of urban settlements in Indiaโ€™s socio-economic system.

Urban Centres, Ruralโ€“Urban Continuum, and Dichotomy

1. Definition of Urban Centres

Photo by Ana Hidalgo Burgos on Pexels.com

An urban centre is a human settlement that has distinct characteristics compared to rural settlements, primarily in terms of population size, density, occupational structure, infrastructure, and functions.

  • In India, the Census of India defines an urban area based on two criteria:
    1. Statutory towns: All places with a municipality, corporation, cantonment board, or notified town area committee.
    2. Census towns: Places that satisfy the following conditions:
      • Minimum population of 5,000
      • At least 75% of male working population engaged in non-agricultural activities
      • Population density of at least 400 persons per sq. km

Thus, urban centres are places that act as nodes of administration, trade, industry, commerce, and services, and often serve as focal points for surrounding rural areas.


2. Concept of Ruralโ€“Urban Continuum

The ruralโ€“urban continuum suggests that rural and urban areas are not strictly separate categories but exist along a spectrum, with many intermediate forms of settlement in between.

  • Continuum implies:
    • A gradual transition from purely rural villages โ†’ semi-rural/small towns โ†’ medium towns โ†’ metropolitan cities.
    • Settlements share overlapping characteristics rather than being sharply distinct.
  • Examples in India:
    • Urban villages on the periphery of Delhi, Gurgaon, or Bangalore where traditional agrarian life coexists with urban services and real estate development.
    • Small market towns that act as service centers for surrounding rural populations.
  • Implication:
    The continuum reflects functional interdependence:
    • Rural areas supply food, raw materials, and labor.
    • Urban areas provide markets, education, healthcare, jobs, and modern amenities.

3. Concept of Ruralโ€“Urban Dichotomy

The ruralโ€“urban dichotomy is the traditional view that rural and urban settlements are fundamentally different and separate in terms of structure, function, and way of life.

  • Rural areas:
    • Agriculture-based economy
    • Low population density
    • Close-knit social relations, traditional lifestyles
    • Limited infrastructure and services
  • Urban areas:
    • Industry, trade, services-based economy
    • High population density
    • Individualistic lifestyles, cosmopolitan culture
    • Advanced infrastructure and services (transport, education, healthcare, housing)
  • Dichotomy Perspective:
    This view assumes a sharp boundary between rural and urban societies, often highlighting contrasts in occupation, social structure, values, and governance.

4. Ruralโ€“Urban Continuum vs. Dichotomy

AspectRuralโ€“Urban DichotomyRuralโ€“Urban Continuum
Nature of distinctionSharp, clear separation between rural and urbanGradual transition, blurred boundaries
Settlement typesOnly rural or urbanIntermediate forms: urban villages, peri-urban towns
FunctionsRural = agriculture; Urban = industry, servicesOverlap of functions (e.g., villages with IT hubs, towns with agriculture markets)
Indian contextTraditional sociological viewMore realistic in todayโ€™s urbanizing India

5. Conclusion

  • Urban centres are hubs of population, economic activity, and services defined by statutory and census criteria.
  • The ruralโ€“urban dichotomy represents a simplistic division, useful for classification but less accurate in practice.
  • The ruralโ€“urban continuum better reflects the reality of Indiaโ€™s settlement pattern, where villages, towns, and cities are interconnected and often share mixed characteristics.

Post-Independence Urbanization in India

Urbanization in India after 1947 has been shaped by the countryโ€™s political independence, economic policies, industrialization, demographic growth, and globalization. Unlike the colonial period, where cities were primarily built to serve imperial interests, post-independence urbanization aimed at nation-building, industrial development, and modernization. However, this process has been uneven and continues to face challenges of sustainability, inclusivity, and infrastructure.

Photo by Ananya Mandial on Pexels.com

1. Immediate Post-Independence Phase (1947โ€“1960s): Nation-Building and Planned Cities

  • Partition and Refugee Settlements:
    • Independence in 1947 led to large-scale migration due to Partition. Millions moved across borders, especially into Delhi, Punjab, and West Bengal, creating immediate housing and infrastructure pressures.
    • Refugee colonies in Delhi and resettlement areas around Kolkata, Ludhiana, and Amritsar grew rapidly.
  • Planned Capitals and Administrative Cities:
    • Chandigarh (Punjab/Haryana) designed by Le Corbusier became the first modern planned city.
    • Other state capitals like Bhubaneswar, Gandhinagar, and Dispur were developed as administrative hubs.
  • Industrial Townships:
    • The governmentโ€™s focus on heavy industries and public sector undertakings (PSUs) led to the creation of industrial cities such as Bhilai, Rourkela, Durgapur, Bokaro, and Neyveli.
    • These were designed as self-sufficient townships with housing, schools, and amenities.
  • Urban Planning Approach:
    • The government emphasized centralized planning through Five-Year Plans.
    • Urban growth was seen as a byproduct of industrialization, not a sector needing separate focus.

2. Urban Expansion and Migration (1970sโ€“1980s)

  • Rural-to-Urban Migration:
    • Rising employment opportunities in cities attracted migrants from villages, accelerating urban growth.
    • Cities like Mumbai, Delhi, Bangalore, and Hyderabad grew rapidly, often beyond their infrastructural capacity.
  • Growth of Slums and Informal Settlements:
    • Migrants, unable to find affordable housing, settled in informal settlements and slums (e.g., Dharavi in Mumbai, Yamuna Pushta in Delhi).
    • This marked the beginning of urban poverty as a significant challenge.
  • Metropolitan Dominance:
    • Mumbai, Delhi, Kolkata, and Chennai became primarily metropolitan centers for commerce, politics, and industry.
    • Uneven urbanization emerged as smaller towns and intermediate cities grew at slower rates.
  • Transport and Infrastructure:
    • Expansion of road and rail networks further integrated urban centers with surrounding rural areas.

3. Economic Liberalization and Globalization (1991โ€“2000s)

  • Impact of 1991 Economic Reforms:
    • The liberalization of the Indian economy brought foreign investment, IT industries, and global integration.
    • Cities like Bangalore, Hyderabad, Pune, Gurgaon, and Noida became hubs of IT and service industries.
  • Urban Transformation:
    • Rapid construction of office complexes, tech parks, and gated residential colonies.
    • Growth of Special Economic Zones (SEZs) to promote exports and industries.
  • Emergence of New Urban Middle Class:
    • Rising employment in IT and services gave rise to a new urban middle class, transforming consumption patterns, housing demand, and lifestyles.
  • Urban-Rural Divide:
    • Liberalization widened disparities between metropolitan/global cities and smaller towns.

4. Contemporary Urbanization (2000s โ€“ Present)

  • Megacities and Metropolitan Regions:
    • Delhi, Mumbai, Kolkata, Bangalore, and Chennai have become megacities with populations over 10 million.
    • Urban sprawl has created vast metropolitan regions, extending urban influence into peri-urban and rural areas.
  • Urban Programs and Policy Initiatives:
    • Jawaharlal Nehru National Urban Renewal Mission (JNNURM, 2005โ€“2014): Focused on infrastructure, housing, and governance reforms.
    • Smart Cities Mission (2015โ€“present): Developing 100 cities with modern infrastructure, digital services, and sustainable planning.
    • AMRUT (Atal Mission for Rejuvenation and Urban Transformation): Focus on water supply, sanitation, and green spaces.
    • PMAY (Pradhan Mantri Awas Yojana): Housing for all initiative.
  • Infrastructure Growth:
    • Metro rail systems in Delhi, Bangalore, Kolkata, Chennai, and Mumbai.
    • Expressways, airports, and logistics hubs modernizing urban connectivity.
  • Challenges:
    • Overcrowding and congestion in metropolitan areas.
    • Urban poverty and informal sector dependence.
    • Environmental degradation: air pollution, waste management, and loss of green spaces.
    • Inequality: Coexistence of luxury malls and gated communities with slums.
    • Climate change vulnerability: Floods, heatwaves, and water scarcity affecting cities.

5. Conclusion

Post-independence urbanization in India reflects the countryโ€™s transition from a planned economy to a globalized one. While cities have become engines of growth, centers of innovation, and cultural exchange, they also struggle with congestion, inequality, and sustainability. The challenge ahead lies in promoting balanced urbanization by strengthening small and medium towns, while making large cities more inclusive, resilient, and environmentally sustainable.

Urbanization in India: A Brief History

Urbanization in India is a long and complex process shaped by geography, culture, politics, and economics. It reflects the evolution of Indian society from ancient times to the modern era. Unlike many other parts of the world, Indiaโ€™s urban tradition is among the oldest, yet it has also faced unique challenges of population growth, colonial legacy, and rapid post-independence transformations.

Photo by Navneet Shanu on Pexels.com

1. Ancient Urbanization (c. 2500 BCE โ€“ 600 BCE)

  • Indus Valley Civilization (Harappa and Mohenjo-Daro):
    The earliest evidence of urbanization in India dates back to the Indus Valley Civilization (2500โ€“1500 BCE). Cities like Harappa, Mohenjo-Daro, Dholavira, and Lothal were highly organized with grid-planned streets, advanced drainage systems, public baths, warehouses, and marketplaces. These features illustrate a sophisticated urban culture that emphasized trade, administration, and community life.
  • Decline:
    Around 1500 BCE, these urban centers declined due to ecological changes, river shifts, and external pressures. The following period saw the growth of rural and agrarian settlements with limited urban activity.

2. Early Historic Period (600 BCE โ€“ 600 CE)

  • Second Urbanization (600 BCE onwards):
    Around the 6th century BCE, urban centers re-emerged, largely due to agricultural surplus, trade, and the rise of states (Mahajanapadas). Cities like Pataliputra, Varanasi, Ujjain, Taxila, and Rajgir flourished as centers of administration, trade, and learning.
  • Mauryan and Gupta Periods:
    Under the Mauryan Empire (4thโ€“2nd century BCE), Pataliputra became one of the worldโ€™s largest cities. The Gupta period (4thโ€“6th century CE) saw prosperity and cultural development in cities such as Ujjain and Nalanda, which also became hubs of education and Buddhism.

3. Medieval Urbanization (7th โ€“ 16th Century CE)

  • Rise of Temple and Trade Towns:
    With the growth of kingdoms in South India (Chola, Pandya, Vijayanagara), temple towns such as Madurai, Thanjavur, and Kanchipuram became urban centers. Trade with Southeast Asia also expanded urban development in port cities like Calicut, Surat, and Masulipatnam.
  • Delhi Sultanate and Mughal Period:
    Northern India saw significant urban expansion under the Delhi Sultanate (13thโ€“15th century CE) and later the Mughal Empire (16thโ€“18th century CE). Cities such as Delhi, Agra, Fatehpur Sikri, Lahore, and Shahjahanabad (Old Delhi) grew as centers of governance, culture, and economy. Mughal cities often had planned bazaars, gardens, mosques, and fortifications.

4. Colonial Urbanization (18th โ€“ mid-20th Century)

  • British East India Company & Colonial Rule:
    Colonialism reshaped Indiaโ€™s urban landscape drastically. The British developed three Presidency townsโ€”Bombay (Mumbai), Calcutta (Kolkata), and Madras (Chennai)โ€”as administrative, military, and trading hubs.
  • Industrial and Port Cities:
    Industrialization, especially textile mills in Bombay and jute mills in Calcutta, spurred migration and rapid urban growth. Port cities expanded due to international trade.
  • Dual Urbanism:
    Colonial towns often had a โ€œWhite Townโ€ (European quarters with planned housing and infrastructure) and a โ€œBlack Townโ€ (densely populated Indian settlements with poor amenities).
  • Railways and Urban Expansion:
    The introduction of railways in the mid-19th century further connected and stimulated the growth of towns such as Kanpur, Nagpur, Lucknow, and Pune.

5. Post-Independence Urbanization (1947 โ€“ 1991)

  • Planned Cities:
    After independence, India focused on planned urban development. Cities like Chandigarh, Bhubaneswar, and Gandhinagar were designed as administrative capitals.
  • Industrial Townships:
    Industrial development led to the growth of cities like Bhilai, Rourkela, Durgapur, and Bokaro, which were built around steel plants and public sector industries.
  • Urban Migration:
    Large-scale rural-to-urban migration occurred due to employment opportunities, leading to rapid expansion of metropolitan centers such as Delhi, Mumbai, Bangalore, and Hyderabad. However, this also resulted in slums and housing shortages.

6. Liberalization and Contemporary Urbanization (1991 โ€“ Present)

  • Economic Reforms of 1991:
    Liberalization and globalization transformed Indian cities. Information Technology (IT) hubs like Bangalore, Hyderabad, Pune, and Gurgaon emerged as global economic centers.
  • Mega-Cities and Urban Sprawl:
    Cities such as Mumbai, Delhi, Kolkata, and Chennai grew into megacities, with populations exceeding 10 million. Urban sprawl extended into suburban regions.
  • Smart Cities Mission and Infrastructure:
    In recent years, government initiatives like the Smart Cities Mission, AMRUT, and Metro Rail Projects have attempted to modernize urban infrastructure and improve governance.
  • Challenges:
    Despite growth, Indian cities face problems like congestion, air pollution, informal housing (slums), inadequate public transport, and inequalities in access to services.

7. Conclusion

The history of urbanization in India reflects a continuous interaction between tradition and modernity, local needs and global forces, and rural-urban linkages. From the well-planned cities of Harappa to todayโ€™s sprawling metropolises, Indian urbanization has always been diverse and dynamic. However, the future of Indian cities will depend on how effectively issues of sustainability, inclusivity, and infrastructure are addressed in the coming decades.

Cohort Survival Model

The Cohort Survival Model (also called the Cohort-Component Method) is the most widely used method for population projections. It projects the future size and composition of a population by following age-sex groups (cohorts) through time and applying assumptions about fertility, mortality, and migration.

Photo by Amina Bawa on Pexels.com

Steps in the Cohort Survival Model

  1. Divide the population by age and sex (e.g., 0โ€“4, 5โ€“9, 10โ€“14, โ€ฆ).
  2. Apply survival ratios (Sx) to each cohort, based on mortality rates (from life tables), to estimate how many survive to the next age group.
    • Example: If 100,000 children aged 0โ€“4 have a survival ratio of 0.95, then 95,000 will survive to the 5โ€“9 group.
  3. Add new births by applying age-specific fertility rates (ASFRs) to women of reproductive ages (15โ€“49). These births form the new 0โ€“4 age cohort.
  4. Adjust for migration (in-migration and out-migration) if applicable.
  5. Repeat the process for each projection interval (usually 5 or 10 years).

Example (Simplified)

  • Population in 2011: 1,00,000 children in age group 0โ€“4.
  • Survival ratio from 0โ€“4 โ†’ 5โ€“9 = 0.95.
  • Projected survivors in 2016 (age 5โ€“9) = 95,000.

Inter-Regional Cohort Survival Model

Definition

The Inter-Regional Cohort Survival Model is an extension of the cohort survival model that incorporates migration between regions. Instead of treating the population as a whole, it simultaneously projects multiple regions and distributes people across them according to migration flows.


Steps in Inter-Regional Model

  1. Divide the population by age, sex, and region (e.g., Region A, Region B, Region C).
  2. Apply survival ratios (mortality) within each region.
  3. Estimate migration flows between regions using a migration matrix:
    • Shows how many people of each age/sex group move from one region to another.
    • Example: 5% of 20โ€“24-year-olds in Region A migrate to Region B in the next 5 years.
  4. Add fertility contributions (births) in each region, based on the number of women and regional fertility rates.
  5. Sum up to obtain future age-sex-region-specific population.

Uses

  • Cohort Survival Model: National population projections (fertility, mortality, migration considered as aggregates).
  • Inter-Regional Model: Regional/urban planning, migration studies, distribution of schools, hospitals, housing, transport needs.

Key Difference

FeatureCohort Survival ModelInter-Regional Cohort Survival Model
ScopeEntire population (national level)Multiple regions simultaneously
Migration TreatmentNet migration added/subtractedExplicit inter-regional flows (originโ€“destination matrix)
UsefulnessNational projectionsRegional/urban planning, migration analysis

Conclusion

  • The Cohort Survival Model is the foundation of demographic projection, focusing on fertility, mortality, and net migration.
  • The Inter-Regional Cohort Survival Model refines this by including detailed migration between regions, making it essential for regional planning and policy.

Population Estimation, Projection, and Forecasting

Population studies require methods to understand not only the present size and structure of a population but also its future trends. Three important concepts are estimation, projection, and forecasting. Though often used interchangeably, they differ in purpose, time frame, and assumptions.


Photo by Pavel Danilyuk on Pexels.com

1. Population Estimation

  • Definition: Measurement of the present population size and structure when actual census data are not available.
  • Purpose: Provides figures for the current time (between censuses).
  • Techniques:
    • Mathematical methods (e.g., arithmetic, geometric, exponential growth).
    • Administrative records (voter lists, birth and death registrations, school enrollments).
    • Sample surveys (household surveys for fertility, mortality, migration).
  • Example: Estimating Indiaโ€™s population in 2024 based on the 2011 Census plus registered births, deaths, and migration data.

2. Population Projection

  • Definition: A numerical picture of future population under clearly stated assumptions (about fertility, mortality, migration).
  • Purpose: Not a prediction, but a โ€œwhat ifโ€ scenario based on specified conditions.
  • Techniques:
    • Cohort-Component Method (most common): Projects age-sex groups separately by applying survival rates, fertility rates, and migration.
    • Mathematical Methods:
      • Arithmetic progression (constant increase).
      • Geometric progression (constant percentage growth).
      • Exponential growth models.
    • Stable Population Models: Assume constant fertility and mortality over time.
  • Example: UN World Population Prospects projections for 2050 (based on medium fertility assumptions).

3. Population Forecasting

  • Definition: A prediction of the most likely future population based on past trends, present data, and expert judgment.
  • Difference from Projection: While a projection shows possible outcomes under assumptions, a forecast attempts to give the most probable outcome.
  • Techniques:
    • Uses projections as a base, but incorporates expert opinion, policies, and uncertainties.
    • Involves judgmental adjustments (e.g., considering possible pandemics, wars, migration crises).
  • Example: A government forecasting the likely population in 2036 to plan schools, hospitals, and jobs.

Key Differences

AspectEstimationProjectionForecasting
Time framePresent (between censuses)Future (scenarios)Future (most likely)
BasisExisting data (surveys, registers)Assumptions of fertility, mortality, migrationProjections + expert judgment
PurposeFill gaps in current dataShow possible population outcomesPredict actual future size
CertaintyShort-term, relatively reliableHypothetical, conditionalProbabilistic, judgment-based

Conclusion

  • Estimation helps us know the present.
  • Projection provides possible futures under given assumptions.
  • Forecasting predicts the most probable future outcome.

Together, they form the backbone of population policy, planning, and resource allocation in areas such as health care, education, housing, food supply, and employment.

Life Table Techniques

A life table is a statistical tool used in demography, epidemiology, and actuarial science to summarize the mortality and survival experience of a population. It presents, for a hypothetical cohort of births, the probability of dying or surviving at each age (or age group).

Photo by RDNE Stock project on Pexels.com

Life tables are useful for calculating life expectancy, mortality risks, survival rates, and for making health, insurance, and population policy decisions.


Techniques in Preparing a Life Table

A life table is prepared in several systematic steps. The basic functions (columns) of a complete life table are:

  1. Age interval (x to x+n): Specific age or age group.
  2. lxl_xlxโ€‹: Number surviving to exact age x โ€“ number of persons alive at the start of the age interval (from a hypothetical cohort, usually starting with 100,000 births).
  3. dxd_xdxโ€‹: Number dying in age interval x to x+n โ€“ difference between survivors at beginning and end of interval.
  4. qxq_xqxโ€‹: Probability of dying in the interval x to x+n โ€“ chance that a person aged x will die before reaching
  1. pxp_xpxโ€‹: Probability of surviving โ€“ complement of
  1. LxL_xLxโ€‹: Person-years lived in interval โ€“ total years lived by the cohort between ages x and x+n.
  2. TxT_xTxโ€‹: Total person-years lived above age x โ€“ cumulative total of person-years from age x to last age.
  3. exe_xexโ€‹: Expectation of life at age x โ€“ average number of years a person aged x is expected to live.

Techniques of Life Table Construction

There are two main techniques:

1. Complete Life Table

  • Uses single-year age intervals (0, 1, 2, 3, โ€ฆ up to 85+).
  • Provides detailed mortality and survival data for each exact age.
  • Common in developed countries with reliable mortality statistics.

2. Abridged Life Table

  • Uses wider age groups (e.g., 0, 1โ€“4, 5โ€“9, 10โ€“14 โ€ฆ 70โ€“74, 75+).
  • Mortality probabilities are calculated for each age group instead of each year.
  • Easier to prepare when data are limited or sample sizes are small.
  • Widely used in developing countries where age-reporting is not precise.

Preparation of an Abridged Life Table

Steps:

  1. Start with observed mortality rates (mxm_xmxโ€‹) for each age group.
  2. Convert to probability of dying (qxq_xqxโ€‹) using formulas or standard approximations.
    • For large age groups:
  1. Assume a radix (e.g., l0=100,000l_0 = 100,000l0โ€‹=100,000) for the starting cohort.
  2. Calculate survivors (lxl_xlxโ€‹) and deaths (dxd_xdxโ€‹) across age groups.
  3. Compute person-years lived (Lxโ€‹), total person-years (Txโ€‹), and life expectancy (exโ€‹).

Example (Simplified Abridged Life Table for Illustration Only)

Age Group (x to x+n)lx (survivors)dxโ€‹ (deaths)qxโ€‹ (prob. of dying)Lx (person-years)Txโ€‹ (total yrs left)ex (life expectancy)
0100,0006,0000.0697,0006,500,00065.0 yrs
1โ€“494,0002,0000.021372,0006,403,00068.1 yrs
5โ€“992,0005000.005455,0006,031,00065.5 yrs
โ€ฆโ€ฆโ€ฆโ€ฆโ€ฆโ€ฆโ€ฆ

(Table truncated for brevity โ€” real abridged life tables extend until 80+ or 100+ years.)


Conclusion

  • Life tables are fundamental tools in demography to measure mortality, survival, and life expectancy.
  • Complete life tables use single-year intervals for precision.
  • Abridged life tables use grouped ages, making them simpler and practical where detailed data is lacking.
  • Both are essential in public health planning, actuarial science (insurance), and population studies.

Population Composition

Population composition refers to the structure of a population based on various demographic, social, and economic characteristics. It shows how a population is distributed by age, sex, marital status, literacy, religion, caste, occupation, etc. Understanding composition is vital for social planning, resource allocation, and development policies.

Photo by Airam Dato-on on Pexels.com

1. Age-Sex Structure

The most basic and important measure of population composition.

Measures of Age-Sex Structure:

  • Age Distribution: Division of population into different age groups (0โ€“14 = young, 15โ€“64 = working-age, 65+ = aged).
  • Sex Ratio: Number of females per 1,000 males (or vice versa).
  • Dependency Ratio: Ratio of dependents (0โ€“14 and 65+) to working-age population (15โ€“64).

Age-Sex Pyramid (Population Pyramid):

  • Definition: A graphical representation of age and sex composition of a population.
  • Types of Pyramids:
    • Expansive Pyramid: Broad base, high birth rate, high death rate (e.g., developing countries).
    • Constrictive Pyramid: Narrow base, low birth rate, low death rate (e.g., developed countries).
    • Stationary Pyramid: Almost equal numbers across age groups, stable population.

Uses of Age-Sex Pyramid:

  • Shows demographic trends (growth, decline, ageing).
  • Helps in forecasting labor force, education, health, and pension needs.
  • Indicates social development level.

2. Population Composition Based on Other Factors

a) Marital Status

  • Classified into never married, currently married, widowed, divorced/separated.
  • Useful for studying fertility patterns, household structure, and social norms.

b) Caste (specific to countries like India)

  • Reflects traditional social stratification.
  • Important for understanding social inequalities, political representation, and affirmative action policies.

c) Religion

  • Populations are classified by faith (e.g., Hindu, Muslim, Christian, Buddhist).
  • Religious composition affects cultural identity, festivals, marriage patterns, and political dynamics.

d) Literacy and Education Level

  • Literacy Rate = Percentage of population above a specified age (usually 7 years and above in India) who can read and write with understanding.
  • Educational attainment measured by highest level of schooling completed.
  • Key indicator of human development, employability, and social progress.

e) Economic/Occupational Composition

  • Division of population into primary (agriculture), secondary (industry), tertiary (services) sectors.
  • Shows level of economic development.

f) Rural-Urban Composition

  • Percentage of people living in rural areas vs. towns and cities.
  • Urbanization indicates modernization, industrial growth, and social mobility.

g) Language & Ethnicity

  • Shows cultural diversity and regional identities.
  • Important for policy-making, linguistic states, and cultural preservation.

Conclusion

The age-sex structure and population composition reveal not only how many people live in a region, but also who they are, how they live, and what they contribute to society. Measures like age distribution, sex ratio, and literacy rate are vital for planning in education, healthcare, employment, and social welfare. Broader aspects like marital status, caste, religion, and occupation help policymakers understand the social fabric and address inequalities.

Study of Demography: Sources of Demographic Data

Demography is the scientific study of human populations, particularly their size, composition, distribution, and changes over time. For analyzing fertility, mortality, migration, and population growth, demographers rely on demographic data, which is collected through various direct and indirect sources.

Photo by Antoni Shkraba Studio on Pexels.com

1. Population Census

  • Definition: A census is the complete enumeration of the population of a country at a specified time, usually every 10 years.
  • Data Collected: Age, sex, marital status, education, occupation, language, religion, place of birth, migration details, etc.
  • Advantages:
    • Covers entire population.
    • Provides comprehensive demographic, social, and economic data.
  • Limitations:
    • Conducted at long intervals (decadal in most countries).
    • Expensive and time-consuming.
    • May contain inaccuracies in remote or conflict areas.

2. Vital Registration System (Civil Registration System โ€“ CRS)

  • Definition: Continuous recording of vital events such as births, deaths, marriages, and divorces by government authorities.
  • Advantages:
    • Provides continuous, up-to-date data.
    • Useful for calculating fertility, mortality, and natural growth rates.
  • Limitations:
    • In many developing countries, registration is incomplete or inaccurate.
    • Often excludes rural or remote populations.

3. Sample Surveys

  • Definition: Surveys conducted on a representative sample of the population to collect detailed demographic, social, and economic data.
  • Examples:
    • National Sample Surveys
    • Demographic and Health Surveys (DHS)
    • Labor Force Surveys
  • Advantages:
    • Less costly and quicker than a census.
    • Provides detailed information (fertility, mortality, migration, health, employment).
  • Limitations:
    • Based on samples, not full population.
    • Subject to sampling errors and biases.

4. Population Registers

  • Definition: A continuous system that records demographic events for each individual (e.g., births, deaths, migration) and maintains personal records.
  • Examples: Scandinavian countries maintain detailed registers.
  • Advantages:
    • Highly accurate and up-to-date.
    • Useful for long-term demographic analysis.
  • Limitations:
    • Requires strong administrative capacity.
    • Not common in developing countries.

5. Other Administrative Records

  • Sources: School records, tax records, voter lists, health records, border control/immigration data, social security records.
  • Use: Provide indirect but useful information on population size, distribution, and movement.
  • Limitations: Often incomplete and not standardized for demographic use.

6. Special Studies & Research

  • Academic or government-led studies on fertility, mortality, migration, or urbanization.
  • Usually targeted, in-depth, and limited in scope.

Conclusion

The study of demography depends on a combination of primary sources (census, vital registration, surveys, population registers) and secondary sources (administrative records, special studies). Each has its strengths and weaknesses, but together they provide a comprehensive picture of population dynamics. Accurate demographic data is essential for planning development policies, health care, education, housing, and employment.

Effect of Migration on the Composition of Population

Migration does not only change the size of a population but also alters its composition in terms of age, sex, education, occupation, and cultural characteristics. These demographic shifts influence both the place of origin and the place of destination.

Photo by Luna Andrade Arango on Pexels.com

1. Age Composition

  • Migrants are usually young adults in the 15โ€“35 age group, since they are the most mobile section of the population.
  • Origin: Loss of young people leads to an ageing population in rural or underdeveloped areas.
  • Destination: Influx of youth increases the proportion of working-age population, boosting the labor force.

2. Sex Composition

  • Migration often shows a gender imbalance, depending on its type:
    • Male-dominated migration: Labor migration (construction, industries, international jobs in Gulf countries).
    • Female-dominated migration: Often linked to marriage or domestic work.
  • This alters the sex ratio:
    • Origin: Male out-migration increases the proportion of females in rural areas.
    • Destination: Male-dominated inflows skew sex ratio in cities or host countries.

3. Occupational Composition

  • Migrants are generally economically active, moving for employment opportunities.
  • Origin: Loss of skilled workers may cause brain drain or shortage of professionals.
  • Destination: Migrants contribute to labor markets, often taking up jobs locals avoid (e.g., construction, agriculture, services).

4. Educational Composition

  • Highly educated individuals often migrate for higher studies or specialized jobs, leading to a concentration of skilled labor in developed regions.
  • Origin: Depletion of educated youth creates knowledge gaps.
  • Destination: Gain in human capital, innovation, and productivity.

5. Cultural / Ethnic Composition

  • Migration introduces new languages, traditions, and religions in the receiving areas.
  • Origin: Out-migration sometimes reduces cultural diversity.
  • Destination: Creates multicultural societies, but can also lead to ethnic tensions or integration challenges.

6. Family and Household Composition

  • Migration reshapes household structures:
    • Origin areas may see left-behind families, children, and elderly dependents.
    • Destination areas may experience increase in nuclear households formed by migrants.

Conclusion

Migration profoundly influences the demographic composition of both sending and receiving regions. While it often strengthens the working-age population and enhances cultural diversity in destination areas, it may cause ageing, gender imbalances, and brain drain in origin regions. Thus, migration is not only a movement of people but also a powerful force reshaping the social and demographic fabric of societies.

Methods of measuring volumes of migration

Migration is a dynamic demographic process, and its measurement is essential for understanding population change, labor markets, urbanization, and policy planning. Since migration is more complex than birth or death statistics (which are direct and easily recorded), demographers use multiple methods to estimate and analyze migration volumes.

Photo by Tima Miroshnichenko on Pexels.com

1. Census Method

  • Description: National censuses often include questions about a personโ€™s place of birth, previous residence, or duration of stay in the current place.
  • Advantages: Provides large-scale data covering the entire population.
  • Limitations: Conducted only once in 5 or 10 years; may not capture short-term or seasonal migration.

2. Registration Method

  • Description: Continuous population registers or civil registration systems record peopleโ€™s movements when they change residence.
  • Advantages: Provides up-to-date, continuous records.
  • Limitations: Requires well-developed administrative systems; often incomplete in developing countries.

3. Survey Method

  • Description: Household surveys (such as Demographic and Health Surveys, labor force surveys) collect detailed migration information, including reasons and duration.
  • Advantages: Offers detailed and current data, including social and economic aspects.
  • Limitations: Expensive, time-consuming, and usually based on samples, not entire populations.

4. Vital Registration Method

  • Description: Sometimes, changes in residence are recorded alongside births, deaths, and marriages.
  • Advantages: Provides continuous tracking of migration events.
  • Limitations: Rarely implemented effectively; data often incomplete.

5. Indirect Methods (Statistical Estimates)

When direct data is unavailable, migration is estimated indirectly:

  • Residuum Method:
    • Migration = (Population change between two censuses) โ€“ (Natural increase from births and deaths).
    • Useful for estimating net migration.
  • Survival Ratio Method:
    • Compares population cohorts across censuses, adjusting for expected survival rates, to estimate migration.
  • School Enrollment Data, Voter Lists, Tax Records: Indirect sources sometimes used to measure local or temporary migration.

6. Specialized Data Sources

  • Border Control Records: Used for international migration (immigration/emigration).
  • Work Permits and Visa Records: Track labor migration.
  • Remittance Data: Financial flows from migrants are sometimes used as a proxy for migration volumes.

Conclusion

Measuring migration volumes requires a combination of direct methods (like census, surveys, and registration) and indirect methods (statistical estimates). No single method captures the full picture, since migration is fluid and multidimensional. For accurate analysis, countries often use a triangulation approachโ€”combining census data, surveys, and administrative records.

Migration: Reasons and Types of Trends

Migration refers to the movement of people from one place to another, either within a country or across borders, for temporary or permanent settlement. It is one of the most significant demographic processes that shapes societies and economies worldwide. Migration is influenced by multiple factors and takes various forms depending on direction, duration, and purpose.

Photo by Abd Alrhman Al Darra on Pexels.com

Reasons for Migration

Migration occurs due to a combination of push factors (conditions that drive people away) and pull factors (attractions of the destination).

1. Economic Reasons

  • Search for employment and higher wages
  • Better business opportunities
  • Poverty and lack of livelihood in rural or underdeveloped areas

2. Social Reasons

  • Access to better education and healthcare
  • Family reunification and marriage
  • Desire for improved quality of life

3. Political Reasons

  • Escape from wars, political instability, or persecution
  • Government resettlement programs or immigration policies
  • Civil unrest and ethnic conflicts

4. Environmental Reasons

  • Natural disasters like floods, earthquakes, and droughts
  • Climate change (rising sea levels, desertification)
  • Scarcity of water, food, or agricultural land

Types of Migration Trends

Migration is classified based on geography, time, purpose, and status.

1. Based on Geography

  • Internal Migration: Movement within a country
    • Rural-to-Urban: Villagers move to cities for jobs (e.g., rural workers migrating to metropolitan areas).
    • Urban-to-Rural: Movement from cities back to villages (often for retirement or lower living costs).
    • Urban-to-Urban: Between cities for employment or lifestyle.
    • Rural-to-Rural: Movement between agricultural areas, often seasonal.
  • International Migration: Movement across national borders
    • Immigration: Entering a new country for settlement.
    • Emigration: Leaving oneโ€™s own country.
    • Refugees & Asylum Seekers: Forced migration due to conflict, persecution, or disasters.

2. Based on Duration

  • Temporary Migration: Short-term for work, education, or seasonal labor.
  • Permanent Migration: Long-term or lifelong settlement in a new area or country.
  • Circular Migration: Repeated movement between home and destination (common in seasonal labor).

3. Based on Purpose

  • Labor Migration: Seeking jobs, often in construction, agriculture, or services.
  • Educational Migration: Students moving for schools, colleges, or universities.
  • Forced Migration: Displacement due to war, persecution, or disasters.
  • Voluntary Migration: Based on personal choice for better opportunities.

4. Based on Legality

  • Legal Migration: Movement with valid visas, permits, or government approval.
  • Illegal/Irregular Migration: Crossing borders without authorization, overstaying visas, or working without permits.

Conclusion

Migration is driven by economic, social, political, and environmental factors, and it manifests in different types and trends. Understanding these patterns is crucial for planning urban development, managing international relations, and addressing humanitarian challenges. Migration is not only a demographic process but also a reflection of human aspirations for survival, opportunity, and a better life.

Migration: Causes and Consequences of Population Movement

Migration, the movement of people from one place to another, is a universal phenomenon that has shaped societies, cultures, and economies throughout history. It may occur within national boundaries (internal migration) or across international borders (international migration). The causes of migration are complex, often involving a combination of economic, social, political, and environmental factors, while the consequences are felt by both the regions of origin and destination.

Photo by Rahul Sapra on Pexels.com

Causes of Migration

Migration is usually driven by a mix of push factors (conditions that compel individuals to leave their home) and pull factors (attractions of a new place).

1. Economic Causes

  • Employment opportunities: People often move in search of better jobs, higher wages, or improved living standards.
  • Poverty and unemployment: Lack of income or livelihood opportunities in rural or underdeveloped regions forces people to seek work in urban or industrial areas.
  • Globalization: The interconnected world economy makes labor migration across countries more common, especially from developing to developed regions.

2. Social Causes

  • Education: Migration for higher education or better schools is common, especially among youth.
  • Healthcare and living standards: Families may move to access advanced healthcare facilities or improved quality of life.
  • Family ties and marriage: Many migrations occur for family reunification or after marriage.

3. Political Causes

  • Conflict and war: Wars, ethnic violence, and political instability create refugees and asylum seekers.
  • Persecution: Discrimination based on religion, ethnicity, or political beliefs forces people to flee.
  • Government policies: Restrictive or favorable immigration laws, land reforms, and resettlement programs can influence migration patterns.

4. Environmental Causes

  • Natural disasters: Floods, droughts, earthquakes, and hurricanes displace millions every year.
  • Climate change: Rising sea levels, desertification, and unpredictable rainfall patterns push people to leave vulnerable areas.
  • Resource scarcity: Lack of water, fertile land, or other essential resources drives rural-to-urban and cross-border migration.

Consequences of Migration

Migration has far-reaching impacts, both positive and negative, on individuals, families, and entire societies.

1. Consequences for the Place of Origin

  • Population decline: Outmigration reduces the working-age population, often leading to labor shortages.
  • Brain drain: Skilled and educated workers moving abroad can weaken the local economy.
  • Economic relief: Migration reduces pressure on local resources and provides income through remittances.
  • Social impacts: Separation of families may cause emotional strain but can also promote social mobility through financial support.

2. Consequences for the Place of Destination

  • Economic growth: Migrants often fill labor gaps, contribute to innovation, and boost industries.
  • Cultural diversity: Migration enriches societies with new languages, traditions, and cuisines.
  • Strain on resources: Rapid influx can stress housing, healthcare, education, and infrastructure.
  • Social tensions: Migration may fuel xenophobia, competition for jobs, and cultural conflicts.

3. Consequences for Migrants Themselves

  • Opportunities: Migrants often gain better employment, education, and living conditions.
  • Challenges: They may face discrimination, exploitation, or cultural isolation.
  • Identity and belonging: Many migrants experience a struggle between integrating into the new society and maintaining their original culture.

Conclusion

Migration is a dynamic process shaped by economic, social, political, and environmental forces. While it offers opportunities for growth, cultural exchange, and global connectivity, it also creates challenges for both migrants and host communities. Effective policies that ensure integration, protect migrant rights, and balance development between regions of origin and destination are essential. Ultimately, migration remains not just a demographic shift but also a human story of aspiration, resilience, and survival.

Mughal and British influences of India cities.

Urbanization in India owes much of its modern character to the Mughal and British periods. Both left distinct imprints on the physical layout, architecture, economy, and social fabric of Indian cities, though their approaches and motivations were very different.

Photo by Shantanu Goyal on Pexels.com

1. Mughal Influence on Indian Cities (16thโ€“18th Century)

The Mughals, who ruled a large part of India between the 16th and 18th centuries, were great city-builders. Their urban vision reflected their Persian, Central Asian, and Indian cultural influences.

Key Features:

  • Imperial Capitals:
    • Agra: Established as the Mughal capital by Akbar, it became a center of governance, trade, and culture.
    • Fatehpur Sikri: Built by Akbar in the late 16th century as a planned city with palaces, mosques, gardens, and administrative quarters.
    • Shahjahanabad (Old Delhi): Founded by Shah Jahan in 1648, it was a grand capital with the Red Fort, Jama Masjid, Chandni Chowk (market street), and gardens.
  • City Planning:
    • Use of fortified walls and gateways for defense.
    • Charbagh (four-part gardens) symbolizing Persian influence.
    • Central market squares and bazaars like Chandni Chowk, which encouraged trade and cultural mingling.
    • Emphasis on aesthetics โ€“ symmetry, wide avenues, and monumental architecture.
  • Architecture and Urban Aesthetics:
    • Mughal cities blended Islamic, Persian, and Indian styles.
    • Landmark structures like forts, mosques, caravanserais (rest houses), and stepwells formed the urban landscape.
    • Red sandstone and marble became signature materials.
  • Economic Role:
    • Cities functioned as hubs of craft production, trade, and administration.
    • Delhi, Agra, and Lahore became cosmopolitan centers attracting artisans, traders, scholars, and travelers.

Lasting Impact:

Many Mughal cities like Delhi, Agra, and Lahore remain cultural and architectural icons. Their forts, gardens, and bazaars still shape the identity and heritage of these cities today.


2. British Influence on Indian Cities (18thโ€“20th Century)

The British had very different urban priorities compared to the Mughals. Their cities were driven by administration, military strategy, trade, and segregation between colonizers and locals.

Key Features:

  • Presidency Towns:
    • Calcutta (Kolkata), Bombay (Mumbai), and Madras (Chennai) were the first major British cities, serving as centers of administration, trade, and ports for global commerce.
  • Dual City Pattern:
    • British cities had โ€œWhite Townsโ€ (European quarters with planned roads, bungalows, clubs, and churches) and โ€œBlack Townsโ€ (densely populated Indian settlements with bazaars and narrow lanes).
    • This segregation reflected racial and social hierarchies.
  • City Planning and Architecture:
    • Introduction of grid patterns and planned layouts, especially in military cantonments.
    • Construction of civil lines, railway colonies, and cantonments with orderly streets and open spaces.
    • Use of neo-classical, gothic, and Indo-Saracenic architecture in public buildings like Victoria Memorial (Kolkata), Gateway of India (Mumbai), and High Courts.
  • Transport and Trade:
    • Expansion of railways, ports, and telegraph systems turned cities into commercial hubs.
    • Bombay became a textile hub, Calcutta a jute hub, and Madras a center for trade in cotton and spices.
  • New Capitals and Planned Cities:
    • The British shifted their capital from Calcutta to Delhi in 1911, leading to the creation of New Delhi (designed by Edwin Lutyens and Herbert Baker).
    • New Delhi was characterized by wide boulevards, administrative buildings (Rashtrapati Bhavan, India Gate), and radial planning, contrasting with the organic growth of Shahjahanabad nearby.

Lasting Impact:

  • Indiaโ€™s modern administrative and commercial cities owe much to the British.
  • The railway network stimulated the growth of industrial towns (e.g., Kanpur, Jamshedpur).
  • Colonial architecture and urban layouts continue to dominate central areas of cities like Delhi, Kolkata, Mumbai, and Chennai.

3. Comparison: Mughal vs. British Urban Influence

AspectMughal CitiesBritish Cities
PurposeImperial capitals, cultural centers, trade hubsAdministrative, military, and commercial bases
Planning StyleOrganic + symbolic (forts, gardens, bazaars, religious centers)Segregated, grid-like, functional (civil lines, cantonments, railway towns)
ArchitectureIndo-Islamic, Persian-inspired (Red Fort, Jama Masjid, Taj Mahal)Neo-classical, Gothic, Indo-Saracenic (Victoria Memorial, India Gate, CST Mumbai)
Social FabricCosmopolitan, relatively integrated markets and settlementsSegregated โ€œWhite Townโ€ and โ€œBlack Townโ€ pattern
LegacyCultural heritage, tourism, living bazaarsAdministrative capitals, railways, colonial architecture, planned urban cores

4. Conclusion

Mughal and British urban influences represent two very different urban traditions in India. The Mughals emphasized imperial grandeur, cultural integration, and vibrant bazaars, while the British imposed segregation, order, and administrative functionality. Together, they have left a layered urban fabric in India, where Old Delhi coexists with New Delhi, Mughal Agra with colonial Cantonments, and bazaars with skyscrapers.

Urbanization Process in India: Influencing Factors

Urbanization in India is not merely a demographic phenomenon; it is a complex process shaped by a range of socio-cultural, political, economic, and administrative forces. These factors interact with each other, producing diverse patterns of urban growth and transformation across time and space.

Photo by Chandi Saha on Pexels.com

1. Socio-Cultural Factors

Urbanization in India has been closely tied to the countryโ€™s cultural traditions, migration patterns, and social dynamics.

  • Historical Legacy:
    Ancient civilizations (e.g., Harappa, Mohenjo-Daro), medieval temple towns (Madurai, Varanasi, Thanjavur), and Mughal capitals (Delhi, Agra, Fatehpur Sikri) laid strong urban foundations.
  • Religious and Cultural Centers:
    Cities like Varanasi, Ujjain, Haridwar, and Tirupati developed as pilgrimage centers, drawing permanent settlements, traders, and services.
  • Migration and Diversity:
    Social migration for education, jobs, and cultural opportunities has made cities cosmopolitan. For example, Mumbai, Delhi, and Bangalore are melting pots of languages, cuisines, and traditions.
  • Education and Modernization:
    Establishment of universities and institutions (e.g., Banaras Hindu University, JNU, IITs) transformed cities like Varanasi, Delhi, and Kanpur into knowledge hubs.
  • Changing Lifestyles:
    Urban areas act as spaces of social changeโ€”promoting modern values, womenโ€™s education, and new family structures (nuclear families, working women).

2. Political Factors

Urbanization has always been influenced by state policies, power centers, and political decisions.

  • Colonial Legacy:
    British rule created presidency towns (Calcutta, Bombay, Madras), cantonments, and port cities that remain major urban centers even today.
  • Capital Formation:
    Political decisions to shift or create capitals shaped urban landscapes, e.g., New Delhi (1911), Chandigarh (1950s), Gandhinagar, Bhubaneswar.
  • Post-Independence Planning:
    State-driven industrialization and Five-Year Plans emphasized creation of industrial townships like Bhilai, Rourkela, Bokaro.
  • Democracy and Governance:
    Urban governance through municipal corporations, state governments, and urban local bodies directly affects city growth, infrastructure, and service delivery.
  • Urban Policy Programs:
    • JNNURM (2005), AMRUT (2015), Smart Cities Mission (2015), PMAY have shaped modernization and housing.
    • Political will determines resource allocation for urban transport, housing, and slum redevelopment.

3. Economic Factors

Urbanization is fundamentally tied to economic change, as cities are engines of growth, trade, and employment.

  • Industrialization:
    • Post-independence establishment of heavy industries (steel, coal, power plants) created new industrial townships.
    • Growth of Mumbai (textiles), Kolkata (jute), Ahmedabad (cotton) linked to industrial activity.
  • Globalization and IT Revolution:
    • Since the 1990s, Bangalore, Hyderabad, Pune, Gurgaon emerged as IT hubs due to globalization and liberalization.
    • Special Economic Zones (SEZs) and IT parks accelerated service-led urbanization.
  • Rural-to-Urban Migration:
    • Economic opportunities attract migrants to cities for jobs in factories, construction, services, and informal economies.
  • Urban Informal Economy:
    • Street vendors, daily-wage workers, domestic help, and small enterprises form the backbone of urban survival but also create planning challenges.
  • Global Cities:
    • Indian cities like Mumbai, Delhi, and Bangalore are now integrated into global trade, finance, and technology networks.

4. Administrative Factors

Administrative decisions and governance structures are crucial in shaping urbanization patterns.

  • Planning and Development:
    • Post-1947, planning bodies like Town and Country Planning Organization (TCPO) and Delhi Development Authority (DDA) took charge of city development.
    • State-level Urban Development Authorities (BDA in Bangalore, MMRDA in Mumbai, LDA in Lucknow) oversee land use, housing, and infrastructure.
  • Municipal Governance:
    • Local self-governments (municipal corporations, municipalities) play a direct role in providing basic servicesโ€”water, waste management, roads, and health.
    • Weak capacity and resource constraints often lead to inefficiency.
  • Urban Renewal Programs:
    • Administrative initiatives like Smart Cities Mission, AMRUT, Metro Rail projects, and Housing for All are reshaping urban landscapes.
  • Decentralization and 74th Constitutional Amendment (1992):
    • Empowered Urban Local Bodies (ULBs) with more autonomy, encouraging participatory urban governance.
  • Challenges of Governance:
    • Issues of corruption, lack of coordination among agencies, and poor enforcement of master plans continue to hinder balanced urban growth.

5. Conclusion

The urbanization process in India is the outcome of interconnected socio-cultural traditions, political choices, economic transformations, and administrative interventions. While cultural heritage and migration enrich Indian cities, politics and governance determine their planning and resource allocation. Economic forcesโ€”from industrialization to globalizationโ€”drive growth, while administration ensures (or fails to ensure) efficiency and equity.

The future of Indian urbanization depends on how effectively these four dimensions are balanced to create inclusive, sustainable, and resilient cities.

Over view of world urbanization

1. Historical Background

Photo by Kelly on Pexels.com
  • Pre-industrial era:
    • Most of the worldโ€™s population lived in rural areas, dependent on agriculture.
    • Only a few cities (Mesopotamia, Egypt, Indus Valley, China, Rome, Athens) acted as administrative, trade, and cultural hubs.
    • Urbanization was slow and limited (by 1800, only ~3% of the worldโ€™s population lived in cities).
  • Industrial Revolution (18thโ€“19th century):
    • Massive shift as factories, industries, and transport systems developed in Europe and North America.
    • Urban population grew rapidly due to ruralโ€“urban migration for jobs.
    • Cities like London, Manchester, New York, and Paris expanded into modern industrial cities.

2. Global Urbanization Trends (20thโ€“21st Century)

  • 1900: Only ~15% of the worldโ€™s population urban.
  • 1950: ~30% (746 million urban dwellers).
  • 2007: For the first time, more people lived in urban areas than rural areas globally.
  • 2020: ~56% of the worldโ€™s population urban (~4.4 billion people).
  • 2050 (Projection by UN): ~68% urban (~6.7 billion people).

3. Regional Patterns

  • Developed Regions (Global North):
    • High urbanization rates (>75%).
    • Urban growth slowed after 1980s due to suburbanization, aging populations, and stabilization.
    • Examples: USA, Canada, Western Europe, Japan.
  • Developing Regions (Global South):
    • Rapid urbanization since mid-20th century.
    • Asia: Largest number of urban dwellers (China, India, Indonesia).
    • Africa: Fastest urban growth rate (expected to double by 2050).
    • Latin America: Highly urbanized (~80%), dominated by mega-cities like Sรฃo Paulo, Mexico City, Buenos Aires.

4. Mega-cities and Urban Hierarchies

  • Megacity: Urban agglomeration with 10 million+ people.
    • 1950: Only 2 megacities (New York, Tokyo).
    • 2023: Over 33 megacities (Delhi, Shanghai, Lagos, Sรฃo Paulo, Cairo, Mexico City).
  • Urban primacy: Many developing countries have one dominant primate city (e.g., Bangkok, Dhaka, Manila).
  • Urban networks: Developed countries emphasize polycentric urban regions (e.g., Rhineโ€“Ruhr in Germany, BosWash corridor in USA).

5. Drivers of World Urbanization

  • Industrialization & economic opportunities (factories, services, IT).
  • Rural distress (poverty, lack of opportunities).
  • Infrastructure & services (education, healthcare, transport).
  • Globalization โ†’ integration of cities into global economic systems.
  • Migration (internal & international) fueling growth of cities.

6. Impacts of Global Urbanization

Positive:

  • Economic growth: Cities as engines of innovation, trade, and employment.
  • Social development: Better access to healthcare, education, cultural exchange.
  • Connectivity: Integration into global economy.

Negative:

  • Urban poverty & slums: ~1 billion people live in slums (UN-Habitat).
  • Environmental degradation: Air pollution, water scarcity, waste.
  • Traffic congestion & inadequate infrastructure.
  • Urban inequality: Rich-poor divide, gentrification.
  • Climate risks: Coastal megacities vulnerable to floods and rising sea levels.

7. Future of World Urbanization

  • Asia & Africa will account for 90% of global urban growth by 2050.
  • India, China, and Nigeria alone will contribute to over one-third of new urban dwellers.
  • Rise of secondary cities and small urban centers, not just megacities.
  • Focus on sustainable cities (SDG-11) โ†’ smart infrastructure, renewable energy, resilient planning.
  • Increasing importance of urban governance and planning to handle migration, inequality, and climate change.

โœ… In summary:
Urbanization has transformed from being rare in 1800 to a global norm in the 21st century. While developed countries show stable, high levels of urbanization, the developing world is undergoing explosive urban growth, bringing both opportunities for development and challenges of sustainability and inclusivity.

Policies and strategies for directing urbanization trends in India

1. Post-Independence Policy Approach

India did not have a clear urbanization policy at Independence (1947); the focus was on rural development. Over time, with rapid urban growth, the government adopted planning interventions to manage urbanization.

Photo by Francesco Ungaro on Pexels.com

Key approaches:

  • Planned cities (Chandigarh, Bhubaneswar, Gandhinagar) โ†’ to decentralize urban growth.
  • Five-Year Plans: Urban sector linked to housing, infrastructure, and employment (especially through schemes like Integrated Urban Development).
  • Establishment of Urban Development Authorities (e.g., DDA, MMRDA) to plan metropolitan regions.

2. Major Policies and Programmes

(a) Housing and Infrastructure Policies

  • National Housing Policy (1988, revised later) โ†’ aimed at affordable housing.
  • Jawaharlal Nehru National Urban Renewal Mission (JNNURM, 2005) โ†’ modernization of water supply, sewerage, transport, and housing.
  • Pradhan Mantri Awas Yojana (PMAY-Urban, 2015) โ†’ โ€œHousing for Allโ€ by 2022 (extended).

(b) Urban Planning and Renewal

  • Town and Country Planning Acts (State-level) โ†’ regulate land use, master plans.
  • Integrated Development of Small and Medium Towns (IDSMT, 1979) โ†’ strengthen smaller towns to reduce pressure on metros.
  • Atal Mission for Rejuvenation and Urban Transformation (AMRUT, 2015) โ†’ water supply, sewerage, green spaces.
  • HRIDAY (2015) โ†’ rejuvenation of heritage cities.

(c) Economic and Industrial Strategies

  • Industrial corridors (Delhiโ€“Mumbai, Amritsarโ€“Kolkata) โ†’ promote new urban growth centers.
  • Special Economic Zones (SEZs) โ†’ attract investment, create jobs, encourage urban clusters.

(d) Sustainability-Oriented Strategies

  • Smart Cities Mission (2015) โ†’ 100 cities with ICT-based, sustainable infrastructure.
  • National Urban Transport Policy (2006) โ†’ promote mass transit, reduce congestion.
  • Swachh Bharat Mission (2014) โ†’ sanitation and solid waste management.
  • Climate Resilient Urban Development โ†’ integrated into recent urban policies.

3. Strategies for Directing Urbanization Trends

(a) Balanced Regional Development

  • Promote growth of small and medium towns (counter-magnets).
  • Develop satellite towns around metros (e.g., Gurgaon near Delhi, Navi Mumbai).
  • Strengthen regional development authorities for better coordination.

(b) Inclusive Urbanization

  • Slum rehabilitation (e.g., Rajiv Awas Yojana).
  • Affordable housing schemes for urban poor and migrants.
  • Participatory planning โ†’ involving citizens in decision-making.

(c) Economic Strategies

  • Develop urbanโ€“rural linkages (market integration, agro-processing).
  • Promote service-sector cities (IT hubs: Bengaluru, Hyderabad).
  • Support for industrial townships (Jamshedpur, Durgapur, Noida).

(d) Sustainability and Smart Growth

  • Compact city model โ†’ discourage urban sprawl.
  • Public transport, metro rail, non-motorized transport.
  • Urban green infrastructure (parks, water bodies, green belts).
  • Adoption of SDG-11 (Sustainable Cities and Communities) targets.

(e) Governance and Administrative Reforms

  • 74th Constitutional Amendment (1992): Empowered Urban Local Bodies (ULBs) for decentralized governance.
  • Capacity building of municipalities for planning, finance, and service delivery.
  • Publicโ€“Private Partnerships (PPPs) in urban infrastructure.

4. Current Trends and Challenges

  • India is projected to be 40% urban by 2036 (Census projection).
  • Urbanization is concentrated in metros โ†’ Delhi, Mumbai, Bengaluru, Chennai, Hyderabad.
  • Challenges: inequality, slums, congestion, climate risks, unemployment.
  • Strategy direction is shifting toward sustainable, smart, inclusive, and regionally balanced urbanization.

5. Summary Table

Strategy AreaExamples in India
Balanced growthIDSMT, satellite towns, industrial corridors
Housing & inclusionPMAY, Rajiv Awas Yojana, slum redevelopment
SustainabilityAMRUT, Smart Cities, Swachh Bharat Mission
Transport & mobilityMetro projects, National Urban Transport Policy
Governance74th CAA, ULB empowerment, PPP projects

โœ… In summary:
Indiaโ€™s urbanization policies have evolved from ignoring cities (pre-1960s) โ†’ controlling metros (1970sโ€“80s) โ†’ infrastructure modernization (2000s) โ†’ smart, sustainable, and inclusive cities (2010sโ€“present). The future requires balanced regional growth, sustainable planning, and empowered local governance.

Migration, Pushโ€“Pull Factors, and Impacts

1. Push and Pull Factors of Migration

Photo by Rayhan Ahmed on Pexels.com

Migration is the movement of people from one place to another, often from rural to urban areas in India. It is driven by a combination of push factors (forces that drive people away from rural areas) and pull factors (attractions of urban areas).

(a) Push Factors (Rural โ€œRepulsionโ€)

  • Agricultural distress: Small landholdings, low productivity, monsoon dependency.
  • Unemployment/underemployment: Lack of non-farm jobs in villages.
  • Poverty and indebtedness: Inability to sustain livelihoods.
  • Environmental stress: Floods, droughts, soil erosion, declining groundwater.
  • Social factors: Caste discrimination, lack of education and healthcare facilities.
  • Conflict/Displacement: Insurgencies, land acquisition for dams, mining, etc.

(b) Pull Factors (Urban โ€œAttractionโ€)

  • Employment opportunities: Industrial jobs, construction, services, IT, transport.
  • Higher wages and better living standards (at least in perception).
  • Educational facilities: Colleges, universities, coaching centers.
  • Healthcare and services: Modern hospitals, access to markets, communication.
  • Social mobility: Escape from traditional caste and community restrictions.
  • Modern amenities and lifestyle: Electricity, transport, entertainment.

2. Migration Trends in India

Based on Census 2011 and NSSO surveys:

  • Magnitude: 37% of Indiaโ€™s population (โ‰ˆ 450 million people) are migrants.
  • Direction: Predominantly rural โ†’ rural (about 55%), followed by rural โ†’ urban (โ‰ˆ 22%), then urban โ†’ urban and urban โ†’ rural.
  • Gender differences:
    • Women migrate mostly due to marriage (โ‰ˆ 70% of female migration).
    • Men migrate mainly for work and employment.
  • State-level trends:
    • Out-migration states: Bihar, Uttar Pradesh, Jharkhand, Odisha, Rajasthan.
    • In-migration states/cities: Delhi, Maharashtra (Mumbai, Pune), Gujarat (Surat, Ahmedabad), Karnataka (Bengaluru).
  • Emerging trend: Increasing inter-state and international migration of skilled workers (IT, healthcare, education).

3. Impacts of Migration

Migration affects both source (rural) regions and destination (urban) areas in complex ways.

(a) Impacts on Urban Development

Positive:

  • Supply of cheap labor for industries, construction, transport, domestic work.
  • Contribution to economic growth and urban dynamism.
  • Cultural diversity, exchange of traditions, cuisines, and ideas.

Negative:

  • Overcrowding of cities โ†’ housing shortages, congestion.
  • Growth of slums and informal settlements (e.g., Dharavi in Mumbai).
  • Pressure on infrastructure: water, sanitation, transport, healthcare.
  • Urban unemployment and informalization of jobs.
  • Social tensions, sometimes conflicts between migrants and locals.

(b) Impacts on Rural Development

Positive:

  • Remittances: Migrants send money back, improving household income, housing, and education.
  • Skill transfer: Return migrants bring new skills, ideas, and technologies.
  • Reduced pressure on land: Out-migration reduces pressure on scarce agricultural land.

Negative:

  • Brain drain: Young and skilled population leaves, aging population remains.
  • Gender imbalance: Male out-migration โ†’ feminization of agriculture (women left behind).
  • Decline in traditional practices: Social cohesion weakens.
  • Dependency on remittances: Can make villages vulnerable to economic shocks.

4. Migration, Urbanization, and Development Nexus

  • Migration is a key driver of urbanization in India.
  • It strengthens the ruralโ€“urban continuum:
    • Villages depend on cities for markets, services, and remittances.
    • Cities depend on villages for labor, food, and raw materials.
  • Balanced regional development policies are needed to reduce distress migration and manage sustainable urban growth.

โœ… In summary:

  • Push factors (poverty, lack of jobs, distress) drive people out of villages.
  • Pull factors (jobs, education, amenities) attract them to cities.
  • Migration brings economic benefits but also creates social, environmental, and infrastructural challenges in both rural and urban areas.

Building Resilient Schools and Anganwadis in Flood-Prone Zones: Lessons in Child-Centric DRR

Natural disasters, especially floods, are increasingly affecting vulnerable communities around the world, and children are often the most impacted. In India, recurrent flooding in states like Assam, Bihar, Odisha, and Kerala has had devastating effects on educational continuity and early childhood care. Schools and Anganwadisโ€”integral to child development and learningโ€”are frequently damaged or disrupted. This underscores the urgent need to adopt child-centric Disaster Risk Reduction (DRR) strategies and build resilient educational and care infrastructure in flood-prone zones.


1. Why Child-Centric DRR Matters

Children are not just passive victims of disastersโ€”they are active stakeholders whose rights to safety, education, and well-being must be protected. Child-centric DRR:

  • Recognizes the unique vulnerabilities of children.
  • Focuses on minimizing disruption to learning and care.
  • Ensures childrenโ€™s voices are included in planning and preparedness.
  • Enhances psychological and social resilience through supportive environments.

2. Understanding the Risk: Flood Impacts on Schools and Anganwadis

Floods affect educational institutions in several ways:

  • Structural damage: Buildings collapse or become unusable due to waterlogging.
  • Learning loss: Closure of facilities causes prolonged interruption of education.
  • Health risks: Unsanitary conditions lead to disease outbreaks among children.
  • Psycho-social trauma: Exposure to disaster causes long-term mental health issues in children.

Anganwadis, which serve children aged 0โ€“6 years, are even more vulnerable due to their location in community buildings and limited funding for resilient infrastructure.


3. Principles for Building Resilient Schools and Anganwadis

a. Location and Site Planning

  • Avoid constructing in low-lying or floodplain areas.
  • Use GIS-based hazard mapping to identify safe zones.
  • Raise plinth levels and construct on stilts or elevated platforms in high-risk areas.

b. Climate-Resilient Infrastructure

  • Use flood-resistant materials and designs that allow for quick drying and easy cleaning.
  • Ensure robust drainage systems to prevent water stagnation.
  • Install rainwater harvesting and water purification units to ensure safe drinking water post-disaster.

c. Multipurpose Use and Community Integration

  • Design schools and Anganwadis as community disaster shelters.
  • Include safe storage spaces for learning materials and emergency kits.
  • Ensure inclusive design for children with disabilities.

d. Green and Safe Spaces

  • Create safe outdoor play areas with flood-tolerant landscaping.
  • Include kitchen gardens and child-friendly environments to support nutrition and well-being.

4. Institutional and Capacity Strengthening

a. School and Anganwadi Disaster Management Plans (DMPs)

  • Prepare child-friendly DMPs that involve children in evacuation drills and safety education.
  • Form School Safety Committees and link them with local DRR bodies.

b. Training and Sensitization

  • Train Anganwadi workers and teachers in first aid, child protection, and psychological first aid.
  • Conduct regular mock drills and safety education activities for children.

c. Interdepartmental Coordination

  • Ensure collaboration between education, women and child development, disaster management, and public works departments.
  • Leverage schemes like the National Disaster Response Fund (NDRF) or District Mineral Funds for resilient infrastructure.

5. Technology and Innovation in Resilience Building

  • Use digital early warning systems to alert institutions in advance of floods.
  • Implement e-learning solutions and mobile education units for continued access during displacement.
  • Deploy solar-powered lights and communication tools in remote areas.

6. Case Studies and Best Practices

a. Biharโ€™s Flood-Resistant Schools

In flood-prone districts of Bihar, UNICEF and local authorities piloted raised school buildings with floating furniture and elevated storage. This helped ensure continuity of learning even during monsoon floods.

b. Keralaโ€™s Multi-Hazard Resilient Anganwadis

Post-2018 floods, Kerala redesigned Anganwadis with elevated foundations, emergency kits, and community awareness components.

c. Assamโ€™s Child-Friendly DRR Initiatives

NGOs partnered with local governments to train children in flood preparedness, build child-centric evacuation plans, and provide psychosocial care post-disaster.


7. Policy and Financing Support

  • Incorporate DRR in National Education Policy and Integrated Child Development Services (ICDS) guidelines.
  • Allocate dedicated budget lines for school and Anganwadi resilience in disaster-prone districts.
  • Tap into CSR funds, state disaster mitigation funds, and international climate financing.

8. Moving Forward: Strategic Recommendations

  1. Mainstream DRR in education and childcare planning at all levels.
  2. Promote community-led infrastructure design for better acceptance and sustainability.
  3. Ensure every new Anganwadi and school in flood zones is built with resilience as a core component.
  4. Empower children as DRR ambassadors through age-appropriate education and participation.
  5. Build evidence and data systems for monitoring school safety and child well-being during disasters.

Resilient schools and Anganwadis are not just about bricks and mortarโ€”they are about protecting futures. By embedding child-centric DRR in the planning, design, and operation of these institutions, we can ensure that every flood or disaster becomes a moment of learning, not loss. Investing in such resilience is not only a humanitarian imperative but also a foundational step toward sustainable development and child rights protection.

National urbanization policy, basic issues in urbanization policy.

1. Concept of Urbanization Policy

  • A national urbanization policy (NUP) is a framework by which the government directs the growth, distribution, and management of cities and towns.
  • It seeks to ensure balanced regional development, inclusive growth, and sustainable urbanization.
  • For India, which is projected to have 40% urban population by 2036 (Census of India projection), such a policy is critical.
Photo by Abdou EL Amri on Pexels.com

2. Evolution of Urbanization Policy in India

India has no single comprehensive urbanization policy document, but multiple initiatives, programmes, and committees have shaped the approach:

  • First & Second Five-Year Plans (1951โ€“61): Focus on rural development, little attention to cities.
  • Third & Fourth Plans (1961โ€“74): Recognition of rapid urban growth, emergence of metropolitan planning.
  • National Commission on Urbanisation (NCU, 1986): Landmark effort; stressed strengthening of small and medium towns, reducing pressure on metros, and promoting balanced regional growth.
  • Post-1990s (Economic Liberalization): Market-driven urbanization, rise of SEZs, industrial corridors.
  • 21st Century Missions:
    • JNNURM (2005), AMRUT, Smart Cities Mission, HRIDAY, PMAY (2015 onwards).
    • These programmes together act as de facto national urban policy instruments.

3. Objectives of a National Urbanization Policy

  • Balanced regional development: Avoid over-concentration in metros.
  • Inclusive growth: Housing, services, and jobs for the poor and migrants.
  • Economic efficiency: Promote cities as engines of growth.
  • Environmental sustainability: Green infrastructure, waste management, resilience.
  • Strengthening urban governance: Empower urban local bodies (ULBs).
  • Urbanโ€“rural linkages: Promote intermediate towns and counter-magnets.

Basic Issues in Urbanization Policy


1. Demographic & Spatial Issues

  • Over-concentration in metros (Delhi, Mumbai, Bengaluru, Chennai).
  • Weak growth of small and medium towns, leading to uneven development.
  • Urban sprawl, peri-urban growth, and unplanned settlements.
  • Migration pressure creating slums and informal settlements.

2. Housing and Infrastructure Issues

  • Housing shortage: ~29 million units needed (mainly for low-income groups).
  • Proliferation of slums and squatter settlements.
  • Deficient basic services (water, sanitation, electricity).
  • Inadequate urban transport and congestion.

3. Economic Issues

  • Cities as engines of growth, but lack of planning reduces productivity.
  • Informal sector dominance โ†’ poor working conditions, low wages.
  • Weak integration of urban policy with industrial and employment policies.

4. Social Issues

  • Rising inequality and segregation in urban areas.
  • Lack of inclusivity for migrants, women, and marginalized groups.
  • Poor access to education, healthcare, and public spaces in many towns.

5. Environmental Issues

  • Air and water pollution, inadequate solid waste management.
  • Disappearance of lakes, wetlands, and urban green spaces.
  • Climate risks: flooding, heat islands, coastal vulnerability.

6. Governance and Institutional Issues

  • Weak capacity of Urban Local Bodies (ULBs) despite 74th Constitutional Amendment.
  • Lack of financial autonomy โ†’ dependence on state/central funds.
  • Multiplicity of agencies โ†’ poor coordination (water, transport, land use under different authorities).
  • Gaps in urban data, monitoring, and enforcement of master plans.

Summary Table

Issue AreaKey Problems
DemographicOvercrowding in metros, weak small towns, migration pressure
Housing & InfraShortage of affordable housing, slums, poor basic services
EconomicLow productivity, informal sector, poor integration with industrial policy
SocialInequality, exclusion of poor/migrants, lack of social infrastructure
EnvironmentalPollution, waste mismanagement, climate risks
GovernanceWeak ULBs, financial dependence, overlapping agencies

โœ… In summary:
Indiaโ€™s urbanization policy has evolved gradually, but challenges persist. The basic issues revolve around imbalanced growth, inadequate housing & infrastructure, weak governance, and environmental degradation. A comprehensive National Urbanization Policy should address these with integrated planning, inclusive strategies, and sustainable urban growth models.

Laurie Baker โ€œGandhi of architectureโ€

Laurie Bakerโ€”often referred to as the โ€œGandhi of architectureโ€โ€”and his remarkable contributions to sustainable and affordable design in India:


๐Ÿ›๏ธ Biography & Early Life

  • Born Laurence Wilfred Baker on 2 March 1917 in Birmingham, England, he moved to India in 1945 as part of a World Leprosy Mission project The Architects Diary+15Wikipedia+15ArchDaily+15.
  • Influenced deeply by Mahatma Gandhiโ€™s philosophy, he consciously chose a path of simplicity, service, and local resilience in architecture Hindustan Times.
  • Lived in north Indiaโ€™s Pithoragarh region from 1948 to 1963, working on health and housing projects, before establishing his base in Kerala (Trivandrum) Hindustan Times.
  • Became an Indian citizen in 1988 and continued his work until his death in Thiruvananthapuram on 1 April 2007 lauriebaker.net+3Wikipedia+3Hindustan Times+3.

๐ŸŽฏ Architectural Philosophy & Style


๐Ÿงฑ Signature Techniques & Innovation


๐Ÿ—๏ธ Notable Projects


โœจ Legacy & Recognition

  • Fondly called “Daddy” by workers and students, reflecting his involvement in every brick laid on site Wikipedia.
  • Awards include:
    • Padma Shri (1990), MBE (1983), UN Roll of Honour (1992), International architectural recognitions from IUA and the Netherlands Wikipedia+1Wikipedia+1.
  • The Laurie Baker Centre for Habitat Studies in Kerala continues to teach and disseminate his ideas on sustainable architecture and cost-effective housing Hindustan Times+7lauriebaker.net+7STIRworld+7.

๐Ÿง  Why Laurie Baker Still Matters

  • His architecture is rooted in social equityโ€”beauty was not reserved for the affluent.
  • Preโ€‘emptive sustainability: rainwater harvesting, passive cooling, minimal resource use decades ahead of the global agenda.
  • A true vernacular modernist, combining low-tech local craft with thoughtful design to elevate ordinary materials.
  • Today, his buildings are seen as living museums, still teaching lessons on climate-responsive, humane architecture thehindu.comWikipedia.

Laurie Bakerโ€™s life teaches us that architecture need not be fossil-fuel-intensive or elitist. With empathy, craftsmanship, thrift, and respect for context, it can uplift communities, gracefully blend with environment, and stand the test of time.

Role of National and State-Level Policies in Urbanization

1. National-Level Policies

The Union Government plays a guiding role by providing vision, funding, and national programmes that direct urbanization trends.

a. Planning and Vision Setting

  • The National Commission on Urbanisation (1986) laid down key principles: strengthen small/medium towns, avoid overburdening metros.
  • National-level missions (e.g., Smart Cities Mission, AMRUT, PMAY, HRIDAY) provide direction and frameworks.
  • The Union frames policies on housing, transport, sanitation, environment, industries, which indirectly shape urbanization.

b. Financial Support

  • National-level schemes provide grants and incentives to states and Urban Local Bodies (ULBs).
  • Example: JNNURM (2005โ€“12) tied funding with urban reforms (property tax, e-governance, ULB empowerment).
  • Finance Commissions allocate tax devolution and grants to ULBs through states.

c. Institutional and Legislative Role

  • 74th Constitutional Amendment (1992): Empowered ULBs, mandated State Finance Commissions, ward committees.
  • National Housing Policy, National Urban Transport Policy (2006), National Habitat Standards set sectoral guidelines.
  • The Centre also facilitates data collection (Census, NSSO, NIUA, MoHUA reports).

d. Addressing Regional Imbalances

  • Central policies encourage growth centers, industrial corridors (e.g., DMIC, Chennai-Bengaluru Corridor), and SEZs to spread urbanization.
  • Promotes urbanโ€“rural linkages via Rurban Mission.

2. State-Level Policies

Urban development is primarily a State subject under the Indian Constitution (though the Centre has a supportive role). States are crucial in implementation and governance.

a. Urban Planning and Land Use

  • States prepare Master Plans, Regional Plans, Town Planning Schemes through Development Authorities and Municipal Corporations.
  • Land acquisition, zoning, building regulations โ†’ managed by state agencies.

b. Policy Formulation

  • Many states have their State Urban Policies/Housing Policies.
    • E.g., Rajasthan Urban Housing & Habitat Policy, Maharashtra Housing Policy, Karnatakaโ€™s Urban Development Policy.
  • States regulate transport, water supply, sanitation, and waste management through line departments and parastatal agencies.

c. Implementation of National Schemes

  • States are responsible for executing centrally-sponsored schemes like AMRUT, Smart Cities, PMAY.
  • Success depends on state capacity, political will, and coordination with ULBs.

d. Empowering ULBs

  • Through State Municipal Acts and amendments after the 74th CAA.
  • State Finance Commissions decide financial devolution to ULBs.
  • States also set up urban development authorities (e.g., DDA in Delhi, MMRDA in Mumbai, BDA in Bengaluru).

e. Local Economic Development

  • States design industrial policies, IT/SEZ policies, and infrastructure initiatives which directly affect urban growth.
  • Example: Gujarat Industrial Policy, Andhra Pradesh IT policy shaping new townships and IT corridors.

3. Challenges in National vs. State Roles

  • Overlap of responsibilities: Multiple agencies (Centre, state, ULBs) โ†’ poor coordination.
  • Financial dependence: States and ULBs often depend on the Centre โ†’ weak autonomy.
  • Uneven capacity: Some states (Maharashtra, Gujarat, Karnataka) perform better, while others lag in urban governance.
  • Policy mismatch: National schemes may not suit local contexts (e.g., Smart Cities design vs. needs of smaller towns).

Summary Table

LevelKey RolesExamples
NationalVision setting, financial support, policy framework, addressing regional imbalanceSmart Cities Mission, AMRUT, PMAY, 74th CAA
StateUrban planning, land use, implementation of schemes, empowering ULBs, local policiesState Housing Policies, Master Plans, Urban Dev. Authorities

โœ… In summary:

  • National policies set the direction, funding, and reforms, ensuring that urbanization supports national goals like balanced development, economic growth, and sustainability.
  • State-level policies translate these into local planning, land use, governance, and service delivery, tailoring urban strategies to regional realities.
  • For successful urbanization, synergy between national vision, state execution, and ULB empowerment is essential.

FERTILITY: Concepts, Trends, Determinants, and Measures

By Kavita Dehalwar

I. What is Fertility?

Fertility refers to the actual reproductive performance of an individual, couple, group, or population. It is a demographic concept that quantifies the frequency of childbirth in a population over time.


II. Fertility Trends

Definition:

Fertility trends refer to changes in fertility rates over time, influenced by social, economic, biological, and political factors.

Global Patterns:

  • Declining fertility in developed nations due to urbanization, higher education levels, career focus, and contraceptive access.
  • Higher fertility in developing regions due to early marriage, lower education, cultural norms, and limited family planning.

III. Fertility and Social Behavior

Social factors affecting fertility:

  1. Marriage patterns: Early and universal marriage often results in higher fertility.
  2. Education level: Higher female education is associated with lower fertility.
  3. Employment: Working women tend to delay childbirth or have fewer children.
  4. Cultural norms: Beliefs about ideal family size, gender roles, and childbearing influence fertility.
  5. Religion: Some religious doctrines encourage higher fertility.

IV. Fertility and Biological Behavior

Biological factors influencing fertility:

  1. Age of woman: Fertility peaks in the 20s and declines after 35.
  2. Health and nutrition: Poor health reduces fertility.
  3. Infertility: Biological infertility (in either partner) limits reproductive outcomes.
  4. Menstrual and ovulation cycles: Timing affects conception probability.
  5. Postpartum amenorrhea and lactation: These naturally suppress ovulation and reduce birth intervals.

V. Differential Fertility

Differential fertility refers to variations in fertility across different subgroups of the population. These differences can be due to:

1. Ethnic Groups:

  • Cultural values and traditions around family size vary.
  • E.g., In multi-ethnic countries, one ethnic group may exhibit higher fertility rates than others.

2. Socio-Economic Groups:

  • Lower-income groups may have higher fertility due to less contraceptive use and higher child mortality.
  • Wealthier, urban, and more educated groups tend to have fewer children.

3. Mobility and Migration:

  • Migrants may initially retain high fertility but adopt host-country norms over time.
  • Mobile populations may have reduced access to reproductive healthcare.

4. Location (Urban vs Rural):

  • Urban residents usually have fewer children due to better education, healthcare, and employment opportunities.
  • Rural areas may show higher fertility due to agricultural labor needs and lower access to contraception.

VI. Measures of Fertility

Fertility is quantified using several statistical indicators. Below are the main fertility measures with formulas and explanations:


1. Crude Birth Rate (CBR)

Definition:

Total number of live births per 1,000 people in a given year.

Formula:

Example:

If there are 20,000 live births in a population of 1,000,000: CBR=?

Limitations:

  • Not age-specific.
  • Includes total population, even those not of reproductive age.

2. Age-Specific Fertility Rate (ASFR)

Definition:

Number of births per 1,000 women in a specific age group (usually 5-year intervals).

Formula:

Example:

If women aged 25โ€“29 have 3,000 births and their population is 100,000: ASFR25โˆ’29=?


3. Total Fertility Rate (TFR)

Definition:

Average number of children a woman would have during her reproductive years (typically ages 15โ€“49), based on current ASFRs.

Formula:

  • The sum is over all reproductive age groups.
  • Length of age interval is usually 5 years.

Example:

If the ASFRs add up to 600 across all age groups: TFR=600ร—51,000=3.0ย childrenย perย womanTFR =?

Interpretation:

  • TFR of 2.1 is considered the replacement-level fertility (in developed countries).
  • TFR > 2.1 = population growth; TFR < 2.1 = population decline (without migration).

4. Net Reproduction Rate (NRR)

Definition:

Average number of daughters a woman would have in her lifetime if she were subject to current age-specific fertility and mortality rates.

Formula:

  • NRR focuses on female children, since only they can reproduce.

Interpretation:

  • NRR = 1 โ†’ each woman is replaced by one daughter โ†’ stable population.
  • NRR > 1 โ†’ population grows.
  • NRR < 1 โ†’ population declines (without migration).

VII. Summary Table of Fertility Measures

MeasureFormulaUnitUse
Crude Birth Rate (CBR)Per 1,000 populationGeneral fertility indicator
Age-Specific Fertility Rate (ASFR)Per 1,000 women (age group)Detailed analysis of fertility across age groups
Total Fertility Rate (TFR)Children per womanBest measure of fertility potential
Net Reproduction Rate (NRR)Daughters per womanPopulation replacement measure accounting for mortality

VIII. Conclusion

Fertility is influenced by complex social, economic, cultural, and biological factors. Understanding fertility measures like CBR, ASFR, TFR, and NRR is essential for population policy, healthcare planning, and socio-economic development. Differential fertility across ethnic, regional, and economic lines highlights the need for targeted interventions.

References

De Bruijn, B. J., & De Bruijn, B. J. (2006).ย Fertility: theories, frameworks, models, conceptsย (pp. 549-569). na.

Kumar, G., Vyas, S., Sharma, S. N., & Dehalwar, K. (2025). Urban growth prediction using CA-ANN model and spatial analysis for planning policy in Indore city, India.ย GeoJournal,ย 90(3), 139.

McNicoll, G. (1980). Institutional determinants of fertility change.ย Population and development review, 441-462.

Morgan, S. P., & Hagewen, K. J. (2005). Fertility. Inย Handbook of populationย (pp. 229-249). Boston, MA: Springer US.

Whelpton, P. K., & Kiser, C. V. (1945). Trends, determinants, and control in human fertility.ย The Annals of the American Academy of Political and Social Science,ย 237(1), 112-122.

Measures of Mortality, including Definitions, Formulas, and Interpretations

detailed explanation of key measures of mortality, including definitions, formulas, and interpretations for:

  • Crude death rate
  • Age-specific death rate
  • Infant mortality rate
  • Neonatal mortality rate
  • Adjusted/standardized death rate

1. Crude Death Rate (CDR)

Definition:

The crude death rate is the total number of deaths in a population over a given period (usually a year) per 1,000 individuals.

Formula:

Example:

If a country has 50,000 deaths in a year and a mid-year population of 5,000,000: CDR=?

Limitations:

  • Doesn’t account for age structure of the population.
  • Can be misleading when comparing countries with different age demographics.

2. Age-Specific Death Rate (ASDR)

Definition:

ASDR measures the death rate within a specific age group per 1,000 people in that group.

Formula:

Example:

If there are 500 deaths among people aged 65โ€“74 and that groupโ€™s population is 50,000: ASDR=?

Use:

  • Helps identify high-risk age groups.
  • More accurate than crude death rate for health planning and analysis.

3. Infant Mortality Rate (IMR)

Definition:

IMR refers to the number of deaths of infants under 1 year of age per 1,000 live births in a given year.

Formula:

Example:

If 1,200 infants die in a year and there were 100,000 live births: IMR=?

Importance:

  • Reflects health care quality, nutrition, and maternal health.
  • A key indicator of social and economic development.

4. Neonatal Mortality Rate (NMR)

Definition:

The NMR refers to the number of deaths of infants within the first 28 days of life per 1,000 live births.

Formula:

Example:

If there are 600 deaths within 28 days among 100,000 live births: NMR=?

Use:

  • Assesses quality of prenatal and immediate postnatal care.

5. Adjusted or Standardized Death Rate (SDR)

Definition:

Standardized death rate adjusts the crude death rate to eliminate the effects of differences in age distribution. It allows comparison between populations with different age structures.

Why Standardize?

Populations with more elderly people will naturally have higher crude death rates, even if the healthcare system is good. Standardization accounts for this.

Methods of Standardization:

Two common methods:

  • Direct standardization
  • Indirect standardization

A. Direct Standardization

Formula:

Steps:

  1. Multiply each age-specific death rate by the standard population for that age group.
  2. Sum all the products.
  3. Divide by the total standard population.

Use:

  • For comparing mortality between countries or over time using a common standard.

B. Indirect Standardization (Often used when age-specific rates are not available)

Steps:

  1. Use standard population’s age-specific death rates.
  2. Apply them to your study population to find expected deaths.
  3. Compare observed vs. expected deaths.

Standardized Mortality Ratio (SMR):

  • SMR = 100: mortality is equal to standard.
  • SMR > 100: higher mortality than standard.
  • SMR < 100: lower mortality than standard.

Summary Table:

MeasureFormulaDenominatorUse/Significance
Crude Death Rate (CDR)Entire populationGeneral mortality level
Age-Specific Death RateAge group populationRisk in specific age groups
Infant Mortality Rate (IMR)Live birthsMaternal/child health indicator
Neonatal Mortality RateLive birthsImmediate newborn care indicator
Standardized Death RateStandard populationRemoves age structure bias in comparisons

References

Kumar, G., Vyas, S., Sharma, S. N., & Dehalwar, K. (2024). Challenges of environmental health in waste management for peri-urban areas. Inย Solid Waste Management: advances and trends to tackle the SDGsย (pp. 149-168). Cham: Springer Nature Switzerland.

Morris, R. F. (1957). The Interpretation of Mortality Data in Studies on Population Dynamics1.ย The Canadian Entomologist,ย 89(2), 49-69.

Ogbanga, M. M., & Sharma, S. N. (2024). Climate Change and Mental Heat. EduPub

Siegel, J. S. (2011). Concepts and basic measures of mortality. Inย The Demography and Epidemiology of Human Health and Agingย (pp. 73-134). Dordrecht: Springer Netherlands.

Sheil, D., Burslem, D. F., & Alder, D. (1995). The interpretation and misinterpretation of mortality rate measures.ย Journal of Ecology, 331-333.

Stocks, P. (1944). The measurement of morbidity.

Sharma, S. N., Dehalwar, K., Yadav, K., & Verma, D. (2025). Urban Street Canyon Turbulence and Vehicular Pollution Dispersion.

Zeighami, E. A., & Morris, M. D. (1983). The measurement and interpretation of proportionate mortality.ย American Journal of Epidemiology,ย 117(1), 90-97.

Demographic Variables: A Detailed Overview

By Kavita Dehalwar

Demographic variables refer to the statistical characteristics of human populations used primarily in research, marketing, policy-making, and social sciences to identify and understand different segments within a population. These variables help describe, analyze, and predict behavior patterns, preferences, and trends among groups of people. They are essential in both qualitative and quantitative research because they allow for the classification and segmentation of target audiences.

Below is a detailed breakdown of the major demographic variables:

Photo by Thgusstavo Santana on Pexels.com

1. Age

Age is one of the most fundamental demographic variables. It categorizes individuals based on their age group (e.g., children, teenagers, adults, seniors). It influences:

  • Consumer behavior (e.g., preferences for technology, fashion, food)
  • Health and medical needs
  • Educational interests
  • Social and economic priorities

Age groups commonly used:

  • 0โ€“14 years (children)
  • 15โ€“24 years (youth)
  • 25โ€“54 years (working-age adults)
  • 55โ€“64 years (pre-retirement)
  • 65+ years (elderly)

2. Gender (or Sex)

Gender refers to whether someone identifies as male, female, or non-binary/other. Traditionally, this variable was limited to biological sex (male/female), but contemporary research often includes gender identity for inclusivity and accuracy.

Influences:

  • Employment patterns
  • Purchasing decisions
  • Healthcare needs
  • Social roles and expectations

3. Income

Income refers to the monetary earnings of an individual or household. It is usually measured annually and is a key variable in economic research, marketing, and social studies.

Categories often used:

  • Low income
  • Middle income
  • High income

Impacts:

  • Spending habits
  • Access to education and healthcare
  • Living standards
  • Investment and savings behavior

4. Education Level

This variable indicates the highest level of education an individual has attained. It is a strong predictor of job prospects, income, and lifestyle.

Typical categories:

  • No formal education
  • Primary education
  • Secondary education
  • Higher education (college/university)
  • Postgraduate education

Influences:

  • Employment opportunities
  • Political participation
  • Health awareness
  • Media consumption

5. Occupation

Occupation refers to the kind of job or profession an individual is engaged in. This helps categorize people based on skill levels, industry sectors, and work environments.

Categories:

  • White-collar (e.g., managers, professionals)
  • Blue-collar (e.g., factory workers, technicians)
  • Service industry (e.g., waitstaff, customer service)
  • Unemployed
  • Retired

6. Marital Status

Marital status describes a personโ€™s legal relationship status. It plays a crucial role in shaping family structure, financial responsibilities, and lifestyle choices.

Common categories:

  • Single
  • Married
  • Divorced
  • Widowed
  • Separated
  • Cohabiting (not legally married but living together)

7. Religion

Religion refers to the spiritual beliefs and practices followed by individuals or groups. It can influence values, behaviors, dietary choices, holidays observed, and attitudes toward social issues.

Examples:

  • Christianity
  • Islam
  • Hinduism
  • Buddhism
  • Judaism
  • Non-religious/Atheist

8. Ethnicity or Race

This variable categorizes people based on shared cultural, national, or racial characteristics. It’s often used in studies of health disparities, education access, political representation, and cultural practices.

Examples:

  • Caucasian
  • African descent
  • Asian
  • Hispanic/Latino
  • Indigenous
  • Mixed race

9. Geographic Location

This refers to the physical location where an individual resides, including country, region, state, city, or even neighborhood.

Impact areas:

  • Climate preferences
  • Political views
  • Cultural norms
  • Language
  • Access to resources and services

10. Family Size and Structure

This variable accounts for the number of individuals in a household and their relationships to each other.

Includes:

  • Nuclear family (parents and children)
  • Extended family (includes relatives)
  • Single-parent family
  • Childless couples

Applications:

  • Housing needs
  • Consumption patterns
  • Healthcare planning
  • Educational services

11. Language

Language spoken at home or as a first language is another important demographic factor, especially in multicultural or multilingual societies. It impacts communication strategies in marketing and public services.


Applications of Demographic Variables

Demographic variables are used in a variety of domains:

  • Marketing: To segment customers and tailor advertising.
  • Public Policy: For resource allocation, program planning, and social welfare.
  • Healthcare: To understand needs and disparities.
  • Education: To plan curriculum, school locations, and funding.
  • Political Science: For voter profiling and electoral strategy.

Conclusion

Demographic variables provide a structured way to understand human populations. By categorizing people based on measurable traits, researchers, policymakers, and businesses can identify patterns, predict behaviors, and create targeted strategies. While these variables are powerful, they are often used alongside psychographic, behavioral, and geographic variables for deeper insights.

References

Dehalwar, K., & Sharma, S. N. (2023).ย Fundamentals of research writing and uses of research methodologies. Edupedia Publications Pvt Ltd.

Goldberg, L. R., Sweeney, D., Merenda, P. F., & Hughes Jr, J. E. (1998). Demographic variables and personality: The effects of gender, age, education, and ethnic/racial status on self-descriptions of personality attributes.ย Personality and Individual differences,ย 24(3), 393-403.

Gutiรฉrrez, J. L. G., Jimรฉnez, B. M., Hernรกndez, E. G., & Pcn, C. (2005). Personality and subjective well-being: Big five correlates and demographic variables.ย Personality and individual differences,ย 38(7), 1561-1569.

Lam, D. (1997). Demographic variables and income inequality.ย Handbook of population and family economics,ย 1, 1015-1059.

Pollak, R. A., & Wales, T. J. (1981). Demographic variables in demand analysis.ย Econometrica: Journal of the Econometric Society, 1533-1551.

Sharma, S. N., & Dehalwar, K. (2025). Assessing the Transit-Oriented Development and Travel Behavior of the Residents in Developing Countries: A Case of Delhi, India.ย Journal of Urban Planning and Development,ย 151(3), 05025018.

Study of Population โ€“ A Detailed Overview

By Kavita Dehalwar

The study of population, or demography, is the scientific investigation of human populations, focusing on their size, structure, distribution, and changes over time. It analyzes how and why populations grow or decline, how people move, and how demographic trends affect society. This field provides critical information for planning and policy-making in areas like health, education, housing, labor markets, and environmental sustainability.

Photo by Czapp u00c1rpu00e1d on Pexels.com

1. Definition of Population

A population refers to a group of individuals living in a specific geographic area who share certain social or biological characteristics. For example, the population of a city includes all its residents regardless of age or background. The study of such populations allows researchers to track trends in health, education, income, and mobility.


2. Importance of Population Studies

Population studies are vital for making informed decisions in governance and development. By understanding population trends, governments can anticipate future needs, such as how many schools or hospitals will be required, how to manage food supply, and how to prepare for aging populations or urban expansion. It also helps global agencies monitor human development and inequality.


3. Key Components of Population Study

a) Population Size

Population size refers to the total number of individuals living in a specific area at a given time. Knowing this helps planners assess demand for services like healthcare, education, and infrastructure. It also allows comparisons between countries or regions.

b) Population Density

Population density measures how many people live per unit area (e.g., per square kilometer). High density may indicate urban crowding, while low density often suggests rural or underdeveloped areas. Understanding density helps in planning transportation, housing, and utilities.

c) Population Distribution

This term describes how people are spread across a region or the world. Population distribution is influenced by natural features (like rivers and mountains), economic factors (such as job availability), and political stability. Uneven distribution can lead to overuse of resources in some areas and underdevelopment in others.

d) Population Structure

Population structure refers to the composition of a population, usually broken down by age and sex. It is often visualized using population pyramids. Understanding this helps forecast future needs โ€” for example, a young population will need more schools, while an aging population will require more healthcare services.

e) Population Growth

Population growth indicates the rate at which the number of individuals in a population is increasing. It is influenced by birth rates, death rates, and migration. Rapid population growth can strain resources, while population decline can affect the workforce and economy.


4. Demographic Processes

a) Fertility

Fertility refers to the actual number of children born to women in a population. It is measured using indicators like the Crude Birth Rate or Total Fertility Rate. Fertility is influenced by culture, education, access to contraception, and government policies.

b) Mortality

Mortality is the frequency of deaths in a population over a specific period. Important measures include the Crude Death Rate and Infant Mortality Rate. Mortality rates help assess the overall health conditions and the effectiveness of medical services in a society.

c) Migration

Migration is the movement of people from one place to another, either within a country (internal migration) or between countries (international migration). It affects population size, cultural composition, and the labor force, and can be driven by economic, social, or environmental factors.


5. Population Theories

a) Malthusian Theory

This theory, proposed by Thomas Malthus, suggests that population growth tends to outpace food production, leading to shortages, famine, and conflict. Although criticized, the theory sparked debate on sustainable development and resource management.

b) Demographic Transition Theory

This theory explains how societies transition from high birth and death rates to low ones as they develop economically. It outlines four or five stages of demographic change, and helps in predicting population trends in developing versus developed nations.

c) Marxist Theory

The Marxist perspective views population issues as consequences of unequal resource distribution rather than natural laws. It argues that poverty and overpopulation stem from capitalism and advocates for social reforms to ensure equitable access to resources.


6. Population Data Sources

Population studies rely on data collected through censuses, surveys, and administrative records. Censuses offer a complete population snapshot, while surveys and records provide detailed information on births, deaths, migration, education, and employment. Accurate data is essential for effective planning and analysis.


7. Challenges in Population Studies

Demographic research faces various challenges, including outdated or inaccurate data, especially in less developed regions. Tracking migration and undocumented populations can be complex. Additionally, ethical issues arise when collecting sensitive information from vulnerable groups, such as minorities or refugees.


8. Applications of Population Studies

Demographic insights are used to design public policies, predict workforce needs, control disease outbreaks, plan cities, and manage natural resources. Whether it’s allocating healthcare funding or responding to a refugee crisis, population studies play a critical role in both immediate decision-making and long-term planning.


Conclusion

The study of population is essential for understanding how societies function and change. It equips governments, researchers, and international organizations with the tools to address pressing challenges such as urbanization, aging, poverty, and environmental degradation. By analyzing population trends and dynamics, we can build more equitable and sustainable futures.

References

Dehalwar, K., & Sharma, S. N. (2023).ย Fundamentals of research writing and uses of research methodologies. Edupedia Publications Pvt Ltd.

Emerson, E., Kiernan, C., Alborz, A., Reeves, D., Mason, H., Swarbrick, R., … & Hatton, C. (2001). The prevalence of challenging behaviors: A total population study.ย Research in developmental disabilities,ย 22(1), 77-93.

Hull, M. G., Glazener, C. M., Kelly, N. J., Conway, D. I., Foster, P. A., Hinton, R. A., … & Desai, K. M. (1985). Population study of causes, treatment, and outcome of infertility.ย Br Med J (Clin Res Ed),ย 291(6510), 1693-1697.

Szklo, M. (1998). Population-based cohort studies.ย Epidemiologic reviews,ย 20(1), 81-90.

Sharma, S. N., & Dehalwar, K. (2025). Assessing the Transit-Oriented Development and Travel Behavior of the Residents in Developing Countries: A Case of Delhi, India.ย Journal of Urban Planning and Development,ย 151(3), 05025018.

Sharma, S. N. (2024). Role of Demography & Rahul Gandhi in Karnataka State Election Results. Track2Training

How to model user Behaviour for Public Trransport Users

Daily writing prompt
What’s one small improvement you can make in your life?

By Kavita Dehalwar

Modeling user behavior for public transport users is an essential endeavor in urban planning, transportation engineering, behavioral economics, and smart mobility systems. It helps in understanding how and why individuals make certain transit choices, which can inform infrastructure development, policy-making, demand forecasting, and service design. This essay outlines a comprehensive approach to modeling public transport user behavior, encompassing theoretical foundations, methodologies, data sources, modeling techniques, and practical applications.


1. Introduction

Public transport systems are critical to sustainable urban development. Understanding user behavior within these systems is necessary to design efficient, user-friendly, and environmentally sustainable transportation networks. User behavior modeling involves identifying the factors that influence individuals’ travel decisions, such as mode choice, route selection, departure time, and frequency of use. Accurately modeling this behavior allows for improved system performance, reduced congestion, and enhanced commuter satisfaction.


2. Theoretical Foundations

2.1 Behavioral Theories

Several behavioral theories underpin travel behavior modeling:

  • Rational Choice Theory assumes that individuals make decisions that maximize their utility based on travel time, cost, convenience, and reliability.
  • Theory of Planned Behavior (TPB) incorporates attitudes, subjective norms, and perceived behavioral control to predict intention and behavior.
  • Habitual Behavior Theory highlights that not all decisions are conscious or rational; many are habitual and influenced by routine.
  • Bounded Rationality suggests that decision-makers aim for satisfactory rather than optimal solutions due to cognitive limitations.

2.2 Utility Theory

In discrete choice modeling, users are assumed to choose the option with the highest perceived utility. Utility is typically a function of measurable variables like travel time and cost, as well as unobservable preferences.


3. Data Collection and Sources

Effective modeling requires high-quality data. Common sources include:

  • Surveys (e.g., travel diaries, stated preference (SP), and revealed preference (RP) surveys)
  • Smart Card Data (e.g., tap-in/tap-out times and locations)
  • Mobile Phone GPS Data
  • Social Media and Web Scraping for sentiment and location
  • Automatic Passenger Counting (APC) Systems
  • CCTV and Wi-Fi/Bluetooth Tracking

Each data source offers different insights and granularity, and often, multiple sources are integrated for comprehensive modeling.


4. Modeling Methodologies

4.1 Descriptive Analysis

Basic statistical analysis helps understand general patterns, such as peak usage hours, preferred routes, and user demographics.

4.2 Discrete Choice Models (DCMs)

These are the most widely used tools for modeling individual travel decisions. Examples include:

  • Multinomial Logit (MNL)
  • Nested Logit
  • Mixed Logit / Random Parameters Logit

These models estimate the probability of a user choosing a particular option from a finite set of alternatives.

4.3 Agent-Based Modeling (ABM)

ABMs simulate individual agents (users) and their interactions within a transport network. This method captures emergent phenomena, such as congestion and modal shift, based on user rules and preferences.

4.4 Machine Learning Approaches

Recent advancements include the use of:

  • Decision Trees, Random Forests
  • Neural Networks
  • Support Vector Machines (SVM)
  • Deep Learning for Pattern Recognition

These are data-driven methods that often outperform traditional models in prediction accuracy but may lack interpretability.

4.5 Hybrid Models

Combining statistical methods with machine learning or behavioral theory allows for more robust and explainable models.


5. Factors Influencing User Behavior

Several variables influence transport user behavior:

  • Travel Time and Reliability
  • Cost (fare, fuel, tolls)
  • Comfort and Convenience
  • Service Frequency and Coverage
  • Safety and Security
  • Environmental Awareness
  • Socioeconomic Characteristics (age, income, occupation)
  • Weather Conditions
  • Availability of Real-Time Information

Understanding the relative importance of these factors is crucial for targeted interventions.


6. Applications of User Behavior Models

6.1 Transit Planning

Behavior models help optimize routes, schedules, and capacity planning.

6.2 Demand Forecasting

Models predict how many people will use certain services under varying scenarios, such as fare changes or new infrastructure.

6.3 Policy Simulation

Scenarios such as congestion pricing, subsidies, or vehicle restrictions can be tested virtually.

6.4 Smart Mobility Integration

Behavior modeling informs the integration of services like bike-sharing, ride-hailing, and micro-transit.

6.5 Personalized Travel Recommendations

Real-time behavior modeling supports personalized route suggestions and service alerts.


7. Challenges and Limitations

  • Data Privacy Concerns
  • Model Transferability across Cities
  • Behavioral Complexity and Non-Linearity
  • Technological and Infrastructure Constraints
  • Equity Considerations

Efforts must be made to address these challenges, particularly ensuring ethical use of data and avoiding biases.


8. Future Directions

  • Real-Time Adaptive Models that update with live data
  • Integration with Smart City Platforms
  • Use of Wearable Devices and IoT Sensors
  • Explainable AI for Transparent Decision-Making
  • Behavioral Nudges and Gamification to Influence Choice

The future of transport behavior modeling lies in dynamic, personalized, and predictive systems supported by AI and ubiquitous data.


9. Conclusion

Modeling user behavior in public transport is a multifaceted task requiring a blend of theoretical insight, empirical data, and advanced analytics. As cities grow and mobility demands evolve, robust user behavior models will be critical to creating adaptive, efficient, and user-centered transportation systems. By embracing interdisciplinary methods and emerging technologies, stakeholders can not only predict how people move but also shape the future of urban mobility.

References

Buliung, R. N., & Kanaroglou, P. S. (2007). Activityโ€“travel behaviour research: conceptual issues, state of the art, and emerging perspectives on behavioural analysis and simulation modelling.ย Transport Reviews,ย 27(2), 151-187.

Clifton, K. J., & Handy, S. L. (2003). Qualitative methods in travel behaviour research. Inย Transport survey quality and innovationย (pp. 283-302). Emerald Group Publishing Limited.

Dehalwar, K., & Sharma, S. N. (2024). Social Injustice Inflicted by Spatial Changes in Vernacular Settings: An Analysis of Published Literature.

Dehalwar, K., & Sharma, S. N. (2023).ย Fundamentals of research writing and uses of research methodologies. Edupedia Publications Pvt Ltd.

Dehalwar, K. S. S. N., & Sharma, S. N. (2024). Exploring the distinctions between quantitative and qualitative research methods.ย Think India Journal,ย 27(1), 7-15.

Jones, P. M., Dix, M. C., Clarke, M. I., & Heggie, I. G. (1983).ย Understanding travel behaviourย (No. Monograph).

Kutter, E. (1973). A model for individual travel behaviour.ย Urban studies,ย 10(2), 235-258.

Pel, A. J., Bliemer, M. C., & Hoogendoorn, S. P. (2012). A review on travel behaviour modelling in dynamic traffic simulation models for evacuations.ย Transportation,ย 39, 97-123.

Sharma, S. N., & Dehalwar, K. (2025). Assessing the Transit-Oriented Development and Travel Behavior of the Residents in Developing Countries: A Case of Delhi, India.ย Journal of Urban Planning and Development,ย 151(3), 05025018.

Sharma, S. N., Kumar, A., & Dehalwar, K. (2024). The Precursors of Transit-oriented Development.ย EPW Economic & Political Weekly,ย 59(16), 14.

Sharma, S. N. (2019). Review of most used urban growth models.ย International Journal of Advanced Research in Engineering and Technology (IJARET),ย 10(3), 397-405.

Van Acker, V., Van Wee, B., & Witlox, F. (2010). When transport geography meets social psychology: toward a conceptual model of travel behaviour.ย Transport reviews,ย 30(2), 219-240.

Wardman, M. (1988). A comparison of revealed preference and stated preference models of travel behaviour.ย Journal of transport economics and policy, 71-91.

Other Avenues for Internships in Architecture and Planning

Daily writing prompt
Do you vote in political elections?

Beyond prestigious institutes like IITs, NITs, and SPAs, Architecture and Planning students in India have access to a broad range of internship opportunities through external organizations. These opportunities offer hands-on exposure to real projects, regulatory processes, community engagement, and professional workflows. Hereโ€™s a detailed look at some of the key avenues:


1. Development Authorities

Development authorities play a pivotal role in regional and urban planning. They offer internships that allow students to engage with policy implementation, land use planning, infrastructure development, and regulatory processes.

Popular organizations include:

  • Delhi Development Authority (DDA)
  • Mumbai Metropolitan Region Development Authority (MMRDA)
  • Bangalore Development Authority (BDA)
  • Hyderabad Urban Development Authority (HUDA)

Key internship tasks:

  • Preparing and reviewing master plans and zoning regulations
  • Working on GIS and spatial data analysis
  • Conducting surveys and stakeholder consultations
  • Exposure to urban renewal and slum rehabilitation projects

2. Municipal Corporations and Urban Local Bodies

Municipalities provide real-world exposure to urban management and planning at the grassroots level. Internships here can be especially insightful for students interested in public administration, urban governance, and service delivery systems.

Notable examples:

  • Municipal Corporation of Greater Mumbai (MCGM)
  • New Delhi Municipal Council (NDMC)
  • Chennai and Pune Municipal Corporations

Typical roles and learning areas:

  • Solid waste management and sanitation planning
  • Housing and infrastructure development
  • Urban mobility planning and public transport systems
  • Smart city mission implementation

3. Architecture and Planning Firms

Private firms offer dynamic and professionally structured internships, often exposing students to the design-to-delivery process. These internships are essential for building portfolios and gaining industry-relevant skills.

Types of firms:

  • Architectural Design Studios: Focused on residential, commercial, and institutional projects (e.g., Morphogenesis, Sanjay Puri Architects)
  • Urban and Regional Planning Consultancies: Involved in master planning, land use policy, and feasibility studies (e.g., IPE Global, CRISIL Infrastructure Advisory)
  • Multidisciplinary firms: Combining architecture, engineering, and planning (e.g., HCP Design, L&T, AECOM, Jacobs)

Common internship exposure:

  • CAD and BIM modeling
  • Site visits and project documentation
  • Client presentations and concept development
  • Urban analytics, transport planning, and policy drafting (for planning students)

4. NGOs and Think Tanks

Internships with non-governmental organizations and research institutes allow students to work on social housing, heritage conservation, sustainable development, and community planning.

Examples include:

  • Centre for Science and Environment (CSE)
  • Centre for Policy Research (CPR)
  • INTACH (Indian National Trust for Art and Cultural Heritage)
  • Urban Design Research Institute (UDRI)

These internships are ideal for those inclined toward research, advocacy, and policy-related roles in urban development.


Conclusion

In addition to premier academic institutions, Architecture and Planning students can gain invaluable field experience by interning with development authorities, municipal bodies, private firms, and NGOs. Each type of internship serves different career goalsโ€”be it design, policy, research, or public administrationโ€”and helps students develop a holistic understanding of the built environment.

Internship Opportunities for Architecture and Planning Students

Daily writing prompt
What gives you direction in life?

The Indian Institutes of Technology (IITs), National Institutes of Technology (NITs), and Schools of Planning and Architecture (SPAs) are some of the most prestigious technical and design institutions in India. These institutes play a crucial role in shaping the future of Architecture and Planning students by offering high-quality education, exposure to advanced research, and robust internship opportunities.

Internship Opportunities for Architecture and Planning Students

1. Indian Institutes of Technology (IITs)

Many IITs, such as IIT Kharagpur, IIT Roorkee, and IIT Delhi, offer specialized programs in Architecture and Planning. These institutes often have strong industry ties and international collaborations that translate into meaningful internship opportunities.

Students may intern:

  • On-campus under professors working on government or industrial consultancy projects.
  • With research labs on urban development, sustainable design, transport planning, smart cities, etc.
  • Through international exchange programs, where IITs partner with global universities.
  • Via alumni networks or career development cells that connect students with architectural firms and planning consultancies.

2. National Institutes of Technology (NITs)

NITs like NIT Calicut, NIT Trichy, and NIT Bhopal offer undergraduate and postgraduate courses in Architecture and Planning. These institutions emphasize practical training as part of the curriculum.

Internships facilitated by NITs include:

  • Summer training with public sector units (PSUs) such as CPWD, NBCC, or urban development authorities.
  • Placement in private architectural firms and urban planning consultancies, often facilitated by training and placement offices.
  • Participation in government-funded research and infrastructure projects, especially in smart city initiatives and regional development plans.

3. Schools of Planning and Architecture (SPAs)

SPAs, including SPA Delhi, SPA Bhopal, and SPA Vijayawada, are dedicated institutions focusing exclusively on architecture, planning, and design. Their specialized nature often makes them highly integrated with the professional community.

Internship opportunities from SPAs include:

  • Mandatory academic internships, typically 6-8 weeks, often required for degree completion.
  • Industry tie-ups with leading architectural firms, real estate developers, and NGOs.
  • Collaborations with international institutions for research-based internships or joint studios.
  • Government projects and urban policy initiatives, where students work on real-world issues like transportation networks, housing policies, and heritage conservation.

Conclusion

Internship opportunities from IITs, NITs, and SPAs provide Architecture and Planning students with vital practical experience, exposure to real-world challenges, and a platform to apply theoretical knowledge. These internships not only help students build portfolios but also open doors to future job prospects, higher education, and research avenues.

Slum Upgradation and In-situ Slum Rehabilitation: Approaches to Urban Housing Challenges

Daily writing prompt
What are your favorite emojis?

By Kavita Dehalwar

Introduction

Urbanization, while driving economic growth, has also led to significant challenges, particularly the proliferation of slums. Slums are characterized by poor housing, lack of basic services, overcrowding, and insecure tenure. Governments, urban planners, and development agencies have devised several strategies to address these issues, with Slum Upgradation and In-situ Slum Rehabilitation (ISSR) being two of the most widely adopted approaches. Each method seeks to improve the living conditions of slum dwellers while minimizing displacement and disruption.


Understanding Slums: The Context

Before diving into specific approaches, it is crucial to understand why slums exist:

  • Rapid Urbanization: Cities grow faster than they can build adequate housing.
  • Rural-Urban Migration: Migrants seek better livelihoods but often can’t afford formal housing.
  • Ineffective Urban Planning: Lack of inclusive planning excludes low-income populations.
  • Land Market Distortions: High land prices and regulations push the poor into informal settlements.

Given these factors, slum management strategies must balance livelihood preservation, community networks, and housing improvements.


Slum Upgradation

Definition

Slum Upgradation refers to the process of improving the existing physical, social, and economic conditions of slum settlements without displacing the residents. Instead of demolishing the slums, the focus is on providing basic services, enhancing infrastructure, securing tenure, and promoting community participation.

Key Features

  • On-site Improvements: Roads, drainage, sanitation, water supply, electricity, and waste management are upgraded.
  • Tenure Security: Residents are often given legal recognition or property rights to reduce the risk of eviction.
  • Community Participation: Residents are involved in planning and execution to ensure solutions match their needs.
  • Cost-effectiveness: Upgradation is often cheaper than demolition and reconstruction.
  • Incremental Housing: Households are encouraged to gradually improve their dwellings over time with support services.

Advantages

  • Minimal Disruption: Residents maintain social ties and access to livelihoods.
  • Cost-Effective: Lower than constructing new housing projects.
  • Empowerment: Strengthens community self-help initiatives.
  • Preservation of Urban Fabric: Retains the organic settlement patterns, often vital for the city’s informal economy.

Challenges

  • Land Ownership Issues: Upgrading land without clear ownership titles can be legally complex.
  • Resistance from Landowners: Particularly when slums occupy valuable urban land.
  • Technical Constraints: In highly congested areas, infrastructure upgrades are physically difficult.
  • Risk of Gentrification: Post-upgrade, areas may attract investment leading to displacement of original residents.

In-situ Slum Rehabilitation (ISSR)

Definition

In-situ Slum Rehabilitation involves the redevelopment of slum areas on the same land where they are located, typically by demolishing existing structures and constructing formal housing, often multi-story buildings, for the original inhabitants.

In India, ISSR has been a key component of the Pradhan Mantri Awas Yojana (Urban) mission.

Key Features

  • Private-Public Partnerships (PPPs): Developers are incentivized (e.g., through additional land rights or subsidies) to build housing for slum dwellers.
  • Free Housing for Slum Dwellers: Eligible families are provided with formal, legally recognized housing units.
  • Vertical Living: High-rise apartment complexes replace horizontal slum settlements.
  • Infrastructure Development: Comprehensive amenities such as sewage, roads, and green spaces are incorporated.
  • Cross-subsidization: Developers sell part of the developed land at market rates to fund the rehabilitation.

Advantages

  • Formalization of Housing: Residents gain legal titles, improving tenure security.
  • Efficient Land Use: Vertical construction frees up land for urban infrastructure or commercial use.
  • Improved Living Conditions: Proper sanitation, clean water, and durable housing are provided.
  • Urban Renewal: Contributes to aesthetic and environmental improvements in cities.

Challenges

  • Community Disruption: High-rises can weaken community bonds formed in low-rise, close-knit slums.
  • Livelihood Impact: Resettlement often disrupts informal economic activities carried out within or near homes.
  • Quality Concerns: Poor construction standards or maintenance can create “vertical slums.”
  • Eligibility and Exclusion: Only those meeting eligibility criteria (e.g., proof of residency before a cut-off date) benefit, leaving many behind.
  • Developer-Driven Models: Profit motives can sometimes prioritize commercial interests over community needs.

Comparative Overview

AspectSlum UpgradationIn-situ Slum Rehabilitation
ApproachImprove existing structures and servicesDemolish and rebuild formal housing on-site
Resident DisplacementMinimalTemporary displacement during construction
CostRelatively lowHigher (due to complete reconstruction)
Social NetworksMaintainedOften disrupted
Main BeneficiariesEntire community, even informal residentsEligible families with proper documentation
Risk FactorsLand tenure issues, overcrowdingExclusion, community alienation, vertical slum creation

Conclusion

Both Slum Upgradation and In-situ Slum Rehabilitation are crucial approaches to addressing urban housing challenges, but they operate under different philosophies.

  • Upgradation seeks to empower communities by improving what already exists, respecting social structures, and minimizing displacement.
  • In-situ rehabilitation aims to formalize and modernize slum areas but risks alienating residents from their traditional ways of life.

A nuanced, context-specific strategy is essential โ€” in some cases, upgrading may be preferable; in others, rehabilitation may be necessary. Importantly, the success of either approach hinges on community participation, transparent governance, social equity, and long-term sustainability.

Ultimately, the goal should not merely be to remove slums but to create inclusive cities where everyone, regardless of their socio-economic background, can live with dignity and opportunity.

References

Iweka, A. C., & Adebayo, A. K. (2015). Global slum upgrading practices: identifying the contemporary challenges.ย Journal of Construction Project Management and Innovation,ย 5(1), 1034-1044.

Ohls Aigbavboa, C., & Thwala, W. D. (2010). Lessons learned from in situ upgrading and eradication of informal settlement in Gauteng Province in South Africa.ย International Journal of Housing Markets and Analysis,ย 3(3), 233-244.

Sharma, S. N. (2020). Evaluation of Implementation of Pradhan Mantri Awas Yojana (Urban).ย Think India Journal23,ย 1, 1-13.

Shreevidya, G., Moogi, V. V., & Kelkar, A. A. (2018). An Overview of Slum Rehabilitation by In-Situ Technique.

Sharma, S. N. (2013).ย Participatory Planning in Practice. Lulu. com.

Sharma, S. N. (2005). Evaluation of the JnNURM Programme of Government of India for Urban Renewal.ย Think India Journal,ย 8(2), 1-7.

Sharma, S. N. (2014).ย Participatory Planning in Plan Preparation. BookCountry.

Vaid, U. (2023). Physical and mental health impacts of housing improvement: A quasi-experimental evaluation of in-situ slum redevelopment in India.ย Journal of environmental psychology,ย 86, 101968.

Caste and Class Systems – A Sociological Interpretations

Daily writing prompt
What topics do you like to discuss?

By Kavita Dehalwar

Introduction

Human societies, since their inception, have organized themselves into hierarchies. Two fundamental systems by which people have been historically classified are the caste system and the class system. Each system structures social relations and individual identities differently, particularly in how they handle status: ascribed versus achieved. Understanding the difference between ascribed and achieved status helps us appreciate the dynamics of privilege, mobility, and inequality that persist across societies.

Caste System: A Structure of Ascribed Status

The caste system is a rigid, hereditary social order. It is most famously associated with India, but caste-like systems have existed elsewhere too, including in medieval Europe (feudal estates) and among certain African and East Asian societies.

Key Features of the Caste System:

  • Hereditary: Membership is assigned at birth.
  • Immutable: One’s caste generally cannot be changed over a lifetime.
  • Endogamy: Marriage occurs strictly within the same caste.
  • Occupation: Often linked to caste, determining the work one can perform.
  • Religious sanction: Often supported by religious or philosophical justifications.

Ascribed Status in the Caste System

Ascribed status refers to the social position a person is born into, without choice or effort. In a caste system, status is entirely ascribed. For example, being born into a Brahmin family (priestly class in Hinduism) bestows honor and authority regardless of personal achievement. Conversely, being born into a Dalit (formerly known as “Untouchable”) family imposes social stigma and exclusion, no matter the individual’s talents or efforts.

The caste system, therefore, limits social mobility almost completely, maintaining social stratification across generations.


Class System: A More Fluid Hierarchy

The class system, prominent in industrial and post-industrial societies (such as in Europe, the Americas, and parts of Asia), is based on economic position and other social factors like education and occupation.

Key Features of the Class System:

  • Economic Basis: Wealth, income, education, and occupational prestige are central.
  • Relative Fluidity: Individuals can move up or down the class ladder (social mobility).
  • Achievement and Merit: While inequalities exist, personal effort can change oneโ€™s social standing.

Achieved Status in the Class System

Achieved status refers to a social position that a person attains largely through their own efforts, choices, talents, and accomplishments. For instance, a person born into a working-class family who becomes a successful entrepreneur exemplifies achieved status.

Although class systems promote meritocracy โ€” the idea that talent and effort should determine social standing โ€” structural barriers like systemic racism, unequal access to education, and inherited wealth still make upward mobility difficult for many.

Thus, while class systems theoretically allow for mobility through achieved status, in reality, ascribed advantages (such as family wealth or social connections) still heavily influence outcomes.


Intersection of Ascribed and Achieved Status

In practice, caste and class characteristics often intertwine. Even in a class-based society:

  • Race, ethnicity, gender, and family background (forms of ascribed status) significantly affect life chances.
  • Achievements can be constrained or boosted by oneโ€™s ascribed traits.

Similarly, in caste societies undergoing modernization (like India), economic liberalization and education have created new opportunities for individual achievement, though caste-based discrimination persists in subtler forms.

Thus, no society is purely ascriptive or purely achievement-based โ€” both factors usually coexist in complex ways.


Comparative Overview

AspectCaste SystemClass System
Basis of stratificationBirth and hereditary occupationEconomic position, education, and achievements
Social MobilityVery limitedPossible (both upward and downward)
Status TypeAscribedPrimarily achieved, but also influenced by ascription
Marriage PracticesEndogamy (within caste)Generally exogamous, though class endogamy still exists informally
Persistence across generationsHighMedium to High (depending on societal structure)

Conclusion

The concepts of ascribed status and achieved status are crucial to understanding social hierarchies. The caste system is emblematic of ascribed status, where birth predetermines oneโ€™s entire life trajectory. The class system, while more fluid and centered around achieved status, still reveals the lingering power of ascribed traits.

As societies evolve, the tension between inherited privilege and earned success continues to shape debates around fairness, opportunity, and justice. Understanding these dynamics is essential for envisioning a more equitable world where individual potential, rather than accident of birth, determines destiny.

References

Kosambi, D. D. (1944). Caste and class in India.ย Science & Society, 243-249.

Mukherjee, R. (1999). Caste in itself, caste and class, or caste in class.ย Economic and political weekly, 1759-1761.

Olcott, M. (1944). The caste system of India.ย American Sociological Review, 648-657.

Sharma, K. L. (1984). Caste and class in India: Some conceptual problems.ย Sociological Bulletin,ย 33(1-2), 1-28.

Ranadive, B. T. (1979). Caste, class and property relations.ย Economic and Political Weekly, 337-348.

Sharma, S. N. Differences Between Caste System and Class System.

Gentrification and Its Impact on the Social Fabric of Urban Settlements

Daily writing prompt
If you had the power to change one law, what would it be and why?

By Kavita Dehalwar

Gentrification is a complex and often controversial process in which urban neighborhoods experience economic and social transformation. Typically, this involves an influx of wealthier residents, increased property values, and shifting cultural dynamics. While some view gentrification as a means of urban renewal that brings investment and improvement to deteriorating neighborhoods, others criticize it for displacing long-standing residents and eroding the cultural identity of communities. This article explores the causes, consequences, and broader implications of gentrification on the social fabric of urban settlements.

Understanding Gentrification

Gentrification is driven by multiple factors, including urban redevelopment policies, real estate speculation, and an increasing desire among middle- and upper-class individuals to live in historically marginalized neighborhoods. The process often begins when artists, young professionals, and entrepreneurs move into affordable urban areas, making them trendy and desirable. As demand grows, property values and rent prices rise, leading to demographic shifts that can have profound social consequences.

Socioeconomic Impact

One of the most immediate effects of gentrification is the displacement of low-income residents. Rising rents and property taxes make it difficult for long-term residents to afford to stay in their homes, forcing them to relocate to less expensive, often less accessible areas. This displacement can contribute to increased homelessness and socioeconomic instability, disrupting the lives of those who have built their communities over generations.

On the other hand, gentrification can bring economic benefits, such as improved infrastructure, better public services, and increased business investment. New businesses, restaurants, and cultural institutions often emerge, leading to job creation and enhanced amenities. However, these benefits are not always equitably distributed, with wealthier newcomers reaping the most rewards while poorer residents struggle to adapt.

Cultural and Social Disruptions

Gentrification alters the cultural landscape of urban neighborhoods, often diluting or erasing the historical and ethnic identity of these communities. Long-standing businesses, community centers, and places of worship may be forced to close due to rising costs, breaking down social networks that have provided support and cohesion for generations. The influx of wealthier residents can also lead to a cultural clash, with differences in lifestyle, values, and social engagement creating tensions between old and new inhabitants.

Changes in Political Representation

As demographics shift, so does political representation. Gentrified areas often see a change in voting patterns and policy priorities, with new residents advocating for different urban policies than those of long-term residents. This shift can result in policies that favor further development and real estate investment, sometimes at the expense of affordable housing and social welfare programs.

Resistance and Community Activism

Despite its challenges, many communities resist gentrification through grassroots activism and policy advocacy. Rent control measures, affordable housing initiatives, and community land trusts have been used to mitigate displacement and preserve the character of neighborhoods. Local organizations also work to amplify the voices of long-term residents, ensuring they have a say in the future of their communities.

Conclusion

Gentrification is a double-edged sword, bringing both revitalization and displacement to urban areas. While it can lead to economic growth and improved infrastructure, it often comes at the cost of social cohesion and cultural heritage. A balanced approachโ€”one that prioritizes affordable housing, community engagement, and inclusive urban planningโ€”is essential to ensuring that the benefits of gentrification are shared equitably among all residents. Only through mindful and equitable development strategies can cities preserve the diversity and vibrancy that make urban life so rich and dynamic.

References

Dehalwar, K., & Sharma, S. N. (2024). Politics in the Name of Womenโ€™s Reservation.ย Contemporary Voice of Dalit, 2455328X241262562.

Dehalwar, K., & Sharma, S. N. (2024). Social Injustice Inflicted by Spatial Changes in Vernacular Settings: An Analysis of Published Literature.

Lees, L., Slater, T., & Wyly, E. (2013).ย Gentrification. Routledge.

Ogbanga, M. M. (2024). Assessment of the Barriers to the Adoption of Clean Energy for Household Cooking in Okrika Local Government Area.

Ogbanga, M. M., & Bukie, B. F. (2024). Traditional Institutions and Conflict Resolution in Nigeria: A Social Work Analysis.

Ogbanga, M. M. (2024). Examining the Potential of Women Organisations in Promoting the Use of Clean Energy for Household Cooking; A Study of Okrika Local Government Area.

Ogbanga, M. M. (2024). Migration and Transformation: Understanding the Impact on Destination Countries in the Age of Mobility.

Ogbanga, M. M. (2024). Analyzing the Impact of Policy Reforms on Vulnerable Populations: A Comparative Study Case study of Social Welfare of River State.

Ogbanga, M. M. (2024). The Coping Mechanisms Employed by Youths in Response to Climate Change-Related Stressors.

Shaw, K. (2008). Gentrification: What it is, why it is, and what can be done about it.ย Geography Compass,ย 2(5), 1697-1728.

Sharma, S. N. Sustainable Transit-Oriented Development: A Solution to Urban Congestion.

Zukin, S. (1987). Gentrification: culture and capital in the urban core.ย Annual review of sociology,ย 13(1), 129-147.

Climate Change and Feminist Environmentalism

Daily writing prompt
What is the greatest gift someone could give you?

By Kavita Dehalwar

Climate change is one of the most pressing challenges facing humanity. It encompasses a wide range of issues, including rising temperatures, shifting weather patterns, melting glaciers, and increasing natural disasters. While its effects are global, they are not equally distributed, disproportionately affecting marginalized communities, particularly women in developing regions. Feminist environmentalism offers a critical lens to understand and address these inequities, integrating gender justice into the broader framework of environmental sustainability.


The Interplay Between Climate Change and Gender

The impacts of climate change are intricately tied to existing social and economic inequalities. Women, especially those in rural and marginalized communities, often rely on natural resources for their livelihoods, making them more vulnerable to environmental changes. For instance:

  1. Agricultural Dependency: Women constitute a significant proportion of the agricultural workforce in many developing countries. Erratic rainfall and prolonged droughts threaten crop yields, directly impacting their income and food security.
  2. Water Scarcity: Women are frequently responsible for water collection in many societies. Climate-induced water shortages force them to travel longer distances, exposing them to physical strain and potential violence.
  3. Displacement: Climate disasters often lead to displacement, and women in refugee settings face unique challenges, including inadequate healthcare, limited access to education, and heightened risk of gender-based violence.

These examples underline how climate change is not just an environmental issue but also a social one, with profound implications for gender equality.


Feminist Environmentalism: A Transformative Approach

Feminist environmentalism bridges the gap between environmental and gender justice, emphasizing that sustainable solutions must address the structural inequalities that perpetuate both environmental degradation and gender oppression. This approach is rooted in several key principles:

  1. Intersectionality: Feminist environmentalism recognizes the interconnectedness of various forms of oppression, such as race, class, and gender. For example, Indigenous women are often at the forefront of climate activism because their communities bear the brunt of resource exploitation and ecological destruction.
  2. Empowerment and Agency: Women must be seen not merely as victims of climate change but as agents of change. Programs that empower women to participate in environmental decision-making lead to more equitable and effective solutions. For instance, studies show that women’s involvement in forest management improves conservation outcomes.
  3. Care Ethics: Feminist perspectives highlight the value of care ethics in addressing environmental crises. This approach prioritizes nurturing relationships between humans and nature, moving away from extractive models of development.

Contributions of Women to Climate Action

Women have been pivotal in leading grassroots movements and advocating for climate justice:

  • Wangari Maathai: The Kenyan environmentalist and Nobel laureate founded the Green Belt Movement, which empowered women to plant trees, combat deforestation, and advocate for sustainable development.
  • Greta Thunberg: The young Swedish activist has galvanized global attention to the climate crisis, inspiring millions to demand urgent action from policymakers.
  • Indigenous Women Leaders: Across the globe, Indigenous women are defending their lands and advocating for the preservation of biodiversity, often at great personal risk.

These examples demonstrate the critical role women play in shaping a sustainable future.


Policy Recommendations for Integrating Feminist Environmentalism

To create a just and sustainable world, policymakers must incorporate feminist perspectives into climate strategies. Key recommendations include:

  1. Gender-Inclusive Climate Policies: Policies should address the unique vulnerabilities of women and ensure their participation in decision-making processes. For example, allocating resources for women’s education and training in sustainable practices can build resilience in vulnerable communities.
  2. Support for Women-Led Initiatives: Governments and international organizations should provide funding and technical support to women-led environmental projects. This not only fosters innovation but also ensures that solutions are tailored to local contexts.
  3. Legal Protections: Strengthening legal frameworks to protect women environmental defenders from violence and harassment is crucial for sustaining their advocacy efforts.
  4. Intersectional Data Collection: Collecting and analyzing gender-disaggregated data on climate impacts can help identify specific challenges and tailor interventions accordingly.

Conclusion

Climate change is not a gender-neutral phenomenon. Addressing it requires a nuanced understanding of the intersection between environmental degradation and social inequalities. Feminist environmentalism provides a powerful framework to tackle these challenges holistically, advocating for a world that values both ecological sustainability and gender justice. By empowering women and embracing inclusive policies, we can forge a path toward a more equitable and resilient future.

References

Amadi, L. A., Ogbanga, M. M., & Agena, J. E. (2015). Climate change and feminist environmentalism in the Niger Delta, Nigeria.ย African Journal of Political Science and International Relations,ย 9(9), 361-371.

Amadi, L., Wordu, S., & Ogbanga, M. (2015). Sustainable Development in Crisis? A Post Development Perspective.ย Journal of Sustainable Development in Africa,ย 17(1), 140-163.

Brick, P., & Cawley, R. M. (2008). Producing political climate change: the hidden life of US environmentalism.ย Environmental Politics,ย 17(2), 200-218.

Gilley, B. (2012). Authoritarian environmentalism and China’s response to climate change.ย Environmental politics,ย 21(2), 287-307.

Ogbanga, M. M. (2024).ย Oil, Gender and Unemployment: Social Issues in the Niger. Eduindex.

Pulver, S. (2007). Making sense of corporate environmentalism: An environmental contestation approach to analyzing the causes and consequences of the climate change policy split in the oil industry.ย Organization & environment,ย 20(1), 44-83.

Wright, C., & Nyberg, D. (2012). Working with passion: Emotionology, corporate environmentalism and climate change.ย Human Relations,ย 65(12), 1561-1587.

Job Prospects in Machine Learning: A Comprehensive Guide

Daily writing prompt
What was the last thing you did for play or fun?

The field of Machine Learning (ML) is one of the most exciting and rapidly evolving domains in technology. With advancements in artificial intelligence, automation, and data science, the demand for skilled machine learning professionals has surged across industries. This article delves into the job prospects in machine learning, the skills required, the industries hiring, and future trends.


Why Machine Learning is in Demand

Machine Learning, a subset of Artificial Intelligence (AI), enables systems to learn from data and improve over time without explicit programming. Its applications span numerous fields such as healthcare, finance, e-commerce, and autonomous vehicles, driving innovation and efficiency. The global shift towards automation, data-driven decision-making, and intelligent systems has created a significant demand for ML professionals.

Key factors driving demand:

  1. Explosion of Data: The massive growth of data from IoT devices, social media, and digital platforms requires sophisticated models to extract insights.
  2. Advancements in Computing Power: With more accessible and powerful GPUs and cloud computing, ML solutions are becoming increasingly viable.
  3. Cross-Industry Applications: From personalized recommendations to predictive maintenance, ML is transforming businesses.

Career Opportunities in Machine Learning

1. Data Scientist

  • Role: Use machine learning algorithms to analyze and interpret complex datasets.
  • Skills: Python/R, TensorFlow, statistical modeling, data visualization.
  • Industries: E-commerce, finance, healthcare, social media.

2. Machine Learning Engineer

  • Role: Develop, implement, and optimize machine learning models.
  • Skills: Proficiency in ML frameworks (Scikit-learn, PyTorch), software engineering, distributed computing.
  • Industries: Tech companies, startups, robotics.

3. AI Research Scientist

  • Role: Conduct research to develop new algorithms and advance ML techniques.
  • Skills: Deep learning, neural networks, mathematics, programming.
  • Industries: Research labs, universities, tech giants.

4. Business Intelligence Analyst

  • Role: Leverage ML to create actionable insights and improve business strategies.
  • Skills: Data analysis, SQL, business acumen, ML algorithms.
  • Industries: Retail, consulting, marketing.

5. NLP Specialist

  • Role: Work on language-based applications like chatbots, sentiment analysis, and translation tools.
  • Skills: Natural Language Processing, linguistics, deep learning.
  • Industries: Customer service, content management, social platforms.

6. Robotics Engineer

  • Role: Design and build intelligent systems for autonomous robots.
  • Skills: Robotics, reinforcement learning, control systems.
  • Industries: Manufacturing, defense, healthcare.

7. Autonomous Vehicle Engineer

  • Role: Develop systems for self-driving cars, including computer vision and sensor fusion.
  • Skills: Computer vision, C++, SLAM algorithms.
  • Industries: Automotive, transportation.

8. Cybersecurity Analyst

  • Role: Implement ML to predict and prevent cybersecurity threats.
  • Skills: Anomaly detection, intrusion prevention, ethical hacking.
  • Industries: IT, finance, government.

Skills Required for Machine Learning Careers

To build a successful career in machine learning, aspiring professionals need a blend of technical and soft skills:

Technical Skills

  1. Programming Languages: Python, R, Java, and C++.
  2. Mathematics: Linear algebra, calculus, probability, and statistics.
  3. Data Handling: Proficiency in SQL, Pandas, and NumPy.
  4. ML Algorithms: Familiarity with supervised, unsupervised, and reinforcement learning.
  5. Frameworks and Tools: TensorFlow, Keras, PyTorch, Scikit-learn.
  6. Big Data Technologies: Hadoop, Spark, and Kafka.

Soft Skills

  1. Problem-Solving: Ability to identify and solve complex real-world problems.
  2. Communication: Articulate technical findings to non-technical stakeholders.
  3. Adaptability: Stay updated with the latest trends and technologies.

Industries Hiring Machine Learning Professionals

Machine learning professionals are in demand across various sectors:

  1. Technology: Google, Amazon, Microsoft, Facebook.
  2. Finance: Fraud detection, algorithmic trading, credit risk analysis.
  3. Healthcare: Medical imaging, drug discovery, personalized medicine.
  4. Retail and E-commerce: Recommendation systems, inventory optimization.
  5. Manufacturing: Predictive maintenance, quality control.
  6. Media and Entertainment: Content recommendation, video/audio processing.

Future Trends in Machine Learning Careers

  1. Explainable AI (XAI): Demand for ML professionals who can create interpretable models.
  2. Edge AI: Increased need for ML expertise in IoT and edge computing.
  3. Hybrid Roles: Interdisciplinary skills combining ML with fields like genomics or environmental science.
  4. AI Ethics: Specialists ensuring fairness, accountability, and transparency in ML models.

Conclusion

The job prospects in machine learning are vast and growing. As businesses and industries continue to adopt AI-driven solutions, the need for skilled professionals will only increase. For those with a passion for technology and innovation, a career in machine learning offers an exciting and lucrative pathway.

Whether you’re a recent graduate or a professional looking to pivot, now is the time to invest in developing machine learning skills and embrace a future shaped by intelligent systems.

The Top Management Software Popular for HR

Daily writing prompt
List your top 5 grocery store items.

Human Resources (HR) departments play a critical role in ensuring an organizationโ€™s workforce operates efficiently, ethically, and productively. With the increasing complexity of managing employees, HR professionals rely heavily on robust software solutions to streamline processes such as recruitment, payroll, performance evaluation, and compliance. In this article, we delve into the most popular HR management software, their features, and why they are essential for modern organizations.


1. Workday

Overview:

Workday is a cloud-based HR management software that provides a wide range of tools for workforce planning, talent management, and payroll operations. It is known for its intuitive user interface and data-driven insights.

Key Features:

  • Human Capital Management (HCM): Comprehensive tools for workforce planning, hiring, and employee management.
  • Payroll Management: Global payroll capabilities to handle multi-country operations.
  • Talent Optimization: Performance tracking, learning management, and succession planning.
  • Analytics: Real-time data analytics and reporting for better decision-making.

Why Workday?

Workday is particularly favored by large enterprises because of its scalability and integration capabilities. Its predictive analytics help HR teams proactively address workforce challenges.

2. BambooHR

Overview:

BambooHR is a highly popular HR management software among small and medium-sized businesses (SMBs). It focuses on simplifying HR tasks with its user-friendly platform.

Key Features:

  • Employee Database: Centralized storage for all employee information.
  • Recruitment Tools: Applicant tracking and onboarding features.
  • Performance Management: Tools for setting goals, tracking achievements, and conducting performance reviews.
  • Time-Off Tracking: Easy management of employee leave requests and vacation schedules.

Why BambooHR?

Its affordability and ease of use make BambooHR a go-to solution for SMBs. Additionally, its strong emphasis on employee engagement and feedback sets it apart.

3. SAP SuccessFactors

Overview:

SAP SuccessFactors is a cloud-based suite designed for enterprises seeking advanced HR tools. Its integration with other SAP modules makes it a comprehensive enterprise solution.

Key Features:

  • Core HR and Payroll: Centralized employee data and seamless payroll processing.
  • Recruiting and Onboarding: Advanced candidate search and automated onboarding workflows.
  • Learning and Development: Tools for employee training, certification, and career development.
  • Workforce Analytics: Advanced tools for workforce planning and analytics.

Why SAP SuccessFactors?

This software is ideal for organizations already using SAP products. It excels in handling complex HR needs for global organizations.

4. ADP Workforce Now

Overview:

ADP Workforce Now is a robust HR software aimed at businesses of all sizes. It is particularly well-known for its payroll and compliance features.

Key Features:

  • Payroll Processing: Handles payroll efficiently, including tax compliance.
  • HR Management: Tools for benefits administration, employee self-service, and performance tracking.
  • Time and Attendance: Timecard tracking and workforce scheduling.
  • Compliance Support: Regular updates to ensure compliance with changing labor laws.

Why ADP Workforce Now?

ADPโ€™s longstanding reputation in payroll and compliance makes it a trusted solution. Its modular design also allows businesses to tailor it to their specific needs.

5. Zoho People

Overview:

Zoho People is part of the Zoho suite of business applications and is an excellent choice for small to medium-sized businesses.

Key Features:

  • Employee Management: Centralized database for employee records and personal details.
  • Time Tracking: Tools for attendance and timesheet management.
  • Performance Appraisals: Customizable appraisal systems for performance reviews.
  • Mobile App: Access HR functionalities on the go.

Why Zoho People?

Zoho People is known for its affordability and seamless integration with other Zoho applications, making it an excellent choice for companies already using the Zoho ecosystem.

Women Reservation in Private Jobs: A Path Toward Inclusive Growth

Daily writing prompt
What skills or lessons have you learned recently?

By Kavita Dehalwar

In recent years, the conversation around gender equality in workplaces has gained significant momentum globally. While governments and organizations have made progress in public-sector employment through reservations and affirmative actions, the private sector often lags behind in ensuring adequate representation for women. The idea of introducing women reservation policies in private jobs is gaining traction as a necessary step toward fostering inclusive economic growth and addressing gender disparities in employment.


The Current Status of Women in Private Employment

Globally, women represent nearly half of the population, but their participation in the workforce, especially in leadership and technical roles, remains disproportionately low. According to a 2023 report by the World Economic Forum, women occupy only 26.7% of leadership positions in the private sector. Factors such as lack of access to quality education, societal expectations, and workplace discrimination contribute to these disparities.

In India, for instance, the female labor force participation rate in the private sector is as low as 23.3% (as per 2022 statistics), far below the global average of 47%. Despite advances in education and skill development, women remain underrepresented, especially in high-paying and decision-making roles. This trend has significant implications for economic growth, as studies show that gender-diverse organizations perform better and contribute positively to GDP.


Why Women Reservation in Private Jobs is Necessary

  1. Addressing Systemic Discrimination
    Historical biases and social norms often marginalize women in private-sector hiring and promotions. By instituting reservation policies, companies can actively counter these biases and ensure fair representation in the workforce.
  2. Promoting Economic Growth
    Womenโ€™s participation in the workforce is directly linked to economic prosperity. A McKinsey study suggests that closing the gender gap in employment could add $12 trillion to global GDP by 2025. Reservation policies can serve as a catalyst for unlocking this potential.
  3. Reducing the Gender Pay Gap
    Women continue to earn less than men for the same roles, with a global pay gap of approximately 20%. By increasing the number of women in skilled and leadership positions, reservations can help narrow this gap.
  4. Fostering Innovation and Productivity
    Diverse teams are proven to be more innovative and productive. Women’s inclusion at all levels of private employment can bring fresh perspectives, enhance decision-making, and improve workplace culture.
  5. Achieving Social Equity
    Beyond economic considerations, reservation policies in private jobs promote social equity by empowering women and challenging patriarchal norms. It helps create role models for younger generations, inspiring them to pursue careers in diverse fields.

Challenges in Implementing Women Reservation in Private Jobs

While the benefits of women reservation are evident, its implementation in the private sector comes with challenges:

  1. Resistance from Employers
    Many private-sector employers may view reservation policies as interference in their hiring practices, fearing it could compromise meritocracy.
  2. Skill Gap
    Critics often point out that there is a mismatch between the skills women bring and the demands of certain roles. Addressing this requires parallel investments in education and vocational training.
  3. Workplace Culture
    Without supportive policies like maternity leave, flexible hours, and anti-harassment measures, women may find it difficult to sustain long-term careers in male-dominated industries, even with reservations.
  4. Legal and Policy Framework
    Unlike the public sector, the private sector operates on profit-driven motives, making it harder to enforce reservation policies without a robust legal framework.

Successful Models of Women Inclusion in Private Jobs

Several countries and companies have set examples in promoting womenโ€™s participation without formal reservation policies. For instance:

  • Nordic Countries: Through a combination of legislation and incentives, Nordic countries like Sweden and Norway have achieved nearly 40% female representation on corporate boards.
  • Diversity Quotas in Europe: Germany, France, and Italy have mandated gender quotas for boardrooms, leading to increased representation of women in leadership roles.
  • Corporate Initiatives: Companies like Unilever and TCS have introduced targeted programs to recruit, retain, and promote women, showcasing how private firms can take voluntary steps toward inclusivity.

How Women Reservation Can Work in Private Jobs

  1. Legislation and Incentives
    Governments can mandate a minimum percentage of jobs in the private sector be reserved for women, especially in industries where they are underrepresented. Tax benefits and other incentives can encourage compliance.
  2. Collaborative Skill Development Programs
    Partnerships between the government, private firms, and NGOs can help bridge the skill gap by providing vocational training tailored to industry demands.
  3. Setting Benchmarks for Inclusion
    Companies should be encouraged to publish annual diversity reports and set benchmarks for female representation at all levels.
  4. Supportive Workplace Policies
    Reservation should be complemented with policies that make workplaces more inclusive, such as mentorship programs, childcare facilities, flexible working hours, and robust anti-discrimination frameworks.
  5. Monitoring and Accountability
    Regular audits and assessments are necessary to ensure companies meet their targets for womenโ€™s reservation and genuinely improve workplace diversity.

The Road Ahead: Striking a Balance

Introducing women reservation in private jobs is not just about meeting quotas; itโ€™s about creating an ecosystem where women have equal opportunities to thrive. While legal mandates can kickstart the process, long-term success lies in building a culture of inclusivity and addressing systemic barriers. Governments, corporations, and civil society must work together to ensure these policies are both effective and sustainable.

As countries strive to achieve gender parity in all spheres of life, the private sector cannot remain an exception. Women reservation in private jobs is not just a moral imperative but also an economic and social necessity for a more equitable and prosperous future.

References

Bose, N., & Das, S. (2018). Political reservation for women and delivery of public works program.ย Review of Development Economics,ย 22(1), 203-219.

Dehalwar, K., & Sharma, S. N. (2024). Politics in the Name of Womenโ€™s Reservation.ย Contemporary Voice of Dalit, 2455328X241262562.

Dehalwar, K. Gender and Its Implications for Spatial Planning: Understanding the Impact. Track2Training

Kishwar, M. (2000). Equality of Opportunities vs Equality of Results: Improving Women’s Reservation Bill.ย Economic and Political Weekly,ย 35(47), 4151-4156.

Menon, N. (2000). Elusive’Woman’: feminism and women’s reservation bill.ย Economic and political weekly, 3835-3844.

Sharma, K. (2000). Power and representation: Reservation for women in India.ย Asian Journal of Women’s Studies,ย 6(1), 47-87.

Urban Design: Shaping the Future of Cities

Daily writing prompt
Have you ever performed on stage or given a speech?

By Kavita Dehalwar

Urban design is the interdisciplinary field that combines architecture, city planning, landscape architecture, and engineering to create functional, aesthetically pleasing, and sustainable urban environments. It is a critical discipline in shaping the future of cities, addressing challenges like population growth, climate change, and the need for more inclusive and equitable spaces.


1. What is Urban Design?

Urban design focuses on the large-scale organization and design of cities, towns, and communities. It encompasses the physical layout of neighborhoods, the arrangement of streets and public spaces, and the integration of buildings, infrastructure, and green spaces. Unlike architecture, which focuses on individual buildings, urban design deals with the broader spatial relationships between structures and their surroundings.


2. Key Principles of Urban Design

Urban design is guided by several core principles that ensure the creation of livable and sustainable urban environments:

  1. Connectivity: Creating well-connected transport systems and pedestrian pathways to enhance accessibility and reduce reliance on cars.
  2. Public Realm: Designing vibrant public spaces that encourage social interaction and community engagement.
  3. Sustainability: Incorporating eco-friendly designs, such as green roofs, energy-efficient buildings, and renewable energy sources, to minimize environmental impact.
  4. Resilience: Planning cities that can adapt to climate change, natural disasters, and economic shifts.
  5. Identity and Place-Making: Preserving cultural heritage while fostering a sense of belonging through unique and meaningful urban spaces.
  6. Inclusivity: Ensuring spaces are accessible and welcoming to people of all ages, abilities, and socio-economic backgrounds.

3. Components of Urban Design

Urban design involves several interconnected elements:

  1. Urban Structure: The arrangement of zones, including residential, commercial, and industrial areas, as well as transport and infrastructure networks.
  2. Public Spaces: Parks, plazas, streets, and other shared spaces that promote social interaction and enhance quality of life.
  3. Buildings: The design and placement of buildings influence the aesthetic and functional character of a city.
  4. Landscape: Incorporating natural elements such as trees, water bodies, and green belts to improve air quality and create appealing environments.
  5. Transport and Mobility: Designing systems that balance the needs of pedestrians, cyclists, public transport, and private vehicles.

4. Historical Evolution of Urban Design

Urban design has evolved significantly over centuries, reflecting changing societal needs, technologies, and cultural values:

  1. Ancient Cities: Cities like Mohenjo-Daro and Athens emphasized planned layouts, with streets, drainage systems, and public spaces.
  2. Medieval Period: Walled cities with organic layouts focused on defense and community cohesion.
  3. Industrial Revolution: Rapid urbanization led to overcrowded and polluted cities, prompting calls for better planning.
  4. Modernist Movements: In the 20th century, urban design embraced geometric layouts, zoning, and high-rise buildings, as seen in Le Corbusier’s Radiant City.
  5. Contemporary Approaches: Today, urban design emphasizes sustainability, inclusivity, and resilience, with smart cities

References

Adams, D., & Tiesdell, S. (2012).ย Shaping places: urban planning, design and development. Routledge.

Anttiroiko, A. V. (2013). U-cities reshaping our future: reflections on ubiquitous infrastructure as an enabler of smart urban development.ย AI & society,ย 28, 491-507.

Carmona, M. (2014). The place-shaping continuum: A theory of urban design process.ย Journal of Urban Design,ย 19(1), 2-36.

Dehalwar, K., & Sharma, S. N. (2023). Fundamentals of Area Appreciation and Space Perceptions.

Kumar, G., Vyas, S., Sharma, S. N., & Dehalwar, K. (2023). Planning and Development of Housing in Urban Fringe Area: Case of Bhopal (MP).ย GIS Business,ย 18(1), 1-14.

Palma Andrรฉs, J. (2019). Modern Cities Need a Vision to Shape Their Future.ย City Policies and the European Urban Agenda, 21-65.

Sepe, M. (2020). Shaping the future: perspectives in research on, and the teaching of, urban design.ย Journal of Urban Design,ย 25(1), 28-31.

Sharma, S. N., & Dehalwar, K. (2023). Fundamentals of Planning and Design of Housing.

What is a Technical Paper

Daily writing prompt
What’s your favorite cartoon?

By Kavita Dehalwar

A technical paper is a specialized document that presents detailed information about a specific topic, often related to scientific research, engineering, technology, or other technical disciplines. These papers serve as a medium for researchers, professionals, and academics to share new findings, ideas, methodologies, or technologies with a targeted audience. Technical papers are characterized by their precision, depth of analysis, and reliance on data and evidence to support conclusions.


Purpose of a Technical Paper

The primary purpose of a technical paper is to:

  1. Contribute to Knowledge: Disseminate new research findings, innovations, or advancements in a specific field.
  2. Solve Problems: Address technical challenges or propose solutions based on research or experimentation.
  3. Educate and Inform: Provide detailed explanations of complex concepts, making them accessible to other experts or practitioners in the field.
  4. Facilitate Collaboration: Foster knowledge-sharing among professionals, academics, and industry leaders.

Key Features of a Technical Paper

  1. Technical Rigor: A technical paper is grounded in accuracy, with well-defined methodologies and robust analysis. It relies on evidence, such as experimental results, theoretical models, or simulations.
  2. Clear Structure: Technical papers follow a standardized format that allows readers to easily navigate the content. This structure often includes an abstract, introduction, methodology, results, discussion, and conclusion.
  3. Specialized Audience: The language and depth of detail in a technical paper are tailored for a specific audience, such as engineers, scientists, or domain experts.
  4. Use of Visuals: Figures, graphs, charts, and tables are commonly used to present data and enhance understanding.
  5. Objective Tone: Technical papers avoid subjective opinions, focusing instead on evidence-based conclusions.

Components of a Technical Paper

  1. Title: A concise and descriptive title that conveys the main topic of the paper.
  2. Abstract: A brief summary of the paper, outlining the research problem, methods, key findings, and significance.
  3. Introduction:
    • Defines the problem or question being addressed.
    • Provides background information and context.
    • States the objectives of the study or research.
  4. Literature Review (if applicable):
    • Summarizes relevant research in the field.
    • Identifies gaps that the paper aims to address.
  5. Methodology:
    • Describes the methods, tools, or processes used to conduct the research.
    • Provides enough detail for replication of the study.
  6. Results:
    • Presents the findings of the study, often using visuals like graphs or tables.
    • Includes raw data, statistical analysis, or experimental outcomes.
  7. Discussion:
    • Interprets the results and explains their implications.
    • Compares findings with existing literature.
  8. Conclusion:
    • Summarizes key insights and contributions.
    • Highlights limitations and suggests directions for future research.
  9. References:
    • Lists all sources cited in the paper, formatted according to a standard style (e.g., APA, IEEE, or MLA).
  10. Appendices (if needed):
    • Includes supplementary material, such as raw data, mathematical derivations, or additional explanations.

Types of Technical Papers

  1. Research Papers: Present original findings or discoveries in a specific field.
  2. Review Papers: Summarize and synthesize existing research on a particular topic.
  3. White Papers: Explain technical topics, often from an industry perspective, and advocate for a specific solution or approach.
  4. Case Studies: Provide detailed accounts of real-world applications or projects.
  5. Standards Papers: Define guidelines, standards, or protocols for technology or processes.
  6. Tutorial Papers: Offer step-by-step instructions or educational content on a particular technique or methodology.

Importance of Technical Papers

  1. Advancing Innovation: By sharing new insights, technical papers drive innovation in science and technology.
  2. Building Expertise: They serve as a resource for professionals and students to deepen their knowledge.
  3. Peer Review and Validation: Technical papers often undergo peer review, ensuring the credibility and reliability of the work.
  4. Documentation and Record: They provide a permanent record of developments in a field, serving as a reference for future research.
  5. Facilitating Communication: Technical papers enable collaboration and communication across academia, industry, and government.

Writing a Technical Paper

  1. Plan and Research: Identify the key points, research thoroughly, and organize information logically.
  2. Draft and Edit: Write the paper in a clear, concise style. Review multiple drafts to refine the content.
  3. Use Visual Aids: Incorporate diagrams, tables, and charts to enhance clarity and support findings.
  4. Seek Feedback: Share the draft with colleagues or mentors for constructive feedback.
  5. Follow Guidelines: Adhere to formatting and submission guidelines specified by the intended publication or conference.

Common Challenges in Technical Paper Writing

  1. Complexity: Striking a balance between technical detail and readability can be challenging.
  2. Clarity: Avoiding jargon while maintaining precision requires careful word choice.
  3. Plagiarism: Proper citation of sources is crucial to avoid academic misconduct.
  4. Rejection: High standards in peer-reviewed journals mean many papers face rejection. Revisions and resubmissions are often part of the process.

Conclusion

Technical papers play a vital role in advancing knowledge and fostering innovation across technical and scientific fields. By adhering to rigorous standards and focusing on clarity, accuracy, and relevance, technical papers ensure the effective dissemination of information, enabling professionals and researchers to collaborate, innovate, and solve real-world problems. Whether contributing new findings or summarizing existing knowledge, technical papers are indispensable to the progression of technology and science.

References

Copeck, T., Barker, K., Delisle, S., Szpakowicz, S., & Delannoy, J. F. (1997). What is technical text?.ย Language Sciences,ย 19(4), 391-423.

Crowcroft, J. (2007). Net neutrality: the technical side of the debate: a white paper.ย ACM SIGCOMM Computer Communication Review,ย 37(1), 49-56.

Dehalwar, K., & Sharma, S. N. (2023).ย Fundamentals of Research Writing and Uses of Research Methodologies. Edupedia Publications Pvt Ltd.

Ehrenberg, A. S. C. (1982). Writing technical papers or reports.ย The American Statistician,ย 36(4), 326-329.

McConnell, S. (2002). How to write a good technical article.ย IEEE Softw.,ย 19(5), 5-7.

What is Practice-oriented Research Paper

Daily writing prompt
What could you do less of?

By Kavita Dehalwar

A practice-oriented paper is a type of academic or professional writing that focuses on the practical application of theories, research findings, or concepts to real-world problems or settings. Unlike purely theoretical or research-focused papers, practice-oriented papers aim to bridge the gap between knowledge and action by offering insights, methods, tools, or strategies that practitioners can implement.

Key Characteristics of Practice-Oriented Papers:

  1. Focus on Application:
    • Explains how concepts or findings can be applied in practical settings.
    • Often tailored to professionals or practitioners in a specific field (e.g., education, healthcare, engineering).
  2. Actionable Recommendations:
    • Includes specific steps, tools, or techniques for solving a problem or improving outcomes.
  3. Real-World Relevance:
    • Rooted in real-world challenges or case studies.
    • May draw on the author’s direct experience or data collected from practical scenarios.
  4. Clear and Accessible Language:
    • Written to be understandable by non-academic audiences, such as field professionals.
  5. Collaboration Between Theory and Practice:
    • Often links theoretical frameworks to their practical implementation.
    • Demonstrates how theoretical knowledge enhances practice.

Examples of Practice-Oriented Paper Topics:

  • In Education: “Strategies for Incorporating Technology into the Classroom for Enhanced Learning Outcomes.”
  • In Business: “Best Practices for Managing Remote Teams in a Post-Pandemic World.”
  • In Healthcare: “Implementing Evidence-Based Guidelines for Diabetes Management in Community Clinics.”

Common Formats:

  • Case studies.
  • How-to guides.
  • Policy briefs.
  • Reports on pilot programs or interventions.
  • Reflective essays based on practical experience.

Intended Audience:

The audience is usually professionals or stakeholders in the relevant field who are seeking actionable insights to improve their work, address challenges, or enhance effectiveness.

If you’re writing or using a practice-oriented paper, it’s essential to focus on actionable solutions and ensure that the content is both grounded in evidence and tailored to the practical needs of your audience.

References

Brem, A. (2024). Editorial Publishing in a Practice-Oriented Journal: Why and How You Should Do It.ย IEEE Engineering Management Review,ย 52(2), 6-8.

Castonguay, L. G., Atzil-Slonim, D., de Jong, K., & Youn, S. J. (2024). Practice-oriented research: An introduction to new developments and future directions.ย Administration and Policy in Mental Health and Mental Health Services Research,ย 51(3), 287-290.

Dehalwar, K., & Sharma, S. N. (2023).ย Fundamentals of Research Writing and Uses of Research Methodologies. Edupedia Publications Pvt Ltd.

Jonas, M., Littig, B., & Wroblewski, A. (Eds.). (2017).ย Methodological reflections on practice oriented theories. Springer.

Pettersen, I. N. (2015). Towards practice-oriented design for sustainability: the compatibility with selected design fields.ย International Journal of Sustainable Engineering,ย 8(3), 206-218.

Internship Opportunities for Architecture and Planning Students

Daily writing prompt
Do you ever see wild animals?

By Kavita Dehalwar

Training and internship opportunities are critical for architecture and planning students as they bridge academic learning with practical application, enhancing skills and preparing students for professional careers. Below is a detailed discussion of various opportunities available:


1. Architectural Firms and Planning Consultancies

  • Roles: Interns in architectural firms work on design projects, develop CAD drawings, create 3D models, and assist with project documentation. In planning consultancies, tasks might include urban analysis, zoning studies, and report preparation.
  • Skills Developed:
    • Technical proficiency in software such as AutoCAD, SketchUp, Revit, and GIS tools.
    • Understanding client requirements and project feasibility.
    • Exposure to real-world constraints like budget, materials, and regulations.
  • Opportunities:
    • International firms like Foster + Partners, Gensler, or AECOM.
    • Local firms with a strong portfolio in housing, urban design, or infrastructure projects.

2. Government and Public Sector Internships

  • Opportunities:
    • Urban Development Authorities: Departments like municipal corporations, urban development ministries, or city planning bodies often offer internships to students in city planning, housing, or transport planning.
    • Heritage Conservation Departments: Roles in documentation, restoration planning, and heritage management.
  • Example:
    • Internships with agencies like HUDCO (Housing and Urban Development Corporation), Smart City Missions in India, or city planning departments in countries worldwide.
  • Benefits:
    • Exposure to policymaking and public-sector project execution.
    • Opportunities to work on large-scale public infrastructure projects.

3. Non-Governmental Organizations (NGOs) and Research Institutes

  • NGOs: Interning with organizations focused on sustainable development, disaster management, or housing for the underprivileged can offer unique experiences.
  • Research Institutes: Organizations like the National Institute of Urban Affairs (NIUA) or regional research bodies provide internships involving data analysis, policy formulation, or publishing research papers.
  • Skills Developed:
    • Social and environmental aspects of architecture and planning.
    • Grant-writing and stakeholder engagement.

4. Real Estate and Construction Companies

  • Roles: Interns may assist with site planning, feasibility studies, and project management tasks.
  • Notable Companies:
    • Real estate developers like CBRE, Jones Lang LaSalle (JLL), or regional property developers.
  • Learning Outcomes:
    • Insight into the commercial aspects of design and planning.
    • Hands-on experience with construction technologies and sustainability practices.

5. Academic and Teaching Assistantships

  • Many universities and colleges offer opportunities for students to work as teaching or research assistants during their studies.
  • Activities:
    • Assisting professors in research projects, model-making, or preparing teaching materials.
  • Benefits:
    • Deepened theoretical knowledge and academic networking.
    • Opportunities to publish papers or participate in conferences.

6. Specialized Design and Software Training Programs

  • Purpose: Enhance technical skills in areas like parametric design, Building Information Modeling (BIM), or GIS.
  • Programs:
    • Workshops and certifications by software companies such as Autodesk, Rhinoceros, or ESRI.
    • Online platforms like Coursera, edX, and LinkedIn Learning offer project-based learning modules.
  • Impact:
    • Stand out in the job market with advanced technical skills.
    • Learn about cutting-edge tools used in industry and academia.

7. Internships in Sustainability and Green Building Design

  • Opportunities: Internships in firms specializing in LEED certification, renewable energy integration, and sustainable urban design.
  • Example:
    • Green building councils or eco-architecture firms.
  • Skills Gained:
    • Techniques for energy modeling, water management, and lifecycle cost analysis.
    • Knowledge of global standards like LEED, BREEAM, or GRIHA.

8. International Internships and Exchange Programs

  • Organizations: Programs such as Erasmus+ in Europe or IAESTE (International Association for the Exchange of Students for Technical Experience) provide placements worldwide.
  • Advantages:
    • Exposure to global architectural and planning standards.
    • Networking with international professionals and peers.
  • Challenges:
    • May require competitive application and sponsorship for travel or accommodation.

9. Competitions and Live Projects

  • Competitions such as the Archiprix, Urban Labs, or national student design contests often include mentorship and training components.
  • Participating in these provides:
    • Practical problem-solving skills.
    • A portfolio of innovative projects.

10. Construction Site Internships

  • Experience:
    • Shadowing construction managers and understanding site operations.
  • Skills:
    • Learning construction techniques, material properties, and project coordination.
  • Suitability:
    • Essential for students interested in execution and project management.

Conclusion

Training and internship opportunities provide invaluable experiences for architecture and planning students, aligning their academic knowledge with professional needs. Proactively seeking internships in varied sectors such as design firms, NGOs, government bodies, and international platforms equips students with a diverse skill set and prepares them for multifaceted roles in their careers.

Biocrete: Revolutionizing Sustainable Construction

Daily writing prompt
Are you more of a night or morning person?

By Kavita Dehalwar

Concrete is one of the most widely used construction materials globally, accounting for a significant portion of the built environment. However, its production is responsible for approximately 8% of global carbon dioxide emissions, mainly due to cement manufacturing. In response to this environmental challenge, scientists and engineers have developed biocrete, a cutting-edge material poised to revolutionize the construction industry.


What is Biocrete?

Biocrete, also known as bio-concrete or living concrete, is an innovative material infused with biological components, typically microorganisms, to enhance its properties and sustainability. Unlike traditional concrete, biocrete integrates living systems that provide self-healing, reduced carbon footprint, and improved durability.

Biocrete comes in various forms, tailored to specific applications:

  1. Self-healing biocrete: Incorporates bacteria that produce calcium carbonate to seal cracks.
  2. Biologically-derived cement replacements: Use microbial processes to generate bio-based binders.
  3. Algae-based biocrete: Employs algae for carbon sequestration during production.

The Science Behind Biocrete

1. Self-Healing Mechanism

Biocrete’s self-healing properties leverage bacteria such as Bacillus species, which remain dormant within the material until a crack forms. When exposed to water and oxygen through the crack, these bacteria become active, consuming calcium lactate and producing calcium carbonate. This calcium carbonate fills and seals the cracks, restoring the material’s integrity.

2. Microbial Induced Calcium Carbonate Precipitation (MICP)

Microorganisms, such as Sporosarcina pasteurii, are utilized to precipitate calcium carbonate through metabolic processes. This biological method offers a sustainable alternative to conventional cement by reducing the need for high-temperature processes.

3. Algae-Based Solutions

Certain strains of algae, like Chlamydomonas reinhardtii, capture atmospheric COโ‚‚ during photosynthesis and produce biomass and calcium carbonate. Integrating these algae into concrete production not only offsets carbon emissions but also creates a renewable cycle.


Advantages of Biocrete

  1. Environmental Benefits:
    • Reduced Carbon Emissions: Biocrete eliminates or minimizes the use of traditional Portland cement, significantly lowering greenhouse gas emissions.
    • Carbon Sequestration: Algae-based and microbial processes can actively sequester carbon during production.
  2. Durability:
    • Self-healing properties extend the lifespan of structures by reducing maintenance and preventing water infiltration through cracks.
    • Enhanced resistance to chemical attacks, especially in marine environments.
  3. Resource Efficiency:
    • Utilizes biological and renewable inputs, reducing reliance on non-renewable resources.
    • Potential for using waste products, such as agricultural residues, as feedstocks for microbial processes.
  4. Cost Savings:
    • Lower long-term maintenance costs due to self-healing.
    • Potential for reduced material costs as production scales up.

Applications of Biocrete

  1. Infrastructure Repair: Self-healing biocrete is particularly useful for repairing bridges, tunnels, and roadways, where traditional maintenance is challenging and costly.
  2. Green Building Projects: Architects and developers increasingly use biocrete in sustainable construction to meet environmental certifications.
  3. Marine Structures: Biocreteโ€™s resistance to seawater makes it ideal for offshore platforms, seawalls, and docks.
  4. Customizable Design: Its properties can be tailored for specific applications, such as soundproofing or thermal insulation.

Challenges and Limitations

While biocrete holds immense promise, it faces several challenges:

  1. Production Costs: Currently, biocrete is more expensive to produce than traditional concrete due to limited scalability and the cost of biological components.
  2. Standardization: The construction industry lacks clear guidelines and standards for integrating biocrete into mainstream projects.
  3. Durability in Extreme Conditions: The long-term performance of biocrete under extreme environmental stress requires further testing.
  4. Public Perception: Adoption may be hindered by skepticism about the reliability of living materials in construction.

The Future of Biocrete

The growing emphasis on sustainable development and green technologies is likely to accelerate the adoption of biocrete. Researchers are exploring ways to:

  • Scale up production while reducing costs.
  • Improve the efficiency and resilience of biological processes.
  • Integrate biocrete with other smart construction technologies, such as sensors and robotics.

Governments and private organizations can play a pivotal role by funding research, creating incentives, and establishing standards that encourage the adoption of biocrete in construction projects.


Conclusion

Biocrete represents a transformative innovation in the construction industry. By blending biology with traditional materials, it offers a sustainable solution to the environmental challenges posed by conventional concrete. While hurdles remain, ongoing advancements in material science and biotechnology are set to make biocrete a cornerstone of sustainable infrastructure. As the world strives to reduce its carbon footprint, biocrete stands out as a promising step toward a greener future.

References

Hayakawa, M., Matsuoka, Y., & Shindoh, T. (1993). Development and application of superworkable concrete. Inย Special Concretes-Workability and Mixingย (pp. 185-192). CRC Press.

Kerley, M. (2004). Structural identification of phases constituting biocrete acid resistant mortar.

Sharma, S. N., Prajapati, R., Jaiswal, A., & Dehalwar, K. (2024, June). A Comparative Study of the Applications and Prospects of Self-healing Concrete/Biocrete and Self-Sensing Concrete. Inย IOP Conference Series: Earth and Environmental Scienceย (Vol. 1326, No. 1, p. 012090). IOP Publishing.

Increase in Land Prices in Urban Areas – Factors that Counts

Daily writing prompt
Do you trust your instincts?

By Kavita Dehalwar

The phenomenon of rising land prices in urban areas is a critical issue affecting urban planning, housing affordability, and economic development. Over recent decades, urban land prices have surged globally, driven by complex interrelated factors. This escalation impacts individuals, businesses, and governments alike, shaping urban landscapes and influencing societal structures.

Key Factors Influencing Land Prices in Urban Areas

1. Demand and Supply Dynamics

  • Population Growth: Urbanization leads to an influx of people into cities, increasing demand for residential, commercial, and industrial spaces. As the urban population grows, the limited availability of land drives up prices.
  • Limited Land Availability: Urban areas often face constraints such as geographical boundaries, zoning regulations, and environmental considerations, which limit the supply of developable land, thereby pushing prices higher.

2. Economic Development

  • Infrastructure Development: Proximity to infrastructure such as transportation networks, schools, hospitals, and utilities makes certain areas more desirable, increasing land values.
  • Economic Opportunities: Cities with robust economic activity attract businesses and workers, increasing demand for land. Regions with thriving industries, tech hubs, or business districts experience sharper price increases.

3. Government Policies and Regulations

  • Zoning Laws: Regulations that dictate land use can impact prices significantly. For instance, limiting residential development in certain areas can lead to higher prices due to scarcity.
  • Taxation and Subsidies: Policies such as property taxes, incentives for development, or subsidies for affordable housing can indirectly affect land prices.

4. Speculation and Investment

  • Real Estate Speculation: Land is often purchased as an investment with the expectation of price appreciation. Speculative activities can artificially inflate land prices, especially in rapidly growing urban centers.
  • Foreign Investment: In some cities, foreign investors buy land or property as an asset, driving up local prices and reducing affordability for residents.

5. Economic Indicators

  • Inflation: As inflation increases, the nominal value of land rises, reflecting the general increase in prices within an economy.
  • Interest Rates: Lower interest rates make borrowing cheaper, encouraging investment in real estate and driving up land prices. Conversely, higher rates can cool demand.

6. Urbanization and Changing Lifestyles

  • Lifestyle Shifts: Preferences for urban living due to employment opportunities, better education, healthcare, and entertainment options drive demand for land in cities.
  • Densification Trends: With limited horizontal expansion possibilities, cities grow vertically, increasing the value of land plots that allow high-density development.

7. Technological Advancements

  • Smart Cities and Digital Connectivity: Land in areas with advanced digital infrastructure, such as high-speed internet and smart utilities, tends to command a premium.
  • Impact of Remote Work: While remote work trends during the COVID-19 pandemic initially shifted demand to suburban areas, urban hubs with diversified economic bases remain attractive.

8. Environmental and Geographic Factors

  • Geographical Constraints: Cities located near coastlines, mountains, or other natural barriers face limitations on expansion, making available land more valuable.
  • Climate Change and Resilience: Land in areas considered less vulnerable to climate risks such as flooding or hurricanes can become more desirable, increasing prices.

9. Cultural and Social Factors

  • Prestige and Reputation: Certain neighborhoods gain a reputation for prestige, safety, or cultural vibrancy, attracting affluent buyers and increasing prices.
  • Educational and Social Amenities: Proximity to top schools, universities, or cultural institutions can elevate land values in specific urban pockets.

10. Global and Local Events

  • Pandemics and Crises: Events like pandemics may temporarily disrupt trends, such as by increasing interest in suburban living. However, cities often rebound due to their economic and social advantages.
  • Major Events: Hosting global events like the Olympics or World Expos can boost land prices in the host city due to infrastructure development and international attention.

Consequences of Rising Land Prices

The increase in land prices in urban areas leads to several consequences, including:

  1. Housing Affordability Crisis: High land prices make housing unaffordable for lower and middle-income groups, exacerbating social inequalities.
  2. Urban Sprawl: People move to suburban or peri-urban areas in search of affordable housing, leading to sprawling cities and increased commuting times.
  3. Displacement and Gentrification: Long-standing communities may be displaced as wealthier groups purchase properties, altering the social fabric of neighborhoods.
  4. Economic Polarization: High land costs can deter small businesses and startups, concentrating economic power in the hands of larger entities.

Conclusion

The rise in urban land prices is a multifaceted issue shaped by economic, social, environmental, and political factors. Managing this trend requires a delicate balance of policy interventions, such as encouraging sustainable urban planning, enforcing regulations to curb speculation, and promoting equitable access to affordable housing. Understanding these dynamics is crucial for governments, developers, and residents to navigate the challenges and opportunities posed by urban land price escalation.

References

Bogin, A., Doerner, W., & Larson, W. (2019). Local house price dynamics: New indices and stylized facts.ย Real Estate Economics,ย 47(2), 365-398.

Colsaet, A., Laurans, Y., & Levrel, H. (2018). What drives land take and urban land expansion? A systematic review.ย Land Use Policy,ย 79, 339-349.

Ma, J., Cheng, J. C., Jiang, F., Chen, W., & Zhang, J. (2020). Analyzing driving factors of land values in urban scale based on big data and non-linear machine learning techniques.ย Land use policy,ย 94, 104537.

Quigley, J. M., & Rosenthal, L. A. (2005). The effects of land use regulation on the price of housing: What do we know? What can we learn?.ย Cityscape, 69-137.

Sharma, S. N. Land-Use Zones in Urban Planning.

Dehalwar, K., & Sharma, S. N. (2024). Social Injustice Inflicted by Spatial Changes in Vernacular Settings: An Analysis of Published Literature.

Measures to Increase the Public Participation in Plan Making

Daily writing prompt
What’s your favorite month of the year? Why?

By Kavita Dehalwar

Increasing public participation in the planning process is vital to ensure inclusive, transparent, and community-centered outcomes. Effective measures to enhance public engagement in plan-making involve a mix of education, accessibility, technology, and trust-building. Below are detailed steps to increase public participation in planning:


1. Education and Awareness

  • Public Awareness Campaigns: Use media campaigns, workshops, and community meetings to educate citizens about the importance of planning and its impact on their lives.
  • Simplified Information: Create easy-to-understand summaries of technical documents to help non-experts grasp the issues.
  • Outreach in Schools and Colleges: Engage younger generations through educational programs in schools and colleges to cultivate a culture of civic participation.
  • Citizen Guides: Publish “How-to” guides to explain how citizens can contribute meaningfully to planning processes.

2. Accessible Communication Channels

  • Multi-Language Communication: Provide documents and announcements in multiple languages relevant to the local population.
  • Use of Visual Aids: Share maps, charts, and infographics to present complex plans in a more comprehensible manner.
  • Inclusive Venues and Timings: Host meetings in locations accessible to all, including those with disabilities, and schedule them at times convenient for working individuals.
  • Helplines and Support Desks: Offer dedicated phone lines, email support, and in-person helpdesks to address public queries.

3. Digital Tools and Technology

  • Interactive Websites and Apps: Create platforms where people can view plans, submit feedback, and track the progress of their inputs.
  • Virtual Public Meetings: Offer live streaming and interactive Q&A sessions for those who cannot attend in person.
  • Online Surveys and Polls: Use digital surveys to gather broad-based opinions efficiently.
  • GIS Tools: Enable the public to view geographic data interactively, allowing them to understand spatial planning implications better.

4. Participatory Workshops and Forums

  • Community Visioning Workshops: Facilitate workshops where residents can brainstorm ideas and prioritize issues.
  • Focus Groups: Conduct small, focused discussions with specific demographic groups (e.g., women, youth, seniors) to ensure their voices are heard.
  • Citizen Panels: Form panels or advisory groups of residents to regularly consult during the planning process.
  • Hackathons and Design Jams: Organize events where participants collaborate on innovative solutions for urban challenges.

5. Proactive Outreach

  • Door-to-Door Engagement: Send planners or volunteers to homes to distribute materials and discuss the process.
  • Engagement with Local Organizations: Partner with community groups, NGOs, and resident welfare associations to act as bridges between the government and the public.
  • Mobile Units: Use vans or kiosks to reach underserved or remote areas to engage with the public directly.

6. Feedback Mechanisms

  • Transparent Feedback Loops: Regularly update participants on how their feedback has been incorporated or why certain suggestions were not feasible.
  • Public Dashboards: Create online dashboards showing public contributions and decisions made at each stage.
  • Recognition Programs: Acknowledge active participants through certificates, public mentions, or awards.

7. Legal and Policy Frameworks

  • Mandatory Public Consultation Requirements: Ensure legal provisions for minimum public consultation periods and incorporate public input as a mandatory step in the planning process.
  • Citizen Assemblies: Institutionalize regular citizen assemblies to discuss and deliberate on planning issues.
  • Grievance Redressal Systems: Establish mechanisms to address concerns or complaints related to the planning process.

8. Building Trust and Transparency

  • Anti-Corruption Measures: Ensure that the planning process is free from corruption and favoritism to build trust.
  • Open Data Policies: Share all non-confidential planning data publicly to allow independent analysis.
  • Public Monitoring Committees: Enable community representatives to monitor and report on planning developments.

9. Incentives for Participation

  • Stipends or Honorariums: Provide compensation for time and effort spent by citizens participating in lengthy consultations.
  • Recognition of Contributions: Highlight contributions through media or social media platforms.
  • Gamification: Use gamified approaches like reward points for participating in surveys or contributing ideas.

10. Cultural and Contextual Sensitivity

  • Local Festivals and Events: Tie consultations to popular cultural events to attract larger audiences.
  • Tailored Approaches: Adapt engagement strategies to align with the social, cultural, and economic dynamics of the community.

11. Long-Term Engagement Strategies

  • Citizen Capacity Building: Invest in long-term training for citizens to enhance their understanding of planning principles and decision-making processes.
  • Institutionalized Roles: Form permanent citizen committees that regularly interact with planning authorities.
  • Continual Feedback Opportunities: Provide year-round avenues for citizens to provide feedback beyond formal consultation periods.

By combining these measures, authorities can foster greater public involvement, resulting in plans that are not only better aligned with community needs but also enjoy broader support and legitimacy.

References

Dehalwar, K., & Sharma, S. N. (2023). Fundamentals of Area Appreciation and Space Perceptions.

Dehalwar, K., & Sharma, S. N. (2024). Social Injustice Inflicted by Spatial Changes in Vernacular Settings: An Analysis of Published Literature.

Dehalwar, K., & Sharma, S. N. (2024). Politics in the Name of Womenโ€™s Reservation.ย Contemporary Voice of Dalit, 2455328X241262562.

Haklay, M., Jankowski, P., & Zwoliล„ski, Z. (2018). Selected modern methods and tools for public participation in urban planningโ€“a review.ย Quaestiones Geographicae,ย 37(3), 127-149.

Lane, M. B. (2005). Public participation in planning: an intellectual history.ย Australian geographer,ย 36(3), 283-299.

Sharma, S. N. (2014).ย Participatory Planning in Plan Preparation. BookCountry.

Sharma, S. N. (2013).ย Participatory Planning in Practice. Lulu. com.

Sharma, S. N. (2018). Review of National Urban Policy Framework 2018.ย Think India Journal,ย 21(3), 74-81.

Sharma, S. N. (2018). Transformation of Aspirational Districts Programme: A Bold Endeavor Towards Progress.ย Think India Journal,ย 21(4), 197-206.

Sharma, S. N. (2005). Evaluation of the JnNURM Programme of Government of India for Urban Renewal.ย Think India Journal,ย 8(2), 1-7.

Thomas, H. (2003). Public participation in planning. Inย British planning policyย (pp. 187-206). Routledge.

Environmental Health and the Consequences of Unplanned Waste Disposal

Daily writing prompt
What’s the first impression you want to give people?

By Kavita Dehalwar

Unplanned waste disposal is a critical environmental issue that affects ecosystems, public health, and the planet’s overall sustainability. It occurs when waste materials are discarded without proper treatment or consideration for their impact, leading to environmental contamination, health hazards, and socio-economic challenges.

Photo by Robert So on Pexels.com

The Scope of the Problem

The World Bank estimates that global waste production will increase by 70% by 2050 unless urgent action is taken. Rapid urbanization, population growth, and consumerism exacerbate the problem, particularly in developing nations where waste management infrastructure is often inadequate.

Types of Waste and Their Impact

  1. Municipal Solid Waste (MSW): Includes household garbage, food waste, and packaging materials. Improper disposal results in unsanitary conditions, pest infestations, and methane emissions from landfills.
  2. Hazardous Waste: Includes industrial chemicals, batteries, and medical waste. These materials can leach toxic substances into soil and water, harming ecosystems and human health.
  3. Plastic Waste: Plastics take centuries to decompose and often end up in oceans, harming marine life and entering the food chain.
  4. E-Waste: Discarded electronics release heavy metals like lead and cadmium, contaminating soil and groundwater.

Environmental Consequences of Unplanned Waste Disposal

  1. Soil Contamination: Leachates from landfills contain toxic chemicals that degrade soil quality, making it unsuitable for agriculture.
  2. Water Pollution: Improperly disposed waste can contaminate rivers, lakes, and groundwater with harmful substances, disrupting aquatic ecosystems and jeopardizing clean water supplies.
  3. Air Pollution: Open burning of waste releases dioxins, furans, and other harmful pollutants, contributing to respiratory diseases and climate change.
  4. Biodiversity Loss: Waste in natural habitats harms wildlife, either through ingestion, entanglement, or habitat destruction.
  5. Climate Change: Decomposing organic waste generates methane, a potent greenhouse gas contributing to global warming.

Public Health Implications

  1. Disease Outbreaks: Unmanaged waste creates breeding grounds for disease vectors such as mosquitoes and rodents, increasing the prevalence of diseases like malaria and dengue fever.
  2. Respiratory Issues: Pollutants from waste burning cause respiratory problems, particularly among vulnerable groups such as children and the elderly.
  3. Chemical Exposure: Direct contact with hazardous waste or contaminated water can lead to skin disorders, neurological issues, and even cancer.
  4. Mental Health Impact: Communities living near poorly managed waste sites often experience stress, anxiety, and reduced quality of life.

Socio-Economic Effects

  1. Economic Burden: Healthcare costs rise due to increased disease prevalence, while local governments face escalating expenses for cleanup and mitigation.
  2. Aesthetic and Property Value Loss: Unplanned waste disposal reduces the attractiveness of neighborhoods and lowers property values.
  3. Impact on Livelihoods: Fisherfolk, farmers, and tourism-dependent communities suffer due to environmental degradation.

Solutions and Strategies for Sustainable Waste Management

  1. Policy and Regulation:
    • Governments should enforce strict regulations on waste disposal and management.
    • Polluter pays principle and extended producer responsibility can incentivize businesses to minimize waste.
  2. Infrastructure Development:
    • Building modern recycling facilities, composting units, and waste-to-energy plants.
    • Implementing robust waste collection and segregation systems.
  3. Community Engagement:
    • Educating the public about the importance of reducing, reusing, and recycling.
    • Organizing community clean-up drives and awareness campaigns.
  4. Innovative Technologies:
    • Using AI and IoT for efficient waste tracking and management.
    • Developing biodegradable alternatives to plastic and other non-decomposable materials.
  5. International Cooperation:
    • Sharing best practices and technologies between nations.
    • Supporting global agreements like the Basel Convention on hazardous waste.

Conclusion

Unplanned waste disposal poses a significant threat to environmental health, public safety, and economic stability. Addressing this challenge requires collective action from governments, businesses, and individuals. By adopting sustainable practices and investing in effective waste management systems, society can mitigate the adverse effects and move toward a cleaner, healthier future.

References

Dehalwar, K., & Sharma, S. N. (2024). Social Injustice Inflicted by Spatial Changes in Vernacular Settings: An Analysis of Published Literature.

Guerrero, L. A., Maas, G., & Hogland, W. (2013). Solid waste management challenges for cities in developing countries.ย Waste management,ย 33(1), 220-232.

Imam, A., Mohammed, B., Wilson, D. C., & Cheeseman, C. R. (2008). Solid waste management in Abuja, Nigeria.ย Waste management,ย 28(2), 468-472.

Kumar, G., Vyas, S., Sharma, S. N., & Dehalwar, K. (2024). Challenges of Environmental Health in Waste Management for Peri-urban Areas. Inย Solid Waste Management: Advances and Trends to Tackle the SDGsย (pp. 149-168). Cham: Springer Nature Switzerland.

Nanda, S., & Berruti, F. (2021). Municipal solid waste management and landfilling technologies: a review.ย Environmental chemistry letters,ย 19(2), 1433-1456.

Sharma, S. N., Dehalwar, K., & Singh, J. (2024). Emerging Techniques of Solid Waste Management for Sustainable and Safe Living Environment. Inย Solid Waste Management: Advances and Trends to Tackle the SDGsย (pp. 29-51). Cham: Springer Nature Switzerland.

Sharma, S. N. (2013). Sustainable development strategies and approaches.ย International Journal of Engineering and Technical Research (IJETR),ย 2.

Shekdar, A. V. (2009). Sustainable solid waste management: An integrated approach for Asian countries.ย Waste management,ย 29(4), 1438-1448.

Interviews: Structured, Semi-structured, and Unstructured.

Daily writing prompt
How much would you pay to go to the moon?

By Kavita Dehalwar

Interviews are a central method of gathering qualitative data across disciplines, particularly in research, psychology, human resources, and customer service. Broadly, interviews can be classified into structured, semi-structured, and unstructured types. Each of these types serves a unique purpose and provides varying levels of flexibility and control over the data-gathering process. Hereโ€™s a detailed breakdown of each type:

1. Structured Interviews

Definition: Structured interviews are a standardized approach to interviewing where the interviewer follows a predetermined set of questions, asked in a specific order, with little to no deviation. The questions are often closed-ended, focusing on eliciting specific information from respondents.

Key Characteristics:

  • Standardization: All interviewees are asked identical questions in the same sequence, ensuring consistency across interviews.
  • Fixed Response Options: Often, structured interviews include closed-ended questions, allowing for objective comparison across responses.
  • Limited Flexibility: The interviewer does not deviate from the script, leaving little room for follow-up or probing questions.
  • Objective Scoring: In many cases, responses can be scored or rated, making it possible to quantify results.

Advantages:

  • Reliability and Consistency: Because the structure is rigid, responses are easier to compare and analyze statistically, which improves the reliability of findings.
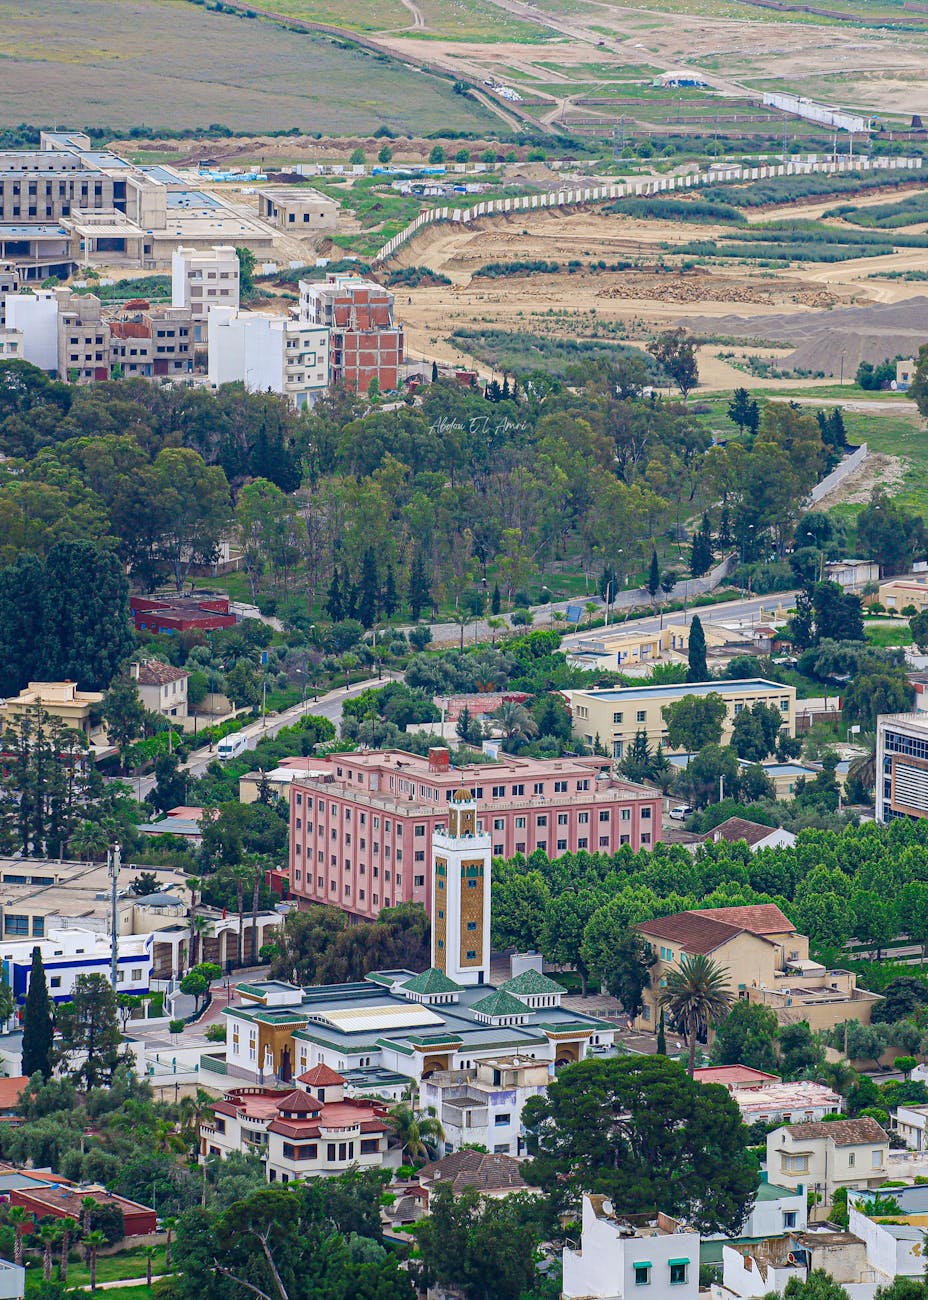
  • Efficiency: Structured interviews tend to be shorter and more focused, making them ideal when time or resources are limited.
  • Reduced Interviewer Bias: With a fixed set of questions, the likelihood of interviewer bias affecting responses is minimized.

Disadvantages:

  • Limited Depth: Structured interviews lack flexibility, making it difficult to explore topics beyond the predetermined questions, which may limit the depth of information gathered.
  • Inflexible Responses: Respondents may find it challenging to fully express their thoughts within the confines of closed-ended questions.

Applications:

  • Hiring and Recruitment: Structured interviews are common in initial screening processes, where specific job-related competencies are evaluated.
  • Surveys: Many survey-based interviews (e.g., census interviews) use structured formats for consistency and reliability.
  • Research Studies: Structured interviews are often used in studies that require quantifiable data, such as psychological assessments or standardized tests.

2. Semi-Structured Interviews

Definition: Semi-structured interviews use a blend of predetermined questions and the flexibility to explore topics as they arise. Interviewers start with a set of key questions but can deviate to probe for additional information based on the respondent’s answers.

Key Characteristics:

  • Guided Structure: A framework of core questions is provided, but the interviewer can ask follow-up questions, depending on responses.
  • Flexibility: Unlike structured interviews, semi-structured interviews allow for spontaneous questions that provide richer data.
  • Open-Ended Questions: Questions are generally open-ended, allowing interviewees to elaborate and provide nuanced responses.

Advantages:

  • Balance of Consistency and Flexibility: Semi-structured interviews combine the structure needed to guide the conversation with the flexibility to explore unplanned topics in depth.
  • In-Depth Data Collection: The open-ended nature allows for deeper insights, as participants can share more detailed, personal information.
  • Improved Rapport: Semi-structured interviews foster a more conversational style, which can make interviewees feel more comfortable and open.

Disadvantages:

  • Time-Consuming: Semi-structured interviews require more time to conduct and analyze, as responses are often longer and more complex.
  • Interviewer Skill Dependency: The effectiveness of semi-structured interviews depends on the interviewerโ€™s ability to ask relevant follow-up questions and guide the conversation.
  • Subjective Interpretation: Because responses are open-ended, interpretation can be subjective, requiring careful analysis to avoid biases.

Applications:

  • Qualitative Research: Semi-structured interviews are frequently used in fields like sociology, anthropology, and psychology to gather rich qualitative data.
  • Customer Feedback: Organizations often use semi-structured interviews to understand customer needs and preferences in detail.
  • Performance Appraisals: Semi-structured interviews are common in performance evaluations, where feedback can be explored in depth through a blend of preset and flexible questions.

3. Unstructured Interviews

Definition: Unstructured interviews are the most flexible type, with no predetermined set of questions. Instead, the interviewer and interviewee engage in an open, free-flowing conversation where topics can evolve based on the participantโ€™s responses.

Key Characteristics:

  • Complete Flexibility: The interviewer can ask any question based on the conversation flow, without being constrained by a script or structure.
  • Participant-Led: Often, the participantโ€™s responses guide the direction of the interview, allowing for exploration of topics that might not have been initially considered.
  • High Depth and Detail: Unstructured interviews often yield highly detailed and personal insights, as interviewees are free to discuss topics in-depth.

Advantages:

  • Depth and Richness of Data: Because there is no structure, interviewees can express themselves freely, leading to unique, valuable insights.
  • Adaptability: Unstructured interviews are ideal for exploring complex, sensitive topics where a structured approach might limit expression.
  • Rapport Building: The conversational nature often helps interviewees feel at ease, fostering a sense of trust that can yield honest responses.

Disadvantages:

  • Difficulty in Analysis: Data from unstructured interviews can be challenging to organize and analyze, as responses vary widely and lack uniformity.
  • Interviewer Skill Requirement: Successful unstructured interviews require high interviewer skills, including active listening, adaptability, and the ability to ask relevant probing questions.
  • Time-Consuming: Without a predetermined structure, unstructured interviews can be lengthy, both in conducting and analyzing responses.

Applications:

  • Exploratory Research: Often used in exploratory studies where the objective is to uncover new insights or hypotheses rather than test existing ones.
  • Therapy and Counseling: Therapists often use an unstructured approach, allowing clients to direct conversations based on what they feel comfortable sharing.
  • Investigative Journalism: Journalists frequently use unstructured interviews to gather in-depth, personal stories that may reveal new angles to a story.

Summary Table

Interview TypeStructureFlexibilityData DepthCommon Applications
StructuredHighLowLowSurveys, hiring, standardized research
Semi-StructuredModerateModerateModerateQualitative research, feedback, appraisals
UnstructuredNoneHighHighTherapy, exploratory research, journalism

In choosing an interview type, one should consider the purpose of the interview, the desired depth of information, available time, and the skills of the interviewer. Structured interviews provide consistency, while unstructured ones allow for richer insights, and semi-structured interviews offer a balance between the two.

References

Adeoyeโ€Olatunde, O. A., & Olenik, N. L. (2021). Research and scholarly methods: Semiโ€structured interviews. Journal of the american college of clinical pharmacy, 4(10), 1358-1367.

Brinkmann, S. (2014). Unstructured and semi-structured interviewing. The Oxford handbook of qualitative research, 2, 277-299.

Dehalwar, K., & Sharma, S. N. (2023). Fundamentals of Research Writing and Uses of Research Methodologies. Edupedia Publications Pvt Ltd.

Dehalwar, K., & Sharma, S. N. (2024). Exploring the Distinctions between Quantitative and Qualitative Research Methods. Think India Journal, 27(1), 7-15.

Dehalwar, K. (Ed.). (2024). Basics of Research Methodology-Writing and Publication. EduPedia Publications Pvt Ltd.

Kumar, G., Vyas, S., Sharma, S. N., & Dehalwar, K. (2024). Challenges of Environmental Health in Waste Management for Peri-urban Areas. In Solid Waste Management: Advances and Trends to Tackle the SDGs (pp. 149-168). Cham: Springer Nature Switzerland.

Low, J. (2019). Unstructured and semiโ€“structured interviews in Health Research. Researching Health: Qualitative, Quantitative and Mixed methods. London: Sage publications, 123-41.

Miller, P. R., Dasher, R., Collins, R., Griffiths, P., & Brown, F. (2001). Inpatient diagnostic assessments: 1. Accuracy of structured vs. unstructured interviews. Psychiatry research, 105(3), 255-264.

Segal, D. L., Coolidge, F. L., O’Riley, A., & Heinz, B. A. (2006). Structured and semistructured interviews. In Clinician’s handbook of adult behavioral assessment (pp. 121-144). Academic Press.

Sharma, S. N., Lodhi, A. S., Dehalwar, K., & Jaiswal, A. (2024, June). Life Cycle Assessment (LCA) of Recycled & Secondary Materials in the Construction of Roads. In IOP Conference Series: Earth and Environmental Science (Vol. 1326, No. 1, p. 012102). IOP Publishing.

Rational Urban Planning Process

Daily writing prompt
What’s your all-time favorite album?

By Kavita Dehalwar

The Rational Urban Planning Process is a systematic and methodical approach used to guide urban development and city management. It is based on logical reasoning, data-driven decision-making, and a structured series of steps that ensure urban plans are comprehensive, practical, and sustainable. This process is often used by urban planners, city managers, and policymakers to design cities or manage growth in a way that maximizes benefits for residents, businesses, and the environment while minimizing potential negative impacts.

Key Components of the Rational Urban Planning Process

Key Components of the Rational Urban Planning Process

  1. Problem Identification and Definition
    The first step involves identifying and clearly defining the urban issues or problems that need to be addressed. This could range from housing shortages and traffic congestion to environmental degradation and infrastructure deficiencies. Clear problem definition allows the planning team to establish focused objectives for the planning process.
  2. Data Collection and Analysis
    Planners gather comprehensive data about the city, which may include demographic statistics, land use patterns, environmental data, and economic conditions. Analyzing this data helps planners understand the current situation, identify trends, and forecast future changes. This phase often involves mapping, surveys, and field studies.
  3. Goal Setting
    Based on the problem definition and data analysis, planners set specific, measurable goals for the urban plan. These goals may include reducing traffic, increasing green spaces, or improving public transport efficiency. Itโ€™s essential that these goals align with the broader vision of the city and the needs of its residents.
  4. Generating Alternative Solutions
    In the rational planning model, a variety of alternative solutions or plans are developed to address the defined problems. These alternatives are based on the collected data and are designed to achieve the goals set in the previous step. Each alternative is typically distinct, offering different strategies or priorities, such as emphasizing public transportation over private car use or increasing high-density housing versus preserving more open spaces.
  5. Evaluating Alternatives
    Once a range of alternatives has been developed, they are evaluated based on their potential impacts, costs, benefits, and feasibility. This evaluation uses quantitative and qualitative methods to assess how well each alternative aligns with the planning goals. Cost-benefit analysis, environmental impact assessments, and social equity assessments are some tools used in this step. Stakeholder feedback may also be integrated to refine the options.
  6. Selecting the Best Alternative
    The rational planning process aims to identify the “optimal” solution from the evaluated alternatives. This is the option that best meets the identified goals, maximizes benefits, and minimizes costs or negative impacts. The selected plan may not be perfect but should represent the most balanced and feasible approach.
  7. Implementation of the Plan
    Once the best alternative is selected, planners develop a detailed action plan that outlines how the urban plan will be implemented. This step involves creating policies, regulations, and strategies that ensure the plan is executed efficiently. It may also include designing timelines, allocating budgets, and identifying key agencies or stakeholders responsible for various aspects of the implementation.
  8. Monitoring and Evaluation
    After implementation, the plan must be regularly monitored to ensure that it is achieving the desired outcomes. Evaluation involves comparing actual results against the goals and objectives set earlier in the process. If the plan is not performing as expected, adjustments can be made. This continuous monitoring ensures that the urban plan remains responsive to changing conditions and community needs.

Characteristics of the Rational Urban Planning Process

  • Systematic: The process is highly structured and follows a step-by-step methodology, ensuring no aspect of urban planning is overlooked.
  • Goal-Oriented: Each step is driven by clearly defined goals and objectives, which guide decision-making throughout the process.
  • Data-Driven: Decisions are based on empirical data, research, and analysis, which helps avoid subjective or politically driven choices.
  • Flexibility in Alternatives: Multiple solutions are considered, allowing for a range of options to be explored and evaluated before selecting the best one.
  • Predictive: The process involves forecasting future trends and conditions, enabling planners to anticipate challenges and opportunities.

Criticism of the Rational Planning Process

Despite its logical structure, the rational planning process has faced criticism, particularly in the context of urban planning:

  1. Complexity of Urban Environments: Cities are dynamic and complex systems where social, economic, and environmental factors are interrelated. The rational approach can sometimes oversimplify this complexity, assuming that all variables can be measured and controlled.
  2. Time-Consuming: The thoroughness of data collection, analysis, and evaluation can make the rational process lengthy, sometimes leading to delays in decision-making or action.
  3. Limited Flexibility: The step-by-step nature of the process may not always allow for the flexibility needed to respond to unexpected changes, such as political shifts or economic crises.
  4. Stakeholder Exclusion: Critics argue that the rational planning process can overlook the voices of marginalized groups if the focus is solely on data and technical analysis, without sufficient community input or consideration of social equity.
  5. Over-Emphasis on Quantitative Data: While data-driven decision-making is a strength, the process sometimes places too much emphasis on quantitative analysis, neglecting qualitative factors like cultural significance or social well-being that are harder to measure.

Application in Modern Urban Planning

Today, the rational urban planning process is often blended with other planning models to address some of its limitations. For example:

  • Participatory Planning: Involves stakeholders, including local communities, in each step of the process, ensuring their voices are heard and their needs are reflected in the final plan.
  • Incremental Planning: Allows for smaller, more flexible decisions to be made, adjusting the plan as new information becomes available.
  • Sustainability Planning: Incorporates environmental considerations from the outset, aiming to create cities that are not only functional but also ecologically responsible.

Conclusion

The Rational Urban Planning Process is a valuable tool for systematically addressing the challenges of urban growth and development. Its emphasis on logical, data-driven decision-making helps create well-thought-out, practical solutions. However, in modern contexts, it is often used in combination with other models to address its limitations and ensure more inclusive, flexible, and adaptive urban planning outcomes.

References

Baum, H. S. (1996). Why the rational paradigm persists: Tales from the field.ย Journal of Planning Education and Research,ย 15(2), 127-135.

de Smit, J., & Rade, N. L. (1980). Rational and non-rational planning.ย Long Range Planning,ย 13(2), 87-101.

Gezelius, S. S., & Refsgaard, K. (2007). Barriers to rational decision-making in environmental planning.ย Land use policy,ย 24(2), 338-348.

Rothblatt, D. N. (1971). Rational planning reexamined.ย Journal of the American Institute of Planners,ย 37(1), 26-37.

Stuart, D. G. (1969). Rational urban planning: problems and prospects.ย Urban Affairs Quarterly,ย 5(2), 151-182.

Area Appreciation and Space Perception: A Comprehensive Exploration

Daily writing prompt
What are your favorite types of foods?

By Kavita Dehalwar

Understanding how we perceive and appreciate the area and space around us is fundamental to numerous fields, including architecture, urban planning, psychology, and even art. Our ability to navigate, interact with, and interpret spaces plays a critical role in daily life, influencing everything from how we move through environments to how we experience aesthetic and functional qualities of designed spaces. In this article, we will delve into two key conceptsโ€”area appreciation and space perceptionโ€”to understand how these elements shape human experience and environmental design.

1. Defining Area Appreciation and Space Perception

Area Appreciation

Area appreciation refers to an individual’s or a community’s recognition and valuation of a specific geographical or physical area. This appreciation can arise from multiple factors, including cultural significance, aesthetic value, functional utility, and emotional attachment. In essence, it is how people cognitively and emotionally connect with a particular area, whether it is a neighborhood, city block, or natural landscape.

Key factors that influence area appreciation:

  • Aesthetic Appeal: The beauty or attractiveness of an area can significantly impact its appreciation. Green spaces, architectural designs, and cultural landmarks often enhance aesthetic value.
  • Functional Value: Practical aspects like accessibility, infrastructure, and amenities (e.g., shops, schools, hospitals) contribute to an area’s functionality, increasing its appreciation.
  • Cultural and Historical Significance: Areas with deep cultural or historical roots often enjoy greater appreciation, as they foster a sense of identity and continuity.
  • Emotional and Psychological Attachment: An area may hold sentimental value for individuals due to personal history or experiences, enhancing their attachment and appreciation for the place.

Space Perception

Space perception is the cognitive process by which individuals understand and interpret their spatial surroundings. It involves the use of sensory informationโ€”visual, auditory, tactile, and even olfactory cuesโ€”to determine the size, distance, depth, and orientation of objects in relation to one another. Space perception is integral to how we move through, interact with, and mentally map our environment.

Key dimensions of space perception:

  • Depth Perception: The ability to perceive the world in three dimensions (3D) and judge the distance between objects.
  • Size and Scale: Estimating the size of objects or areas based on visual cues and comparing them to familiar objects.
  • Proximity and Spatial Relationships: Understanding how objects relate to each other in terms of distance and spatial arrangement.
  • Orientation and Navigation: Using landmarks, visual cues, and environmental information to orient oneself within a space and navigate it.

Space perception relies on multiple sensory inputs (visual, auditory, and kinesthetic), as well as the brain’s ability to synthesize and interpret these inputs to form a coherent understanding of the environment.

2. The Science Behind Space Perception

Visual Cues and Depth Perception

Visual information is the most significant input for perceiving space. The brain processes various visual cues to construct a 3D image of the world around us. Some of the essential cues include:

  • Binocular Cues: These arise from the slight difference between the images seen by each eye, also known as binocular disparity. The brain uses this disparity to estimate the depth and distance of objects.
  • Monocular Cues: When one eye is used, the brain still picks up clues such as relative size, texture gradient, linear perspective, and occlusion (one object partially blocking another) to infer depth and spatial relationships.
  • Motion Parallax: As you move, objects closer to you appear to move faster than objects farther away. This provides valuable information about the distance of objects.
  • Shadows and Light: Shadows, shading, and the play of light on surfaces help the brain understand the contours and depth of objects.

Auditory Cues

While vision plays the dominant role in space perception, auditory cues also contribute to spatial awareness. For instance, the direction, volume, and echoes of sound help us gauge the location of objects or events without directly seeing them.

  • Echo-location: The way sound waves reflect off surfaces gives us information about the space and distance of objects.
  • Binaural Hearing: Differences in the time and intensity of sounds arriving at each ear help the brain determine the direction and distance of sound sources.

Proprioception and Kinesthetic Awareness

Proprioception, or the awareness of body position and movement, complements space perception by helping us understand how our body moves through space. This internal sense is crucial for tasks like walking, grasping objects, and maintaining balance.

3. Cultural and Psychological Dimensions of Space Perception

Cultural Influences on Space Perception

Culture heavily influences how individuals perceive and use space. Different cultures have distinct norms related to personal space, spatial organization, and how space is used in social interactions.

  • Proxemics: The study of personal space in different cultures reveals varying comfort zones. For example, in some cultures, people stand closer together when communicating, while others maintain a larger distance.
  • Architecture and Spatial Design: Cultural traditions influence how buildings and public spaces are designed. In some cultures, open spaces and courtyards are valued, while others prioritize compartmentalized or enclosed environments.

Psychological and Emotional Dimensions

Space perception is not only a sensory or cognitive process but also an emotional and psychological one. Individuals’ moods, personalities, and experiences can all affect how they perceive space.

  • Crowdedness and Comfort: High-density environments can lead to feelings of discomfort or stress, while spacious areas often evoke relaxation.
  • Familiarity and Attachment: People tend to feel more comfortable in familiar spaces, and emotional bonds with a place can enhance perceptions of safety, comfort, and pleasure.
  • Anxiety and Claustrophobia: Some individuals may experience anxiety in confined spaces (claustrophobia) or large, open spaces (agoraphobia), illustrating how psychological states affect space perception.

4. The Role of Area Appreciation in Urban Planning and Design

Enhancing Quality of Life

Area appreciation is a crucial consideration in urban planning and design, as it directly impacts quality of life. Planners and architects seek to create spaces that balance functionality, aesthetics, and cultural relevance to foster a strong sense of community and belonging.

  • Green Spaces and Public Areas: Incorporating parks, plazas, and communal spaces can increase area appreciation by offering aesthetic value and social interaction opportunities.
  • Walkability and Accessibility: Designing areas that are pedestrian-friendly and well-connected to public transport enhances functional value and increases appreciation of the space.
  • Sustainability and Innovation: Environmentally conscious designs that prioritize sustainability and resilience to climate change often lead to a deeper appreciation of the area, aligning with modern values.

Place-Making and Identity

“Place-making” is the process of creating spaces that foster a strong sense of identity and community. Urban planners use place-making strategies to enhance area appreciation by reflecting the cultural, historical, and social fabric of a community.

  • Cultural Landmarks: Establishing monuments, public art, or historically significant structures in urban spaces can imbue areas with cultural meaning, enhancing appreciation.
  • Community Engagement: Involving local communities in the design and development of spaces can increase the emotional connection and collective ownership of the area.

5. Artistic Interpretation of Space Perception

Space in Art and Architecture

Artists and architects have long explored the concept of space perception to influence how viewers experience their work. Understanding how individuals perceive space allows creators to manipulate it for aesthetic or functional purposes.

  • Perspective in Art: Techniques like linear perspective and shading are used in visual art to create the illusion of depth and space on a 2D surface.
  • Architectural Design: Architects use space perception principles to design buildings that evoke particular emotions or behaviors. For example, high ceilings may inspire awe, while narrow corridors can create feelings of intimacy or constraint.

Virtual and Augmented Reality

Modern technology, such as virtual reality (VR) and augmented reality (AR), offers new avenues to explore space perception. These technologies allow users to experience spaces that may not physically exist or are distant, offering an immersive experience of virtual environments.

Conclusion

Area appreciation and space perception are essential elements in how humans interact with and interpret their environments. While area appreciation speaks to our emotional, cultural, and practical connection to specific locations, space perception involves the cognitive and sensory processes by which we navigate and understand those spaces. Both concepts are integral to fields like architecture, urban planning, psychology, and art, shaping our daily experiences and contributing to the richness of our environments. By understanding the mechanics and influences behind these processes, we can design spaces that enhance quality of life, foster emotional attachment, and reflect cultural identity.

References

Dehalwar, K., & Sharma, S. N. (2023).ย Fundamentals of Research Writing and Uses of Research Methodologies. Edupedia Publications Pvt Ltd.

Dehalwar, K. (Ed.). (2024).ย Basics of Research Methodology-Writing and Publication. EduPedia Publications Pvt Ltd.

Dehalwar, K., & Sharma, S. N. (2023). Fundamentals of Area Appreciation and Space Perceptions.

Hamilton, W. G. (1977). Landscape appreciation: Utilizing sense of place themes in college geography.ย Journal of Geography,ย 76(5), 175-179.

Hofstede, H., Salemink, K., & Haartsen, T. (2022). The appreciation of rural areas and their contribution to young adultsโ€™ staying expectations.ย Journal of Rural Studies,ย 95, 148-159.

Jia, J., Zhang, X., Huang, C., & Luan, H. (2022). Multiscale analysis of human social sensing of urban appearance and its effects on house price appreciation in Wuhan, China.ย Sustainable Cities and Society,ย 81, 103844.

Kumar, G., Vyas, S., Sharma, S. N., & Dehalwar, K. (2023). Planning and Development of Housing in Urban Fringe Area: Case of Bhopal (MP).ย GIS Business,ย 18(1), 1-14.

Sharma, S. N., & Dehalwar, K. (2023). Fundamentals of Planning and Design of Housing.

SOUAYAH, H. (2022). The notion of appreciation in space designโ€™s approach: from conception to reception and perception.ย International Design Journal,ย 12(2), 343-347.

Swensen, G., & Sรฆter, O. (2011). The mall method: Applied in a study of inhabitants’ appreciation of urban cultural heritage areas.ย International Journal of Qualitative Methods,ย 10(2), 125-139.