
A life table is a demographic tool that provides a systematic description of mortality, survival, and expectation of life at different ages in a population. It is constructed using age-specific mortality rates and helps to estimate measures like life expectancy, survival probabilities, and death probabilities at each age or age interval. There are two main types: Complete Life Table and Abridged Life Table.
1. Complete Life Table
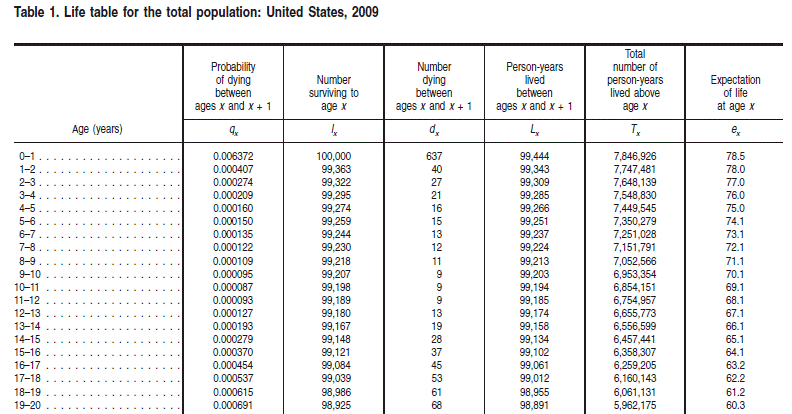
- Definition: A complete life table shows mortality and survival data for every single year of age, starting from birth (age 0) up to the maximum attainable age (often 100+).
- Structure: It has entries for each exact age (0, 1, 2, 3 … up to the last age group).
- Detail level: Provides fine-grained detail about the probability of death (qₓ), number surviving (lₓ), and life expectancy (eₓ) at each exact age.
- Advantage: Useful for very precise demographic and actuarial calculations such as insurance premiums, pension schemes, and health risk assessments.
- Limitation: Requires detailed and reliable age-specific mortality data, which may not always be available, especially in developing countries.

Example:
If we construct a complete life table for India and at age 25, the table shows:
- Out of 100,000 live births (l₀ = 100,000), about l₂₅ = 95,200 survive to exact age 25.
- The probability of death between ages 25 and 26 (q₂₅) might be 0.0021 (i.e., 2.1 deaths per 1000).
- Life expectancy at age 25 (e₂₅) could be 47.8 years.
2. Abridged Life Table
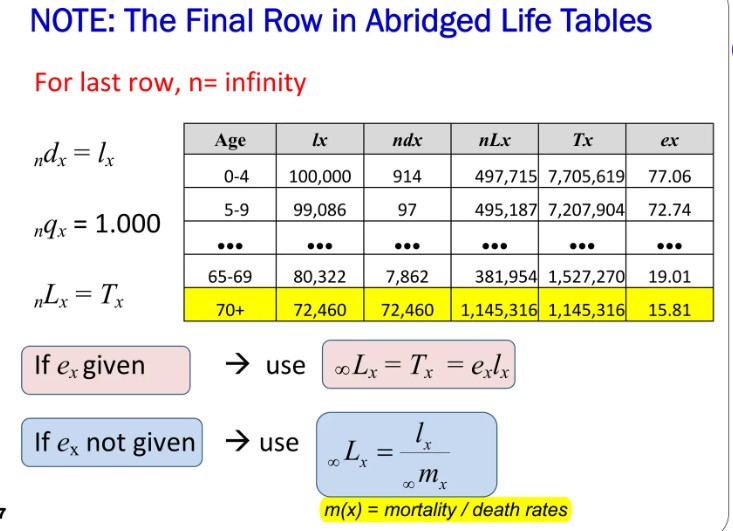
- Definition: An abridged life table groups ages into wider intervals (commonly 5-year intervals such as 0–4, 5–9, 10–14, etc.) instead of providing values for each single year.
- Structure: Usually constructed with 5-year or 10-year age intervals, though the first age interval (0–1, 1–4) is often broken into smaller parts due to higher infant mortality.
- Detail level: Less detailed than a complete life table but easier to construct and interpret.
- Advantage: Requires less detailed data, can be built with smaller population samples or incomplete mortality data. Suitable for census-based or survey-based population studies.
- Limitation: Less precise because it averages mortality experience over age intervals.
Example:
In an abridged life table for India:
- Age group 20–24 may show probability of dying (q₂₀–₂₄) as 0.008 (i.e., 8 deaths per 1000 over 5 years).
- Life expectancy at exact age 20 (e₂₀) may be estimated as 51.5 years.
- The table skips intermediate ages (21, 22, 23, 24), treating them as part of the group.
3. Key Differences at a Glance
| Aspect | Complete Life Table | Abridged Life Table |
|---|---|---|
| Age intervals | Single year (0, 1, 2, …) | Multi-year (often 5-year groups) |
| Detail | Very detailed, precise | Less detailed, approximate |
| Data requirement | Needs full age-specific mortality data | Can be constructed from limited data |
| Use | Actuarial science, insurance, medical research | Census analysis, demographic surveys, broad planning |
| Example output | Probability of death at exact age 25 | Probability of death for 20–24 as a group |
Conclusion
- A complete life table is more precise but data-intensive, best suited for actuarial and insurance purposes.
- An abridged life table is more practical for countries or studies with limited demographic data, commonly used in population censuses and health surveys.
- Both are crucial tools in demography, each serving different analytical and policy needs.

You must be logged in to post a comment.