


1️⃣ Meaning of Return on Investment (ROI)
Return on Investment (ROI) is a financial performance measure used to evaluate the profitability of an investment relative to its cost.
It answers the fundamental question:
“How much profit is generated from the money invested?”
ROI is widely used in:
- Real estate development
- Urban infrastructure projects
- Sustainable building design
- PPP (Public–Private Partnership) projects
- Redevelopment schemes
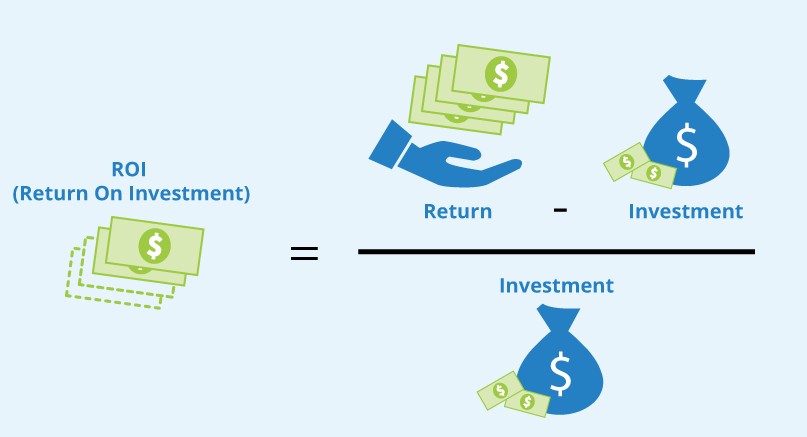
2️⃣ Formula of ROI
ROI(%)=Initial InvestmentNet Profit×100
Where:Net Profit=Total Return−Initial Investment
3️⃣ Interpretation of ROI
- ROI > 0 → Project generates profit
- Higher ROI → Better investment
- ROI = 20% → ₹20 profit for every ₹100 invested
- ROI < 0 → Project incurs loss
ROI is expressed as a percentage, making it easy to compare different projects.
4️⃣ Importance of ROI in Architecture & Planning
ROI connects design decisions with financial feasibility. It helps:
- Developers assess project viability
- Planners compare alternative land-use options
- Investors evaluate profitability
- Government agencies justify investments
- Architects propose cost-effective design solutions
5️⃣ Where ROI is Used in Planning Projects
🔹 1. Real Estate Development
- Residential apartments
- Commercial complexes
- Mixed-use developments
🔹 2. Infrastructure Projects
- Parking structures
- Bus terminals
- Metro station commercial spaces
🔹 3. Sustainable Design Decisions
- Solar panels
- Green roofing
- Energy-efficient façades
🔹 4. Urban Redevelopment
- Brownfield redevelopment
- Transit-oriented development
- Smart city projects
6️⃣ Step-by-Step Calculation of ROI
✅ Example 1: Residential Project
Initial Investment:
- Land = ₹40,00,000
- Construction = ₹50,00,000
- Other expenses = ₹10,00,000
Total Investment = ₹1,00,00,000
Total Sales Revenue = ₹1,25,00,000
Step 1: Calculate Net Profit
Net Profit=1,25,00,000−1,00,00,000 =₹25,00,000
Step 2: Calculate ROI
ROI=1,00,00,00025,00,000×100 ROI=25%
👉 Interpretation: The project earns 25% return on invested capital.
✅ Example 2: Solar Panel Installation
Installation Cost = ₹5,00,000
Total Savings over 5 years = ₹6,20,000
Net Profit:6,20,000−5,00,000=₹1,20,000 ROI=5,00,0001,20,000×100 ROI=24%
👉 Sustainable investment is financially viable.
✅ Example 3: Urban Parking Facility
Investment = ₹2,50,00,000
Total Revenue over 5 years = ₹2,75,00,000
Net Profit:2,75,00,000−2,50,00,000=₹25,00,000 ROI=2,50,00,00025,00,000×100 ROI=10%
👉 Moderate return; compare with alternative land use.
7️⃣ Advantages of ROI
✔ Simple to calculate
✔ Easy to understand
✔ Useful for comparing alternatives
✔ Helpful in early-stage feasibility studies
✔ Widely accepted by investors
8️⃣ Limitations of ROI
❌ Ignores time value of money
❌ Does not consider risk
❌ Not suitable alone for long-term public projects
❌ Does not include social and environmental benefits
Therefore, ROI is often combined with:
- Net Present Value (NPV)
- Internal Rate of Return (IRR)
- Cost–Benefit Analysis (CBA)
9️⃣ ROI in Planning Decision-Making
In architecture and urban planning, ROI helps in:
- Evaluating density options
- Comparing building materials
- Assessing TOD commercial potential
- Estimating feasibility of PPP projects
- Supporting Detailed Project Reports (DPR)
🔟 Conclusion
Return on Investment (ROI) is a fundamental financial tool that links architectural design and urban planning decisions with economic feasibility. It provides a clear, percentage-based measure of profitability, helping planners and architects ensure that projects are not only technically sound but also financially sustainable.


You must be logged in to post a comment.