Using the Chi-square Test to Study Awareness Across Demographic Variables

In social science, education, health, marketing, and development research, one of the most common questions is:
Does awareness about a particular scheme, service, or product vary across demographic groups such as age, education, income, or occupation?

To answer this, researchers often use the Chi-square test of independence. It is a non-parametric test that determines whether two categorical variables are related or independent of each other. For example, we may want to know if:

  • Awareness of digital banking varies by education level.
  • Awareness of government health insurance differs across income categories.
  • Awareness of renewable energy schemes depends on location (urban/rural).

What is the Chi-square Test of Independence?

The Chi-square test checks whether the distribution of one categorical variable depends on another categorical variable. It compares:

  • Observed frequencies (O): Actual counts from the survey or data.
  • Expected frequencies (E): Counts we would expect if there were no relationship between the variables.

If the difference between O and E is large, the test shows a significant relationship.


Application in Awareness Studies

Step 1: Collect Data

Suppose a researcher wants to test whether awareness of a government scheme is related to education level. The data from 200 respondents may look like this:

Education LevelAwareNot AwareTotal
Illiterate203050
Primary Education302050
Secondary Education401050
Higher Education45550
Total13565200

Step 2: Set Hypotheses

  • Hโ‚€ (Null Hypothesis): Awareness is independent of education level.
  • Hโ‚ (Alternative Hypothesis): Awareness is associated with education level.

Step 3: Calculate Expected Frequencies


Step 4: Apply Chi-square Formula


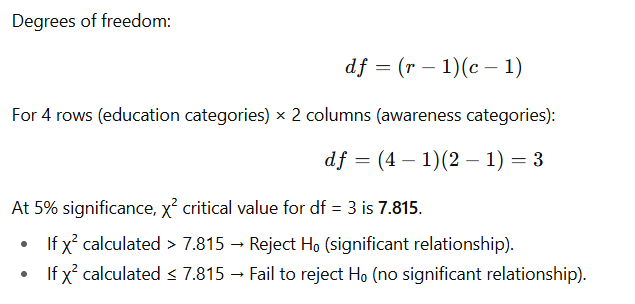
Step 5: Degrees of Freedom and Significance


Interpretation of Results

  • A significant result means awareness is not evenly distributed across demographic categories. For example, education might strongly influence awareness levels.
  • A non-significant result means awareness is independent of that demographic factor.

Importance of the Chi-square Test in Awareness Studies

  1. Identifies influencing factors โ€“ shows which demographic groups have higher or lower awareness.
  2. Guides policy and planning โ€“ awareness campaigns can be targeted at groups with low awareness.
  3. Simple yet powerful โ€“ works well with survey data and categorical variables.

Limitations

  • Does not measure the strength of the relationship, only whether it exists.
  • Requires a sufficiently large sample size (expected frequency in each cell โ‰ฅ 5).
  • Works only with categorical data, not continuous variables.

Conclusion

The Chi-square test of independence is a widely used statistical tool for analyzing whether awareness of a scheme, product, or program is associated with demographic variables. It provides researchers and policymakers with valuable insights into which groups are better informed and which require more attention. By applying this test, organizations can design targeted interventions, awareness drives, and policy measures that effectively reach the intended beneficiaries.

Expanded Literature Review Table (Scopus Database)


๐Ÿ” How This Helps in Scopus-Based Literature Review

  1. Scopus Filters โ€“ You can directly extract Year, Source, Publisher, Country, Citations, and Keywords from Scopus metadata.
  2. Comparative Analysis โ€“ Helps you see trends by year, most cited works, or country contributions.
  3. Gap Identification โ€“ The Limitations/Gaps column forces critical review beyond summarization.
  4. Relevance Tracking โ€“ The last column ensures you connect each paper to your research objectives.
  5. Keyword Mapping โ€“ Useful for thematic clustering and bibliometric analysis later.

Doing a Literature Review using Scopus Database

A literature review is not just collecting papers; it is about analyzing, comparing, and identifying gaps in past studies to justify your own research. Scopus is a very useful database for this process.


๐Ÿ”Ž Step 1: Define Your Research Topic

  • Write down your research question or theme (e.g., โ€œRole of metro rail in sustainable urban transportโ€).
  • Identify keywords (e.g., metro rail, sustainability, public transport, pollution reduction).
  • Think of synonyms and variations (e.g., โ€œurban transit,โ€ โ€œmass rapid transit,โ€ โ€œrail-based mobilityโ€).

๐Ÿ‘‰ Tip: Use Boolean operators in Scopus search:

  • AND = combine (e.g., metro rail AND sustainability)
  • OR = include synonyms (e.g., โ€œmetro railโ€ OR โ€œmass rapid transitโ€)
  • NOT = exclude (e.g., โ€œsustainability NOT ruralโ€)

๐Ÿ“ฅ Step 2: Search in Scopus

  • Go to Scopus.
  • Enter your keywords in the advanced search bar.
  • Use filters:
    • Year (e.g., last 10 years)
    • Document type (articles, reviews, conference papers)
    • Subject area (engineering, social sciences, environmental studies).

๐Ÿ‘‰ Export results (usually Scopus allows export to Excel, CSV, or RIS).


๐Ÿ“Š Step 3: Collect Metadata

From Scopus you will get:

  • Title of paper
  • Author(s)
  • Year of publication
  • Journal/Conference name
  • Publisher
  • Country of affiliation
  • Abstract and keywords
  • Citation count

This is the raw data you will organize into a table.


๐Ÿ“ Step 4: Read and Summarize Papers

For each paper:

  1. Skim abstract โ†’ to know aim, method, and findings.
  2. Read methodology โ†’ note approach (survey, modeling, simulation, case study, review).
  3. Check conclusions โ†’ note key results and limitations.
  4. Note keywords โ†’ useful for thematic mapping.

๐Ÿ“‘ Step 5: Fill in the Review Table

Here is the detailed table for you:

S. No.Title & Author(s)YearSource (Journal/Conf.)PublisherCountry/RegionResearch Objective / AimMethodology / ApproachKey Findings / ResultsLimitations / GapsKeywords / ThemesCitations (from Scopus)Relevance to Your Study
1Sustainable Metro Rail and Urban Transport (Sharma et al.)2021Journal of Transport PolicyElsevierIndiaTo examine metroโ€™s role in sustainable mobilityCase study + surveyMetro reduced car usage by 25% in DelhiDid not include suburban commutersMetro rail, sustainability, public transport45Highly relevant
2Urban Transit for Pollution Control (Lee & Park)2019Transport Research Part DElsevierSouth KoreaTo assess pollution control through transit policyEconometric modelingBRT improved air quality in SeoulOnly one city consideredAir quality, BRT, transport policy90Moderate relevance
3โ€ฆโ€ฆโ€ฆโ€ฆโ€ฆโ€ฆโ€ฆโ€ฆโ€ฆโ€ฆโ€ฆโ€ฆ

๐Ÿ“Œ Step 6: Analyze and Synthesize

Once the table is filled:

  • Identify patterns: Which countries are leading? Which years had more research?
  • Compare methods: Are most using surveys, models, or simulations?
  • Spot gaps: Are rural areas, low-income cities, or gender aspects under-researched?
  • Build your argument: Show how your research will fill those gaps.

๐Ÿงฉ Step 7: Write the Literature Review

Use your table to structure the review:

  1. Chronological approach โ†’ How studies evolved over years.
  2. Thematic approach โ†’ Group by themes (e.g., sustainability, pollution, accessibility).
  3. Methodological approach โ†’ Group by methods used (survey, simulation, case studies).

โœ… By following these steps, a new student can move from โ€œsearching papersโ€ to โ€œanalyzing literature criticallyโ€ using Scopus.