SALSA Literature Review Technique

By Shashikant Nishant Shama

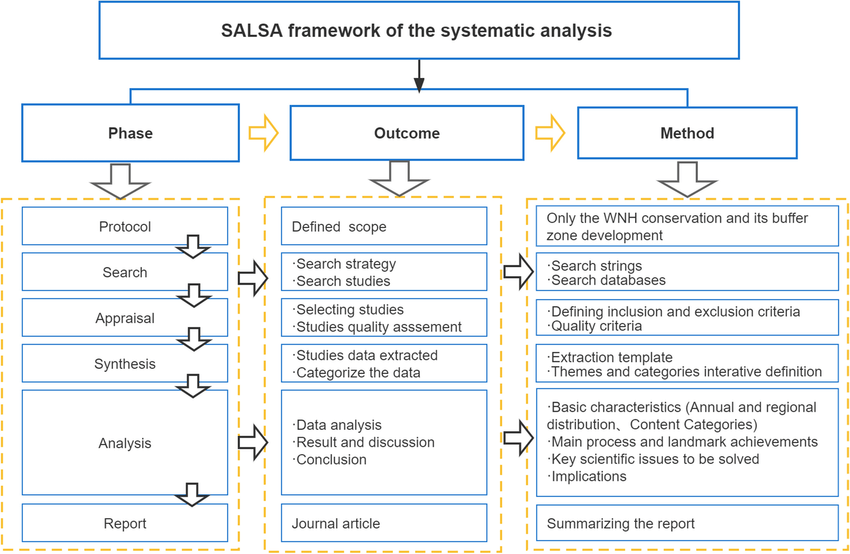
The SALSA framework is a methodological approach designed to structure and streamline the process of conducting a literature review. It stands for Search, Appraisal, Synthesis, and Analysis. Each component corresponds to a step in systematically reviewing existing research to ensure that the review is comprehensive, critical, and useful for building knowledge.

The SALSA framework is particularly helpful for scholars, especially beginners, as it provides a clear roadmap for handling large volumes of literature and ensuring rigor in research writing.


1. Search

The first step involves identifying and collecting relevant literature. This is about systematically locating studies, journal articles, reports, and other academic works that are connected to the research problem.

Key tasks in the Search stage:

  • Define clear research questions or objectives.
  • Identify keywords, synonyms, and related terms to expand the search scope.
  • Select appropriate databases (e.g., Scopus, Web of Science, PubMed, Google Scholar).
  • Apply inclusion and exclusion criteria (e.g., timeline, geography, language, publication type).
  • Use Boolean operators (AND, OR, NOT) and filters to refine the results.
  • Keep track of search strategies for reproducibility.

Purpose: To ensure that the literature review is comprehensive and avoids bias by relying on a well-documented search strategy.


2. Appraisal

After collecting the studies, not all of them will be relevant or of high quality. This stage involves evaluating and filtering the collected literature based on pre-defined criteria.

Key tasks in the Appraisal stage:

  • Screen abstracts and titles for relevance.
  • Evaluate the methodological quality of the studies.
  • Identify gaps, limitations, and biases in the studies.
  • Exclude irrelevant, outdated, or poor-quality sources.
  • Use appraisal tools or checklists (e.g., CASP, PRISMA guidelines in medical fields).

Purpose: To ensure that only the most credible, relevant, and high-quality research is included in the review. This reduces noise and prevents misleading conclusions.


3. Synthesis

Once the relevant studies have been appraised, the next step is to combine and integrate findings from different sources.

Key tasks in the Synthesis stage:

  • Organize studies into themes, categories, or frameworks.
  • Compare and contrast findings across studies.
  • Identify trends, patterns, and recurring concepts.
  • Highlight contradictory evidence or debates in the literature.
  • Develop conceptual models or frameworks based on the findings.

Purpose: To build a coherent body of knowledge by integrating diverse findings, instead of just summarizing them one by one. This helps in identifying what is already known and what remains uncertain.


4. Analysis

The final stage is critical analysis, where the researcher goes beyond summarizing and synthesizing, to provide interpretations, implications, and evaluations.

Key tasks in the Analysis stage:

  • Critically assess the strength of existing evidence.
  • Discuss gaps in knowledge and areas for future research.
  • Relate the findings back to the research objectives or hypothesis.
  • Provide theoretical or practical implications of the literature.
  • Evaluate how the literature shapes or challenges the current understanding of the topic.

Purpose: To provide a critical, reflective, and value-adding perspective, ensuring the literature review contributes to advancing research rather than merely reporting past findings.


Advantages of the SALSA Technique

  • Provides a systematic structure for reviewing literature.
  • Helps manage large amounts of information efficiently.
  • Reduces the risk of bias in selecting or reporting literature.
  • Encourages critical evaluation rather than simple summarization.
  • Ensures transparency and replicability, which are key in academic research.

Example Application of SALSA

Suppose a researcher is studying the effectiveness of e-learning in higher education.

  • Search: Use databases like Scopus and Google Scholar with keywords “e-learning,” “higher education,” “student performance,” “online teaching effectiveness.”
  • Appraisal: Select peer-reviewed studies from the last 10 years, exclude non-academic blogs or outdated articles, and prioritize studies with strong empirical methods.
  • Synthesis: Group findings into themes such as student engagement, learning outcomes, teacher perspectives, and technology challenges.
  • Analysis: Critically assess whether e-learning truly enhances performance, point out contradictions (e.g., some studies show improvement, others show decline), and suggest areas where future studies should focus (e.g., long-term impacts or hybrid models).

Tabular representation of the SALSA literature review technique with steps, key tasks, and expected outcomes:


StepKey TasksExpected Outcomes
Search– Define research objectives and questions
– Identify keywords, synonyms, Boolean operators
– Select databases (Scopus, Web of Science, Google Scholar, etc.)
– Apply inclusion/exclusion criteria (time period, language, document type)
– Document the search strategy
A comprehensive collection of potentially relevant studies and academic sources
Appraisal– Screen titles and abstracts
– Review full texts for relevance
– Assess methodological quality
– Exclude weak, irrelevant, or outdated studies
– Use appraisal tools/checklists (e.g., CASP, PRISMA)
A refined set of credible, high-quality studies directly relevant to the research
Synthesis– Organize selected studies into themes/categories
– Compare and contrast findings
– Identify similarities, contradictions, and trends
– Develop conceptual frameworks or models
A coherent synthesis of existing knowledge highlighting patterns and key debates
Analysis– Critically evaluate the evidence
– Relate findings to research questions
– Identify research gaps and future directions
– Provide theoretical and practical implications
– Draw conclusions from the literature
A critical, insightful review that advances understanding and sets an agenda for further research

โœ… This table can be easily adapted into a checklist format for students or researchers while conducting their literature reviews.

The SALSA framework (Search, Appraisal, Synthesis, and Analysis) is a practical and structured approach for conducting a systematic literature review. It moves researchers from a broad pool of information to a refined, critically evaluated, and insightful body of work. By following these four stages, scholars ensure that their literature review is transparent, comprehensive, and academically rigorous, forming a strong foundation for future research.

References

Dehalwar, K., & Sharma, S. N. (2023). Fundamentals of research writing and uses of research methodologies. Edupedia Publications Pvt Ltd.

Dehalwar, K., & Sharma, S. N. (2024). Social Injustice Inflicted by Spatial Changes in Vernacular Settings: An Analysis of Published Literature. ISVS e-journal, Vol. 11, Issue 9. https://isvshome.com/pdf/ISVS_11-09/ISVSej_11.09.07.pdf

Dehalwar, K. S. S. N., & Sharma, S. N. (2024). Exploring the distinctions between quantitative and qualitative research methods. Think India Journal27(1), 7-15.

Grant, M. J., & Booth, A. (2009). A typology of reviews: an analysis of 14 review types and associated methodologies. Health information & libraries journal26(2), 91-108.

Mengist, W., Soromessa, T., & Legese, G. (2020). Method for conducting systematic literature review and meta-analysis for environmental science research. MethodsX7, 100777.

Sahoo, S. K., Tengli, M. B., Meeyo, H., Gaurav, S., & Singh, M. S. A Systematic Literature Review on Agrotourism Models (SALSA Approach): Mapping Research Trends and Key Factors.

Sharma, S. N., & Dehalwar, K. (2025). A Systematic Literature Review of Transit-Oriented Development to Assess Its Role in Economic Development of City. Transportation in Developing Economies11(2), 23.

Sharma, S. N., Kumar, A., & Dehalwar, K. (2024). The precursors of transit-oriented development. EPW Economic & Political Weekly59(16), 14.

Sharma, S. N. (2019). Review of most used urban growth models. International Journal of Advanced Research in Engineering and Technology (IJARET)10(3), 397-405.

Using t-test and ANOVA to Compare Effectiveness Perceptions Across Groups

In many research studies, we not only want to measure the effectiveness of a program, scheme, or service, but also want to know whether perceptions of effectiveness differ across different groups of people. For example:

  • Do educated and less-educated respondents perceive a government scheme differently?
  • Do small, medium, and large farmers rate the effectiveness of a credit facility differently?
  • Do urban and rural respondents vary in their satisfaction with digital services?

To answer such questions, statistical tests like the t-test and Analysis of Variance (ANOVA) are commonly used.


When to Use t-test and ANOVA

  1. t-test
    • Used when comparing the means of two groups.
    • Example: Comparing the average effectiveness perception score between male and female respondents or rural vs. urban respondents.
    Types:
    • Independent samples t-test โ€“ when two different groups are compared.
    • Paired samples t-test โ€“ when the same group is measured before and after an intervention.
  2. ANOVA (Analysis of Variance)
    • Used when comparing the means of more than two groups.
    • Example: Comparing effectiveness perceptions across education levels (illiterate, primary, secondary, higher) or income categories (low, medium, high).

Measuring Effectiveness Perception

Usually, effectiveness is measured using a Likert scale (e.g., 1 = Strongly Disagree, 5 = Strongly Agree) for items like:

  • Timely delivery of services.
  • Adequacy of benefits.
  • Ease of access.
  • Transparency in the system.

Respondentsโ€™ answers can be aggregated to form an effectiveness score (average or sum), which becomes the dependent variable for analysis.


Steps for Applying t-test / ANOVA

Step 1: Formulate Hypotheses

  • Null Hypothesis (Hโ‚€): There is no significant difference in effectiveness perceptions across groups.
  • Alternative Hypothesis (Hโ‚): There is a significant difference in effectiveness perceptions across groups.

Step 2: Independent Samples t-test (Two Groups)

Suppose you want to compare effectiveness scores between urban and rural respondents:

GroupMean Effectiveness ScoreStd. Dev.Sample Size
Urban3.90.6100
Rural3.40.7100

If the calculated t-value exceeds the critical value (from the t-distribution table), reject Hโ‚€.


Step 3: One-way ANOVA (More Than Two Groups)

Suppose you want to compare perceptions across four education levels:

Education LevelMean Effectiveness Score
Illiterate3.1
Primary Education3.5
Secondary Education3.8
Higher Education4.2

ANOVA partitions the variation in scores into:

  • Between-group variance (differences in means across groups).
  • Within-group variance (differences within each group).

The F-ratio is then calculated as: F=Between-group varianceWithin-group varianceF = \frac{\text{Between-group variance}}{\text{Within-group variance}}F=Within-group varianceBetween-group varianceโ€‹

If F > critical F (from F-distribution table), reject Hโ‚€.


Step 4: Post-hoc Tests (for ANOVA)

If ANOVA shows a significant difference, we need to find which groups differ.

  • Post-hoc tests like Tukeyโ€™s HSD or Bonferroni test help identify the exact group differences.
  • Example: Higher education group may perceive significantly greater effectiveness than the illiterate group.

Interpretation of Results

  • A significant t-test result means two groups differ in their perception of effectiveness.
  • A significant ANOVA result means at least one group differs from others, but post-hoc tests are needed to locate the difference.
  • A non-significant result means perceptions are statistically the same across groups.

Importance in Awareness & Effectiveness Studies

  • Helps identify demographic disparities in perception.
  • Provides evidence for targeted policy interventions (e.g., improving effectiveness for disadvantaged groups).
  • Ensures resource allocation is based on actual needs reflected in perception differences.

Limitations

  • Assumes data is approximately normally distributed.
  • Sensitive to outliers in small samples.
  • Only tests for differences in means, not the cause of those differences.

Conclusion

The t-test and ANOVA are essential tools for comparing perceptions of effectiveness across groups. They allow researchers to statistically determine whether different categories of respondents (based on education, income, location, or other demographics) perceive a program or service differently. These insights are crucial for refining programs, making them more inclusive, and ensuring that all groups benefit equally.

Understanding Demographic Variables: Definition, Types, and Importance

๐Ÿ”น What are Demographic Variables?

Demographic variables are statistical characteristics of populations that researchers, policymakers, and businesses use to understand groups of people. They provide quantifiable data about who people are in terms of age, gender, income, education, family structure, location, and other attributes.

In research, demographic variables are often used as independent variables (to study their effect on behavior, choices, or attitudes) or as control variables (to ensure fair comparisons across groups).


๐Ÿ”น Why Are Demographic Variables Important?

  1. Social Research โ†’ Helps in understanding social structures, inequality, mobility, and population trends.
  2. Policy Making โ†’ Guides governments in designing education, healthcare, housing, and employment policies.
  3. Marketing & Business โ†’ Businesses use demographic profiling to identify target customers and segment markets.
  4. Urban Planning โ†’ Planners use demographics to design infrastructure, transport, housing, and public services.
  5. Public Health โ†’ Demographics like age, gender, and income influence health risks and healthcare needs.

๐Ÿ”น Common Types of Demographic Variables

VariableExplanationExamples
AgeOne of the most basic variables, used to group populations by life stage.Children (0โ€“14), Youth (15โ€“24), Adults (25โ€“64), Elderly (65+)
Gender / SexBiological sex or gender identity, important for studying social roles, equality, and consumer behavior.Male, Female, Non-binary
Income / Socioeconomic StatusReflects purchasing power, lifestyle, and access to resources.Low income (<$20,000), Middle income, High income
Education LevelIndicates skill levels, literacy, and career opportunities.Primary, Secondary, Higher Education, Doctorate
Occupation / Employment StatusShows economic activity and professional identity.Student, Employed, Self-employed, Retired
Marital Status & Family StructureShapes household spending, housing needs, and social support.Single, Married, Divorced, Nuclear/Joint family
Religion / EthnicityCultural and social identity markers, often linked with traditions and practices.Hindu, Muslim, Christian; Ethnic groups
Geographic LocationDetermines accessibility, lifestyle, and opportunities.Urban vs. Rural, Region, State, Country
Household SizeImpacts consumption patterns, housing needs, and mobility choices.Single-person household vs. joint family
LanguageIndicates communication needs and cultural identity.Hindi, English, Spanish, Mandarin

๐Ÿ”น Applications of Demographic Variables

  1. In Academic Research
    • Sociologists study inequality using income, caste, or gender.
    • Psychologists examine how age affects learning or memory.
    • Economists analyze how employment status influences consumption.
  2. In Business & Marketing
    • A company selling baby products targets young parents (Age + Family Structure).
    • Luxury brands market to high-income professionals (Income + Occupation).
    • Regional ads use local language (Geographic Location + Language).
  3. In Public Policy & Planning
    • Governments forecast school needs using child population data (Age + Location).
    • Healthcare policies for elderly depend on aging population statistics.
    • Urban planners use household size and migration patterns to plan housing.
  4. In Healthcare
    • Age and gender are key for predicting disease risks.
    • Income and education affect healthcare access and awareness.

๐Ÿ”น Examples of Demographic Variables in Use

  • Census Surveys: National censuses collect data on age, sex, literacy, occupation, and household structure.
  • Market Segmentation: Amazon segments users based on age (tech-savvy youth vs. senior citizens) and income.
  • Transportation Planning: Demographics help decide whether a city needs more public transport for working adults or cycling facilities for students.
  • Elections: Political campaigns target voters using demographic categories like age, caste, religion, or income group.

๐Ÿ”น Key Takeaways

  • Demographic variables are the building blocks of population studies.
  • They help in understanding diversity, predicting behavior, and designing policies and business strategies.
  • A strong understanding of demographic variables enables researchers, businesses, and policymakers to make evidence-based decisions.