


The up-gradation of the District Centre at Nehru Place, New Delhi, is a significant urban development initiative undertaken as part of a UDF (Urban Development Fund) Project. Nehru Place, known as one of Asia’s largest IT and electronics commercial hubs, has long been a vital economic centre of Delhi. However, decades of intense commercial activity, increasing footfall, traffic congestion, ageing infrastructure, and lack of quality public spaces have necessitated a comprehensive redevelopment and up-gradation. Phase-I of this project focuses on integrated urban renewal through Design, Engineering, Procurement, and Construction (EPC) basis, along with Operation and Maintenance (O&M), ensuring long-term functionality and sustainability.
Background and Need for Up-gradation
Nehru Place District Centre experiences exceptionally high daily pedestrian and vehicular movement due to its concentration of offices, retail outlets, service centres, and transit connectivity. Over time, the area has faced challenges such as fragmented pedestrian movement, inadequate public amenities, poor-quality open spaces, insufficient parking management, and outdated electrical and utility infrastructure. The up-gradation project aims to transform Nehru Place into a safe, accessible, vibrant, and economically efficient district centre, aligned with contemporary urban design and infrastructure standards.
Scope of Work under Phase-I
The Phase-I up-gradation includes a wide range of civil, electrical, landscape, and public realm interventions, executed on an EPC basis with integrated O&M. The major components are detailed below.
Construction of Commercial Space
The project includes the development of organised commercial spaces to rationalise informal activities and enhance economic productivity. These spaces are planned with modern design standards, improved accessibility, and compliance with fire, safety, and structural norms. Well-planned commercial areas help decongest existing blocks, improve user experience, and increase revenue generation for long-term maintenance.
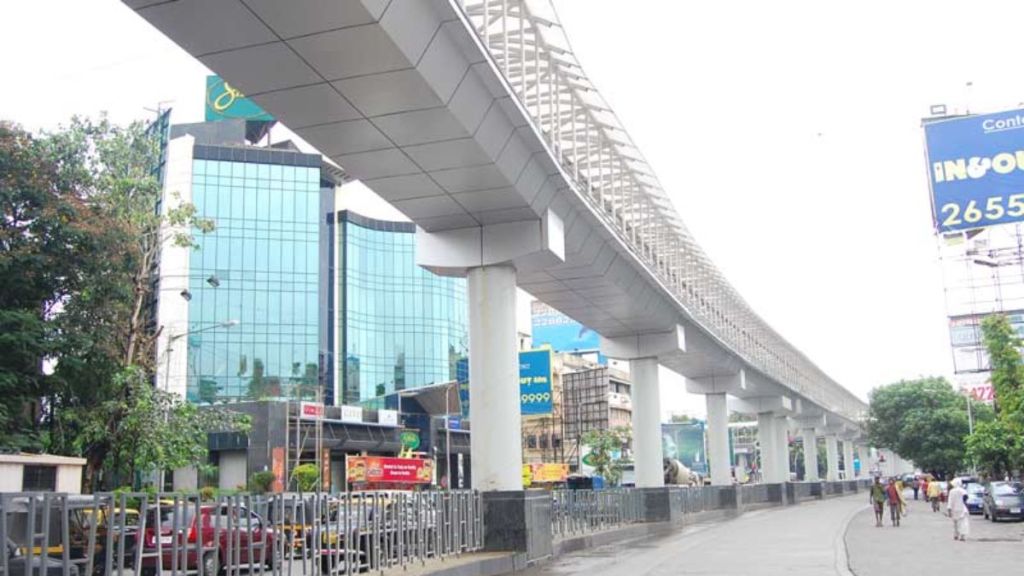
Skywalk Development
One of the most critical components is the construction of a skywalk to ensure safe, uninterrupted pedestrian movement across high-traffic corridors. The skywalk connects major activity nodes, metro access points, parking areas, and commercial blocks, significantly reducing pedestrian-vehicular conflict. Designed with universal accessibility features such as ramps, lifts, and clear signage, the skywalk enhances walkability and inclusiveness, especially for elderly users, children, and persons with disabilities.
Public Toilets and Urban Amenities
Provision of modern, hygienic public toilet facilities is a key social infrastructure component. These toilets are designed with adequate capacity, accessibility, water-efficient fixtures, proper ventilation, and mechanised maintenance systems. Such facilities are crucial in high-footfall commercial areas to ensure dignity, hygiene, and public health.
Plaza and Amphitheatre Development
The project proposes the development of a central urban plaza and amphitheatre, transforming Nehru Place from a purely commercial district into a lively public realm. The plaza acts as a gathering space for office workers, visitors, and local communities, while the amphitheatre provides a venue for cultural events, performances, public meetings, and informal recreation. These elements contribute to placemaking, social interaction, and cultural expression within the district centre.
Tensile Shading Structures
To address climatic comfort in Delhi’s extreme weather conditions, tensile shading structures are introduced across key pedestrian zones, plazas, and open areas. These lightweight yet durable structures provide protection from heat and rain while enhancing the visual identity of the district centre. Shaded spaces encourage longer pedestrian stay, increased street activity, and improved comfort.
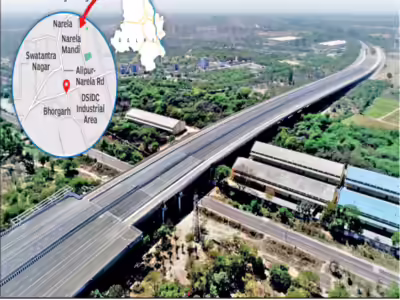
Development Works: Roads, Footpaths, and Parking
Comprehensive road and circulation improvements form a core part of the project. This includes resurfacing of internal roads, junction improvements, traffic calming measures, and better signage. Footpaths are redesigned with adequate width, non-slip surfaces, tactile paving, and barrier-free access to prioritise pedestrians.
Parking development focuses on organised, efficient, and safer parking systems, reducing random on-street parking and improving traffic flow. Improved parking management directly supports commercial activity and reduces congestion.
Horticulture and Landscape Works
Horticulture and landscaping are essential to improving environmental quality in a dense commercial district. The project includes tree plantation, green buffers, planters, lawns, and landscaped open spaces, contributing to microclimate improvement, dust reduction, and visual relief. Native and low-maintenance plant species are preferred to ensure sustainability and ease of maintenance.
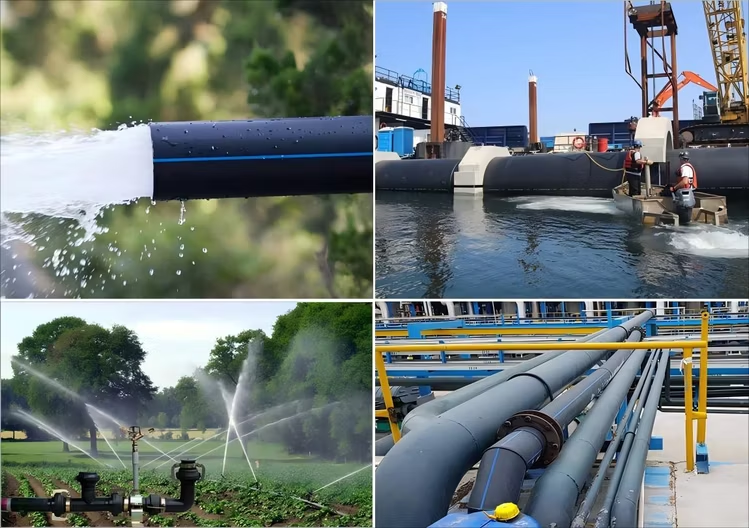
Electrification and Allied Works
Up-gradation of electrical infrastructure includes modern street lighting, decorative lighting for plazas and facades, energy-efficient LED systems, underground cabling, and reliable power distribution networks. Allied works also cover ICT infrastructure, CCTV surveillance, public address systems, and safety installations, contributing to security and smart district management.
EPC and Operation & Maintenance Framework
Executing the project on an EPC basis ensures single-point responsibility for design, quality, time, and cost control. Integration of Operation and Maintenance (O&M) within Phase-I ensures that assets created under the project remain functional, safe, and well-maintained for the intended period. This approach enhances accountability, lifecycle efficiency, and long-term value for public investment.
Significance of the UDF Project
As a UDF Project, the up-gradation of Nehru Place District Centre demonstrates a structured approach to financing and implementing urban renewal. It aligns infrastructure investment with economic revitalisation, public realm improvement, and institutional efficiency. The project not only upgrades physical infrastructure but also strengthens Nehru Place’s role as a major commercial and employment hub in New Delhi.
Conclusion
The Phase-I up-gradation of the District Centre at Nehru Place represents a holistic urban redevelopment initiative that integrates commercial growth, pedestrian safety, public amenities, cultural spaces, and environmental enhancement. Through components such as skywalks, plazas, amphitheatres, improved roads, parking, landscaping, and modern electrification—executed on an EPC basis with O&M—the project aims to transform Nehru Place into a vibrant, inclusive, and future-ready district centre. As a UDF Project, it sets a strong precedent for sustainable, well-managed, and people-centric urban renewal in Delhi and other metropolitan cities.


You must be logged in to post a comment.