The medieval period, spanning roughly the 5th to 15th centuries CE, witnessed the widespread development of walled cities and fortified settlements across Europe, the Middle East, and parts of Asia. These fortifications were a response to frequent invasions, raids, and political instability, as well as a reflection of social hierarchy, military technology, and urban planning strategies. Walled cities not only provided protection but also served as administrative, economic, and religious centers, shaping the structure and life of medieval societies.
Photo by Miquel Rossellu00f3 Calafell on Pexels.com
Historical Context
Following the fall of the Roman Empire, Europe faced a prolonged period of instability known as the Early Middle Ages. Invasions by Vikings, Magyars, and Saracens, coupled with internal conflicts between feudal lords, created a need for secure settlements. Towns and villages were often clustered around castles, monasteries, or natural defensible sites such as hilltops and river bends.
The concept of the walled city evolved from Roman military fortifications, which were adapted to meet the changing needs of medieval society. Fortified cities became a symbol of power, wealth, and authority, as well as a practical measure for survival in an insecure environment.
Key Features of Walled Cities
City Walls
The primary defensive element, often made of stone or brick and sometimes reinforced with earthworks.
Walls were thick and high, capable of withstanding siege engines and attacks.
Walkways and battlements allowed defenders to patrol and launch counterattacks.
Gates and Gatehouses
Walled cities had limited entry points called gates, which were heavily guarded and often equipped with portcullises, drawbridges, and towers.
Main gates served as both security checkpoints and economic control points, where taxes or tolls could be collected.
Examples: Bristol (England) and Carcassonne (France) had multiple gates integrated with defensive towers.
Towers and Bastions
Towers were placed at intervals along the wall for surveillance and defense.
Bastions projected outward from the wall, allowing defenders to flank attackers and cover blind spots.
Round towers became popular in later medieval periods as they were more resistant to battering than square towers.
Moats and Ditches
Many walled cities were surrounded by moats filled with water or dry ditches, creating an additional obstacle for attackers.
Moats served both defensive and drainage purposes and sometimes supplied water to the town.
Fortified Citadel or Keep
Within the city, a castle or citadel served as the last line of defense.
The keep housed the ruling lord or garrison and contained armories, storage, and living quarters.
Example: The Tower of London functioned both as a fortress and a royal residence.
Narrow Streets and Urban Layout
Streets inside walled cities were narrow, winding, and often irregular, designed to slow down invaders.
Central areas contained the market square, town hall, and major church, while peripheral zones were occupied by artisans and laborers.
Purpose of Walled Cities
Defense and Military Security
Protection from external threats such as rival lords, bandits, and invading armies.
Allowed townspeople to survive sieges, with walls providing space for stockpiling food and water.
Symbol of Authority
Walls and gates represented the power and prestige of the ruler, bishop, or local lord.
Cities with impressive fortifications attracted settlers and traders, strengthening economic and political control.
Economic and Social Control
Gates regulated the flow of goods, people, and taxes, enabling effective economic management.
Guilds, markets, and religious institutions flourished within protected walls, ensuring civic stability.
Fortification Techniques and Evolution
Medieval fortification evolved in response to advancements in military technology:
Early Medieval Walls
Simple stone or timber walls with towers at corners and gates.
Example: Rothenburg ob der Tauber (Germany) used basic stone walls for defense.
High Middle Ages (11th–13th century)
Introduction of concentric walls — multiple layers of walls with interlocking gates.
Machicolations and arrow slits allowed defenders to attack without exposing themselves.
Examples: Carcassonne (France) and Avila (Spain) are classic concentric walled cities.
Late Medieval Period (14th–15th century)
Adaptation to gunpowder artillery led to lower, thicker walls with angled bastions.
Star forts and earthworks emerged in parts of Europe to counter cannon fire.
Example: Italian cities like Palmanova show geometric fortifications designed for artillery defense.
Examples of Walled Cities
Carcassonne, France: Famous for double walls, moats, and 53 towers.
Avila, Spain: Preserved medieval stone walls with fortified gates.
Rothenburg ob der Tauber, Germany: Example of a medieval trade town with protective walls.
York, England: Roman origins with medieval enhancements; walls encircle much of the historic city.
Dubrovnik, Croatia: Coastal walled city with massive fortifications to guard against sea invasions.
Impact on Urban Life
Walled cities influenced social, economic, and urban structures:
Population Density: Limited space within walls encouraged vertical building and compact urban design.
Social Hierarchy: Wealthier inhabitants lived near the center; lower classes occupied peripheral areas.
Commerce: Market squares inside walls became hubs for trade, guilds, and public gatherings.
Culture: Religious and civic buildings within fortified areas reflected authority and identity.
While walls provided security, they also restricted expansion. As populations grew and defense became less critical in later centuries, towns often expanded beyond walls, leading to the development of suburbs and modern urban planning.
Conclusion
Walled cities and fortifications were a defining feature of medieval urban life, shaped by the need for security, economic control, and social organization. They combined military engineering, architectural innovation, and urban planning to create settlements that could withstand invasions while supporting thriving communities. From imposing stone walls and towers to moats and citadels, these cities reflect the priorities and ingenuity of medieval societies. Even today, surviving walled towns are admired as symbols of medieval power, craftsmanship, and urban design.
Governance in a federal or quasi-federal structure, such as India, is predicated upon a critical duality of policymaking: the national and the state levels. This essay examines the essential, complementary, yet occasionally divergent roles played by these two spheres of authority in steering a nation towards its developmental goals. National policies provide the overarching vision, strategic direction, and universal standards necessary for cohesion, economic integration, and international standing. Conversely, state-level policies ensure context-specific, localized implementation, and tailored solutions that address regional heterogeneity, cultural nuances, and specific demographic needs. Effective governance, therefore, relies on a dynamic equilibrium, or ‘cooperative federalism,’ where the synergy between these two policy spheres maximizes efficiency, equity, and responsiveness in achieving inclusive socio-economic progress.
1. Introduction
The policy landscape of any large, diverse nation is a complex tapestry woven from the threads of central and sub-national policy imperatives. Policies, fundamentally, are deliberate systems of principles to guide decisions and achieve rational outcomes, and their formulation reflects a state’s aspirations, values, and priorities. In nations with a federal character, the constitutional division of powers creates two distinct, yet interdependent, arenas for policy action. The central or national government focuses on issues of strategic, macro-economic, and national security importance, utilizing its position to establish common frameworks. Simultaneously, the state or regional governments, being closer to the ground realities, focus on matters directly impacting the daily lives of their citizens, such as public order, health, and agriculture. Understanding the separate and combined roles of these two levels is crucial to appreciating the dynamics of national development, where top-down mandates must successfully meet bottom-up requirements. This duality is not merely a jurisdictional division but a strategic necessity for managing the intrinsic complexity and diversity of a large population and varied geographical expanse.
2.National Policies: The Visionary Blueprint and Unifying Framework
National policies serve as the visionary blueprint for the entire nation, establishing fundamental principles, long-term objectives, and binding standards that ensure unity and equitable development across all geographical regions. Their primary role is to manage issues that transcend state boundaries or require a coordinated approach to maintain national integrity and international competitiveness.
One of the most significant functions of national policy is macro-economicregulation and planning. The central government is responsible for fiscal policy, monetary policy, foreign trade, and large-scale infrastructure projects like national highways, railways, and telecommunications. Policies such as the Goods and Services Tax (GST) in India, for instance, exemplify the national government’s power to create a unified common market, dismantling inter-state barriers and streamlining the economic process, thereby boosting overall efficiency and investment. Furthermore, national policies are the sole custodians of defense, foreign affairs, and national security, setting the nation’s posture on the global stage and ensuring its sovereignty and protection.
In the realm of social welfare and human development, national policies play a crucial role in establishing minimum universal standards and addressing national-level disparities. Major central government schemes, whether for food security, universal education (like the National Education Policy, NEP 2020), or healthcare insurance (like Ayushman Bharat), aim to create a floor of entitlements and opportunities below which no citizen should fall, irrespective of their state of residence. This function of equity and redistribution is paramount, as the national government uses its taxing power to collect revenue from wealthier regions and allocate funds to support development in backward or poorer states, acting as a crucial national equalizer. Such policies foster a sense of shared citizenship and national integration by ensuring uniform access to fundamental rights and services.
3. State Policies: Local Context, Implementation, and Innovation
While national policies set the broad direction, it is the state-level policies that translate these mandates into tangible, on-the-ground outcomes, making them the crucible of practical governance and policy implementation. State governments, empowered by the constitutional framework to legislate on subjects like public order, health, land, and agriculture, are uniquely positioned to address the heterogeneity that characterizes large nations. The role of state policies is distinguished by its capacity for localization and customization.
The vast differences in climate, culture, economic structure, and demographic profiles necessitate that a one-size-fits-all national policy be adapted to local conditions. For instance, while a National Health Mission provides funding and guidelines, each state government formulates its specific public health policy regarding the operation of hospitals, disease surveillance, and sanitation, factoring in its unique regional disease burdens or infrastructural constraints. Similarly, state governments’ agricultural policies, dealing with land reforms, irrigation schemes, and crop procurement, are tailored to the specific soil conditions and prevalent cropping patterns of their regions. This allows for greater efficiency and responsiveness, as policymakers are intimately familiar with local demands and challenges.
Moreover, states often serve as laboratories of democracy, where innovative policy experiments are piloted before being potentially adopted at the national level or by other states. A state’s pioneering approach to renewable energy incentives, digital governance, or even poverty alleviation programs can provide valuable lessons and best practices for the entire nation. This competitive and collaborative federalism, where states compete to implement policies more effectively and learn from each other, drives overall national improvement. The states’ role is therefore not merely a submissive function of implementation but an active, creative one of adaptation, innovation, and direct service delivery, which critically determines the ultimate success or failure of any policy initiative.
4.The Indispensable Interface: Co-ordination and Conflict Resolution
The true art of federal governance lies in the effective interface between national and state policy frameworks. This interface, often termed Cooperative Federalism, requires robust institutional mechanisms for consultation, resource sharing, and conflict resolution. National policies frequently come with financial provisions, but their effective utilization depends on state capacity and political will. Bodies like the NITI Aayog (National Institution for Transforming India) in India, which replaced the Planning Commission, are designed precisely to foster this cooperation by providing a platform for states to contribute to national policymaking and for the central government to support state-specific priorities.
However, the relationship is not always seamless. Conflicts can arise from jurisdictional ambiguities, where subjects fall under the Concurrent List (allowing both levels to legislate), or from political disagreements, especially when different political parties govern the Centre and the states. For example, a national law might face resistance from state governments whose local economies or political bases are adversely affected. In such scenarios, mechanisms like the Inter-State Council and the judiciary play a crucial role in resolving disputes, interpreting constitutional provisions, and ensuring that the fundamental principles of the Constitution—such as the supremacy of national law on national issues and the autonomy of states on local matters—are maintained. The successful implementation of large-scale, centrally sponsored schemes, therefore, depends on clear guidelines, flexible adaptation by states, and a shared commitment to the ultimate goal of public welfare.
5.Conclusion
The dual role of national and state-level policies is the bedrock of governance in a diverse federal polity. National policies, with their emphasis on universal standards, macro-stability, economic integration, and national security, provide the essential structural foundation and unified vision. State-level policies, in turn, provide the necessary elasticity, contextual relevance, and precision in implementation, ensuring that the benefits of governance reach the last mile, taking into account local needs and ground realities. The dynamic interaction between these two spheres—a blend of central direction and regional discretion—is essential for transforming policy intent into developmental outcomes. Sustained progress is ultimately a function of how effectively this policy duality is managed: when national ambition is harmonised with state agility, the nation is positioned to achieve inclusive growth, social justice, and robust, resilient development. Therefore, the continuous effort to strengthen cooperative federalism and build institutional capacity at both levels remains the single most critical factor for future prosperity.
References
Austin, G. (1999). The Indian Constitution: Cornerstone of a Nation. Oxford University Press.
Bardhan, P., & Mookherjee, D. (2006). Decentralization and Local Governance in Developing Countries. MIT Press.
Dye, T. R. (2017). Understanding Public Policy (15th ed.). Pearson Education.
Government of India. (2020). National Education Policy 2020. Ministry of Education. [Source 1.3]
International Monetary Fund (IMF). (2007). Fiscal Federalism and the Efficiency of Public Spending: A Study in Regional Allocation. IMF Working Paper.
Joshi, R. (2013). Policies for Inclusive Growth in India. Routledge.
Lane, J. E. (2000). The Public Sector: Concepts, Models and Approaches. Sage Publications.
NITI Aayog, Government of India. (n.d.). Cooperative Federalism. Retrieved from the official NITI Aayog website. [Source 5.1]
Shah, A. (Ed.). (2007). The Practice of Fiscal Federalism: Comparative Perspectives. McGill-Queen’s University Press.
The Constitution of India. (n.d.). Part IV: Directive Principles of State Policy & Seventh Schedule (Union, State, and Concurrent Lists). [Source 1.2, 3.1]
India’s urban population is projected to reach 40% by 2030 and 900 million by 2050. While urban areas contribute 63% of GDP, they face critical challenges: housing shortage (19.1 million units), slum proliferation (104 million people), 80% informal employment, and weak governance. “Top-heavy” urbanization concentrates development in megacities (Delhi-NCR 32 million, Mumbai 20.4 million) while neglecting smaller towns and perpetuating regional inequality.
A comprehensive National Urbanization Policy is essential to address these issues through: strengthening municipal governance, promoting tier-2 and tier-3 cities, integrating land-use and transport planning, and adopting sustainable financing mechanisms. Government initiatives like Smart Cities Mission (₹98,000 crores), AMRUT (₹48,000 crores), and Pradhan Mantri Awas Yojana have made progress but face implementation challenges.
The vision for India’s urban future centers on three principles—Smart, Sustainable, and Equitable—ensuring urbanization becomes an instrument of inclusive prosperity while addressing environmental concerns and regional disparities through coordinated action across all government levels.
1. Introduction
Urbanization is a dynamic process characterized by the growth of cities and the concentration of human populations in urban areas, accompanied by the transformation of economic and social structures. In simple terms, it refers to the shift of population from rural to urban settlements, where more than 50% of the population lives in cities and towns. For India, a nation with a predominantly agrarian heritage, urbanization represents a fundamental shift in its development trajectory.
The importance of urbanization in India’s economic and social development cannot be overstated. Urban areas generate approximately 63% of India’s Gross Domestic Product (GDP), despite housing only about 35% of the population as of 2024. Cities serve as engines of economic growth, innovation, and employment generation. They provide enhanced access to education, healthcare, and other services, thereby contributing to human development. However, India’s urbanization has been largely unplanned and haphazard, resulting in acute challenges such as housing shortages, infrastructural deficits, environmental degradation, and widespread poverty in urban centers. The need for a comprehensive national policy framework to manage urban growth has become imperative to ensure that urbanization becomes an instrument of inclusive and sustainable development rather than a source of social fragmentation and environmental crisis.
2. Need for a National Urbanization Policy
India is witnessing unprecedented urbanization. According to the 2011 Census, the urban population was 377.1 million (31.2% of total population), projected to reach 600 million (40% of total population) by 2030 and 900 million by 2050. This rapid increase in urban population presents both opportunities and challenges. Between 1991 and 2011, the urban population growth rate averaged 2.7% annually, significantly outpacing rural growth.
The necessity of planned urban growth stems from several critical factors. Unplanned urbanization leads to sprawl, inefficient land use, inadequate infrastructure, environmental degradation, and the proliferation of slums. Without coherent policy guidance, cities grow chaotically, burdening existing infrastructure and creating pockets of severe deprivation. India’s experience with cities like Delhi, Mumbai, and Bengaluru demonstrates the consequences of reactive rather than proactive urban planning.
A national urbanization policy must facilitate the integration of rural-urban development, recognizing that cities and rural areas are interconnected components of a single system. Rural migration to cities is driven by the search for better livelihood opportunities, but without planned development, cities cannot absorb migrants productively. Furthermore, the policy must address the “top-heavy” nature of Indian urbanization, where a disproportionate share of development concentrates in a few megacities, leaving smaller towns and medium cities underdeveloped.
The role of policy in guiding sustainable and inclusive urbanization is fundamental. A well-articulated national urbanization policy provides the institutional, financial, and regulatory framework necessary to shape urban development in accordance with national development goals, constitutional principles, and environmental sustainability.
3. Objectives of the National Urbanization Policy
The National Urbanization Policy (NUP) should pursue multiple interconnected objectives:
Balanced Regional Development involves promoting the growth of cities across different regions and scales, not merely in existing metropolitan centers. This reduces urban congestion and creates employment opportunities in smaller cities, thereby stemming excessive migration to megacities.
Sustainable and Environment-Friendly Cities require integration of environmental considerations into urban planning. This includes promoting green spaces, managing waste systematically, reducing pollution, and building climate-resilient infrastructure. Cities must minimize their ecological footprint while improving quality of life.
Inclusive Growth and Affordable Housing aim at ensuring that urbanization benefits all sections of society. This involves providing affordable housing for low-income groups, preventing slum formation, and ensuring equitable access to urban services such as water, sanitation, and transportation.
Strengthening Local Governance and Citizen Participation recognizes that sustainable urban development requires democratically accountable local institutions and active community engagement in planning and decision-making processes.
Efficient Urban Infrastructure and Service Delivery ensures that cities have adequate roads, public transport, water supply, sanitation, electricity, and waste management systems to support their populations and facilitate economic activity.
4. Urbanization in the Indian Context
India’s urbanization pattern exhibits distinctive characteristics that shape the challenges and opportunities for policy formulation.
The pattern of urbanization in India is decidedly “top-heavy,” with disproportionate concentration in megacities. As of 2021, the National Capital Region (Delhi-NCR) had a population of 32 million, making it the world’s second-largest metropolitan area. Mumbai metropolitan area housed approximately 20.4 million people, and Bangalore, Hyderabad, and Chennai have emerged as major urban centers. Meanwhile, there are only 23 cities with populations exceeding 1 million, while thousands of small towns remain underdeveloped and infrastructure-deficient. This concentration creates severe congestion and environmental stress in megacities while starving smaller towns of investment and opportunities.
Rural-to-urban migration is a powerful demographic force reshaping India. Approximately 50 million people migrate internally annually, with a significant portion moving from rural to urban areas in search of employment and improved living standards. The proportion of rural workers in agriculture declined from 75% in 1991 to approximately 42% by 2021, reflecting a structural shift in the economy. However, most migrants end up in the informal sector, lacking job security, social protection, or adequate housing.
The growth of small and medium towns (SMTs) offers a potential counterweight to megacity concentration. Towns with populations between 100,000 and 1 million have grown at faster rates than megacities in recent years. These towns can serve as intermediate nodes in the urban hierarchy, absorbing migrants, providing local markets, and facilitating regional development.
Economic corridors and metropolitan regions, such as the Mumbai-Pune corridor, the Bangalore-Chennai industrial corridor, and the National Capital Region, play crucial roles in shaping urbanization patterns. These high-growth zones attract investment and talent but also intensify regional imbalances, as resources and opportunities concentrate in these corridors.
5. Basic Issues in Urbanization Policy in India
(a) Regional Imbalances
India’s urbanization is geographically uneven, with the Southern and Western regions accounting for a disproportionate share of urban growth. States like Maharashtra (48.8% urban population), Tamil Nadu (48.4%), and Gujarat (42.6%) are significantly more urbanized than states like Bihar (11.3%) and Odisha (16.7%). This imbalance perpetuates regional inequality, concentrates resources in prosperous regions, and leaves large areas with limited urban infrastructure or services. Policymakers must actively intervene to stimulate urbanization in backward regions through investments in tier-2 and tier-3 cities.
(b) Housing Shortages and Slum Proliferation
India faces a massive housing shortage. According to government estimates, approximately 19.1 million housing units were needed as of 2024, particularly for economically weaker sections (EWS) and low-income groups (LIG). Consequently, slums and informal settlements proliferate in urban areas. As of the 2011 Census, 104 million people (13.7% of urban population) lived in slums. Slum dwellers face precarious living conditions, poor sanitation, inadequate water supply, and vulnerability to eviction. The shortage of affordable housing remains one of the most pressing urban challenges.
(c) Infrastructure Deficiency
Indian cities suffer from acute infrastructure deficits across multiple dimensions. Transportation infrastructure remains inadequate, with per capita road length in Indian cities significantly lower than in developed countries. Water supply coverage varies widely, with rural and peri-urban areas often lacking adequate piped water systems. Sanitation infrastructure, while improving through missions like Swachh Bharat, remains incomplete in many cities. Approximately 90% of India’s wastewater remains untreated, causing severe water pollution. Electricity supply, though expanding, is unequal, with formal sectors receiving better access than informal settlements. The infrastructure deficit limits urban growth potential and affects quality of life.
(d) Unemployment and Informal Sector Dominance
Urban unemployment in India remains considerable, with an unemployment rate of approximately 7-8% as of recent surveys. More critically, approximately 80% of urban workers operate in the informal sector, lacking job security, social benefits, or legal protections. The informal sector includes street vendors, day laborers, construction workers, and domestic helpers who form the backbone of urban economies but remain marginalized in policy frameworks. Income inequality in cities is stark, with a Gini coefficient in urban areas around 0.55, reflecting significant disparity.
(e) Environmental and Ecological Challenges
Indian cities face severe environmental degradation. Air pollution in cities like Delhi reaches hazardous levels seasonally, with PM2.5 concentrations exceeding World Health Organization standards. Water pollution from untreated sewage and industrial waste contaminates rivers and groundwater. Waste management is inadequate, with many cities lacking integrated waste management systems. Urban heat islands effect reduces livability in dense cities. Climate change poses additional risks, with cities like Mumbai and Kolkata facing threats from rising sea levels and extreme weather events. Urban environmental challenges demand urgent policy interventions.
(f) Weak Urban Governance and Institutional Gaps
Despite the 74th Constitutional Amendment (1992), which devolved powers to Municipal Corporations, Municipal Councils, and Wards, urban governance remains weak. Municipal bodies often lack financial autonomy, depend heavily on state transfers, and suffer from limited revenue-raising capacity. Coordination between different urban agencies (water supply, sanitation, transport, planning) is poor. Capacity constraints, political interference, and lack of professional management hamper institutional effectiveness. Citizens’ participation in urban governance remains limited despite constitutional provisions for Ward Committees.
(g) Poor Urban Data and Planning Mechanisms
Indian cities suffer from inadequate data systems. The absence of comprehensive, real-time urban data hampers evidence-based planning. Many cities lack updated land-use maps, demographic profiles, or infrastructure inventories. Master plans, even when prepared, often become outdated and poorly implemented. The coordination between national, state, and municipal planning mechanisms is weak. This data deficit results in haphazard development, duplication of efforts, and inefficient resource allocation.
6. Government Initiatives and Policy Responses
The Indian government has launched several important urban development missions and policies to address these challenges:
Jawaharlal Nehru National Urban Renewal Mission (JNNURM) (2005-2015) was India’s first major centrally-sponsored urban development scheme, covering 63 cities with an investment of approximately ₹55,000 crores. JNNURM focused on infrastructure development, institutional strengthening, and governance reforms. While it achieved notable improvements in water and sanitation infrastructure, it faced criticisms regarding unequal implementation, debt burden on cities, and limited focus on affordable housing.
Smart Cities Mission (2015-ongoing) aims to develop 100 smart cities across India with a total investment of ₹98,000 crores. The mission focuses on sustainable infrastructure, technology integration, citizen participation, and quality of life improvements. Cities selected include Pune, Kochi, Jaipur, and Visakhapatnam. While ambitions are high, implementation challenges, including land acquisition issues, financing hurdles, and coordination problems, persist.
AMRUT (Atal Mission for Rejuvenation and Urban Transformation) (2015-ongoing) covers 500 cities with investments in water supply, sewerage, storm water drains, and transportation. With an initial allocation of ₹48,000 crores, AMRUT complements Smart Cities Mission by focusing on basic amenities. The mission has achieved tangible results, including improved water supply coverage and sanitation infrastructure in participating cities.
Pradhan Mantri Awas Yojana (PMAY-Urban) (2015-ongoing) aims to construct approximately 12 million affordable houses for economically weaker sections. As of 2024, over 11 million houses have been sanctioned, with significant numbers completed. PMAY represents a direct policy response to housing shortages and slum proliferation, though implementation challenges related to land availability and construction remain.
National Urban Transport Policy (NUTP) (2006) provides guidelines for sustainable urban mobility. It emphasizes public transport, non-motorized transport, and demand management. While progressive in conception, NUTP implementation varies significantly across cities, with many continuing car-centric development patterns.
7. Future Directions for Effective Urbanization Policy
Effective urbanization policy in India must pursue several forward-looking directions:
Strengthening Local Governance through meaningful implementation of the 73rd and 74th Constitutional Amendments is essential. This involves devising robust revenue-sharing mechanisms between national, state, and municipal governments; building municipal capacity through training and technology; and ensuring genuine citizen participation in urban planning and service delivery. Municipal governments must transition from administrative bodies to entrepreneurial institutions capable of innovative service delivery.
Promoting Tier-2 and Tier-3 Cities requires deliberate policy interventions including targeted infrastructure investments, business incubation centers, special economic zones in secondary cities, and regional development corridors. These cities must be positioned as attractive alternatives to megacities, offering employment opportunities, better quality of life, and sustainable growth potential.
Integrating Land Use and Transport Planning can reduce urban sprawl and congestion. Transit-Oriented Development (TOD) strategies, where residential and commercial development concentrates around public transport nodes, can reduce car dependency and improve urban efficiency. Mixed-use zoning can reduce travel distances and create vibrant neighborhoods.
Sustainable Urban Financing and PPPs must evolve beyond property tax-dependent revenue models. Cities should explore innovative financing mechanisms such as value capture taxes, congestion pricing, user fees for services, and green bonds. Public-Private Partnerships can leverage private sector efficiency while ensuring public interest protection. However, PPPs must be carefully designed to prevent monopolistic practices and ensure equitable service delivery.
Climate-Resilient and Inclusive Urban Planning becomes increasingly critical as climate change threatens cities with extreme weather events, flooding, and heat waves. Urban planning must incorporate climate adaptation strategies, nature-based solutions (green infrastructure, wetland conservation), and resilience-building measures. Simultaneously, planning must prioritize inclusive development, ensuring that informal sector workers, migrants, and low-income groups are not marginalized but integrated into urban development processes.
8. Conclusion
India’s rapid urbanization presents profound challenges and immense opportunities. A coherent, comprehensive National Urbanization Policy is essential to harness urbanization’s potential for economic growth, employment generation, and social advancement while mitigating its negative consequences. Such a policy must balance competing objectives: development and sustainability, growth and equity, metropolitan expansion and regional development. It must strengthen local institutions, improve governance, and ensure citizen participation.
The vision for future Indian cities should be encapsulated in three principles: “Smart, Sustainable, and Equitable.” Smart cities harness technology and data for efficient service delivery and citizen engagement. Sustainable cities minimize environmental impact, adapt to climate change, and preserve natural resources for future generations. Equitable cities ensure that urbanization’s benefits are widely distributed, that affordable housing and basic services are universally accessible, and that informal sector workers and marginalized groups are not left behind.
Realizing this vision requires sustained political commitment, adequate financing, institutional reforms, and social participation. It demands coordination across government levels, cooperation between public and private sectors, and genuine engagement with urban communities. The stakes are high: by 2050, India will have over 900 million urban residents. Whether these cities become engines of inclusive prosperity and sustainable development or center of inequality and environmental degradation depends on the quality of policy choices made today.
REFERENCES:
Shachar, A. S. (1971). Evaluation of national urbanization policy. Journal of the American Institute of Planners, 37(6), 362-372.
Wang, X. R., Hui, E. C. M., Choguill, C., & Jia, S. H. (2015). The new urbanization policy in China: Which way forward?. Habitat International, 47, 279-284.
Hamer, A. M., & Linn, J. F. (1987). Urbanization in the developing world: patterns, issues, and policies. Handbook of regional and urban economics, 2, 1255-1284.
National Urbanization Policy
ESSENTIAL GOVERNMENT DOCUMENTS
Ministry of Housing and Urban Affairs (MOHUA). (2015). Smart Cities Mission: Guidelines. Government of India. https://smartcities.gov.in/
Ministry of Housing and Urban Affairs (MOHUA). (2015). Pradhan Mantri Awas Yojana (PMAY-Urban): Guidelines and Operational Framework. Government of India. https://pmayurban.mohua.gov.in/
Ministry of Housing and Urban Affairs. (2015). AMRUT (Atal Mission for Rejuvenation and Urban Transformation): Guidelines. Government of India. https://www.pmayurban.gov.in/
Ministry of Statistics and Programme Implementation (MOSPI). (2023). Gross Domestic Product by Economic Activity (State Series). Government of India. https://mospi.gov.in/
CONSTITUTIONAL FRAMEWORK
Government of India. (1992). The 73rd and 74th Amendments to the Indian Constitution (Panchayati Raj and Municipal Governance Acts). https://www.indiacode.nic.in/
KEY RESEARCH STUDIES
Kundu, A. (2011). Urbanization and Migration: An Analysis of Trends, Patterns and Policies in India. Institute of Economic Growth, University of Delhi. https://ieg.ac.in/
Bhagat, R. B. (2011). Urbanization in India: An Overview. Indian Council of Social Science Research (ICSSR). https://www.icssr.org/
INTERNATIONAL REFERENCES
United Nations DESA. (2018). World Urbanization Prospects: The 2018 Revision. Department of Economic and Social Affairs, United Nations. https://population.un.org/wup/
Central Pollution Control Board (CPCB). (2022). Report on Air Quality in Indian Cities. Ministry of Environment, Forest and Climate Change, Government of India. https://www.cpcb.gov.in/
Ministry of Jal Shakti. (2022). National Water Quality Monitoring Report. Government of India. https://jalshakti-dowr.gov.in/
EMPLOYMENT STATISTICS
National Sample Survey Organization (NSSO). (2019). Periodic Labour Force Survey (PLFS): Employment Statistics. Ministry of Statistics & Programme Implementation. https://mospi.gov.in/
Central Place Theory (CPT), proposed by the German geographer Walter Christaller in 1933, is a foundational model in spatial geography and urban theory that seeks to explain the size, spacing, and functions of settlements in a hierarchical system. It revolves around key ideas of threshold, range, and centrality, and posits an idealized, hexagonal pattern for market areas under certain assumptions. While the theoretical elegance of CPT has influenced urban planning, geography, and regional development, it also faces strong criticism for its simplifying assumptions and limited applicability in real-world, uneven landscapes. This essay introduces the theory, explains its components and variants (the K principles), discusses its strengths and limitations, and reflects on its continuing relevance in contemporary settlement planning and geography.
Introduction
How and why do settlements (villages, towns, cities) arrange themselves in particular patterns across a landscape? Why do some towns grow large and distant, while many small villages cluster closely? Geographers have long sought models to explain settlement patterns in relation to the provision of goods and services to surrounding populations. One of the most influential of these is Central Place Theory (CPT), formulated by Walter Christaller in his work Die zentralen Orte in Süddeutschland(Central Places in Southern Germany) in 1933.
Central Place Theory offers a spatial logic: settlements function as “central places” that provide goods and services to a surrounding area (its hinterland). Depending on the nature and specialization of their service functions, settlements form a hierarchy. The theory aims to explain the number, size, and spacing of these central places in a region. While its idealized assumptions rarely hold in full in reality, CPT nevertheless provides a vital conceptual framework for thinking about settlement systems, market areas, and planning decisions. In this essay, we describe the theory’s core components, its variants (the K-principles), its merits and drawbacks, and its contemporary significance.
Description / Discussion
Basic Concepts: Central Place, Range, Threshold, Hinterland
A central place is a settlement (village, town, or city) whose primary function is to supply goods and services to people in its surrounding area.
The hinterland (or market area / sphere of influence) of a central place is the region from which its consumers are drawn.
Threshold is the minimum population (or economic demand) required to support a particular good or service. If the population is below the threshold, the service is not viable.
Range is the maximum distance consumers are willing to travel to acquire a good or service. When the cost or inconvenience becomes too great, consumers will instead go to a closer central place that offers the same service.
These two parameters (threshold and range) help define the size and shape of a central place’s market area, and influence which levels of services can be sustained at each settlement.
Hierarchy of Settlement
Hamlet: fewest goods and services available.
Village: includes the region of the hamlet and some additional goods and services.
Town: includes the region of the village and hamlet and provides some additional goods and services.
City: includes the region of the village, hamlet and town and provides additional goods and services.
Assumptions of the Theory
For the sake of creating a clean, predictable model, Christaller built CPT upon several simplifying assumptions. These assumptions are rarely fully met in real landscapes, but they allow theoretical analysis and prediction. Some of the key assumptions are:
The region is an isotropic plain (flat, no variation in terrain) with no physical barriers.
Population is evenly distributed throughout the plane, and all consumers have roughly equal purchasing power.
Resources (economic opportunities) are uniformly distributed.
Transportation is equally easy in all directions; transport cost is proportional to distance (and there is only a single mode of transport).
Consumers patronize the closest central place that offers the desired good or service (minimizing travel).
Central places maximize their market area without overlapping (i.e., no redundant service areas).
Given these assumptions, Christaller derived a regular, systematic pattern of central places.
Christaller’s Model and K-Principles
Under the above assumptions, Christaller showed that central places would tend to be arranged in a hexagonal lattice pattern (to avoid gaps or overlaps in service areas). Instead of circular market areas (which would either overlap or leave gaps), hexagons tessellate neatly.
Christaller also introduced variants (often called K-principles) that show different organizational logics depending on whether marketing, transport, or administrative factors dominate. The main ones are:
K = 3, the Marketing Principle: This principle emphasizes the idea of minimizing distance consumers travel, so that a higher-order center receives one-third of the market area of each adjacent lower-order center. In practice, six lower-order centers surround a higher-order center, with each contributing a share.
K = 4, the Transport (Traffic) Principle: The structure is arranged so as to reduce transport cost (minimize total road length). Under K = 4, a higher-order center captures half of the market area of each of six neighboring lower-order settlements.
K = 7, the Administrative Principle: This prioritizes administrative control. Each higher-order center completely encloses the territories of six subordinate centers (so the hierarchic nesting is clear and nonoverlapping).
Thus, depending on which logic dominates in a region (market efficiency, transport economy, or administrative governance), the settlement pattern might more closely resemble one of these K variants.
Hierarchy and Spatial Predictions
From this model, Christaller derived a number of generalizations about settlement systems:
A greater number of small, low-order settlements and fewer large, high-order settlements.
Larger settlements (with high-order functions) are spaced farther apart than smaller ones.
Higher-order services (hospitals, universities, specialized goods) are located only in the larger central places, since they have higher thresholds and are viable over larger ranges.
Settlements of the same order should be equidistant from each other in a regular pattern.
The shape of market areas ideally becomes hexagonal to avoid overlaps and gaps.
Strengths and Applications (Merits)
Central Place Theory, despite its limitations, offers several valuable insights:
Theoretical clarity: It gives a logical, structured way to think about how settlements and services might spatially organize.
Predictive power: Under certain idealized conditions, it can predict spacing, size, and function of settlements.
Framework for planning: Urban planners and regional developers can use CPT as a guide for organizing service centers, facilities, marketplaces, or infrastructure.
Comparative baseline: Although real geography is messy, deviations from CPT can be instructive (i.e., by studying how real systems diverge from the ideal).
Cross-cultural and historical use: The theory has been applied in various geographical contexts (e.g. parts of Europe, North America, India) to analyze settlement hierarchies and development planning.
Critiques and Limitations (Demerits)
However, CPT has been extensively critiqued, and many of its assumptions break down in real-world settings:
Unrealistic assumptions: Very few real regions have perfectly flat terrain, uniform population, or homogeneous transport costs.
Variation in consumer behaviour: Consumers differ in income, preferences, mobility, and willingness to travel; they don’t always go to the closest center.
Multiple modes of transport: Modern transport networks (roads, rail, air) and varying cost regimes distort the simple distance assumption.
Natural and political barriers: Rivers, mountains, borders, administrative boundaries, and planning constraints often disrupt the ideal pattern.
Historical path dependence: Settlement patterns are often legacy of history, trade routes, colonization, or power, not pure spatial optimization.
Non-uniform service functions: Some places may offer specialized services for reasons unrelated to population thresholds (tourist centers, pilgrimage sites, administrative capitals).
Scale issues: At different scales (local vs national), the regularity of CPT may not hold.
Modern economies and technology: Telecommunication, e-commerce, and digital services reduce the importance of physical distance, weakening the relevance of the classical range and threshold notions.
Some modern geographers have even used fractal or complexity-based models to better describe settlement patterns, arguing that real human settlement networks show irregular, scale-free, or self-similar structures that deviate from the perfect lattice of CPT.
Contemporary Relevance and Adaptation
Even though its original assumptions are idealistic, CPT continues to be a valuable conceptual tool. Contemporary studies seek to adapt or extend it:
Integrating economic complexity indices and data analytics to measure centrality beyond simple population and services.
Using network theory and fractal geometry to allow irregular settlement patterns while preserving hierarchical relationships.
Applying CPT logic to service location planning, retail site selection, and infrastructure zoning, while relaxing strict assumptions to allow real-world constraints.
Considering multi-modal transport, communication technology, and varying demand patterns in updated models.
Thus, CPT’s value is not in literal replication of its ideal pattern but in offering a baseline, heuristic framework to assess, compare, and plan human settlement systems.
Conclusion
Central Place Theory remains one of the classic models in geography and spatial planning. Its strength lies in providing a clear, logical structure — anchored in the ideas of threshold, range, and hierarchical centrality — to analyze settlement systems. Christaller’s elaboration of K = 3, 4, and 7 variants shows how different organizing principles (marketing, transport, administration) shape settlement layouts. However, the theory’s many idealizing assumptions limit its direct application in real terrain, demographic complexity, and modern technological conditions.
Nevertheless, the deviations from CPT in real systems are as interesting as the theory itself — they reveal the influence of history, geography, political boundaries, infrastructure networks, and technological change. In modern planning, CPT still informs decisions about service location, urban hierarchy, market coverage, and spatial strategy — albeit in more flexible, hybrid models that integrate empirical data, network analysis, and local constraints.
Reference
Berry, B. J., & Garrison, W. L. (1958). A note on central place theory and the range of a good. Economic geography, 34(4), 304-311.
Clark, W. A., & Rushton, G. (1970). Models of intra urban consumer behavior and their implications for central place theory. Economic Geography, 46(3), 486-497.
Dacey, M. F. (1965). The geometry of central place theory. Geografiska Annaler: Series B, Human Geography, 47(2), 111-124.
Mulligan, G. F. (1984). Agglomeration and central place theory: A review of the literature. International Regional Science Review, 9(1), 1-42.
This essay explores the fundamental challenge of measuring human populations, health planning, and resource allocation. While demography aims for precise statistics on fertility, mortality, and migration, a pervasive global data gap often makes traditional counting impossible. The discussion includes the direct and indirect measures, their precision and limitations, methods used for measuring. The conclusion offers a strong case for why Direct and Indirect Measures are essential partners—they truly can’t survive without each other in the real world of demographic research.
1. Introduction
Demography, in its most basic sense, is the mathematical and statistical analysis of human populations. It aims to grasp the three main processes that govern population dynamics: fertility, mortality, and migration.
But acquiring this information is seldom easy. The data is collected with the means of two measures: direct measures and indirect measures. Direct measures, the “gold standard,” strive towards near-perfect accuracy from complete primary sources. Indirect measures, necessity and statistical creativity, employ mathematical models and empirical population theory to derive sound estimates from incomplete or unorthodox data. Knowledge of the strengths, limitations, and synergistic use of these two methods is at the heart of contemporary demography.
2. Direct Measures: The Gold Standard of Precision
Direct measurement is the gathering of demographic statistics directly from sources that are specifically created to note down a population occurrence as it actually happens or to enumerate the population at a given point in time. These statistics yield the most precise and detailed statistics when applied fully and successfully.
The validity of direct measurements relies chiefly on two conventional institutional supports: the Population Census and the Vital Registration System (VRS).
2.1. The Population Census
A census is a complete, systematic enumeration and collection of demographics, economic, and social information for all the individuals in a given area at a particular moment. Usually taken every ten years, the census is the major source for the denominator in most demographic rates—the population at risk—and is the basis for population distribution and structure data.
Key Indicators: Total population size is directly measured by the census, as well as age-sex structure (the basis of all demographic analysis), household composition, and geographical distribution. It is also the main source for the measurement of lifetime migration (through questioning about place of birth versus where residents are living now) and internal migration (through questions about residence at a fixed number of years past).
2.1.1. Precision and Limitations
When carried out flawlessly, the census provides a peerless picture of the population. Censuses, however, are prone to some major pitfalls:
2.1.2. Coverage Error
Missing individuals (underenumeration, typical with floating or marginalized populations) or enumeration of individuals twice (overenumeration).
2.1.3. Content Error
Misstating qualities, most significantly age heaping (reporting ages ending in 0 or 5).
2.1.4. Infrequent Data
The once-a-decade character results in the data becoming outdated rapidly, particularly in regions with rapid population change.
2.2. The Vital Registration System (VRS)
The VRS is a legal administrative system to record continuously and permanently the occurrence and characteristics of vital events (live births, deaths, marriage, divorces, etc.). While the census gives the stock (the population itself), the VRS gives the flow (the changes in the population).
Key Measurements: The VRS is the primary source for the calculation of crude birth rates, crude death rates, and most importantly, Age-Specific Fertility Rates (ASFRs) and Age-Specific Death Rates (ASDRs). These rates in detail are necessary for the preparation of life tables and complex population projections.
2.2.1. Precision and Limitations
An entire VRS provides the best quality of data, with the possibility to analyze timely, yearly, or even monthly. But the completeness of VRS is extremely different around the world. In the majority of low- and middle-income nations, coverage is less than 50% owing to inferior infrastructure, low literacy rates, and cultural customs (e.g., home delivery). When coverage is inadequate, the data cannot be used for direct measurement and has to be indirectly adjusted.
2.3. Demographic and Health Surveys (DHS)
Large-scale, internationally standardized sample surveys, such as the Demographic and Health Surveys (DHS), serve as a bridge in settings where VRS is weak. Technically a sample, the data are gathered directly using questionnaires.
Key Indicators: DHS directly measures fertility by interrogating women on their full birth histories (retrospective information on all children ever born, their birth date, and survival status). It directly measures child mortality from these birth histories.
2.3.1. Precision and Limitations
Surveys provide good-quality data (since they use trained interviewers) but are prone to recall bias (women forgetting or misdating events, especially older ones) and sampling error, since they represent a sample, not a census.
3.Indirect Measures: Estimation Through Models and Theory
Indirect methods are the demographer’s primary instruments for putting forth efforts on incomplete, bad, or non-traditional data. They depend on proven mathematical models, theory of the population (including the theory of the stable population), and specific data interrelationships to derive useful estimates of demographic parameters.
Indirect methods are most common in three situations:
Data-Deficient Settings: Mortality and fertility estimation in nations with bad VRS and few resources.
Historical Demography: Quantifying parameters in populations where only partial records are available.
Cross-Validation: Verifying consistency and plausibility of direct measurements in situations where quality of data is likely low.
4. Underlying Principles of Indirect Estimation
The effectiveness of indirect methods is dependent upon fundamental theoretical relationships that apply to most human populations:
The relationship between adult survival and parental survival.
The relationship between infant/child mortality and children’s survival.
The organization of stable and quasi-stable populations (in which fertility and mortality rates have been constant or have changed slowly).
5.Key Indirect Methods in Fertility and Mortality
The most important advances in indirect estimation result from the contributions of William Brass and his coworkers, who use readily available data from censuses or single-round surveys to make estimates of vital rates.
5.1. The Brass P/F Ratio Method (Fertility)
The P/F ratio approach is probably the best-known indirect method, intended to revise the reported level of current fertility based on information on children ever born (CEB).
The Data: The approach applies two different kinds of data:
P (Parity): The mean ever born number of children reported by women within various age groups (a measure of cumulative or lifetime fertility). It is generally reliable among young women but is affected by omission/recall bias in older women.
F (Fertility): Average number of children women have borne in the past year (or recent interval) computed from those reported recent births (a measure of recent fertility). This tends to be underreported but the pattern by age is generally accurate.
The Model: The approach estimates the ratio of the correct pattern of fertility (from the F data) to the right level of fertility (from the P data for younger, less-biased women). It presumes the pattern of fertility is right, and applies the P/F ratio from younger women to adjust the total level of the recent fertility schedule (F), thus giving a corrected Age-Specific Fertility Rate (ASFR) schedule.
5.2. The Orphanhood Method (Adult Mortality)
For estimating adult mortality, particularly in settings where there is no death registration, the Orphanhood Method applies.
The Data: Respondents are queried whether their parents are alive or not. For instance, “Is your mother alive?” or “Is your father alive?”
The Model: The ratio of survey respondents whose mother (or father) is deceased is used to estimate the conditional probability of survival for parents. By knowing the respondent’s and mother’s age, demographers employ model life tables to translate the ratio of orphans into a complete measure of adult mortality, usually in the form of the probability of survival from age 20 to age 60.
5.3. The Widowhood Technique (Adult Mortality)
Like orphanhood, the technique relies on spousal survival to measure adult mortality.
The Data: Survivals of first spouses are reported by individuals.
The Model: Responses reporting that the first spouse is dead are translated through modeling to produce an estimate of adult mortality, often for the sex whose survival is being ascertained (e.g., women reporting about husbands’ survival estimates male mortality).
5.4. The Reconstructed Birth History Method (Child Mortality)
This technique, frequently employed with DHS data, estimates Infant and Child Mortality Rates (IMR and CMR) on the basis of the straightforward query: “Of the children you have ever had, how many are still alive?”
The Data: Cumulative data on children ever born (CEB) and children surviving (CS).
The Model: The ratio of dead children to ever-born children is cross-tabulated by mother’s age group. These rates are then translated, via mathematical models (e.g., the ones constructed by Trussell), into conventional measures of child mortality (e.g., probability of dying before one year, or before five years). The main strength is that the method is successful in time-locating the mortality estimates, tying the cumulative data back to recent historical periods.
6. The Critical Synergy: Complementarity and Cross-Validation
Direct and indirect measures are not in competition with each other, but are rather the essence of complementarity. Together, they constitute a system of checks and balances essential to constructing a defensible and coherent demographic profile under conditions of low data availability.
6.1. Indirect Measures Validating Direct Data
In most countries, the VRS results are considered a “direct” measure, but their completeness is quite doubtful. In this case, indirect procedures are employed to check the plausibility of the direct estimates.
If a nation’s registered Crude Death Rate (CDR) is 12 deaths per 1,000 population, but the indirect estimate by the Orphanhood Method provides a higher rate, the demographer has to conclude that the VRS is probably undercounting deaths.
The process then moves from mere reporting into data adjustment, where the demographic estimate (obtained indirectly) substitutes or systematically remedies the flawed direct measurement.
6.2. Direct Measures Informing Indirect Models
Indirect models themselves are constructed and tested with good-quality, full direct data sets.
The models employed in the Brass P/F ratio or the Trussell method are based on observed relationships in model life tables. These model life tables were initially established and calibrated against complete, long-term, high-quality VRS data from historic developed countries (such as Sweden, England, and Wales).
In this way, today’s indirect estimation tools are yesterday’s successful direct measurements’ historical legacies.
7. Closing the Data Gap
The most useful practical application of the synergy lies in filling the gap between the ideal and the actual in data.
7.1. The Requirement for Up-to-Date Data
A census (direct) gives us a base population once every ten years. Indirect projection techniques—like the cohort-component method—are subsequently employed to advance that population, utilizing high-quality inputs (ASFRs, ASDRs, immigration rates) which might themselves be calculated from adjusted (indirect) survey data.
7.2. Conflict and Disaster Areas
Under quickly shifting or unstable conditions, the sole practical data collection would be a short, focused survey inquiring regarding the survival of parents or spouses (indirect measures), enabling humanitarian organizations to rapidly estimate the effect of conflict on adult mortality, short-circuiting the long and unfeasible task of establishing a VRS.
8. Limitations and Biases
Though precious, both methods have inherent limitations that need to be handled by the working demographer.
8.1. The Limitations of Direct Measures
The basic weakness of direct measures is susceptibility to human failure and logistical mishap:
Cost and Logistics: Censuses are immensely costly, logistically challenging endeavors, rendering their administration challenging for economically strained countries.
Bias in Reporting: Sensitive events (such as illegal immigration or stigmatized deaths, e.g., from AIDS) are underreported or systematically misreported by age in even high-income countries.
8.2. The Limitations of Indirect Measures
Indirect methods have their own particular limitations:
Assumption Dependence: The outcome depends completely on the validity of model assumptions (e.g., constant mortality patterns, child mortality and parental survival being uncorrelated). If the assumption is broken (e.g., in the presence of AIDS epidemics or recent wars), the estimate can be substantially biased.
Reference Period: Indirect estimates tend to be historical averages rather than point-in-time data. For example, an estimate of orphanhood is an average death rate over the last ten or more years, so it is not ideal for following recent, fast-moving changes.
Lack of Detail: They do not typically give the level of detail, local detail, or cause detail required for targeted policy interventions.
9. Conclusion
The path of demographic measurement is the ongoing search for the truth behind people’s numbers. Direct measures give the accuracy and fine-grained specificity required by advanced demographic analysis, serving as the required anchors of the statistical system. Yet the data world out there is a long way from being standardized. It is the advanced genius of indirect measures—the mathematical formulations and theoretical schemas—that enables demographers to replicate the population image where raw data is broken.
The two methods are not alternatives but symbiotic companions. The optimal modern demographic practice is to apply rigorously indirect methods of estimation for missing rates, cross-validate these estimates against any direct sources available, and finally yield a consistent, adjusted data set that is at once theoretically valid and practically useful for policy-making. As data sources become more dynamic and varied, the demographer’s core dilemma has not changed: to employ all the tools at hand, direct count or statistical inference, to construct the most precise map possible of mankind.
BIBLIOGRAPHY
Preston, S. H., Heuveline, P., & Guillot, M. (2001). Demography: Measuring and Modeling Population Processes. Blackwell Publishing.
Shryock, H. S., & Siegel, J. S. (1976). The Methods and Materials of Demography. Academic Press.
Brass, W. (1975). Methods for Estimating Fertility and Mortality from Limited and Defective Data. The Carolina Population Center at the University of North Carolina at Chapel Hill.
National Center for Health Statistics (NCHS). (Ongoing). Vital Statistics of the United States.
Rutstein, S. O., & Rojas, G. (2006). Guide to DHS Statistics: Demographic and Health Surveys Methodology. MEASURE DHS.
Trussell, T. J. (1975). A New Method of Estimating Infant and Child Mortality Rates from Demographic Survey Data. Population Studies, 29(3), 414–425.
United Nations. (1983). Manual X: Indirect Techniques for Demographic Estimation. Department of International Economic and Social Affairs, Population Studies No. 81. United Nations.
Title:City Growth Pattern Assessment Due Date:6 November 2025 Length:~20 pages (5,000–7,000 words) References:Minimum 20 (APA 7th edition) Methods Required:
Document Analysis
Google Earth Historical Imagery Analysis
Objective: To evaluate how your city has grown spatially, functionally, and demographically over time—identifying key patterns, drivers, and consequences of urban growth.
📘 1. Selecting Your Study Area
Choose your city or urban agglomeration—preferably one you know well or can easily research (e.g., Delhi, Bhopal, Dehradun, Jaipur, etc.).
Define administrative boundaries (Municipal Corporation or Development Authority).
Note its population and area at different census years (e.g., 1991, 2001, 2011, 2021 projections).
Mention relevance or unique aspects (e.g., TOD initiatives, water bodies, industrial zones, or heritage areas).
🗂️ 2. Research Framework
Structure your study around urban growth pattern dimensions such as:
Spatial expansion (built-up area increase, direction of spread)
Population growth and density changes
Land use transformation
Transport infrastructure development
Environmental change (green cover, water bodies, encroachments)
Policy and planning influences (master plans, zoning policies)
🧭 3. Methodology
3.1 Document Analysis
A. Purpose
To interpret and extract information from existing policy, planning, and secondary data sources that reveal urban growth dynamics.
B. Sources
Collect official and academic documents such as:
Master Plans / Development Plans
City Development Plans (CDPs) under JNNURM or AMRUT
Census of India (1991, 2001, 2011, 2021 projection)
Urban Local Body (ULB) reports
Land records, zoning maps, and notifications
Peer-reviewed journal articles
Reports from NIUA, TCPO, MoHUA, NITI Aayog, and World Bank
C. Procedure
Collect Documents: Download PDFs from government or institutional websites.
Read and Code Themes: Identify recurring themes such as urban sprawl, infrastructure, and land-use change.
Extract Data: Tabulate information such as population growth, land use zoning, and policy measures.
Synthesize Findings: Connect document evidence with observed spatial changes.
D. Expected Outputs
Timeline of policy interventions and major city expansion phases
Tables summarizing land use distribution by decade
Summary of planning priorities and deviations observed
3.2 Google Earth Historical Imagery Analysis
A. Purpose
To visually and spatially assess changes in the city’s built-up area, green cover, and infrastructure using satellite imagery.
B. Tools
Google Earth Pro (Desktop version)
Google Earth Engine (optional for advanced users)
QGIS (optional for overlay and measurement)
C. Procedure
Open Google Earth Pro → Locate your city.
Activate Historical Imagery Tool → View satellite images from different years (e.g., 2000, 2005, 2010, 2015, 2020, 2025).
Identify Built-up Expansion:
Use polygon tool to delineate built-up area at each time point.
Note direction and pattern of expansion (radial, ribbon, clustered, leapfrog).
Capture Screenshots/Exports:
Take georeferenced snapshots for each decade.
Annotate major features: highways, metro lines, industrial areas, and water bodies.
Overlay and Compare:
Compare built-up growth visually.
Calculate area change (using polygon measurement tool).
This lecture material critically examines fertility trends across the globe, focusing on essential demographic indicators, the underlying socioeconomic and cultural determinants of change, and the resulting policy challenges. The discussion begins by defining core measures such as the Total Fertility Rate (TFR), the Crude Birth Rate (CBR), and the concept of Replacement Level Fertility (approximately 2.1). It highlights the universal trend of fertility decline, contextualized by the Demographic Transition Model, illustrating the transition from high to low birth rates. The analysis then investigates the principal drivers of this transformation, including female education and empowerment, increased access to family planning, and urbanization. Finally, the module addresses the critical planning implications of both rapid decline (e.g., aging populations) and high fertility (e.g., resource strain), concluding with the necessity of integrating fertility data into sustainable development policy.
1. INTRODUCTION: Context and Significance
The trajectory of a nation’s development is inextricably linked to its population dynamics, of which fertility—the actual reproductive performance of a population—is a foundational component. Fertility trends reflect profound societal shifts in health, education, economic structure, and gender roles. Over the past century, the global population has witnessed an unprecedented and widespread decline in birth rates, a phenomenon that has dramatically reshaped the age structures of both developed and developing countries. According to the United Nations Population Division (official source), the global average TFR has fallen from approximately 5.0 children per woman in 1950 to around 2.3 in recent estimates, signaling a major transition.
Policy Relevance: The significance of accurately charting and understanding fertility trends extends into every realm of governance. Low fertility in industrialized nations fuels concerns over aging populations and pension solvency, while persistently high fertility in parts of the Global South strains resources and infrastructure, contributing to a youth bulge.
Purpose: This material aims to dissect the core measures and mechanisms driving these shifts, using established academic frameworks and reliable demographic data to illuminate the complexities of the modern fertility landscape and its implications for effective urban and regional planning.
2. CORE DEMOGRAPHIC DEFINITIONS AND MEASURES
To analyse fertility, specific, internationally recognized metrics are used:
Measure
Definition
Significance
Total Fertility Rate (TFR)
The average number of children a woman would have over her lifetime, given current age-specific fertility rates.
The most comprehensive measure for comparing fertility across time and regions.
Crude Birth Rate (CBR)
The number of live births per 1,000 people in a given year.
A simple, initial measure of fertility, though sensitive to the population’s age structure.
Age-Specific Fertility Rate (ASFR)
The number of live births per 1,000 women in a specific age group (e.g., 20-24 years).
Provides detailed insight into when women are having children (timing and tempo).
Gross Reproduction Rate (GRR)
The average number of daughters a woman would have in her lifetime, used for population replacement analysis.
Used to estimate the pure biological potential for population replacement.
Replacement Level Fertility
The TFR required to maintain a stable population size, excluding migration. Conventionally set at approximately 2.1 children per woman.
The critical threshold. TFR below 2.1 indicates long-term population contraction.
3. THE FRAMEWORK OF FERTILITY CHANGE
The universal decline in fertility is analyzed through two major theoretical models: the classical framework of the Demographic Transition Model (DTM) and the more recent conceptualization of the Second Demographic Transition (SDT).
3.1 The Demographic Transition Model (DTM)
The DTM describes the historical shift from high birth rates (HBR) and high death rates (HDR) to low birth rates (LBR) and low death rates (LDR) as a society industrializes and modernizes.
Stage
Birth Rate
Death Rate
Population Growth
Characteristics
Stage 1 (Pre-Industrial)
High
High
Slow/Zero
Found historically; high child mortality, dependence on agriculture.
Stage 2 (Early Transitional)
High
Rapidly Falling
Very Rapid
Public health improves, sanitation advances; Population Explosion due to falling death rates.
Stage 3 (Late Transitional)
Falling
Low
Slowing
Fertility begins to drop due to social and economic changes.
Stage 4 (Post-Industrial)
Low
Low
Stable/Zero
Modern developed economies; TFR often at or below Replacement Level (2.1).
3.2 Global Trends and Milestones
Developed Nations: Most industrialized countries (e.g., Japan, Germany, Italy) are in Stage 4, with TFRs significantly below 1.5, leading to rapid population aging.
Developing Nations (The “Catch-Up”): Many large economies (e.g., India, Brazil) have experienced a much faster fertility decline than historically seen in Western countries, largely due to accelerated access to technology and information. For example, India’s TFR officially dropped to 2.0 as per the National Family Health Survey (NFHS-5, 2019-21), marking a historic point below replacement level.
Outlier Regions: Parts of Sub-Saharan Africa remain in Stage 2/Early Stage 3, characterized by TFRs still high (e.g., 5.0+), leading to a significant youth bulge and continued rapid population growth.
4. DETERMINANTS OF FERTILITY DECLINE
The decision to have fewer children is driven by powerful, inter-connected societal shifts:
Socioeconomic Development and Education:
Female Education: This is the single strongest and most consistent correlate with fertility decline. Higher education leads to delayed marriage, postponed first birth, greater agency in family planning, and changed life aspirations.
Economic Cost of Children: In agricultural societies, children are economic assets (labor). In industrialized/urban societies, they become economic liabilities (cost of education, healthcare, etc.), incentivizing smaller families.
Health and Mortality:
Decline in Infant and Child Mortality: As fewer children die in infancy, parents no longer need “insurance births” to ensure some children survive to support them in old age. This increases confidence in family planning.
Access to Family Planning and Contraception:
The widespread availability and knowledge of modern contraceptive methods enable individuals and couples to translate their desire for fewer children into reality. Government policies promoting informed choice and access are key enablers.
Urbanization and Changing Social Norms:
Urban Lifestyles: Urbanization is associated with less living space, different social networks, and access to mass media that promotes modern, smaller-family ideals.
Women’s Labor Force Participation: Increased participation in non-agricultural work competes with time for child-rearing and increases the opportunity cost of having children.
5. POLICY CHALLENGES AND IMPLICATIONS
Fertility trends present a duality of profound policy challenges globally, requiring sharply different governmental responses:
5.1 Challenges of Sub-Replacement Fertility (TFR < 2.1)
This trend, typical of SDT countries, leads to an acute imbalance in the Old-Age Dependency Ratio (the ratio of retirees to working-age adults).
Aging Population and Economic Strain: A shrinking base of young workers must support an expanding, longer-lived cohort of retirees.
Implication:Solvency crisis for public pension and social security systems; soaring costs for specialized elderly healthcare.
Policy Response (Pronatalism): Governments implement policies designed to encourage births, such as:
Generous cash incentives and child benefits (e.g., France, Sweden).
Long, paid parental leave for both parents.
Subsidized, high-quality childcare and kindergarten access.
Immigration: Used as a compensatory measure to fill workforce gaps and counteract population shrinkage.
5.2 Challenges of High Fertility (TFR >> 2.1)
This trend, typical of nations still in DTM Stage 2/Early Stage 3, is characterized by a significant Youth Bulge (a very large proportion of the population under age 15).
Resource Strain and Developmental Hurdles: Rapid population growth consumes development gains and strains infrastructure.
Implication: Overburdened and low-quality education systems; massive demand for job creation that often outstrips economic growth; increased pressure on basic services (water, sanitation, housing).
Policy Response (Family Planning): Governments focus on managing and slowing growth:
Massive investment in female education and keeping girls in school.
Strengthening reproductive health services to ensure access to contraception and prevent unwanted pregnancies.
Prioritizing maternal and child health to further drive down infant mortality, thereby reducing the “insurance motive” for high fertility.
CONCLUSION
The global narrative of fertility is one of profound and sustained transformation, shifting the demographic center of gravity for nearly every nation. The decline in TFR is a testament to human development—a success story largely attributable to the rising status of women and advancements in public health. While the DTM explains the initial, economically rational shift away from high fertility, the SDT is essential for understanding the sustained sub-replacement fertility and the value-driven decision-making in highly developed societies.
The primary task for policymakers remains the effective utilization of reliable, officially generated fertility data (from Census bureaus and national health surveys) to anticipate future population structures. Effective governance necessitates tailored strategies: promoting family-friendly environments in SDT nations to mitigate aging and simultaneously ensuring robust education and health infrastructures in high-fertility regions to capture the Demographic Dividend. Future census exercises must be refined to capture emerging household formations and values (as suggested by the SDT) to ensure that policy remains responsive to the dynamic and complex demographic realities of the 21st century.
REFERENCES
United Nations, Department of Economic and Social Affairs, Population Division. (2022). World Population Prospects 2022: Summary of Results. (Provides official global TFR data and projections).
International Institute for Population Sciences (IIPS) and Ministry of Health and Family Welfare, Government of India. (2021). National Family Health Survey (NFHS-5), 2019-21. (Example of official, national-level data used for TFR calculation).
Bongaarts, J. (2003). Completing the Fertility Transition in the Developing World: The Role of Contraception and Education. Population Council. (Key academic analysis on the determinants of fertility decline).
World Bank Group. (2020). Demographic Dividends and the Power of Women’s Education. (Official report linking human capital, TFR, and economic growth).
Urbanization has blurred the traditional divide between rural and urban areas. This change has created transitional spaces that challenge the old split. This article looks at urban centers, the rural-urban continuum, and their connections. It argues that today’s settlements exist on a spectrum rather than as isolated areas. They have mixed land uses, changes in job types, and shared infrastructure.
Using examples from India, such as Bhopal and Gurugram, the article shows how peri-urban growth reflects this continuum. It stresses the importance of understanding and planning for these mixed areas to achieve balanced and sustainable regional development.
2. Introduction
Urbanization has become one of the most important trends of the 21st century. The spread of cities, changes in villages, and the development of transitional spaces have blurred the traditional lines between rural and urban. In the past, settlements were seen in a straightforward rural-urban dichotomy, with villages representing agriculture and simplicity and cities symbolizing industry and modern life. However, development, migration, and technology have made this binary less useful for describing the complex relationships that exist today.
In the study of human settlements and regional planning, three related concepts stand out: Urban Centers,Rural-Urban Dichotomy, and the Rural-Urban Continuum. Urban centers act as the main areas of economic and administrative activity, while the continuum shows the smooth gradation connecting rural and urban regions. This article will explore these ideas in depth, considering their evolution, connections, and effects on urban and regional planning in India and elsewhere.
3. Understanding Urban Centers
An urban center is a defined area marked by a high population density, a concentration of economic activities, and urban infrastructure like roads, public services, and buildings. Urban centers act as main points for trade, governance, and culture. They are more than just settlements; they drive growth and attract people and investment from surrounding areas.
3.1Types of Urban Centers
Urban centers can be divided into categories based on size, function, and influence:
3.1.1 Metropolitan Cities:
Large cities with populations over one million, such as Delhi, Mumbai, and Bengaluru. These cities serve as economic and cultural hubs on a national or regional level.
3.1.2 Medium and Small Towns:
Places like Bhopal, Indore, or Jabalpur that serve regional roles and provide essential services to nearby rural communities.
3.1.3 Satellite Towns and Suburban Centers:
Smaller towns or urban areas close to big cities (e.g., Gurugram near Delhi, Navi Mumbai near Mumbai), developed to reduce pressure on metropolitan cores.
3.2 Functions of Urban Centers
Urban centers have many roles: administrative (capitals and municipal centers), commercial (markets and trade hubs), industrial (manufacturing areas), cultural (educational and heritage sites), and service-oriented (healthcare, finance, information technology). They function as Central Places, a concept introduced by Walter Christaller in his Central Place Theory (1933), where settlements are arranged in a hierarchy to supply goods and services to surrounding regions.
3.3 Hierarchy and Influence
Urban centers exist in a hierarchical network: small towns serve local populations, while large metropolitan areas impact entire states or even countries. For instance, Bhopal serves as the administrative and service center for central India, providing jobs, education, and healthcare to people beyond its borders.
However, the growth of urban centers also leads to challenges like overcrowding, poor infrastructure, pollution, and inequality. These problems emphasize the need for a broader view, which includes both the city and its surrounding area. This transition is addressed by the rural-urban continuum.
4. The Rural-Urban Dichotomy
The rural-urban dichotomy is a classic approach that separates human settlements into two distinct categories: rural and urban. This classification depends on differences in occupation, lifestyle, population density, and infrastructure.
4.1Basis of Dichotomy
4.1.1 Economic:
Rural areas mainly rely on agriculture and related activities.
Urban areas focus on industry, services, and the tertiary sector.
4.1.2 Social:
Rural societies are usually homogeneous, community-focused, and traditional.
Urban societies are diverse, individualistic, and modern.
4.1.3 Physical:
Rural settlements show scattered patterns and low density.
Urban areas are compact, dense, and well-developed.
4.1.4 Functional:
Villages act as production sites for raw materials.
Cities serve as centers for processing, distribution, and administration.
4.2 Critique of the Dichotomy
While the dichotomy offered clarity in earlier analyses, it has grown increasingly outdated. The rise of technology, transport networks, and communication has connected rural and urban areas like never before. Rural residents often commute to urban centers for jobs, education, and healthcare, while urban residents depend on rural areas for food, land, and leisure.
Moreover, modern development has created hybrid spaces— areas that are neither fully rural nor entirely urban. These transitional spaces challenge the dichotomy and have prompted scholars like Sorokin and Zimmerman (1929) to propose the idea of a Rural-Urban Continuum.
5. The Rural-Urban Continuum
The Rural-Urban Continuum shows a gradual transition from purely rural to purely urban forms rather than a strict separation. It acknowledges that settlements exist on a spectrum, with intermediate stages that merge rural and urban traits.
5.1 Conceptual Background
Put forth by Pitirim Sorokin and Carle Zimmerman, the continuum model highlights that social, economic, and spatial characteristics change progressively. Instead of viewing villages and cities as opposites, they are seen as part of an ongoing urbanization process.
5.2 Indicators of the Continuum
5.2.1 Occupational Transformation:
The movement from agricultural jobs to non-agricultural roles in peri-urban areas.
5.2.2 Infrastructure and Services:
Villages close to cities often have better roads, electricity, and educational facilities similar to urban areas.
5.2.3 Migration and Commuting:
Daily travel for work and education strengthens connections.
5.2.4 Land Use Patterns:
Agricultural land is converted for housing, industries, and institutions on city outskirts.
5.2.5 Cultural and Lifestyle Changes:
Rural populations adopt urban habits, media consumption, and aspirations.
5.3 Spatial and Functional Dynamics
Urban growth creates peri-urban areas—transitional zones between city boundaries and rural regions. These areas show mixed land use, rapid real estate development, and demographic change. They also represent the most dynamic elements of the urban system.
For example, in Bhopal neighborhoods like Kolar, Misrod, and Ayodhya Bypass have changed from agricultural villages to mixed-use residential and commercial suburbs. Similarly, Gurugram near Delhi shows how rural landscapes can develop into modern urban centers in a short time.
Globally, this trend is evident in London’s greenbelt villages, Jakarta’s metropolitan fringe, and Shanghai’s suburban corridors, which all blur the boundaries between rural and urban areas.
5.4 Implications
The continuum approach has significant implications for planning:
It requires integrated rural and urban policies.
Governance must address transitional areas where administrative boundaries are ambiguous.
Infrastructure planning must ensure continuity across the urban-rural gradient.
This perspective focuses on regional systems of settlements, emphasizing connection and mutual dependence rather than isolated urban centers.
6. Relationship Between Urban Centers and the Continuum
Urban centers act as growth poles that drive development in surrounding areas. Through transportation, trade, and information networks, they extend their reach into rural regions, forming a continuous zone of interaction. Meanwhile, rural areas provide labor, raw materials, and land for urban expansion, sustaining city economies.
This mutual dependence creates city regions or metropolitan areas, where various settlements—rural, semi-urban, and urban—operate as an integrated system. For instance, the Delhi Metropolitan Region includes parts of Haryana and Uttar Pradesh, demonstrating how rural areas are drawn into urban spheres of influence.
7. Policy and Planning Implications
In India, understanding the rural-urban continuum is essential for effective regional and urban planning. Government initiatives increasingly recognize this relationship:
Smart Cities Mission (2015): Aims to develop sustainable urban infrastructure while encouraging regional integration.
Shyama Prasad Mukherji Rurban Mission (2016): Focuses on bridging the rural-urban gap by providing urban-level facilities in rural clusters.
AMRUT (Atal Mission for Rejuvenation and Urban Transformation): Aims for infrastructure continuity in medium-sized towns.
Planners must embrace integrated regional planning to ensure balanced growth across rural and urban areas.
This includes:
Creating infrastructure corridors connecting villages and towns.
Managing land use changes sustainably.
Strengthening local governance in peri-urban regions.
Encouraging economic diversity to avoid overreliance on cities.
Such strategies align with the URDPFI Guidelines (2014) in India, which stress a regional approach and functional integration in urban development.
8. Challenges and Future Perspectives
Despite acknowledging the continuum, several challenges remain:
Unplanned Urban Sprawl: Rapid growth without proper infrastructure planning results in congestion and environmental damage.
Service Disparities: Transitional areas often lie outside municipal boundaries, lacking sanitation, waste management, and adequate governance.
Land Conflicts:Converting agricultural land for urban use generates socio-economic tensions.
Future planning must prioritize sustainable urban-rural integration, using technology such as GIS mapping, satellite imagery, and spatial analytics to oversee and manage growth. The concept of Smart Regions—combining rural productivity with urban services—represents the next step in spatial planning.
8. Conclusion
The study of human settlements has shifted from treating villages and cities as separate entities to recognizing the continuous, interconnected spectrum between them. Urban centers serve as growth hubs, but their health relies on resources and labor from surrounding rural areas. The traditional rural-urban dichotomy fails to capture this complexity, while the rural-urban continuum offers a more realistic and dynamic framework.
Understanding this continuum is vital for planners, policymakers, and geographers. It fosters balanced regional development, prevents uncontrolled sprawl, and promotes equitable access to infrastructure and opportunities. Ultimately, the future of human settlement lies not in separating rural and urban spaces but in encouraging their coexistence.
Ministry of Rural Development (MoRD). (2016). Shyama Prasad Mukherji Rurban Mission (SPMRM) Framework for Implementation. Government of India. (https://rurban.gov.in/)


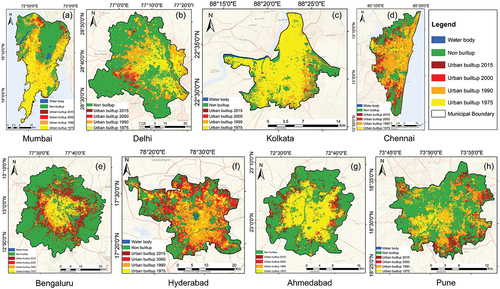
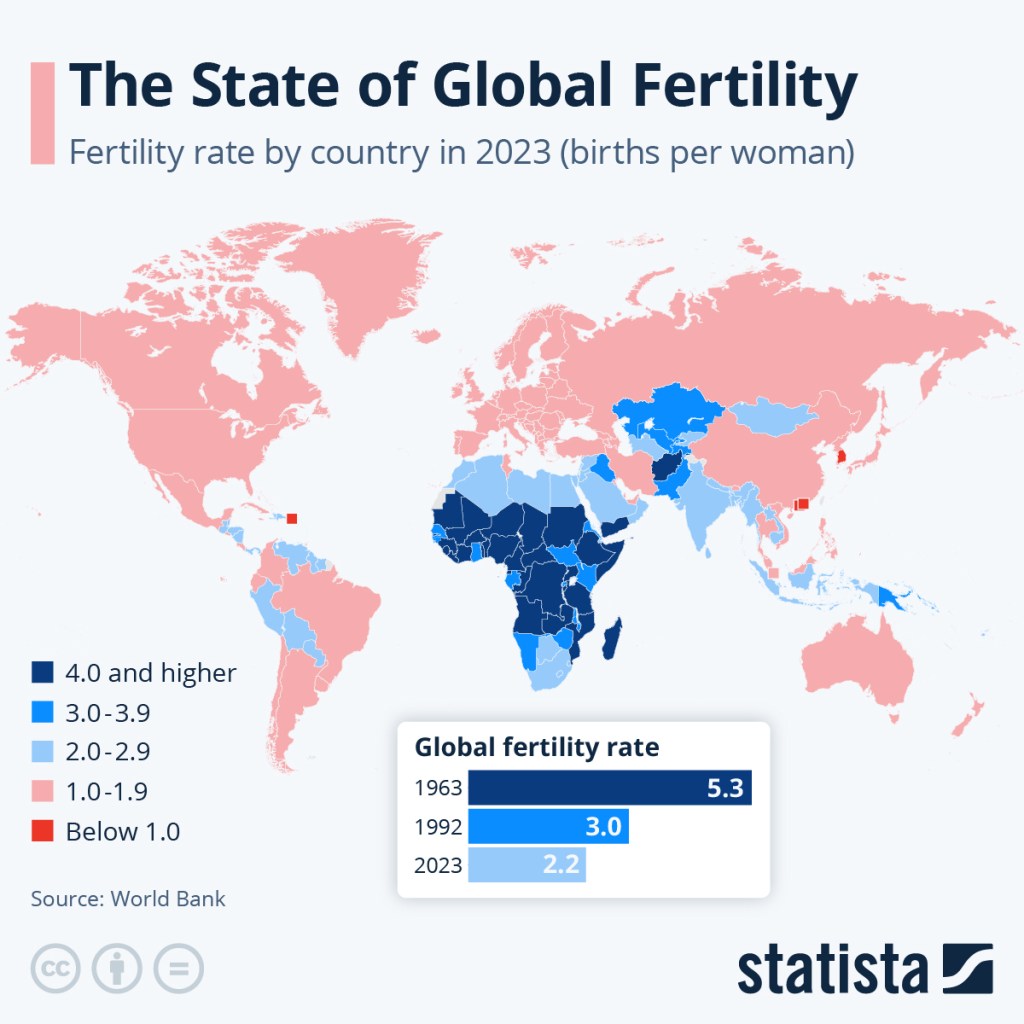


You must be logged in to post a comment.