The Atal Mission for Rejuvenation and Urban Transformation (AMRUT) is a flagship urban development program launched by the Government of India on June 25, 2015. The mission aims to improve the quality of life in urban areas by providing basic infrastructure, ensuring sustainable water supply, sanitation, and promoting a pollution-free environment.
AMRUT primarily focuses on 500 selected cities with a population of over 1 lakh, ensuring that urban development is well-planned and supports economic growth. The mission is an upgraded version of the Jawaharlal Nehru National Urban Renewal Mission (JNNURM) and aligns with other urban development initiatives like the Smart City Mission and Swachh Bharat Abhiyan.
2. Objectives of AMRUT
The key objectives of AMRUT are:
Water Supply Improvement – Ensuring 24×7 piped water supply to urban households.
Sewerage and Septage Management – Developing efficient wastewater treatment and sanitation infrastructure.
Stormwater Drainage – Reducing urban flooding and improving drainage systems.
Non-Motorized Transport & Green Spaces – Encouraging pedestrian-friendly infrastructure, cycling tracks, and parks.
Urban Transport – Improving public transport facilities and reducing congestion.
Capacity Building – Strengthening local urban governance and urban planning institutions.
The mission follows a bottom-up approach, where city governments prepare detailed project reports based on local needs.
3. Key Features of AMRUT
a. Water Supply & Sanitation
Universal access to safe and sustainable water supply.
Use of smart meters for water consumption monitoring.
Development of sewage treatment plants and reduction of manual scavenging.
b. Urban Mobility & Transport
Creation of pedestrian-friendly pathways.
Expansion of public transport services.
Integration of non-motorized transport (bicycle lanes, walkways).
c. Green Spaces & Parks
Increasing green cover in cities.
Revitalization of urban lakes and water bodies.
Development of parks with eco-friendly designs.
d. Climate Resilience & Pollution Control
Reduction of urban heat islands through tree plantations.
Encouragement of solar energy and LED street lighting.
Development of rainwater harvesting systems.
e. Governance Reforms
Adoption of e-governance solutions for urban services.
Property tax and revenue collection reforms for financial sustainability.
Promotion of Public-Private Partnerships (PPP) in infrastructure projects.
4. Implementation Strategy
a. Selection of Cities
Initially, 500 cities were selected based on population size and growth potential.
Cities with a population above 1 lakh were prioritized, covering all states and union territories.
b. Financial Framework
Total Budget (AMRUT 1.0): ₹50,000 crore (2015-2022).
Government Funding:
50% by the central government for cities with a population of less than 1 million.
One-third (33%) funding for cities with a population of more than 1 million.
The rest is funded by the state government and local urban bodies.
Public-Private Partnerships (PPP) were encouraged for certain projects.
c. State Annual Action Plans (SAAPs)
States prepare Annual Action Plans (SAAPs) for urban development.
The Ministry of Housing and Urban Affairs (MoHUA) approves projects based on SAAPs.
d. Service Level Benchmarks (SLBs)
Cities are required to meet predefined benchmarks for water, sanitation, and transport.
These benchmarks help track the mission’s progress.
5. Achievements of AMRUT 1.0 (2015-2022)
AMRUT has made significant contributions to urban infrastructure. Some of the major achievements include:
a. Water Supply & Sanitation
Over 105 lakh household water tap connections installed.
100% sewerage and septage coverage in several cities.
Over 5,000 km of sewer networks developed.
b. Urban Transport & Roads
More than 1,500 km of footpaths and cycle tracks constructed.
Expansion of public transport systems in major cities.
c. Green Spaces & Sustainable Development
More than 2,800 parks developed to enhance urban greenery.
LED street lighting and solar-powered urban infrastructure adopted.
6. AMRUT 2.0 (2021-2026): The Next Phase
Recognizing the need for sustained efforts, the Government of India launched AMRUT 2.0 in October 2021. The new phase focuses on:
a. Key Features of AMRUT 2.0
100% coverage of water supply to all urban households.
Focus on Circular Economy in Water Management.
Use of Digital Technologies – Smart water meters, GIS-based mapping, and AI-driven monitoring.
Enhancing Climate Resilience – More sustainable stormwater drainage systems.
Sewerage and septage management coverage extended to all cities.
Green and sustainable urban development.
7. Challenges in Implementation
Despite its success, AMRUT has faced several challenges:
a. Financial Constraints
Delay in fund disbursement from state and central governments.
Limited private sector investment due to uncertain returns.
b. Technical & Administrative Issues
Lack of technical expertise at the city level.
Slow execution of projects due to bureaucratic red tape.
c. Water Supply & Pollution Issues
Several cities still face groundwater depletion.
Pollution control remains a challenge in highly urbanized areas.
d. Public Awareness & Participation
Need for greater citizen engagement in water conservation efforts.
Low adoption of rainwater harvesting and recycling methods.
8. Success Stories
a. Pune (Maharashtra)
Successfully implemented 100% smart water metering.
Expanded sewerage network coverage across the city.
b. Surat (Gujarat)
Developed an advanced stormwater drainage system to prevent flooding.
Increased green spaces and public parks under AMRUT guidelines.
c. Indore (Madhya Pradesh)
Integrated AMRUT with Swachh Bharat Mission to improve waste management.
Built sustainable sewage treatment plants using PPP models.
9. Conclusion
The AMRUT mission has played a crucial role in transforming urban infrastructure in India. By focusing on water supply, sanitation, urban mobility, and green spaces, AMRUT has helped create more livable and sustainable cities. With the introduction of AMRUT 2.0, India is set to achieve universal water supply, efficient waste management, and climate-resilient urban development by 2026.
However, effective governance, timely execution, and increased public participation will be key to the mission’s long-term success.
The Smart City Mission is a government initiative aimed at transforming urban areas into sustainable and citizen-friendly cities by leveraging technology, infrastructure development, and efficient governance. Launched by the Government of India in 2015, the mission focuses on enhancing the quality of life for citizens through the integration of smart solutions in various urban sectors.
1. Objectives of the Smart City Mission
The primary objectives of the Smart City Mission are:
Improving Urban Infrastructure – Upgrading roads, water supply, sanitation, and waste management systems.
Enhancing Governance – Promoting e-governance and transparency in public services.
Sustainable Development – Ensuring environmental sustainability through renewable energy, efficient water management, and green spaces.
Efficient Use of Resources – Utilizing smart meters, energy-efficient buildings, and water conservation techniques.
Smart Mobility and Transportation – Developing integrated public transportation, smart parking, and non-motorized transport options.
Citizen Participation – Encouraging public involvement in urban planning and governance.
Security and Safety – Implementing smart surveillance, emergency response systems, and disaster management tools.
2. Key Features of a Smart City
A smart city integrates digital technology and sustainable practices to enhance urban living. Some key features include:
a. Smart Infrastructure
Smart Roads: Traffic management systems, intelligent lighting, and pedestrian-friendly pathways.
Smart Water Management: Sensor-based monitoring of water usage, leak detection, and efficient supply chains.
Waste Management: IoT-enabled garbage collection, recycling initiatives, and waste-to-energy conversion.
b. Digital Governance (e-Governance)
Online service delivery (e-payments, online grievances, digital documentation).
Citizen engagement through mobile apps and portals.
Automated monitoring of government services.
c. Smart Energy Solutions
Use of renewable energy sources (solar panels, wind energy).
Smart grids and real-time monitoring of electricity consumption.
Energy-efficient buildings with green certifications.
d. Smart Mobility and Transportation
Integrated public transport with real-time tracking.
E-mobility (electric buses, e-rickshaws, EV charging stations).
Smart traffic management to reduce congestion.
e. Sustainable Environment
Urban green spaces, vertical gardens, and afforestation.
Pollution control measures and smart air quality monitoring.
Rainwater harvesting and efficient water recycling.
f. Safety and Security
AI-driven surveillance systems, CCTV networks, and crime detection.
Disaster management systems with real-time alerts.
Smart emergency response services like connected ambulances.
3. Implementation Strategy
The Smart City Mission follows a bottom-up approach where local governments and citizens play a key role in decision-making.
a. Selection of Smart Cities
The government selects cities through a competitive process based on their proposal’s feasibility, innovation, and citizen participation. A total of 100 cities were chosen under this mission.
Government Funding: The central and state governments provide financial assistance.
Municipal Bonds: Cities raise funds through bonds in the capital market.
c. Area-Based Development (ABD) & Pan-City Solutions
Area-Based Development: Transforming a specific part of a city into a model smart zone.
Pan-City Solutions: Implementing smart technology across the entire city (e.g., integrated transport, real-time governance).
4. Challenges in Implementation
Despite its potential, the Smart City Mission faces several challenges:
a. Financial Constraints
High cost of smart infrastructure and limited government funding.
Difficulty in attracting private investment in long-term projects.
b. Technological Barriers
Lack of technical expertise in implementing smart solutions.
Cybersecurity threats and data privacy concerns.
c. Governance and Coordination Issues
Need for coordination between multiple stakeholders (government, private sector, citizens).
Bureaucratic delays in decision-making.
d. Socio-Economic Challenges
Inclusivity issues where smart solutions may not benefit the poor.
Displacement concerns due to urban redevelopment.
5. Success Stories & Examples
a. Pune Smart City
Implemented an Integrated Traffic Management System to reduce congestion.
Developed Smart Street Lighting with energy-efficient LED bulbs.
b. Bhopal Smart City
Established a Smart Surveillance System to improve public safety.
Introduced Waste-to-Energy Projects for sustainable waste management.
c. Ahmedabad Smart City
Launched Smart Transport Services like bike-sharing and BRTS (Bus Rapid Transit System).
Improved E-Governance Services through mobile applications.
6. Future of Smart Cities in India
The Smart City Mission is expected to pave the way for:
Wider Adoption of AI and IoT in city management.
Expansion to More Cities beyond the initial 100.
Integration with Digital India and Make in India initiatives for economic growth.
Focus on Climate-Resilient Cities to tackle environmental challenges.
7. Conclusion
The Smart City Mission is a transformative step towards modernizing India’s urban centers. While challenges persist, the initiative has already shown success in enhancing infrastructure, governance, and sustainability. The future of smart cities depends on continued innovation, investment, and citizen participation to make urban living more efficient, inclusive, and environmentally friendly.
Would you like me to add more specific details on any section?
Earthquake zones are categorized into seismic hazard zones based on the likelihood and intensity of earthquakes in a region. These zones vary by country, but a general classification is:
Seismic Zone Classification
Zone 1 (Very Low Hazard)
Least earthquake-prone areas.
Rare and weak seismic activity.
Example: Parts of central and eastern Canada, some interior regions of Africa.
Zone 2 (Low Hazard)
Minor earthquake activity.
Occasional moderate tremors, but rarely damaging.
Example: Parts of the Midwest USA, parts of Europe.
Zone 3 (Moderate Hazard)
Moderate seismic activity.
Can experience occasional damaging earthquakes.
Example: New Madrid Seismic Zone (USA), parts of Australia.
Zone 4 (High Hazard)
Frequent and strong earthquakes.
Significant damage potential.
Example: California (USA), Turkey, Northern India.
Zone 5 (Very High Hazard)
Most seismically active regions.
Major fault lines, high earthquake frequency.
Example: Japan, Indonesia, the Himalayas, Chile.
Different countries use their own classifications based on regional seismicity and building codes. Would you like details on a specific country’s zoning system?
The term “walkability” was primarily invented in the 1960s due to Jane Jacobs‘ revolution in urban studies. In recent years, walkability has become popular because of its health, economic, and environmental benefits. It is an essential concept of sustainable urban design.
A walkable city is an urban environment designed to prioritize pedestrian movement over vehicular traffic. It fosters accessibility, sustainability, and social interaction by creating streetscapes that are safe, convenient, and appealing for walking. The concept is rooted in urban planning principles that seek to enhance livability, reduce dependence on automobiles, and promote a healthier lifestyle.
Key Features of a Walkable City
1. Compact and Mixed-Use Development
Walkable cities are designed with a compact layout where residential, commercial, and recreational spaces coexist. This reduces the need for long commutes and makes essential services like grocery stores, offices, schools, and entertainment centers easily accessible on foot.
2. Pedestrian-Friendly Infrastructure
A well-designed walkable city includes:
Wide, shaded sidewalks
Well-maintained pedestrian paths
Traffic-calming measures like speed bumps and raised crosswalks
Car-free or limited-traffic zones in key areas
3. Efficient Public Transportation
An efficient and reliable public transportation system complements walkability by providing easy connectivity between different city areas. This includes:
Well-integrated bus and metro networks
Bike-sharing and e-scooter programs
Transit hubs located within walking distance
4. Green Spaces and Public Plazas
Parks, tree-lined streets, and community spaces enhance the pedestrian experience. They provide areas for relaxation, social interaction, and physical activity, making walking more enjoyable and beneficial.
5. Safety and Accessibility
Walkable cities ensure safety through:
Well-lit streets and pedestrian zones
Traffic control measures to protect pedestrians
Accessibility features like ramps and tactile paving for people with disabilities
6. Human-Centered Urban Design
Buildings and public spaces in walkable cities are designed to create an engaging streetscape. Ground-level shops, cafés, and cultural attractions encourage social interactions, making walking a more engaging experience.
Benefits of Walkable Cities
1. Environmental Benefits
Reduced Carbon Emissions: Less reliance on cars leads to lower greenhouse gas emissions.
Better Air Quality: Reduced vehicular pollution improves air quality.
Less Urban Sprawl: Compact, walkable cities reduce deforestation and land consumption.
2. Health and Well-Being
Increased Physical Activity: Walking reduces obesity, cardiovascular diseases, and diabetes.
Lower Stress Levels: Green spaces and less noise pollution contribute to mental well-being.
3. Economic Growth
Boosts Local Businesses: Pedestrian-friendly areas attract more foot traffic to local shops and restaurants.
Increases Property Value: Walkable neighborhoods are in high demand, leading to higher real estate values.
4. Social and Cultural Benefits
Enhanced Community Interaction: Walkable spaces encourage social connections.
Preservation of Cultural Heritage: Walkability fosters vibrant streetscapes that highlight local culture.
Examples of Walkable Cities
1. Copenhagen, Denmark
Copenhagen is a global leader in walkability, with extensive pedestrian zones, bicycle-friendly policies, and green spaces.
2. Amsterdam, Netherlands
With its well-planned pedestrian and cycling infrastructure, Amsterdam minimizes car dependency.
3. Barcelona, Spain
Barcelona’s Superblocks initiative limits car traffic in certain zones, creating safer, greener, and more walkable spaces.
4. Portland, USA
Portland is known for its compact urban planning, well-maintained sidewalks, and extensive public transport system.
Challenges and Solutions in Developing Walkable Cities
1. Urban Sprawl
Solution: Implement mixed-use zoning and higher-density development.
2. Car Dependency
Solution: Improve public transport and pedestrian infrastructure.
Solution: Design covered walkways, plant more trees, and create climate-resilient infrastructure.
Conclusion
A walkable city is not just about walking—it’s about creating sustainable, healthy, and socially vibrant urban environments. By designing cities that prioritize pedestrians, we can reduce pollution, enhance quality of life, and foster economic growth. As urban populations continue to rise, embracing walkability will be key to building resilient and future-ready cities.
An Edge City is a large urban center located on the periphery of a traditional city, characterized by significant commercial, office, and retail development. These areas emerge as self-sufficient economic hubs, often surpassing the central business district (CBD) in job opportunities and services. The term was popularized by journalist Joel Garreau in his 1991 book Edge City: Life on the New Frontier, in which he described the rise of these suburban economic centers as a key shift in urban development.
Characteristics of an Edge City
Joel Garreau defined five main criteria for identifying an edge city:
At least 5 million square feet of office space – Comparable to the downtowns of medium-sized cities.
At least 600,000 square feet of retail space – Similar in scale to a large shopping mall.
More jobs than bedrooms – Unlike traditional suburbs, edge cities are job centers, not just residential areas.
Perceived by the public as a single place – Despite rapid development, they are recognized as distinct areas with a unique identity.
Developed in recent decades – Edge cities are a product of the late 20th century, mostly emerging after 1950.
Origins and Growth of Edge Cities
Edge cities developed as a response to several factors, including:
Suburbanization – As people moved to the suburbs, businesses followed to provide local jobs and services.
Highway Expansion – The development of interstate highways enabled businesses and workers to operate outside traditional urban cores.
Economic Decentralization – Companies sought more affordable land and lower taxes in suburban areas.
Retail Boom – Large shopping centers and business parks became anchors for economic activity.
Key Features of an Edge City
1. Economic and Commercial Centers
Edge cities are dominated by office buildings, corporate headquarters, business parks, and large retail complexes. They serve as financial and employment hubs, reducing reliance on the downtown core.
2. Located Near Major Transportation Nodes
Most edge cities develop at the intersection of highways, near airports, or along transit corridors, allowing easy access for commuters and businesses.
3. Auto-Dependent
Unlike traditional urban centers, edge cities are designed for automobiles, with vast parking lots, limited pedestrian infrastructure, and minimal public transportation options.
4. Mixed-Use Development
Many edge cities include retail, entertainment, and residential spaces, making them more self-contained than traditional suburbs. However, their design often prioritizes commercial spaces over walkability.
5. Rapid Development
Edge cities often emerge within a few decades, transforming once-rural or suburban areas into major economic centers.
Examples of Edge Cities
Several well-known edge cities exist around the world, particularly in the United States:
United States
Tysons, Virginia (outside Washington, D.C.) – One of the earliest and largest edge cities, home to corporate offices, shopping centers, and Metro transit expansion.
Irvine, California (near Los Angeles) – A master-planned city with tech businesses, universities, and major retail centers.
King of Prussia, Pennsylvania (outside Philadelphia) – Known for the King of Prussia Mall, extensive office parks, and major highways.
The Galleria, Houston, Texas – A commercial hub with corporate offices, retail centers, and hotels.
Buckhead, Atlanta, Georgia – A business district with high-end retail, financial institutions, and luxury residential developments.
International Examples
La Défense, Paris, France – A major business district with skyscrapers, corporate offices, and a strong transit network.
Canary Wharf, London, UK – A financial hub outside the traditional City of London business district.
Pudong, Shanghai, China – A modern financial district with skyscrapers, technology hubs, and international businesses.
Gurgaon, India – A fast-growing business center with multinational corporations, IT hubs, and luxury residential areas.
Impact of Edge Cities
Advantages
Economic Growth – Edge cities provide job opportunities, attract businesses, and boost regional economies.
Reduced Congestion in Downtowns – Decentralization eases pressure on traditional urban centers.
Increased Real Estate Value – Commercial and residential properties in edge cities often see appreciation.
Convenience – People can work, shop, and live closer to home, reducing long commutes.
Challenges and Criticisms
Car Dependency – Poor public transit makes edge cities heavily reliant on automobiles, leading to traffic congestion and pollution.
Lack of Urban Vibrancy – Unlike traditional downtowns, many edge cities lack cultural attractions and walkable public spaces.
Social and Economic Disparities – High costs of living and development can make edge cities inaccessible to lower-income groups.
Environmental Concerns – Sprawling developments lead to habitat destruction, increased carbon emissions, and infrastructure strain.
Future of Edge Cities
Trends in Edge City Development
As urban planning evolves, many edge cities are undergoing transformations:
Transit-Oriented Development (TOD) – Many edge cities are integrating metro, bus, and bike networks to reduce car dependency.
Mixed-Use and Walkable Designs – Urban planners are adding residential areas, green spaces, and pedestrian-friendly zones.
Smart City Innovations – Edge cities are adopting smart infrastructure, energy-efficient buildings, and technology-driven services.
Sustainability Initiatives – Efforts to incorporate green roofs, electric vehicle charging stations, and renewable energy sources.
Examples of Transformation
Tysons, Virginia is adding high-rise housing, Metro rail access, and pedestrian-friendly streets.
Irvine, California is focusing on mixed-use development and sustainability.
Canary Wharf, London is incorporating more cultural spaces, residential areas, and eco-friendly design.
Conclusion
Edge cities represent a major shift in urban development, reshaping suburban landscapes into economic powerhouses. While they offer employment and commercial opportunities, they also face significant challenges such as traffic congestion, environmental concerns, and lack of vibrant public spaces. Future developments are focusing on improving walkability, public transit, and sustainability, ensuring that edge cities evolve into more livable and inclusive urban environments.
New Urbanism is a planning and design movement that emerged in the late 20th century as a response to urban sprawl and automobile-dependent suburban development. It emphasizes walkability, mixed-use development, sustainable transportation, and human-scale urban environments. The movement seeks to create vibrant, livable communities that foster social interaction, economic diversity, and environmental sustainability.
Origins and History
New Urbanism began in the 1980s with the efforts of architects and planners such as Andrés Duany, Elizabeth Plater-Zyberk, and Peter Calthorpe. Their goal was to revive the traditional principles of urban design found in pre-World War II cities and towns, which were pedestrian-friendly and socially cohesive. The Congress for the New Urbanism (CNU), founded in 1993, became the leading organization promoting these ideas.
Principles of New Urbanism
The movement is guided by several key principles, which are outlined in the Charter of the New Urbanism:
Walkability – Streets and neighborhoods should be designed for pedestrians first, with wide sidewalks, pedestrian-friendly crossings, and traffic-calming measures.
Mixed-Use Development – Residential, commercial, and recreational spaces should be integrated within the same area to reduce reliance on cars and enhance community life.
Compact Design – Higher density developments help create lively urban environments and reduce land consumption.
Sustainability – Green building practices, energy efficiency, and the preservation of natural spaces are prioritized.
Diverse Housing Options – A mix of housing types (apartments, townhouses, single-family homes) allows people of different income levels and life stages to live within the same community.
Public Spaces and Civic Engagement – Parks, plazas, and community spaces encourage social interaction and local engagement.
Connectivity – A well-connected street network provides multiple routes for pedestrians, cyclists, and drivers, reducing traffic congestion.
Transit-Oriented Development (TOD) – Public transportation should be accessible and well-integrated with urban areas to reduce car dependence.
Aesthetics and Sense of Place – Architectural styles should reflect local culture and history, creating a visually appealing and unique identity for each community.
Resilient and Adaptive Design – Communities should be designed to withstand climate change, economic shifts, and other long-term challenges.
Key Features of New Urbanist Communities
New Urbanist developments often share common features that set them apart from conventional suburban design:
Gridded Street Patterns – Unlike cul-de-sac-heavy suburban layouts, new urbanist communities use interconnected streets to improve mobility and accessibility.
Mixed-Income Housing – By offering various housing options, these communities avoid socio-economic segregation.
Walkable Commercial Centers – Shops, restaurants, and offices are within walking distance of homes.
Public Transit Integration – Bus stops, light rail stations, and bike-sharing programs encourage alternative transportation.
Green Spaces – Parks, greenways, and community gardens enhance quality of life and environmental sustainability.
Examples of New Urbanism in Practice
Several successful new urbanist projects demonstrate the effectiveness of the movement’s principles:
Seaside, Florida, USA – One of the first new urbanist communities, designed by Andrés Duany and Elizabeth Plater-Zyberk, featuring walkability, mixed-use spaces, and community-centered design.
Celebration, Florida, USA – A master-planned community developed by Disney with a strong emphasis on traditional neighborhood design.
Stapleton, Denver, USA – A redevelopment of a former airport into a mixed-use, walkable community with diverse housing and green spaces.
Vauban, Freiburg, Germany – A car-light eco-community focused on sustainability, energy efficiency, and alternative transportation.
Portland, Oregon, USA – Known for its commitment to public transit, walkability, and sustainable urban planning.
Benefits of New Urbanism
Social Benefits
Enhances community interaction and social cohesion.
Encourages diversity and inclusivity through mixed-income housing.
Reduces crime by increasing street activity and community surveillance.
Economic Benefits
Increases property values and local business activity.
Reduces infrastructure costs by making efficient use of land and utilities.
Supports small businesses through walkable commercial areas.
Environmental Benefits
Reduces carbon footprint by promoting public transit and walking.
Preserves green spaces and reduces urban sprawl.
Encourages sustainable building practices and energy-efficient infrastructure.
Challenges and Criticisms
Despite its advantages, New Urbanism faces several challenges:
High Costs of Development – Mixed-use, high-density developments often require significant investment.
Zoning and Regulatory Barriers – Many municipalities have outdated zoning laws that favor sprawl over compact, mixed-use development.
Affordability Issues – Some new urbanist communities have become expensive, limiting accessibility for lower-income residents.
Resistance to Change – Traditional suburban residents and developers may oppose denser, mixed-use designs.
Conclusion
New Urbanism represents a paradigm shift in urban planning, promoting sustainable, walkable, and community-oriented design. While challenges remain, the movement continues to influence modern city planning, inspiring developments that prioritize people over cars and foster vibrant, livable neighborhoods. As cities and towns face growing environmental and social pressures, the principles of New Urbanism offer a viable solution for creating resilient, inclusive, and sustainable communities.
India has an extensive public transportation network, including metro systems, suburban rail, bus rapid transit (BRT), and other public transit services. Here’s a list of top public transport systems in India across different modes:
1. Metro Rail Systems (Rapid Transit) 🚇
Delhi Metro (Largest & most advanced metro system in India)
Mumbai Metro (Expanding network with multiple corridors)
Bengaluru Namma Metro (Well-connected metro system)
Chennai Metro (Efficient air-conditioned metro service)
Kolkata Metro (India’s first metro, now expanding)
Hyderabad Metro (One of the world’s largest PPP metro projects)
Pune Metro (Newly operational with planned expansions)
Ahmedabad Metro (Part of the Smart City development)
Lucknow Metro (Efficient transport system in Uttar Pradesh)
Jaipur Metro (Well-planned but limited network)
2. Suburban Rail Networks 🚆
Mumbai Suburban Railway (Lifeline of Mumbai, carrying over 7.5 million passengers daily)
Kolkata Suburban Railway (Extensive rail network in West Bengal)
Chennai Suburban Railway (Major suburban rail for the city)
Delhi Suburban Railway (Connects NCR regions like Gurgaon, Faridabad)
Hyderabad MMTS (Multi-Modal Transport System) (Suburban rail in Telangana)
3. Bus Rapid Transit (BRT) & City Bus Services 🚌
Ahmedabad BRTS (Janmarg) (Most successful BRT system in India)
Indore iBUS BRTS (Efficient bus rapid transit system)
Pune Rainbow BRTS (BRT corridors in Pune & Pimpri-Chinchwad)
Surat BRTS (Growing and well-managed BRT network)
Delhi DTC & Cluster Buses (Largest city bus fleet)
BEST Buses (Mumbai) (Mumbai’s iconic red buses)
BMTC (Bangalore Metropolitan Transport Corporation) (Largest city bus fleet in Karnataka)
Chennai MTC (Metropolitan Transport Corporation) (Major bus network)
Kolkata WBTC & CSTC Buses (Extensive bus network)
4. Regional & Intercity Transport 🚍
Indian Railways (IRCTC Trains) (Largest rail network for intercity transport)
State Transport Buses (MSRTC, UPSRTC, KSRTC, TSRTC, etc.)
Vande Bharat Express (Semi-High-Speed Trains) (New age express train service)
5. Water Transport 🚢
Kochi Water Metro (First water metro service in India)
Mumbai Ferry Services (Connecting Elephanta, Alibaug, and Navi Mumbai)
Kolkata Ferry Services (Hooghly river transport network)
6. Electric & Shared Mobility 🚖
Ola/Uber Ride-Sharing (Major app-based transport services)
Rapido Bike Taxis (Affordable last-mile connectivity)
E-Rickshaws (Popular in Delhi, UP, and Bihar for last-mile transport)
major Urban Planning Models, their proponents, and the year they were proposed:
1. Concentric Zone Model
Proponent: Ernest Burgess
Year: 1925
Key Idea: Cities grow in a series of concentric rings from the center outward, with the central business district (CBD) at the core.
2. Sector Model
Proponent: Homer Hoyt
Year: 1939
Key Idea: Urban growth occurs in sectors or wedges radiating outward from the CBD along transportation corridors.
3. Multiple Nuclei Model
Proponents: Chauncy Harris & Edward Ullman
Year: 1945
Key Idea: Cities develop multiple centers (nuclei) rather than a single CBD, based on specific land uses such as industrial, residential, and commercial areas.
4. Urban Realms Model
Proponent: James E. Vance Jr.
Year: 1964
Key Idea: Metropolitan areas are made up of distinct realms, each functioning independently but connected to the whole.
5. Central Place Theory
Proponent: Walter Christaller
Year: 1933
Key Idea: Explains the spatial arrangement of cities based on market areas, with larger cities providing more specialized services.
6. Rank-Size Rule
Proponent: George Zipf
Year: 1949
Key Idea: The size of a city is inversely proportional to its rank in the urban hierarchy (e.g., the second-largest city is half the size of the largest city).
7. Growth Pole Model
Proponent: François Perroux
Year: 1955
Key Idea: Economic development is concentrated in certain urban “growth poles” that drive regional development.
8. Garden City Model
Proponent: Ebenezer Howard
Year: 1898
Key Idea: Cities should be planned with self-sufficient communities, surrounded by greenbelts, combining the best of urban and rural living.
9. Radiant City (Ville Radieuse)
Proponent: Le Corbusier
Year: 1924
Key Idea: A high-density, modernist city with skyscrapers, large open spaces, and separation of functions.
10. Linear City Model
Proponent: Arturo Soria y Mata
Year: 1882
Key Idea: Cities should develop along linear corridors following transportation routes, minimizing congestion.
11. Broadacre City Model
Proponent: Frank Lloyd Wright
Year: 1932
Key Idea: Cities should have low-density suburban settlements with large land plots for each family, emphasizing individual mobility.
12. Transit-Oriented Development (TOD) Model
Proponent: Peter Calthorpe
Year: 1993
Key Idea: Urban development should be centered around high-quality public transport systems, with walkable, mixed-use communities.
13. Smart Growth Model
Proponent: Smart Growth Network (Peter Calthorpe and others)
Year: 1990s
Key Idea: Encourages compact, mixed-use, and walkable urban development to reduce urban sprawl.
14. Compact City Model
Proponent: Dantzig & Saaty
Year: 1973
Key Idea: Promotes high-density, mixed-use urban areas with reduced reliance on cars to enhance sustainability.
15. Sustainable City Model
Proponent: Brundtland Commission
Year: 1987
Key Idea: Urban planning should balance environmental, economic, and social sustainability to ensure long-term urban livability.
Toxic elements from industrial waste and pesticides.
Nitrate & Phosphate Levels
mg/kg
Excessive levels lead to soil and water contamination.
Cation Exchange Capacity (CEC)
meq/100g
Measures soil fertility and nutrient-holding capacity.
Microbial Content
CFU/g
Assesses soil health and biological activity.
🔹 Measuring Devices: Soil Test Kits, Atomic Absorption Spectroscopy (AAS).
Conclusion 📊
Each type of pollution has unique measurement parameters crucial for monitoring, control, and policy formulation. Environmental agencies use these parameters to assess pollution levels and implement mitigation strategies.
Would you like details on any specific parameter or measuring instrument? 😊
The National Action Plan on Climate Change (NAPCC) in India consists of 8 core missions, each targeting a specific aspect of climate change mitigation and adaptation.
8 Missions of NAPCC and Their Targets:
National Solar Mission (NSM) 🌞
Promote solar energy development.
Achieve 100 GW solar power capacity by 2022 (now part of a larger 500 GW renewable energy goal by 2030).
National Mission for Enhanced Energy Efficiency (NMEEE) ⚡
Improve energy efficiency in industries.
Reduce energy intensity of GDP.
Promote market-based mechanisms like Perform, Achieve & Trade (PAT) scheme.
National Mission on Sustainable Habitat (NMSH) 🏙
Improve energy efficiency in buildings.
Enhance public transport and waste management.
National Water Mission (NWM) 💧
Improve water conservation and efficiency.
Target 20% reduction in water use by 2030.
National Mission for Sustaining the Himalayan Ecosystem (NMSHE) 🏔
Protect Himalayan glaciers and biodiversity.
Enhance climate resilience for mountain communities.
National Mission for a Green India (GIM) 🌲
Increase forest cover and eco-restoration.
Target 10 million hectares of afforestation by 2030.
National Mission for Sustainable Agriculture (NMSA) 🚜
Promote climate-resilient agriculture.
Improve soil health, water efficiency, and crop diversification.
National Mission on Strategic Knowledge for Climate Change (NMSKCC) 📚
Improve climate change research and data collection.
Enhance awareness and capacity building.
These eight missions are supplemented by State Action Plans on Climate Change (SAPCCs) and additional sector-specific initiatives like Faster Adoption and Manufacturing of Electric Vehicles (FAME).
Indian Council of Agricultural Research (ICAR) has established 4 research institutes and 10 regional research stations in the State of West Bengal. These institutes are catering to the agricultural technology needs of the State of West Bengal besides other parts of the country. In addition, at district level, 23 Krishi Vigyan Kendras (KVKs) have also been established in West Bengal for training and demonstration of the technologies developed by ICAR.
The list of the Research Institutes and Regional Research Stations located in the State of West Bengal is attached as Annexure-I.
Agricultural research institutes/centres located in West Bengal have undertaken research for the development of various field crops, pulses, oilseeds, fibres, horticultural crops, climate resilient varieties; poultry and fisheries sectors; development of ergonomically improved tools & equipment and women friendly tools and machineries; demonstration, training and skill development programmes for farmers and stakeholders etc. During the last three years (2021-2023) and 2024 a total of 132 field crops varieties were developed and released for West Bengal. These include 69 varieties of cereals; 16 of oilseeds; 22 of pulses; 11 of fibre crops; 8 of forages and 6 of sugarcane.
Agricultural growth depends upon various policies and schemes of Central Government, State Governments and the research carried out by the Agriculture Research Institutes. In West Bengal, over the last three years, agricultural research and development institutions along with Government policies and support have made significant strides in improving agricultural growth.
Annexure-I
List of Agriculture Research Institutes located in the State of West Bengal
National Institute of Natural Fiber Engineering & Technology (NINFET), Kolkata
Central Research Institute for Jute & Allied Fibers (CRIJAF), Barrackpore, Kolkata
Central Inland Fisheries Research Institute (CIFRI), Barrackpore, Kolkata
Agricultural Technology Application Research Institute (ATARI), Kolkata
List of Regional Centres of ICAR Institutes located in the State of West Bengal
Eastern Regional Station of ICAR-IVRI, Belgachia Road, Kolkata
Eastern Regional Station of ICAR-NDRI, Kalyani, Nadia
ICAR-CTRI Research Station, Dinhata, Cooch Behar
IARI Regional Station, Kalimpong, Darjeeling
ICAR-Regional Research Centre of CIBA, Kakdwip, 24 Parganas (South)
ICAR-CIFE Centre, Salt Lake City, Kolkata
Regional Research Centre of ICAR-CIFA, Rahara Fish Farm, Rahara
ICAR-CPCRI, Research Centre, Mohitnagar, Jalpaiguri
ICAR-CSSRI Regional Research Station, Canning Town, 24 Parganas (South)
ICAR-CISH Regional Research Station, Makhdumpur, Malda
The Government has initiated and is implementing the following schemes aimed to provide farmers with latest skilling requirements.
The Government is implementing Skill Training of Rural Youth (STRY) with the objective to impart short term skill training (7 days duration) to rural youths and farmers in agriculture and allied sectors for upgradation of their knowledge and skills and promote wage/self employment in rural areas. The component aims at providing short duration skill based training programs to rural youth and farmers on agri-based vocational areas for creating a pool of skilled manpower. Recently, the STRY programme has been subsumed under ATMA cafeteria.
The Government is implementing skill development programmes through Krishi Vigyan Kendra (KVK) under Indian Council of Agricultural Research (ICAR) in different States of the Country to serve as single window agricultural knowledge, resource and capacity development centres with mandate of technology assessment and demonstration for its use and capacity building. As part of its activities, the KVKs are imparting training to the farmers, farm women and rural youths on different aspects of agriculture and allied sectors (Crop Production, Horticulture, Soil Health and Fertility Management, Livestock Production and Management, Home Science/Women empowerment, Agril. Engineering, Plant Protection, Fisheries, Production of Input at site, Agro forestry etc.)for their capacity building.
A Centrally Sponsored Scheme on ‘Support to State Extension Programmes for Extension Reforms’ popularly known as Agriculture Technology Management Agency (ATMA) is implemented across the country by the Ministry of Agriculture & Farmers Welfare. The scheme promotes decentralized farmer-friendly Extension system in the country with an objective to support State Government’s efforts to revitalize the extension system and making available the latest agricultural technologies and good agricultural practices in different thematic areas of agriculture and allied areas to farmers, farm women and youth, through various interventions like Farmers Training, Demonstrations, Exposure Visits, Kisan Melas etc. Presently, the scheme is being implemented in 739 districts of 28 States & 5 UTs in thecountry.
The Ministry of Agriculture and Farmers Welfare is implementing ‘Sub Mission on Agricultural Mechanization’ (SMAM). For implementation of this scheme Four Farm Machinery Training & Testing Institutes (FMTTIs) located at Budni (Madhya Pradesh), Hissar (Haryana), Geraldine (Andhra Pradesh) and Biswanath Chariali (Assam) are engaged in the country for imparting skill development training courses to different categories of beneficiaries like farmers, technicians, under graduate engineers, entrepreneurs on selection, operation, repair and maintenance, energy conservation and management of agricultural equipments.
Rashtriya Krishi Vikas Yojana (RKVY), an umbrella scheme of Ministry of Agriculture & Farmers Welfare, is implemented for ensuring holistic development of agriculture and allied sectors. There is provision for allowing the states to choose their own agriculture and allied sector development activities including training programmes as per the district/state agriculture plan.
The Government has launched National Skill Development Mission under the Ministry of Skill Development and Entrepreneurship (MSDE) in July 2015, under which the DA&FW has been operationalizing skill training courses of minimum 200 hours duration for rural youth and farmers as per the approved Qualification Packs developed by Agriculture Skill Council of India (ASCI) in the areas of agriculture and allied sectors. Recently, this programme has been subsumed under ATMA cafeteria.
The details of the number of farmers benefited/trained under the skill development schemes implemented by the Ministry of Agriculture and Farmers Welfare during the last three years, year-wise is given as under:
S.No.
Schemes
Number of Farmers Trained
Total
2021-22
2022-23
2023-24
1.
STRY
10456
11634
20940
43030
2.
KVK
1691744
1953220
2156363
5801327
3.
ATMA
1359069
1428446
1207207
3994722
4.
SMAM
13261
15440
14971
43672
5.
RKVY
—
3799
2951
6750
6.
MSDE
3470
3715
718
7903
Total
3078000
3416254
3403150
9897404
The funds allotted/utilized under respective schemes in the districts of Tiruchirappalli and Pudukottai are given as under:
District : Tiruchirappalli.
(Rs. in Lakhs)
S.No
Schemes
2021-22
2022-23
2023-24
Funds alloted
Funds utilized
Funds alloted
Funds utilized
Funds alloted
Funds utilized
1.
STRY
0.42
0.42
0.42
0.42
1.26
1.26
2.
ATMA
51.5
51.5
24.9
24.9
21
21
3.
TNSDC STRY
0.88704
0.88704
0.68544
0.68544
—
—
Total
52.80704
52.80704
26.00544
26.00544
22.26
22.26
Source: State Department of Agriculture, Government of Tamil Nadu
District : Pudukottai
(Rs. in Lakhs)
S.No
Schemes
2021-22
2022-23
2023-24
Funds alloted
Funds utilized
Funds alloted
Funds utilized
Funds alloted
Funds utilized
1.
STRY
0.84
0.84
0.42
0.42
1.26
1.26
2.
ATMA
56.40
56.40
39.50
39.50
19.60
19.60
3.
TNSDC STRY
1.69
1.65
0.60
0.58
—
—
Total
58.93
58.89
40.52
40.50
20.86
20.86
Source: State Department of Agriculture, Government of Tamil Nadu.
Social control is the process by which a society regulates the behavior of its members. It’s a way to maintain order and stability, and to prevent negative behavior that could harm others.
1. Understanding Social Control
Social control refers to the mechanisms, strategies, and institutions that societies use to regulate individual and group behavior to maintain order and social cohesion. It ensures that individuals conform to societal norms, values, and laws, thereby preventing deviant behavior and promoting stability. Social control is essential for the smooth functioning of a community, as it creates a balance between personal freedoms and collective interests.
2. Types of Social Control
Social control can be broadly categorized into two types:
Formal Social Control: This involves established institutions such as the legal system, law enforcement agencies, and government regulations that enforce rules through laws, policies, and punishments.
Informal Social Control: This includes unwritten norms, customs, traditions, and societal expectations that guide behavior. It operates through social institutions like family, religion, and peer groups.
3. Mechanisms of Social Control
Several mechanisms help maintain order and cohesion in communities. These include:
A. Legal and Political Mechanisms (Formal Control)
Laws and Regulations – Governments establish legal frameworks that define acceptable behavior and prescribe penalties for violations.
Law Enforcement – Police, courts, and correctional institutions ensure compliance with laws and administer justice.
Government Policies – Public policies and governance structures regulate behavior in economic, social, and political spheres.
B. Social and Cultural Mechanisms (Informal Control)
Norms and Values – Societal expectations shape behavior by defining what is considered right or wrong.
Family and Socialization – Parents, relatives, and community elders teach norms and values, reinforcing positive behaviors.
Religion and Morality – Religious institutions promote ethical behavior and instill a sense of moral responsibility.
Education – Schools and universities teach discipline, civic responsibility, and critical thinking.
Peer Pressure – Friends and social groups influence behavior through acceptance or rejection.
C. Psychological and Emotional Mechanisms
Guilt and Conscience – Internalized moral standards help individuals self-regulate behavior.
Public Opinion and Social Stigma – Fear of social rejection discourages deviant actions.
4. Importance of Social Control in Communities
Maintains Order and Stability – Prevents chaos by ensuring individuals follow common rules.
Promotes Social Cohesion – Strengthens bonds between individuals through shared values.
Protects Rights and Freedoms – Balances personal liberties with collective welfare.
Encourages Positive Behavior – Rewards compliance with norms and discourages deviance.
Conclusion
Social control is fundamental for maintaining order and cohesion in any society. Through formal institutions and informal cultural practices, communities ensure that individuals adhere to shared norms, creating a stable and harmonious social environment. Effective social control mechanisms help in the smooth functioning of society, fostering a sense of belonging and cooperation among its members.
References
Breed, W. (1955). Social control in the newsroom: A functional analysis. Social forces, 326-335.
Dehalwar, K., & Sharma, S. N. (2024). Social Injustice Inflicted by Spatial Changes in Vernacular Settings: An Analysis of Published Literature.
Horwitz, A. V. (1990). The logic of social control. Springer Science & Business Media.
Janowitz, M. (1975). Sociological theory and social control. American Journal of sociology, 81(1), 82-108.
Ross, E. A. (2017). Social control: A survey of the foundations of order. Routledge.
Settlement sociology and migration studies are two interrelated fields that explore how human populations establish communities and how migration patterns influence social, economic, and political structures. Settlement sociology focuses on the development, organization, and transformation of human settlements, while migration studies examine the movement of people across geographic spaces, whether voluntary or forced. Together, these disciplines offer insights into urbanization, rural development, demographic shifts, and policy implications.
Settlement Sociology
Settlement sociology originated as a subfield of sociology that examines how people establish and maintain communities, focusing on aspects such as economic activity, social organization, and governance structures. It encompasses both rural and urban settlements, analyzing the ways in which individuals and groups adapt to their environment and contribute to social cohesion.
Key Aspects of Settlement Sociology:
Urban and Rural Settlements: Examines the structure, function, and dynamics of different types of settlements, from small villages to large metropolitan areas.
Social Institutions: Investigates how families, educational systems, religious institutions, and economic structures shape community life.
Infrastructure and Development: Studies the role of transportation, housing, and public services in shaping settlements.
Social Integration and Conflict: Analyzes issues such as segregation, gentrification, and community resilience.
Environmental Adaptation: Looks at how human settlements evolve in response to environmental challenges and technological advancements.
Migration Studies
Migration studies focus on the movement of people within and across borders, considering economic, social, political, and environmental factors that drive migration. It explores various migration patterns, including voluntary migration for work or education, forced migration due to conflict or natural disasters, and internal migration within a country.
Types of Migration:
Internal Migration: Movement within national borders, such as rural-to-urban migration or interregional migration.
International Migration: Cross-border movement for employment, education, or asylum-seeking.
Forced Migration: Displacement due to war, persecution, natural disasters, or climate change.
Labor Migration: Migration driven by employment opportunities, often leading to remittance economies.
Return Migration: When migrants return to their place of origin after a period abroad.
Key Theories in Migration Studies:
Push-Pull Theory: Explains migration based on factors that push people away from their place of origin (e.g., poverty, conflict) and pull them toward a destination (e.g., economic opportunities, better living conditions).
Network Theory: Highlights the role of social connections and established migrant networks in facilitating migration.
World Systems Theory: Examines migration as a result of global economic inequalities and historical colonial relationships.
Transnationalism: Focuses on how migrants maintain ties with their home countries while integrating into new societies.
Interconnections Between Settlement Sociology and Migration Studies
Settlement sociology and migration studies intersect in several ways, particularly in how migration reshapes settlements and how settlement patterns influence migration flows. Key areas of intersection include:
Urbanization and Migration: Migration is a primary driver of urbanization, with cities expanding as migrants seek economic opportunities.
Social Integration of Migrants: Settlement sociology helps understand how migrants adapt to new communities, addressing issues such as cultural assimilation, discrimination, and social mobility.
Policy and Governance: Both fields inform policies on housing, labor markets, social services, and immigration regulations.
Diaspora and Transnational Communities: Migration leads to the formation of transnational communities, influencing both the origin and destination settlements.
Impact of Climate Change: Rising environmental concerns have led to increased research on climate-induced migration and its impact on settlements.
Conclusion
Settlement sociology and migration studies provide crucial insights into the evolving patterns of human habitation and movement. By understanding how communities are formed, maintained, and transformed by migration, researchers and policymakers can develop strategies to foster inclusive and sustainable societies. As migration continues to shape global demographics, interdisciplinary approaches will be essential in addressing challenges related to urbanization, social integration, and economic development.
References
Anderson, B. (2019). New directions in migration studies: towards methodological de-nationalism. Comparative Migration Studies, 7(1), 1-13.
Dehalwar, K., & Sharma, S. N. (2024). Social Injustice Inflicted by Spatial Changes in Vernacular Settings: An Analysis of Published Literature.
Levitt, P., & Jaworsky, B. N. (2007). Transnational migration studies: Past developments and future trends. Annu. Rev. Sociol., 33(1), 129-156.
King, R. (2012). Geography and migration studies: retrospect and prospect. Population, space and place, 18(2), 134-153.
Pessar, P. (2003). Engendering migration studies. Gender and US immigration: Contemporary trends, 22-42.
Nawyn, S. J. (2010). Gender and migration: Integrating feminist theory into migration studies. Sociology Compass, 4(9), 749-765.
Gentrification refers to the process of urban transformation where lower-income neighborhoods undergo redevelopment, leading to an influx of middle- and upper-class residents. This often results in rising property values, increased commercial investments, and displacement of original residents.
Image Credit: Rigolon, A., & Németh, J. (2019). Toward a socioecological model of gentrification: How people, place, and policy shape neighborhood change. Journal of Urban Affairs, 41(7), 887–909. https://doi.org/10.1080/07352166.2018.1562846
Causes of Gentrification
Urban Redevelopment – Governments and private investors initiate renewal projects to modernize deteriorating areas.
Economic Growth – Expansion of industries, businesses, and job opportunities attracts wealthier populations.
Improved Infrastructure – Investments in public transport, green spaces, and cultural hubs make areas more desirable.
Cultural and Social Appeal – Artists, students, and young professionals often drive early waves of gentrification.
Demographic Shift – Wealthier, often younger, populations move into historically working-class or marginalized areas.
Rising Property Values – Increased demand leads to higher real estate prices and rents.
Displacement of Low-Income Residents – Original inhabitants may be forced out due to unaffordable costs.
Change in Local Businesses – Small, local businesses are replaced by upscale restaurants, cafes, and retail chains.
Urban Aesthetic Transformation – Old buildings are renovated, and modern architectural developments emerge.
Social and Economic Impacts
Positive Effects
Improved infrastructure and amenities.
Increased property values benefiting homeowners.
Reduction in crime rates in some cases.
Economic revitalization through new businesses.
Negative Effects
Loss of cultural and social identity of neighborhoods.
Displacement of lower-income residents due to unaffordable rents.
Social tensions between newcomers and long-term residents.
Homelessness and increased socio-economic disparities.
Gentrification in the Modern Context
Gentrification in Global Cities – London, New York, San Francisco, and Berlin have witnessed rapid gentrification, affecting housing affordability.
Government Policies and Interventions – Rent control laws, affordable housing policies, and community-led development initiatives aim to mitigate negative impacts.
Sustainable Urban Planning – Efforts to balance economic development with social equity, ensuring inclusive growth.
Gentrification is the process by which urban neighborhoods, often those that have long been home to lower-income residents, experience redevelopment through the influx of middle- and upper-class populations. This urban transformation is driven by a combination of economic forces, policy interventions, and cultural shifts. While gentrification can stimulate economic growth and improve public infrastructure, it frequently also results in the displacement of longstanding communities and the loss of cultural identity.
Definition and Causes
Urban Redevelopment Initiatives: Government-led programs and private investments often target dilapidated areas for revitalization. Infrastructure improvements—such as upgraded transportation, parks, and utilities—create a more attractive environment for new investments.
Economic Growth: As industries expand and job opportunities increase, wealthier populations are drawn to urban centers. The rise in demand for modern amenities and lifestyle-oriented housing leads to increased property values.
Cultural Shifts: Artists, young professionals, and creative entrepreneurs are frequently the early adopters of gentrification, drawn by affordable spaces and the vibrant energy of urban life. Their presence, while culturally enriching, can alter the original social fabric.
Policy and Zoning Changes: Changes in zoning laws, tax incentives, and housing policies can accelerate redevelopment. These policies are often designed to promote economic growth but may inadvertently contribute to the exclusion of lower-income residents.
Key Features of Gentrification
Demographic Shifts: The influx of wealthier, often younger, populations reshapes the social demographics of a neighborhood.
Rising Property Values and Rents: Increased demand drives up the cost of housing, often pricing out long-term residents.
Displacement: Original residents, frequently from marginalized communities, may be forced to relocate as affordable housing becomes scarce.
Transformation of Local Businesses: Traditional local stores and markets give way to upscale boutiques, cafes, and restaurants tailored to new residents.
Urban Aesthetic Changes: Historical buildings are renovated or replaced, and new architectural styles emerge that reflect modern tastes.
[Displacement of Long-Term, Lower-Income Residents]
Figure 1 illustrates the flow of the gentrification process—from initial urban decay through investment and renewal to the resulting economic and social shifts that can lead to displacement.
Table 1: Impact of Gentrification
Aspect
Positive Impact
Negative Impact
Economic
Boosts local economy; increases tax revenue
Rising costs; displacement of low-income groups
Social
Reduction in crime rates; enhanced public services
Social tensions; erosion of long-standing community ties
Cultural
Revitalizes neighborhoods with creative inputs
Loss of cultural identity; homogenization of urban spaces
Housing
Renovation of housing stock; improved amenities
Escalating rents; loss of affordable housing
Table 1 summarizes the dual nature of gentrification impacts, showing that while there are economic and social benefits, these gains often come at the cost of affordability and cultural diversity.
Conclusion
Gentrification is a multifaceted phenomenon that brings about both revitalization and disruption. While the influx of investment and economic growth can lead to better infrastructure and reduced crime, the displacement of long-standing, lower-income residents poses serious challenges. Sustainable urban planning that incorporates affordable housing and community engagement is essential for ensuring that redevelopment benefits all stakeholders without eroding the unique cultural character of urban neighborhoods. This balanced approach is key to fostering inclusive growth in rapidly changing urban environments.
Gentrification is a double-edged sword, bringing economic growth but also deepening social inequalities. While it revitalizes urban spaces, it raises concerns about affordability, displacement, and cultural erosion. Sustainable policies and inclusive urban planning are essential to ensure that development benefits all residents.
References
Almeida, R., Patrício, P., Brandão, M., & Torres, R. (2022). Can economic development policy trigger gentrification? Assessing and anatomising the mechanisms of state-led gentrification. Environment and Planning A: Economy and Space, 54(1), 84-104.
Dehalwar, K., & Sharma, S. N. (2024). Social Injustice Inflicted by Spatial Changes in Vernacular Settings: An Analysis of Published Literature.
Rigolon, A., & Németh, J. (2019). Toward a socioecological model of gentrification: How people, place, and policy shape neighborhood change. Journal of Urban Affairs, 41(7), 887–909. https://doi.org/10.1080/07352166.2018.1562846
Kovács, Z. (2009). Social and economic transformation of historical neighbourhoods in Budapest. Tijdschrift voor economische en sociale geografie, 100(4), 399-416.
Saleh, H., & Remmang, H. (2018). Economic gentrification and socio-cultural transformation metropolitan suburban of Mamminasata.
Thomas, J., & Vogel, B. (2018). Intervention gentrification and everyday socio-economic transactions in intervention societies. Civil Wars, 20(2), 217-237.
Gentrification is a complex and often controversial process in which urban neighborhoods experience economic and social transformation. Typically, this involves an influx of wealthier residents, increased property values, and shifting cultural dynamics. While some view gentrification as a means of urban renewal that brings investment and improvement to deteriorating neighborhoods, others criticize it for displacing long-standing residents and eroding the cultural identity of communities. This article explores the causes, consequences, and broader implications of gentrification on the social fabric of urban settlements.
Understanding Gentrification
Gentrification is driven by multiple factors, including urban redevelopment policies, real estate speculation, and an increasing desire among middle- and upper-class individuals to live in historically marginalized neighborhoods. The process often begins when artists, young professionals, and entrepreneurs move into affordable urban areas, making them trendy and desirable. As demand grows, property values and rent prices rise, leading to demographic shifts that can have profound social consequences.
Socioeconomic Impact
One of the most immediate effects of gentrification is the displacement of low-income residents. Rising rents and property taxes make it difficult for long-term residents to afford to stay in their homes, forcing them to relocate to less expensive, often less accessible areas. This displacement can contribute to increased homelessness and socioeconomic instability, disrupting the lives of those who have built their communities over generations.
On the other hand, gentrification can bring economic benefits, such as improved infrastructure, better public services, and increased business investment. New businesses, restaurants, and cultural institutions often emerge, leading to job creation and enhanced amenities. However, these benefits are not always equitably distributed, with wealthier newcomers reaping the most rewards while poorer residents struggle to adapt.
Cultural and Social Disruptions
Gentrification alters the cultural landscape of urban neighborhoods, often diluting or erasing the historical and ethnic identity of these communities. Long-standing businesses, community centers, and places of worship may be forced to close due to rising costs, breaking down social networks that have provided support and cohesion for generations. The influx of wealthier residents can also lead to a cultural clash, with differences in lifestyle, values, and social engagement creating tensions between old and new inhabitants.
Changes in Political Representation
As demographics shift, so does political representation. Gentrified areas often see a change in voting patterns and policy priorities, with new residents advocating for different urban policies than those of long-term residents. This shift can result in policies that favor further development and real estate investment, sometimes at the expense of affordable housing and social welfare programs.
Resistance and Community Activism
Despite its challenges, many communities resist gentrification through grassroots activism and policy advocacy. Rent control measures, affordable housing initiatives, and community land trusts have been used to mitigate displacement and preserve the character of neighborhoods. Local organizations also work to amplify the voices of long-term residents, ensuring they have a say in the future of their communities.
Conclusion
Gentrification is a double-edged sword, bringing both revitalization and displacement to urban areas. While it can lead to economic growth and improved infrastructure, it often comes at the cost of social cohesion and cultural heritage. A balanced approach—one that prioritizes affordable housing, community engagement, and inclusive urban planning—is essential to ensuring that the benefits of gentrification are shared equitably among all residents. Only through mindful and equitable development strategies can cities preserve the diversity and vibrancy that make urban life so rich and dynamic.
References
Dehalwar, K., & Sharma, S. N. (2024). Politics in the Name of Women’s Reservation. Contemporary Voice of Dalit, 2455328X241262562.
Dehalwar, K., & Sharma, S. N. (2024). Social Injustice Inflicted by Spatial Changes in Vernacular Settings: An Analysis of Published Literature.
Lees, L., Slater, T., & Wyly, E. (2013). Gentrification. Routledge.
Ogbanga, M. M. (2024). Assessment of the Barriers to the Adoption of Clean Energy for Household Cooking in Okrika Local Government Area.
Ogbanga, M. M., & Bukie, B. F. (2024). Traditional Institutions and Conflict Resolution in Nigeria: A Social Work Analysis.
Ogbanga, M. M. (2024). Examining the Potential of Women Organisations in Promoting the Use of Clean Energy for Household Cooking; A Study of Okrika Local Government Area.
Ogbanga, M. M. (2024). Migration and Transformation: Understanding the Impact on Destination Countries in the Age of Mobility.
Ogbanga, M. M. (2024). Analyzing the Impact of Policy Reforms on Vulnerable Populations: A Comparative Study Case study of Social Welfare of River State.
Ogbanga, M. M. (2024). The Coping Mechanisms Employed by Youths in Response to Climate Change-Related Stressors.
Shaw, K. (2008). Gentrification: What it is, why it is, and what can be done about it. Geography Compass, 2(5), 1697-1728.
Sharma, S. N. Sustainable Transit-Oriented Development: A Solution to Urban Congestion.
Zukin, S. (1987). Gentrification: culture and capital in the urban core. Annual review of sociology, 13(1), 129-147.
Society is constantly evolving due to various internal and external factors. Two key concepts that help us understand these transformations are social change and social mobility. While both terms describe shifts in societal structures, norms, and individuals’ positions, they differ in scope and impact. This article explores their definitions, differences, and applications in the Indian context.
Social Change
Definition
Social change refers to significant alterations in societal structures, cultural patterns, and institutions over time. It is a broad concept that encompasses shifts in values, beliefs, technology, economic systems, and governance.
Causes of Social Change
Technological Advancements – Innovations like the internet, artificial intelligence, and digital payment systems have transformed social interactions.
Economic Changes – Industrialization and globalization have altered job markets and consumption patterns.
Political Movements – Reforms like the abolition of untouchability and reservation policies have reshaped Indian society.
Cultural and Religious Shifts – Changes in family structures, gender roles, and interfaith interactions reflect evolving societal norms.
Environmental Factors – Climate change and urbanization have led to new societal adaptations.
Examples in Indian Society
Women’s Empowerment – Increased female participation in education and workforce due to legal and social reforms.
Digital Revolution – The rise of mobile banking, e-governance, and online education.
Social Justice Movements – The Dalit movement and LGBTQ+ rights activism have changed societal perceptions and policies.
Social Mobility
Definition
Social mobility refers to the movement of individuals or groups within a society’s hierarchical structure. It can be vertical mobility (moving up or down the social ladder) or horizontal mobility (changing occupations or locations without status change).
Types of Social Mobility
Upward Mobility – Improvement in social status, often through education, employment, or political power.
Downward Mobility – Decline in social status due to economic hardship or job loss.
Intergenerational Mobility – Change in status across generations (e.g., a farmer’s child becoming a doctor).
Intragenerational Mobility – Status change within an individual’s lifetime.
Factors Influencing Social Mobility
Education – A key driver for upward mobility in India.
Caste System – Although weakening, caste still influences mobility.
Economic Opportunities – Access to capital and jobs determines movement within the social hierarchy.
Government Policies – Reservations in education and jobs support marginalized communities.
Examples in Indian Society
Reservation System – Facilitates mobility for Scheduled Castes (SC), Scheduled Tribes (ST), and Other Backward Classes (OBCs).
Entrepreneurship – The rise of self-made business leaders from diverse backgrounds.
Urban Migration – Rural populations moving to cities for better economic opportunities.
Differences Between Social Change and Social Mobility
Aspect
Social Change
Social Mobility
Definition
Transformation in societal structures and cultural patterns
Movement of individuals or groups within the social hierarchy
Scope
Broad, affects society as a whole
Individual or group-based
Causes
Technological, economic, political, cultural factors
Education, economic opportunities, policies
Timeframe
Long-term and gradual
Can be short-term or long-term
Example in India
Abolition of untouchability, digital revolution
A farmer’s child becoming an engineer
Applications in Indian Society
Education Reforms – The expansion of education has led to both social change (greater literacy and awareness) and social mobility (people improving their socio-economic status).
Economic Policies – Initiatives like Skill India and Startup India promote social mobility by offering new employment opportunities.
Urbanization – Migration to cities results in both social mobility (better jobs, income growth) and social change (modern lifestyles, nuclear families).
Caste and Gender Dynamics – Legal protections and affirmative action drive social mobility while changing societal attitudes towards caste and gender roles.
Conclusion
Social change and social mobility are interconnected but distinct phenomena shaping Indian society. While social change alters the broader societal framework, social mobility determines how individuals or groups navigate that framework. Together, they play a crucial role in fostering a more inclusive, progressive, and equitable society.
References
Dehalwar, K., & Sharma, S. N. (2024). Politics in the Name of Women’s Reservation. Contemporary Voice of Dalit, 2455328X241262562.
Dehalwar, K., & Sharma, S. N. (2023). Fate of Slums of Bhopal-A Tale of Struggle and Resilience. Think India Journal, 26(4), 12-18.
Ogbanga, M. M., & Sharma, S. N. (2024). Climate Change and Mental Heat.
Dehalwar, K., & Sharma, S. N. (2024). Social Injustice Inflicted by Spatial Changes in Vernacular Settings: An Analysis of Published Literature.
Ogbanga, M. M. (2024). Assessment of the Barriers to the Adoption of Clean Energy for Household Cooking in Okrika Local Government Area.
Ogbanga, M. M. (2024). Examining the Potential of Women Organisations in Promoting the Use of Clean Energy for Household Cooking; A Study of Okrika Local Government Area.
Ogbanga, M. M. (2024). Vulnerabilities of Youths to Climate Change Impacts: A Case Study of Phalga Local Government Area.
Social stratification is a fundamental aspect of human societies, organizing individuals based on certain hierarchical structures. Two significant systems of stratification are the caste system and the class system. While both determine social positioning and influence an individual’s life experiences, they differ in terms of mobility, rigidity, origin, and the criteria for stratification. This article explores the major differences between these two systems.
Definition and Origins
Caste System
The caste system is a hereditary form of social stratification that divides individuals into distinct, rigid groups based on birth. This system has been historically prevalent in societies such as India, Nepal, and parts of Africa. It is often linked to religious doctrines, especially in Hindu society, where it is associated with the Varna system—Brahmins (priests), Kshatriyas (warriors), Vaishyas (traders), and Shudras (laborers), with Dalits (formerly known as untouchables) outside the hierarchy.
Class System
The class system is an open form of social stratification based on economic status, occupation, education, and wealth. It is more prevalent in industrialized and capitalist societies such as the United States and Europe. Unlike the caste system, class is not strictly determined by birth but rather by achievements, opportunities, and socio-economic conditions.
Key Differences
1. Basis of Stratification
Caste System: Based primarily on birth, religion, and traditional customs.
Class System: Based on economic factors, occupation, education, and achievements.
2. Social Mobility
Caste System: Social mobility is highly restricted; individuals remain in the caste they are born into for life.
Class System: Offers greater mobility; individuals can move up or down the social hierarchy through education, occupation, and economic success.
3. Rigidity vs. Flexibility
Caste System: Highly rigid and unchangeable; inter-caste mobility is almost impossible.
Class System: More flexible; people can change their class through effort and external circumstances.
4. Endogamy vs. Exogamy
Caste System: Encourages endogamy (marriage within the same caste) to maintain social purity.
Class System: Allows exogamy (marriage between different social classes), and social mobility often occurs through marriage.
5. Legal and Social Recognition
Caste System: Legally recognized in some countries, especially where caste-based reservations exist.
Class System: Not legally recognized but exists as an economic and social reality.
6. Impact on Social Relations
Caste System: Creates social divisions with limited interaction between different castes.
Class System: Allows for interaction across classes, though economic disparities may still limit relationships.
7. Economic and Occupational Influence
Caste System: Determines occupation traditionally, with little to no choice in profession.
Class System: Individuals have the freedom to choose their professions based on their skills and interests.
Modern-Day Relevance
Caste System Today
Despite legal abolitions, caste-based discrimination persists in many societies, particularly in India and South Asia. Affirmative action policies, such as reservations in education and employment, aim to uplift marginalized groups.
Class System Today
Class divisions continue to exist in capitalist economies, where income inequality and wealth gaps influence social mobility. Governments implement taxation, social welfare, and education policies to reduce class disparities.
Conclusion
While both the caste system and the class system create hierarchical divisions in society, the former is rigid and birth-based, while the latter is flexible and achievement-based. The caste system is deeply entrenched in tradition and religion, whereas the class system is shaped by economic and social factors. Understanding these distinctions is crucial in addressing social inequality and promoting inclusivity in modern societies.
References
Dehalwar, K., & Sharma, S. N. (2024). Politics in the Name of Women’s Reservation. Contemporary Voice of Dalit, 2455328X241262562.
Dehalwar, K., & Sharma, S. N. (2024). Social Injustice Inflicted by Spatial Changes in Vernacular Settings: An Analysis of Published Literature.
Mukherjee, R. (1999). Caste in itself, caste and class, or caste in class. Economic and political weekly, 1759-1761.
Olcott, M. (1944). The caste system of India. American Sociological Review, 648-657.
Ranadive, B. T. (1979). Caste, class and property relations. Economic and Political Weekly, 337-348.
Sharma, K. L. (1984). Caste and class in India: Some conceptual problems. Sociological Bulletin, 33(1-2), 1-28.
Track2Training International Conference on Urban Growth Simulation and GIS Applications
📅 Date: 21 March 2025 📍 Mode: Online (Virtual Conference) 🎯 Theme:Harnessing GIS and Simulation Models for Sustainable Urban Development
About the Conference
Urban areas around the world are undergoing rapid transformation, leading to challenges in infrastructure, environment, and sustainable development. Accurate simulation of urban growth patterns, combined with advanced Geographic Information System (GIS) techniques, is becoming essential for informed decision-making, effective urban planning, and policy formulation.
The Track2Training International Conference brings together leading researchers, planners, GIS professionals, policymakers, and industry experts to discuss innovations, research findings, and real-world applications of Urban Growth Simulation and GIS technologies.
This conference will provide a platform for presenting cutting-edge research, exchanging ideas, and fostering collaborations to shape future cities.
Conference Objectives
Explore urban growth simulation models such as CA-ANN, SLEUTH, and agent-based modeling.
Discuss integration of GIS tools in urban planning and environmental management.
Share successful case studies from developing and developed countries.
Highlight data-driven decision-making for sustainable city growth.
Promote collaboration between academia, government, and industry in GIS-based urban planning.
GIS Applications in Urban Planning – Spatial analysis, mapping, and decision support systems.
Land Use and Land Cover (LULC) Change Detection.
Smart City Planning and GIS.
Environmental Impact Assessment using GIS.
Case Studies – Successful urban growth simulations in cities like Indore, Delhi, and Bhopal.
Policy Implications and Governance in Urban Development.
Who Should Attend?
Urban Planners & City Development Authorities
GIS Analysts & Remote Sensing Specialists
Civil Engineers & Environmental Scientists
Policy Makers & Government Officials
Research Scholars & Students in Urban Studies, Geography, and Civil Engineering
Call for Papers & Presentations
Researchers are invited to submit original research papers, case studies, and project reports related to the conference theme. Selected papers will be published in Track2Training Conference Proceedings and may be considered for special issues of partnered journals.
Abstract Submission Deadline: 20 February 2025 Full Paper Submission Deadline: 10 March 2025 Notification of Acceptance: 15 March 2025
Registration Details
Students / Research Scholars: $20
Academicians: $30
Industry Professionals: $50
International Participants: $60
Registration Fee Includes: ✅ Access to all conference sessions ✅ Digital certificate of participation/presentation ✅ E-copy of the conference proceedings
Keynote Speakers (Tentative)
Dr. Shashikant Nishant Sharma – Expert in Urban Planning & GIS, multiple publications in SCI journals on urban growth modeling.
Dr. K. Dehalwar – Specialist in sustainable development and transport planning.
Prof. G. Kumar – Researcher in environmental health and waste management in urban areas.
This conference promises to be an enriching experience for anyone involved in shaping the cities of tomorrow, with a focus on predictive urban growth models and GIS-powered solutions for sustainable development.
Explore my love of coffee, from its rich scent to its revitalizing benefits. Coffee extends beyond being a beverage because it offers daily energy to me.
The love I have for coffee remains the greatest joy I have ever experienced.
Coffee has an enchanting appeal that attracts everyone. Coffee is the constant companion of my daily life as the strong aroma fills rooms in the mornings and the early sip creates a sense of calm relaxation. A beverage it is not since coffee brings its followers an engaging sensory voyage.
The Ritual of Coffee
Caffeine coffee requires a step-by-step ritual which extends beyond chemical ingestion. Fresh bean grinding at each step leads to a deliberate process that also brings soothing relaxation before ending in a flawless cup.
The brewing practice has a research-backed ability to enhance focus and reduce tension according to scientists (source). Making coffee is a ritual which enables me to find tranquility just before getting busy with my day.
The Variety and Taste
Numerous emotional states correspond with different types of coffee. Several days I would select a milky latte as the ideal choice yet I need the robust essence of dark roast on different occasions.
The Social Bond
Coffee helps people connect. Getting together with friends at your local café enables you to build lasting memories or spending relaxed time at home with fresh-brewed coffee. The development of coffee shops into cultural discussion and innovation centers can be easily understood by modern society.
The Boost in Energy
I have to mention my increased energy levels as well. My concentration levels and productivity improve throughout the entire day due to coffee consumption. The appropriate amount of caffeine becomes useful for performance enhancement yet avoids the negative effects of jitters.
Reasons to Love Coffee Too
Now is the ideal time for people who have not started drinking coffee to join the love for this beverage. Caffeine is exclusively for your taste because you can try a creamy cappuccino followed by a cold brew adventure.
In conclusion
The drink known as coffee represents both an established tradition and a manner of existence and brings laughter to our existence. The beverage plays a crucial role in my daily routine due to its delicious taste and stimulating effect. The enjoyment and everything that coffee gives me makes me love it beyond measure and I am incapable of living without its presence.
The Sustainable Development Goals (SDGs), established by the United Nations in 2015, represent a global commitment to address critical challenges such as poverty, inequality, climate change, and access to education and healthcare. These 17 goals aim to create a sustainable future by balancing economic growth, social inclusion, and environmental protection. Social work, as a profession dedicated to fostering social justice and improving the well-being of individuals and communities, plays a pivotal role in achieving these goals.
Understanding the SDGs
The SDGs encompass a broad spectrum of interconnected objectives, including:
No Poverty (Goal 1): Eradicating extreme poverty and ensuring access to resources and opportunities for all.
Zero Hunger (Goal 2): Addressing food security and promoting sustainable agriculture.
Good Health and Well-Being (Goal 3): Ensuring healthy lives and access to quality healthcare.
Quality Education (Goal 4): Providing inclusive and equitable education for all.
Gender Equality (Goal 5): Promoting gender equity and empowering women and girls.
Clean Water and Sanitation (Goal 6): Ensuring access to safe water and sanitation.
Affordable and Clean Energy (Goal 7): Promoting renewable energy and energy efficiency.
Decent Work and Economic Growth (Goal 8): Advocating for inclusive and sustainable economic growth.
Industry, Innovation, and Infrastructure (Goal 9): Building resilient infrastructure and fostering innovation.
Reduced Inequalities (Goal 10): Addressing disparities in income and opportunities.
Sustainable Cities and Communities (Goal 11): Creating safe and sustainable urban environments.
Responsible Consumption and Production (Goal 12): Encouraging sustainable consumption patterns.
Climate Action (Goal 13): Tackling climate change through mitigation and adaptation.
Life Below Water (Goal 14): Protecting marine ecosystems.
Life on Land (Goal 15): Promoting the sustainable use of terrestrial ecosystems.
Peace, Justice, and Strong Institutions (Goal 16): Promoting peaceful and inclusive societies.
Partnerships for the Goals (Goal 17): Strengthening global collaboration to achieve the SDGs.
The Role of Social Work
Social work contributes significantly to the realization of the SDGs through its core values of social justice, human rights, and empowerment. Below are some of the key ways in which social work aligns with and advances the SDGs:
Poverty Alleviation: Social workers engage in community development programs, advocate for social welfare policies, and provide direct assistance to marginalized populations, addressing the root causes of poverty.
Promoting Health and Well-Being: Social workers play a critical role in healthcare settings, offering counseling, case management, and support services to improve mental and physical health outcomes.
Advancing Education: Social workers support access to education by working with schools, families, and communities to address barriers such as poverty, discrimination, and lack of resources.
Gender Equality and Social Justice: Through advocacy and intervention, social workers combat gender-based violence, promote women’s empowerment, and challenge societal norms that perpetuate inequality.
Building Resilient Communities: Social workers assist communities in disaster preparedness, recovery, and resilience, aligning with goals such as climate action and sustainable cities.
Addressing Inequalities: Social workers work tirelessly to reduce inequalities by advocating for inclusive policies, combating discrimination, and ensuring equitable access to resources and opportunities.
Environmental Sustainability: Recognizing the interconnectedness of social and environmental issues, social workers engage in initiatives that promote environmental justice, sustainable practices, and awareness of climate change.
Strengthening Institutions and Partnerships: Social workers collaborate with governments, NGOs, and other stakeholders to design and implement programs that foster peace, justice, and effective governance.
Challenges and Opportunities
While social work has immense potential to advance the SDGs, it also faces challenges such as resource constraints, political resistance, and systemic inequities. However, these challenges present opportunities for innovation, advocacy, and collaboration. By leveraging technology, fostering partnerships, and emphasizing community-driven approaches, social workers can amplify their impact.
Conclusion
The SDGs provide a comprehensive framework for creating a sustainable and equitable world. Social work, with its commitment to social justice and human dignity, is uniquely positioned to contribute to these goals. By addressing systemic issues, empowering communities, and fostering resilience, social workers play a crucial role in transforming the vision of the SDGs into reality. As the world navigates complex global challenges, the integration of social work practices with the SDGs offers a pathway to a more inclusive and sustainable future.
References
Amadi, L. A., Ogbanga, M. M., & Agena, J. E. (2015). Climate change and feminist environmentalism in the Niger Delta, Nigeria. African Journal of Political Science and International Relations, 9(9), 361-371.
Adonye, F. G., & Ogbanga, M. M. (2024). THE CONTRIBUTION OF CHRISTIAN WOMEN GROUPS TO COMMUNITY DEVELOPMENT IN OPOBO/NKORO LOCAL GOVERNMENT AREA OF RIVERS STATE NIGERIA; IMPLICATIONS AND OPPORTUNITIES FOR SOCIAL WORK PRACTICE. The Professional Social Work Journal, 31.
Ogbanga, M. M. (2024). Migration and Transformation: Understanding the Impact on Destination Countries in the Age of Mobility.
Jack, J. T. C. B., Ogbanga, M. M., & Odubo, T. R. (2018). Energy poverty and environmental sustainability challenges in Nigeria. Ilorin Journal of Sociology, 10(1), 19-31.
Ramsey-Soroghaye, B. N., & Ogbanga, M. (2022). Socio-cultural determinants hindering research among social workers in Nigeria. African Journal of Social Work, 12(4), 153-162.
Ogbanga, M. M., & Bukie, B. F. (2024). Traditional Institutions and Conflict Resolution in Nigeria: A Social Work Analysis.
Ogbanga, M. M. (2024). Vulnerabilities of Youths to Climate Change Impacts: A Case Study of Phalga Local Government Area.
Amadi, L., Imoh-Ita, I., & Ogbanga, M. (2016). Exploring knowledge management and green corporate strategy (GCS) nexus. International Journal of Social Science and Humanities Research, 4(1), 66-82.
Ogbanga, M. M., & Sharma, S. N. (2024). Climate Change and Mental Heat.
Ngowari, G. B., & Ogbanga, M. (2020). The effects of cultural practices and knowledge systems on community development. Management Insight, 16(02), 9-16.
Nwakanma, E., & Ogbanga, M. M. Assessing disaster preparedness and Indigenous disaster management systems of at-risk communities in Isoko-South LGA of Delta State, Nigeria.
Uzobo, E., & Ogbanga, M. M. (2017). The Role of Civil Registration and Vital Statistics in the Attainment of Selected Sustainable Development Goals in Nigeria. Indian Journal of Sustainable Development, 3(2), 1-10.
The integration of social work into environmental and social issues has become increasingly critical in the face of global challenges such as climate change, environmental degradation, and social inequities. These interconnected crises demand a holistic approach that addresses both human well-being and environmental sustainability. Social work, as a profession rooted in social justice and community empowerment, is uniquely positioned to bridge the gap between human needs and ecological preservation. By incorporating ecological perspectives into their practice, social workers can address the multifaceted impacts of environmental issues on vulnerable populations, advocate for systemic change, and contribute to building resilient communities.
The Intersection of Social Work and Environmental Justice
Environmental issues often disproportionately affect marginalized and vulnerable populations, exacerbating existing social inequities. Communities with limited resources are more likely to experience the adverse effects of pollution, climate change, and natural disasters, which can lead to displacement, health crises, and economic instability. Social workers, with their focus on advocacy and empowerment, can play a pivotal role in addressing these disparities. By working at the intersection of social and environmental justice, they can help ensure that marginalized voices are heard in policy-making processes and that resources are distributed equitably.
For example, social workers can engage with communities to identify their specific needs and vulnerabilities in the face of environmental challenges. They can facilitate access to resources such as clean water, renewable energy, and sustainable housing, while also advocating for policies that address systemic inequities. This approach not only alleviates immediate hardships but also empowers communities to become active participants in creating sustainable solutions.
Social Work in Disaster Response and Climate Adaptation
Natural disasters, intensified by climate change, highlight the urgent need for integrating social work into disaster response and climate adaptation strategies. Social workers are often at the forefront of crisis intervention, providing emotional support, connecting individuals to resources, and helping communities rebuild. By incorporating environmental awareness into these efforts, social workers can address both the immediate and long-term impacts of disasters.
For instance, social workers can collaborate with urban planners and environmental scientists to develop community-based disaster preparedness programs. These initiatives can include educating residents about climate risks, creating evacuation plans, and advocating for infrastructure improvements to reduce vulnerability. Additionally, social workers can support individuals and families in navigating the emotional and psychological toll of environmental crises, fostering resilience and promoting mental health in the aftermath of disasters.
Advocacy and Policy Development
Social workers also play a crucial role in shaping policies that address the root causes of environmental and social issues. By leveraging their expertise in social justice and community engagement, they can advocate for systemic changes that promote sustainability and equity. This includes pushing for legislation that reduces carbon emissions, protects natural resources, and ensures access to essential services for all communities.
Collaboration is key to these efforts. Social workers can partner with environmental organizations, policymakers, and grassroots movements to amplify their impact. By bringing a human-centered perspective to environmental advocacy, they help ensure that policies are not only ecologically sound but also socially inclusive. This interdisciplinary approach is essential for addressing the complex and interconnected nature of today’s global challenges.
Building Resilient Communities
At the heart of integrating social work into environmental issues is the goal of building resilient communities. Resilience involves the ability to adapt to and recover from challenges, whether they stem from environmental disasters, economic instability, or social inequities. Social workers can contribute to resilience by fostering community cohesion, promoting education and awareness, and facilitating access to resources and opportunities.
For example, community-based programs that combine environmental education with social support can empower individuals to take proactive steps toward sustainability. These initiatives can include urban gardening projects, renewable energy cooperatives, and workshops on reducing environmental footprints. By involving community members in these efforts, social workers help create a sense of ownership and collective responsibility, which are essential for long-term success.
Conclusion
The integration of social work into environmental and social issues represents a vital step toward addressing the complex challenges of the 21st century. By combining their commitment to social justice with an ecological perspective, social workers can advocate for systemic change, support vulnerable populations, and promote sustainable development. This interdisciplinary approach not only addresses immediate crises but also lays the foundation for a more equitable and sustainable future. As the world grapples with the dual imperatives of social equity and environmental stewardship, the role of social work in bridging these domains will become increasingly indispensable.
References
Amadi, L., Imoh-Ita, I., & Ogbanga, M. (2016). Exploring knowledge management and green corporate strategy (GCS) nexus. International Journal of Social Science and Humanities Research, 4(1), 66-82.
Amadi, L., Igwe, P., & Ogbanga, M. (2016). Talking Right, Walking Wrong: Global Environmental Negotiations and Unsustainable Environmental Consumption. International Journal of Research in Environmental Science, 2(2), 24-38.
Amadi, L. A., Ogbanga, M. M., & Agena, J. E. (2015). Climate change and feminist environmentalism in the Niger Delta, Nigeria. African Journal of Political Science and International Relations, 9(9), 361-371.
Adonye, F. G., & Ogbanga, M. M. (2024). THE CONTRIBUTION OF CHRISTIAN WOMEN GROUPS TO COMMUNITY DEVELOPMENT IN OPOBO/NKORO LOCAL GOVERNMENT AREA OF RIVERS STATE NIGERIA; IMPLICATIONS AND OPPORTUNITIES FOR SOCIAL WORK PRACTICE. The Professional Social Work Journal, 31.
Bukie, B. F., & Ogbanga, M. M. (2024). Correctional Institutions (Prison) Congestion and the Health Implication of Inmates in Nigeria.
de Lima, G. N., Zuñiga, R. A. A., & Ogbanga, M. M. (2023). Impacts of Climate Change on Agriculture and Food Security in Africa and Latin America and the Caribbean. In Climate Change and Health Hazards: Addressing Hazards to Human and Environmental Health from a Changing Climate (pp. 251-275). Cham: Springer Nature Switzerland.
Jack, J. T. C. B., Ogbanga, M. M., & Odubo, T. R. (2018). Energy poverty and environmental sustainability challenges in Nigeria. Ilorin Journal of Sociology, 10(1), 19-31.
Ogbanga, M. M., & Bukie, B. F. (2024). Traditional Institutions and Conflict Resolution in Nigeria: A Social Work Analysis.
Nwakanma, E., & Ogbanga, M. M. Assessing disaster preparedness and Indigenous disaster management systems of at-risk communities in Isoko-South LGA of Delta State, Nigeria.
Ngowari, G. B., & Ogbanga, M. (2020). The effects of cultural practices and knowledge systems on community development. Management Insight, 16(02), 9-16.
Ramsey-Soroghaye, B. N., & Ogbanga, M. (2022). Socio-cultural determinants hindering research among social workers in Nigeria. African Journal of Social Work, 12(4), 153-162.
Uzobo, E., & Ogbanga, M. M. (2017). The Role of Civil Registration and Vital Statistics in the Attainment of Selected Sustainable Development Goals in Nigeria. Indian Journal of Sustainable Development, 3(2), 1-10.
The popular proverb, “When fishermen don’t go to sea, they mend their nets,” carries a profound lesson about preparation, diligence, and continuous improvement. It illustrates the importance of readiness for future opportunities by using periods of inactivity wisely. This adage has practical applications not only for fishermen but for anyone aspiring to achieve success in life. Success does not come by chance; it is the result of deliberate effort, preparation, and foresight.
The Meaning of the Proverb
In the life of a fisherman, the sea represents the place where he toils for his livelihood, casting nets to catch fish. However, fishing trips are not possible every day due to unfavorable weather or other conditions. During these intervals, wise fishermen repair their nets, ensuring they are strong, functional, and ready for the next venture. If they neglect this task, broken or weak nets may fail, leading to a loss of potential catch when they do return to the sea. This metaphor symbolizes that moments of rest or downtime should be used productively to prepare for future endeavors.
The Role of Preparation in Success
Success in any field requires preparation. Just as the fisherman’s net must be mended to ensure a fruitful catch, individuals must invest in self-improvement to seize opportunities when they arise. Preparation builds the foundation for success by enhancing skills, gathering knowledge, and fostering resilience. For students, preparation comes from diligent study and regular practice. For professionals, it involves continuous learning, networking, and refining their craft. The key to progress is recognizing that success is built during the moments when visible achievements seem distant.
Examples from Everyday Life
Consider the life of an athlete. A successful sportsperson does not simply rely on natural talent; they spend countless hours training, practicing techniques, and maintaining physical fitness even when no competitions are in sight. Similarly, a businessperson uses downtime to analyze market trends, refine strategies, and develop contingency plans. Those who ignore preparation risk falling behind when opportunities emerge. History is filled with examples of people who achieved greatness because they used their waiting periods to sharpen their abilities.
The Power of Reflection and Learning
Productive preparation also includes reflection. Taking time to analyze past experiences, both successes and failures, allows for greater insight and improvement. Just as a fisherman checks for weak spots in the net, individuals should evaluate their weaknesses and devise ways to overcome them. Learning from mistakes prevents repeating them, while understanding successes builds confidence for future ventures.
Resilience and Adaptability
Preparation fosters resilience, a key ingredient for success. In a rapidly changing world, being adaptable and ready for challenges is critical. The most successful individuals are those who have not only honed their skills but also anticipated potential obstacles. Like fishermen who adapt their nets for different fish or varying sea conditions, individuals must remain flexible in their strategies and continuously update their knowledge and abilities.
Conclusion
In life, success is rarely achieved by chance. It is the result of careful preparation and thoughtful action. The lesson from the fisherman’s net is a powerful reminder that moments of stillness are not wasted if they are used wisely. Preparing for success requires patience, reflection, and a relentless pursuit of improvement. Whether through learning new skills, planning for the future, or simply strengthening one’s mental and emotional resolve, the secret to success lies in making the most of every moment—even those when there is no immediate reward in sight. By mending our proverbial nets, we ensure that when the sea of opportunity calls, we are ready to answer with confidence and competence.
Spatial planning, also known as urban or regional planning, is a discipline that focuses on the organization and development of land use and physical spaces in urban and rural areas. It involves analyzing, designing, and implementing policies and strategies to guide the spatial distribution of various activities, such as housing, transportation, industry, commerce, recreation, and infrastructure. Spatial planning can be defined as the coordination of practices and policies affecting spatial organization. Spatial planning is synonymous with the practices of urban planning in the United States but at larger scales and the term is often used in reference to planning efforts in European countries.
The goal of spatial planning is to create sustainable, functional, and aesthetically pleasing environments that meet the social, economic, and environmental needs of a community or region. It takes into consideration factors such as population growth, land availability, natural resources, transportation systems, environmental impact, and social equity. Spatial planning is a public policy process that involves the public and private sectors to organize the distribution of people and activities across a region or municipality.
Spatial planning involves a comprehensive and integrated approach to land use management. It typically includes activities such as:
Analysis and assessment: Gathering and analyzing data on the existing conditions, including population demographics, land use patterns, infrastructure, and environmental resources.
Policy formulation: Developing policies, guidelines, and regulations to guide land use and development activities. This may involve zoning regulations, environmental protection measures, transportation plans, and economic development strategies.
Strategic planning: Creating long-term plans and visions for the future development of an area. This includes setting goals and objectives, identifying priority areas for development or preservation, and determining the spatial distribution of different land uses.
Plan implementation: Carrying out the proposed strategies and policies through various means, such as land acquisition, infrastructure development, building codes, and permitting processes.
Stakeholder engagement: Involving the community, interest groups, and other stakeholders in the planning process to ensure their perspectives and concerns are considered. This can include public consultations, workshops, and collaboration with local organizations.
Monitoring and evaluation: Assessing the effectiveness of implemented plans and policies, tracking changes in land use patterns, and making adjustments as needed.
Spatial planning is typically undertaken by government agencies at different levels, including local, regional, and national authorities. It often involves collaboration with various professionals, including urban planners, architects, environmentalists, economists, and social scientists.
Spatial planning aims to create livable, sustainable, and inclusive communities by carefully managing the physical environment and ensuring that land use decisions align with broader social, economic, and environmental objectives.
References
Albrechts, L. (2004). Strategic (spatial) planning reexamined. Environment and Planning B: Planning and design, 31(5), 743-758.
Faludi, A. (2000). The performance of spatial planning. Planning practice and Research, 15(4), 299-318.
Hurlimann, A. C., & March, A. P. (2012). The role of spatial planning in adapting to climate change. Wiley Interdisciplinary Reviews: Climate Change, 3(5), 477-488.
Larsson, G. (2006). Spatial planning systems in Western Europe: An overview.
Lozano-Perez, T. (1990). Spatial planning: A configuration space approach (pp. 259-271). Springer New York.
Olesen, K. (2014). The neoliberalisation of strategic spatial planning. Planning Theory, 13(3), 288-303.
Sharma, S. N., Dehalwar, K., & Singh, J. (2023). Cellular Automata Model for Smart Urban Growth Management.
Sharma, S. N. (2024). Land-Use Zones in Urban Planning. Track2Training.
Vigar, G. (2009). Towards an integrated spatial planning?. European Planning Studies, 17(11), 1571-1590.
Extension education is a process of educating people, particularly in rural areas, about new technologies, practices, and innovations in various fields such as agriculture, health, nutrition, and community development. The primary goal of extension education is to improve the quality of life of individuals and communities by providing them with relevant knowledge, skills, and attitudes.
Key Objectives of Extension Education
Dissemination of knowledge: Sharing new technologies, practices, and innovations with the community.
Skill development: Enhancing the skills of individuals and communities to improve their productivity and income.
Behavior change: Encouraging positive behavior change among individuals and communities to improve their overall well-being.
Community empowerment: Empowering communities to take charge of their own development and decision-making processes.
Methods of Extension Education
Demonstrations: Showcasing new technologies and practices through demonstrations.
Training programs: Organizing training programs for individuals and communities.
Workshops: Conducting workshops to share knowledge and skills.
Mass media: Using mass media such as radio, television, and newspapers to disseminate information.
Interpersonal communication: Using interpersonal communication to share information and build relationships with the community.
Importance of Extension Education
Improves productivity: Extension education helps individuals and communities to improve their productivity and income.
Enhances knowledge and skills: Extension education enhances the knowledge and skills of individuals and communities.
Promotes behavior change: Extension education promotes positive behavior change among individuals and communities.
Empowers communities: Extension education empowers communities to take charge of their own development and decision-making processes.
Challenges Facing Extension Education
Limited resources: Extension education often faces limited resources, including funding, personnel, and infrastructure.
Reaching remote areas: Extension education often struggles to reach remote and hard-to-reach areas.
Changing behavior: Extension education often faces challenges in changing the behavior of individuals and communities.
Sustainability: Extension education often faces challenges in ensuring sustainability of projects and programs.
Best Practices in Extension Education
Participatory approach: Involving the community in the planning, implementation, and evaluation of extension programs.
Need-based approach: Focusing on the needs and priorities of the community.
Collaboration and partnerships: Collaborating with other organizations and stakeholders to leverage resources and expertise.
Monitoring and evaluation: Regularly monitoring and evaluating extension programs to ensure their effectiveness and impact.
In sociology, a settlement refers to a place where people establish a community. It encompasses the physical, social, and economic structures created by humans to live and thrive together. Settlements reflect human interaction with the environment and have evolved through history, influenced by geography, economy, technology, and culture.
Types of Settlements
Settlements are generally categorized based on size, function, and permanence.
1. Rural Settlements
Definition: Small, sparsely populated areas with primary economic activities like agriculture, fishing, or forestry.
Characteristics:
Population density is low.
Houses are often spread out.
Primary focus on agriculture and allied sectors.
Types:
Clustered or Nucleated Settlements: Houses are close together, often around a central point like a market or temple.
Dispersed Settlements: Individual farmsteads are scattered.
Linear Settlements: Develop along roads, rivers, or other linear features.
2. Urban Settlements
Definition: Larger, densely populated areas where secondary and tertiary activities dominate.
Characteristics:
High population density and infrastructure.
Diverse economic activities (industrial, commercial, services).
Types:
Towns: Smaller urban areas with limited services and industries.
Cities: Larger, more complex centers of commerce and culture.
Metropolises: Extremely large cities with significant regional or national influence.
Megalopolis: A vast urban region formed by the merging of multiple cities.
Classification by Permanence
Temporary Settlements: Structures built for short durations, often by nomadic or pastoralist groups.
Permanent Settlements: Long-lasting, structured communities with established infrastructure.
Functions of Settlements
Settlements can also be classified by the functions they perform:
Residential: Primarily for housing, e.g., suburbs.
Commercial: Focus on trade and commerce, e.g., business districts.
Industrial: Where factories and industries are located.
Administrative: Capitals or regional centers with governance structures.
Cultural or Religious: Settlements formed around temples, churches, or other cultural landmarks.
Educational: Settlements with a concentration of academic institutions.
Factors Influencing Settlement Patterns
The development and pattern of settlements are influenced by various physical and socio-economic factors:
Physical Factors:
Topography: Flat lands favor settlements; mountainous areas have dispersed patterns.
Water Supply: Proximity to rivers, lakes, or coastlines influences settlement location.
Natural Resources: Access to fertile soil, minerals, or forests promotes settlement.
Socio-Economic Factors:
Economic Activities: Industrial or commercial areas attract urban settlements.
Transportation: Regions with developed transport networks have more dense settlements.
Political Stability: Peaceful and secure regions promote larger, more permanent settlements.
Settlement Patterns
Settlement patterns describe how buildings and human activity are distributed in a particular area.
Linear Pattern: Houses or settlements are arranged along a road, river, or valley.
Circular Pattern: Found around a central point like a water body or a place of worship.
Grid Pattern: Planned settlements with streets intersecting at right angles, common in modern cities.
Irregular Pattern: Random, unplanned settlements seen in many rural areas.
Urbanization and Settlement Growth
Urbanization refers to the growth of urban settlements as populations move from rural to urban areas. This process has led to:
Expansion of cities and towns.
Increased demand for housing, infrastructure, and services.
Changes in socio-economic structures and lifestyles.
Modern Settlement Trends
Suburbanization: Movement from central urban areas to suburbs.
Gentrification: Transformation of lower-income urban areas into affluent neighborhoods.
Slums and Informal Settlements: Unplanned, overcrowded areas with poor living conditions, common in rapidly urbanizing cities.
Conclusion
Settlements are fundamental to understanding human interaction with the environment and societal organization. The study of settlements helps sociologists and planners address challenges like urban sprawl, housing shortages, and sustainable development. Settlements evolve continuously, reflecting changes in human needs, technology, and the natural world.
References
Dehalwar, K. Defining Neighbourhood, Clusters, and Society: Analyzing Neighborhood Development Patterns.
Dehalwar, K., & Sharma, S. N. (2024). Social Injustice Inflicted by Spatial Changes in Vernacular Settings: An Analysis of Published Literature.
Dehalwar, K., & Sharma, S. N. (2023). Fate of Slums of Bhopal-A Tale of Struggle and Resilience. Think India Journal, 26(4), 12-18.
Johnson, R. D., & Holbrow, C. H. (Eds.). (1977). Space settlements: A design study (Vol. 413). Scientific and Technical Information Office, National Aeronautics and Space Administration.
Myres, J. N. L. (1989). The English Settlements. Oxford University Press, USA.
Rao, H., & Kenney, M. (2008). New forms as settlements. The SAGE handbook of organizational institutionalism, 352-370.
Seto, K. C., Dhakal, S., Bigio, A., Blanco, H., Carlo Delgado, G., Dewar, D., … & Zwickel, T. (2014). Human settlements, infrastructure, and spatial planning.
Sharma, S. N. The Complex Reality of Delhi’s Slums: A Closer Look at Urban Informality.
Skempton, A. W., & MacDonald, D. H. (1956). The allowable settlements of buildings. Proceedings of the Institution of Civil Engineers, 5(6), 727-768.
The PM Gati Shakti mission, aimed at revolutionizing India’s infrastructure, faces critical challenges. Concerns include lack of transparency, inadequate financial planning, project delays, neglect of social and environmental impacts, and fragmented interagency coordination. Addressing these concerns is crucial for the scheme’s effectiveness and long-term sustainability.
The PM Gati Shakti mission, launched with much fanfare, aims to revolutionize India’s infrastructure landscape by integrating and streamlining various modes of transportation. The scheme’s overarching goal of reducing logistical costs, improving efficiency, and boosting economic growth is undeniably commendable. However, a critical analysis reveals several implementation concerns that cast doubt on the scheme’s effectiveness and long-term sustainability.
PM Gati Shakti is a recent initiative launched by the Indian government to boost the country’s infrastructure development and ensure faster and more efficient movement of goods and people. The genesis of this initiative can be traced back to the announcement made by Prime Minister Narendra Modi in his Independence Day speech on August 15, 2021.
In his speech, the Prime Minister highlighted the need for a comprehensive and integrated approach to infrastructure development that would enable the country to meet the demands of a rapidly growing economy. He emphasized the importance of creating a strong and modern infrastructure network that would connect the country’s far-flung regions and help in the efficient movement of goods and people.
To achieve this vision, the government launched the PM Gati Shakti initiative, which aims to integrate the country’s various modes of transportation, including roads, railways, waterways, and airways, into a unified and seamless network. The initiative also seeks to leverage the power of technology to create a digital infrastructure backbone that would enable better monitoring and management of the country’s infrastructure assets.
Under this initiative, the government is also working to create a National Master Plan (NMP) that would serve as a blueprint for infrastructure development in the country. The NMP would bring together various ministries and departments involved in infrastructure development and enable them to work in a coordinated and integrated manner.
In line with the Prime Minister’s vision of expanding the NMP platform for socio-economic development, Social Sector Ministries are being onboarded through a series of meetings. A recent meeting was held to review the adoption of PM Gati Shakti NMP by Social Sector Ministries/Departments, and it was emphasized that there is immeasurable potential for the adoption and augmentation of NMP in social sector planning. 14 Social Sector Ministries/Departments have been onboarded, and their individual portals have been integrated at the backend with the NMP. 61 data layers of Social Sector Ministries related to infrastructure assets have been mapped on NMP, and there is a focus on developing SOPs for data management. The meeting saw participation from all 14 Ministries/Departments, and some ministries showcased their use cases for the adoption of NMP. The Ministry of Women and Child Development has developed a mobile application for data collection regarding Anganwadi Centres, which has resulted in real-time data enrichment on the platform for infrastructure planning. The Department of School Education and Literacy is using the NMP platform to identify suitable sites for opening new schools. Other social sector Ministries are also in the process of identifying assets essential for social sector planning to be uploaded on NMP. Individual portals for 22 infrastructure and user economic ministries and all 36 States/UTs have been created and integrated with the NMP at the backend, with 1460 data layers currently integrated into NMP.
The genesis of PM Gati Shakti in India can be traced back to the Prime Minister’s vision of creating a modern and efficient infrastructure network that would serve as the backbone of the country’s economic growth. Through this initiative, the government aims to bring about a comprehensive and integrated approach to infrastructure development and create a National Master Plan that would serve as a blueprint for the country’s infrastructure development for years to come.
Lack of Clarity and Transparency:
One of the major issues with the PM Gati Shakti mission is the lack of clarity and transparency in its execution. Despite its ambitious objectives, there is a dearth of detailed information regarding the scheme’s operational framework, funding allocation, and implementation timeline. This opacity raises questions about the government’s commitment to transparency and accountability, leaving room for potential mismanagement and corruption.
Inadequate Financial Planning:
While the mission aims to bring about transformative changes, there are serious concerns about its financial viability and sustainability. The PM Gati Shakti Scheme demands substantial financial resources for the development and integration of multiple transport modes. However, the government’s allocation of funds and revenue-generation plans remain vague. Without a comprehensive and transparent financial plan, the scheme may struggle to attract investment and realize its ambitious goals.
Infrastructure Bottlenecks and Project Delays:
India’s infrastructure sector has long been plagued by bottlenecks and project delays. Unfortunately, the PM Gati Shakti Scheme does not appear to adequately address these concerns. The lack of a robust mechanism to tackle bureaucratic red tape, land acquisition challenges, and environmental clearances is a significant hurdle to the timely completion of infrastructure projects. Without addressing these issues, the scheme risks becoming yet another ambitious plan trapped in bureaucratic gridlock.
Neglecting Social and Environmental Impacts:
While the PM Gati Shakti mission emphasizes economic growth and infrastructure development, it seems to overlook the potential social and environmental impacts. The scheme’s focus on rapid expansion and integration may lead to the displacement of communities, destruction of ecosystems, and exacerbation of pollution and climate change. A comprehensive environmental and social impact assessment framework, along with community engagement, should be integral components of the scheme to ensure sustainable and inclusive development.
Fragmented Approach and Interagency Coordination:
Given the complexity and interdependence of India’s transportation systems, the PM Gati Shakti mission’s fragmented approach raises concerns about effective interagency coordination. The lack of a centralized authority responsible for integrating various modes of transport, coupled with the absence of a clear governance structure, may lead to conflicts, inefficiencies, and duplication of efforts. Without robust coordination mechanisms, the scheme’s potential benefits may remain unrealized.
Conclusion:
While the PM Gati Shakti Mission having the vision of transforming India’s transportation infrastructure is undoubtedly laudable, a critical review reveals several pressing concerns. The lack of transparency, inadequate financial planning, infrastructure bottlenecks, neglect of social and environmental impacts, and fragmented approach raise doubts about the scheme’s effectiveness and long-term sustainability. Addressing these issues is crucial for the successful implementation of the scheme and ensuring that it delivers the promised benefits to the nation and its citizens.
The Yamuna Basin, particularly in Delhi, has been plagued by recurring floods caused by heavy rains. These floods have had devastating consequences on both human lives and the environment. To mitigate the impact of such natural disasters and safeguard the well-being of the populace, immediate and proactive measures must be taken to prevent future floods.
Critical Analysis:
Inadequate Infrastructure:
One of the primary causes of flooding in the Yamuna Basin is the inadequate infrastructure in Delhi. The city’s drainage system is ill-equipped to handle heavy rainfall, resulting in the water overflowing into residential areas. Insufficient stormwater drains and poorly maintained canals exacerbate the situation, leading to widespread inundation. The lack of investment and timely upgrades in infrastructure is a critical issue that must be addressed.
Encroachment and Enclosed River Channels:
Over the years, encroachments and unauthorized construction have obstructed the natural flow of the Yamuna River. Many of the river channels have been encased and converted into concrete structures, leaving no room for the river to expand during heavy rains. This not only disrupts the river’s ecological balance but also contributes to flood-related hazards. Strict enforcement of regulations to prevent encroachments and the revival of natural river channels are essential steps towards flood prevention.
Climate Change Impact:
The impact of climate change cannot be ignored when considering the causes of flooding in the Yamuna Basin. Increasingly unpredictable weather patterns and intense rainfall events have become more frequent due to climate change. Therefore, any long-term solution must acknowledge and account for the effects of climate change on the region’s hydrology. This necessitates the development and implementation of climate-resilient infrastructure and urban planning strategies.
Preventive Measures:
Improved Infrastructure:
Investments must be made to enhance the drainage system and build larger and efficient stormwater drains. These should be designed to accommodate heavy rainfall, reducing the risk of flooding in residential areas. Regular maintenance and periodic upgrades of existing infrastructure should also be prioritized.
River Channel Restoration:
Efforts should be directed towards restoring the natural flow of the Yamuna River by removing encroachments and revitalizing river channels. This can help create additional space for floodwaters to dissipate and reduce the pressure on residential areas during heavy rains. Adequate buffer zones should be maintained along the riverbanks to allow for natural expansion during flood events.
Climate-Resilient Urban Planning:
Long-term solutions should focus on incorporating climate-resilient urban planning strategies. This may include building sustainable and green infrastructure, promoting water harvesting and retention systems, and encouraging the use of permeable surfaces to facilitate groundwater recharge. Integrating climate change projections into urban planning frameworks can aid in creating flood-resistant cities.
Public Awareness and Emergency Preparedness:
Public awareness campaigns about flood risks and preparedness measures should be initiated to educate residents about safety protocols and evacuation procedures. Establishing early warning systems and emergency response mechanisms can significantly reduce the impact of floods and save lives.
Conclusion:
The recurring floods in the Yamuna Basin of Delhi demand immediate attention and action. Addressing the issues of inadequate infrastructure, encroachments, and climate change impact are crucial steps in flood prevention. By investing in improved infrastructure, restoring natural river channels, incorporating climate-resilient urban planning, and promoting public awareness, we can pave the way for a more resilient future, safeguarding lives and property from the devastating effects of flooding.
References
Kumar, M., Sharif, M., & Ahmed, S. (2019). Flood risk management strategies for national capital territory of Delhi, India. ISH Journal of Hydraulic Engineering, 25(3), 248-259.
Mazumder, S. K., Dhillon, M. S., & Kanwal, A. (2018). River Action Plan, Flood Management & Basin Development. Lead paper in a Souvenir “River Action Plan, Flood Management & Basin Development” published by Consulting Engineers Association of India, 27-28.
Patel, R. S., Taneja, S., Singh, J., & Sharma, S. N. (2024). Modelling of Surface Runoff using SWMM and GIS for Efficient Storm Water Management. CURRENT SCIENCE, 126(4), 463.
Sharma, M., Rawat, S., Kumar, D., Awasthi, A., Sarkar, A., Sidola, A., … & Kotecha, K. (2024). The state of the Yamuna River: a detailed review of water quality assessment across the entire course in India. Applied Water Science, 14(8), 175.
Tomar, P., Singh, S. K., Kanga, S., Meraj, G., Kranjčić, N., Đurin, B., & Pattanaik, A. (2021). GIS-based urban flood risk assessment and management—a case study of Delhi National Capital Territory (NCT), India. Sustainability, 13(22), 12850.
With reference to podcast on ‘Understanding Urban Digitalisation Projects in India: Platformisation, Infrastructuring, and Datafication’
Urban databases play a crucial role in shaping economic decision-making in urban environments. They serve as valuable repositories of information related to demographics, infrastructure, and various socio-economic factors. The availability and effective use of urban data can significantly enhance the understanding of urban dynamics, enabling policymakers and businesses to make more informed decisions. The discourse surrounding the use of urban databases for enhancing economic decision-making is a topic of increasing significance in the realm of urban planning and governance. This critical review aims to analyze the strengths and limitations of the concept, drawing upon the broader implications and challenges discussed in relevant literature.
One of the key strengths emphasized in the discourse is the potential for urban databases to provide a comprehensive understanding of the intricate dynamics within urban environments. By amalgamating data on demographics, infrastructure, and socio-economic factors, these databases promise to offer policymakers and businesses invaluable insights for more informed decision-making processes. This multifaceted approach is particularly laudable, given the complexity of urban ecosystems. However, a critical lens reveals certain limitations in the implementation and utilization of urban databases. One notable concern is the inherent challenge of data accuracy and reliability. The quality of decisions made based on urban databases is contingent on the accuracy of the data input. Inaccuracies, biases, or outdated information may lead to flawed analyses and misguided decisions. Additionally, issues of data privacy and security loom large, raising questions about the ethical considerations in the collection and storage of sensitive urban information.
Furthermore, the article under scrutiny may touch upon the potential pitfalls of over-reliance on quantitative data at the expense of qualitative insights. While databases provide a wealth of statistical information, they may fall short in capturing the nuanced, context-specific intricacies of certain urban phenomena. A comprehensive understanding of an urban environment requires a balanced integration of both quantitative and qualitative data. The review should also consider the contextual relevance of urban databases. The effectiveness of these databases may vary across different urban settings, influenced by factors such as governance structures, technological infrastructure, and socio-cultural contexts. The universal applicability of urban databases for economic decision-making should be critically evaluated, and efforts should be made to tailor these tools to specific urban landscapes.
In conclusion, while the concept of utilizing urban databases for better economic decision-making is promising, a critical review reveals a nuanced landscape of opportunities and challenges. The strength lies in the potential for comprehensive insights, but caution is warranted regarding issues of data accuracy, privacy, and contextual relevance. As the discourse continues to evolve, addressing these concerns will be paramount to harnessing the full potential of urban databases for effective economic decision-making in urban contexts.
References
Parkar, K., Zérah, M.-H., & Mittal, G. (2023). Understanding Urban Digitalisation Projects in India: Platformisation, Infrastructuring, and Datafication. Economic and Political Weekly, 58(14), 53–60.
Urban landscapes are constantly changing due to various factors such as human interventions, natural forces, and community actions. These transformations are aimed at meeting the needs of the people using the urban spaces, taking into account their social, psychological, political, cultural, financial, physical, and other needs. Urban planning research methods and tools have also been evolving, and this paper discusses the contemporary methods, tools, and technologies used in urban planning research. The article applies current trends and examples to illustrate the employment of these methods in designing, developing, and operating urban spaces. This paper aims to be a valuable introductory reference for emerging researchers in urban planning, particularly for undergraduate and postgraduate students with limited exposure to urban planning research. However, established researchers in the discipline can also find this article useful. The authors conclude that future research should not disregard established research techniques in addressing urban vulnerabilities.
Keywords
Research Methods, Urban Planning, Research Tools, Urban Governance, Sustainability
Introduction
Urban planning, like other disciplines, heavily relies on research to progress and adapt. Failure to do so can cause the discipline to become obsolete in today’s rapidly changing world. The Frascati Manual defines research and experimental development as creative work done systematically to increase knowledge of humans, culture, and society, and to develop new applications based on that knowledge. Universal research methods applicable to both physical and social sciences are identified by Gulbrandsen and Kyvik (2010), and this paper adopts three key research methods in urban planning: basic research, applied research, and experimental development.
In addition to these methods, Parnell and Piertese (2015) identify other modes of generating new knowledge in urban planning, including pure research, embedded research, city labs, professional networks, cityscapes, and exhibitions. This paper focuses on discussing the first three modes in detail, along with relevant examples of embedded techniques, and provides an overview of the other modes that readers can explore further. The following section on research technologies and tools will explain some of the latter modes identified by Parnell and Piertese (2015).
Findings and Discussion
Basic research, also known as pure or fundamental research, is focused on exploring and explaining the fundamental principles behind the functioning of the world. The OECD (2002) defines basic research as experimental or theoretical work undertaken purely to acquire new knowledge of observable phenomena and the underlying facts behind them. The aim of this research is to satisfy the curiosity of the researcher and to increase the existing base of scientific knowledge by presenting theoretical perspectives or alternatives to explain certain phenomena or behaviors in society. Pure research in urban planning involves examining existing theories, redesigning them or proposing new ones to offer better explanations for phenomena, such as the current drive to have green urban infrastructure to combat global warming or studies to develop theories on smart cities (Palys, 2018).
Pure research is not problem-solving, but it seeks to justify the status of a phenomenon, even if its applications may or may not have any use in the immediate or long-term future. Pure research in urban planning seeks to enhance an understanding of past legacies through an analysis of diverse aspects of urban complexity, such as culture, social identities, resource flows, labor regimes, regulations, urban politics, welfare regimes, and the design of a city. Pure research is often undertaken by universities and other higher-caliber research centers, but private commercial entities also engage in it resulting in theoretical researchers being drawn from there (Palys, 2018).
Pure research is primarily aimed at expanding the theoretical basis of a phenomenon, feeding researchers’ curiosities, and resulting in new ways of doing things (innovations) that then feed into investments and remodeling of the way things are done. Through pure research, old theories, standards or formulae can be tested, and those found to be incomprehensive or nonsensical are discarded. Pure research can be exploratory, descriptive or causal in nature, and it largely involves observation, polls/surveys, interviews, and focus group discussions as its primary means of investigation (Palys, 2018; Parnell & Pieterse, 2015).
In contrast to pure research, applied research aims to provide immediate solutions to existing problems and is based on pre-existing theories and assumptions from pure research. It uses its findings to address real-world issues, aids in decision-making, and enables policy and programme development. Applied research encompasses a range of methods, from large scale surveys to complex lab experiments, and is problem-solving in nature. It focuses on felt needs and non-hypothetical problems based on factual evidence to suggest meaningful solutions and testable hypotheses. Three types of applied research within social sciences include descriptive, experimental, and mixed-method studies. The applied research process involves defining the research problem, planning the study, executing data collection and analysis or experimentation, and reporting on findings with follow-up. Descriptive studies aim to paint a picture of a phenomenon, while correlational studies report negative, positive, or zero correlation between variables. Cross-sectional studies collect data from many different individuals, groups, or locations at the same time to observe variations or consistency in variables.
Klosterman (2015) describes experimental development in urban planning as the process of designing and redesigning land use maps over multiple decades, which are essential for determining land use regulations. On the other hand, Gulbrandsen & Kyvik (2010) define experimental development as a research methodology that aims to fill technical knowledge gaps to improve existing technologies or create new ones to address societal issues. Experimental development often leads to tangible products, such as software, hardware, or techniques that increase efficiency and effectiveness in service delivery. The goal of experimental development is to create prototypes that will lead to actual development. The OECD distinguishes between basic, applied research, and experimental development, which can transition from one to the next in a specific order. The primary aim of experimental development is to make technical improvements on products or processes, such as developing image processing technologies used in urban policing or alternative modes of transport and communication, among others.
here is a comparative table that summarizes the relationship between basic research, applied research, and experimental development:
Category
Goal
Output
Examples
Basic Research
Expand scientific knowledge and understanding
Theoretical frameworks, concepts, and principles
Research on subatomic particles, DNA structure
Applied Research
Solve practical problems by applying scientific ideas
Solutions to specific problems or issues
Developing a vaccine for a disease, improving a product
Experimental Development
Make technical improvements to products or processes
Developing image processing technologies for urban policing, alternative modes of transportation, innovative architectural designs
Note that there is some overlap between the categories and there may not always be a clear distinction between them. Additionally, the output of each category can inform and influence the others, leading to a cycle of innovation and discovery.
Parnell & Pieterse (2015) identified embedded research as a significant mode of undertaking urban planning studies, which involves close partnership between researchers and practitioners to co-produce outputs for society’s gains. This collaboration between academia and development organizations allows for the alignment of field practices with theory to address challenges in the use of developed technologies and practice models. Embedded research is a bridge that allows mutual collaboration and benefits between academia and industry practitioners. McGinity & Solakangas (2014) report that embedded research borrows from embedded journalism, which involves US media reporters being within the war environment and updating their audiences. While there are contradicting opinions on research methodologies, Palys (2018) insists that these categorizations of studies as either pure, applied, or experimental are strictly based on the motivation that compels a researcher to undertake a study at the beginning, whereas Gulbrandsen & Kyvik (2010) argue that there is very little difference between basic research, applied research, and experimental design. However, it is important to note that applied research and experimental development work does not necessarily have to take place in university labs. Many innovations driving the urban growth and development agenda today did not originate from urban planners, such as online shopping, which has been very vital in helping the world’s cities and their residents cope with the COVID-19 pandemic. The rise of online taxi services and shared rides also reduces the number of cars on the roads across cities, contributing to fighting transport-related greenhouse gas emissions and global warming. Although widely held perceptions exist that basic research no longer takes place in universities, many theories are still emerging in various disciplines, including urban and regional planning.
Conclusions
The authors argue that standardized urban research methodologies are inadequate for planning the development of cities. They suggest that the unique qualities of each city should be documented and incorporated into future planning. The authors note that research on urban planning is often constrained by a lack of funding and researchers willing to undertake field surveys. The authors also highlight the importance of community-based enumeration and participatory urban planning in ensuring that the needs of urban residents and decision-makers are met. However, the rapid pace of change in urban planning has created a gap in research, leaving many citizens unable to cope with the technological advancements being made. The authors call for the deliberate retention and incorporation of human-led studies on the urban environment, alongside the use of AI to solve urban problems.
References
Andrew, C. O., & Hildebrand, P. E. (1983). Planning and Conducting Applied Agricu tural Research. Canadian Journal of Agricultural Economics, 31, 275-277.
Baimyrzaeva, M. (2018). Beginners’ Guide for Applied Research Process: What Is It, and Why and How to Do It? University of Central Asia, 10-26.
Bentley, J. P., Gulbrandsen, M., & Kyvik, S. (2015). The Relationship between Basic and Applied Research in Universities. Higher Education, 70, 689-709 (21 pages). https://doi.org/10.1007/s10734-015-9861-2
Bunnell, T., & Maringanti, A. (2010). Practising Urban and Regional Research beyond Metro- centricity. International Journal of Urban and Regional Research, 34, 415-420. https://doi.org/10.1111/j.1468-2427.2010.00988.x
Cheetham, M., Wiseman, A., Khazaeli, B., Gibson, E. et al (2018). Embedded Research: A Promising Way to Create Evidence-Informed Impact in Public Health. Journal of Pub- lic Health, 40, i64-i70. https://doi.org/10.1093/pubmed/fdx125
Dehalwar, K., & Sharma, S. N. (2023). Fundamentals of Research Writing and Uses of Research Methodologies. Edupedia Publications Pvt Ltd.
Dehalwar, K., & Sharma, S. N. (2024). Exploring the Distinctions between Quantitative and Qualitative Research Methods. Think India Journal, 27(1), 7-15.
Gulbrandsen, M., & Kyvik, S. (2010). Are The Concepts Basic Research, Applied Research and Experimental Development Still Useful? An Empirical Investigation among Nor- wegian Academics. Science and Public Policy, 37, 343-353. https://doi.org/10.3152/030234210X501171
Harding, A., & Nevin, B. (2015). Cities and Public Policy: A Review Paper. Government Office for Science, Foresight.
Jain, Sarika, Kavita Dehalwar, and Shashikant Nishant Sharma. “Explanation of Delphi research method and expert opinion surveys.” Think India 27, no. 4 (2024): 37-48.
Klosterman, R. E. (2015). Urban Planning: Methods and Technologies. In J. D. Wright (Edi- tor-in-Chief) (Ed.), International Encyclopedia of the Social & Behavioral Sciences (2nd ed., Vol. 24, pp. 889-893). Elsevier.
McGinity, R., & Solakangas, M. (2014). Introduction: “Embedded Research” as an Approach into Academia for Emerging Researchers. Management in Education, 28, 3-5. https://doi.org/10.1177/0892020613508863
Ming, T. E. (2021). The Big Read: Feeling Lost in a Digital World, Some Elderly Shun Tech- nology. Today Online Newspaper.
OECD (Organization for Economic Co-Operation and Development) (2002). Proposed Standard Practice for Surveys on Research and Experimental Development (p. 77). Or- ganization for Economic Co-Operation and Development.
Owusu-Ansah, C., Rodrigues, A., & Walt, T. V.D. (2019). Integrating Digital Libraries into Distance Education: A Review of Models, Roles, and Strategies. The Turkish Online Journal of Distance Education, 20, 89-104. https://doi.org/10.17718/tojde.557742
Palys, T., & Atchison, C. (2021). Research Methods in the Social and Health Sciences.
Sage Publishing.
Parnell, S., & Pieterse, E. (2015). Translational Global Praxis: Rethinking Methods and Modes of African Urban Research. International Journal of Urban and Regional Research, 40, 236-246. https://doi.org/10.1111/1468-2427.12278
The debate over whether to refer to oneself as a “Planner” or a “Big Data Scientist” touches on the evolving nature of roles in data management, analytics, and decision-making. Each title implies a different focus, skill set, and approach to handling data and planning activities. To critically discuss this, let’s consider the distinctions and overlaps between the two roles.
1. Definitions and Roles
Planner: Traditionally, a planner is someone who devises strategies, coordinates activities, and allocates resources to achieve specific goals. This role is often seen in urban planning, business strategy, project management, and logistics. Planners focus on creating structured approaches to meet objectives, often relying on historical data, projections, and various planning tools.
Big Data Scientist: A Big Data Scientist, on the other hand, is someone specialized in handling, analyzing, and deriving insights from large volumes of complex data. This role involves using statistical methods, machine learning, and data mining to extract patterns, trends, and actionable insights from data. Big Data Scientists work extensively with structured and unstructured data, often using advanced computational techniques and software.
2. Skill Sets
Planners typically possess skills in project management, strategic thinking, resource allocation, and risk management. They may use data, but their focus is on the practical application of this data to achieve specific goals. Tools used by planners may include project management software, GIS (for urban planners), and various planning frameworks.
Big Data Scientists require strong analytical skills, proficiency in programming languages like Python or R, expertise in data analysis tools, and a deep understanding of statistical methods and machine learning algorithms. They must be able to work with large datasets, perform complex data manipulations, and create predictive models.
3. Approach to Data
Planners use data to support their planning processes but may not engage deeply with the data itself. Their focus is more on how to use available information to make strategic decisions. Data is one of many inputs into a broader decision-making process.
Big Data Scientists focus on the data itself. Their primary role is to uncover insights from data, which can then inform planning and decision-making processes. They are more concerned with the data’s quality, structure, and the methods used to analyze it.
4. Evolving Roles and Convergence
The line between planners and big data scientists is increasingly blurred. Modern planning often requires data-driven insights, and thus planners may need skills in data analysis. Conversely, Big Data Scientists might be involved in strategic planning based on the insights they generate. This convergence is seen in fields like smart city planning, where urban planners use big data analytics to understand traffic patterns, energy usage, and other urban dynamics.
5. Context and Industry Differences
In business contexts, a planner might focus on market strategies, supply chain logistics, or operational efficiency. A Big Data Scientist in the same company might analyze customer data, optimize product recommendations, or predict market trends. While both roles contribute to the company’s success, they do so in different ways.
In public policy or urban planning, a traditional planner might focus on land use, zoning, and community development. A Big Data Scientist could analyze social media data, census information, or transportation data to provide insights that shape these planning decisions.
6. Implications for Identity and Title
Choosing to call oneself a “Planner” or a “Big Data Scientist” reflects not only the skills one possesses but also the role one plays in the organization.
A Planner might emphasize their strategic, big-picture thinking, and their ability to integrate various inputs into a coherent plan. They may see their role as guiding an organization or community toward specific goals.
A Big Data Scientist might emphasize their technical skills, their ability to manage and analyze large datasets, and their role in uncovering hidden insights. They may see their role as providing the data-driven evidence needed to make informed decisions.
Conclusion
The choice between calling oneself a “Planner” or a “Big Data Scientist” ultimately depends on one’s primary focus and approach to their work. While there is overlap, the distinction lies in whether the individual is more focused on the strategic application of insights (Planner) or on the technical generation of those insights from data (Big Data Scientist). As roles continue to evolve with the integration of data science into various fields, professionals might increasingly identify with both roles, or new titles might emerge to capture this convergence.
References
Batty, M. (2013). Big data, smart cities and city planning. Dialogues in human geography, 3(3), 274-279.
Hazen, B. T., Boone, C. A., Ezell, J. D., & Jones-Farmer, L. A. (2014). Data quality for data science, predictive analytics, and big data in supply chain management: An introduction to the problem and suggestions for research and applications. International Journal of Production Economics, 154, 72-80.
Kayabay, K., Kılınç, A., Gökalp, M. O., Gökalp, E., & Daim, T. U. (2024). Technology Roadmapping: Data Science Roadmapping of Networked Organizations’ Strategic Planning for Artificial Intelligence. Future‐Oriented Technology Assessment: A Manager’s Guide with Case Applications, 273-300.
Sharma, S. N., Singh, D., & Dehalwar, K. Surrogate Safety Analysis-Leveraging Advanced Technologies for Safer Roads.
Shen, Z., & Li, M. (Eds.). (2017). Big Data Support of Urban Planning and Management: The Experience in China. Springer.
Steif, K. (2021). Public policy analytics: code and context for data science in government. CRC Press.
Van Der Aalst, W., & van der Aalst, W. (2016). Data science in action (pp. 3-23). Springer Berlin Heidelberg.
Climate change is one of the most pressing challenges facing humanity. It encompasses a wide range of issues, including rising temperatures, shifting weather patterns, melting glaciers, and increasing natural disasters. While its effects are global, they are not equally distributed, disproportionately affecting marginalized communities, particularly women in developing regions. Feminist environmentalism offers a critical lens to understand and address these inequities, integrating gender justice into the broader framework of environmental sustainability.
The Interplay Between Climate Change and Gender
The impacts of climate change are intricately tied to existing social and economic inequalities. Women, especially those in rural and marginalized communities, often rely on natural resources for their livelihoods, making them more vulnerable to environmental changes. For instance:
Agricultural Dependency: Women constitute a significant proportion of the agricultural workforce in many developing countries. Erratic rainfall and prolonged droughts threaten crop yields, directly impacting their income and food security.
Water Scarcity: Women are frequently responsible for water collection in many societies. Climate-induced water shortages force them to travel longer distances, exposing them to physical strain and potential violence.
Displacement: Climate disasters often lead to displacement, and women in refugee settings face unique challenges, including inadequate healthcare, limited access to education, and heightened risk of gender-based violence.
These examples underline how climate change is not just an environmental issue but also a social one, with profound implications for gender equality.
Feminist Environmentalism: A Transformative Approach
Feminist environmentalism bridges the gap between environmental and gender justice, emphasizing that sustainable solutions must address the structural inequalities that perpetuate both environmental degradation and gender oppression. This approach is rooted in several key principles:
Intersectionality: Feminist environmentalism recognizes the interconnectedness of various forms of oppression, such as race, class, and gender. For example, Indigenous women are often at the forefront of climate activism because their communities bear the brunt of resource exploitation and ecological destruction.
Empowerment and Agency: Women must be seen not merely as victims of climate change but as agents of change. Programs that empower women to participate in environmental decision-making lead to more equitable and effective solutions. For instance, studies show that women’s involvement in forest management improves conservation outcomes.
Care Ethics: Feminist perspectives highlight the value of care ethics in addressing environmental crises. This approach prioritizes nurturing relationships between humans and nature, moving away from extractive models of development.
Contributions of Women to Climate Action
Women have been pivotal in leading grassroots movements and advocating for climate justice:
Wangari Maathai: The Kenyan environmentalist and Nobel laureate founded the Green Belt Movement, which empowered women to plant trees, combat deforestation, and advocate for sustainable development.
Greta Thunberg: The young Swedish activist has galvanized global attention to the climate crisis, inspiring millions to demand urgent action from policymakers.
Indigenous Women Leaders: Across the globe, Indigenous women are defending their lands and advocating for the preservation of biodiversity, often at great personal risk.
These examples demonstrate the critical role women play in shaping a sustainable future.
Policy Recommendations for Integrating Feminist Environmentalism
To create a just and sustainable world, policymakers must incorporate feminist perspectives into climate strategies. Key recommendations include:
Gender-Inclusive Climate Policies: Policies should address the unique vulnerabilities of women and ensure their participation in decision-making processes. For example, allocating resources for women’s education and training in sustainable practices can build resilience in vulnerable communities.
Support for Women-Led Initiatives: Governments and international organizations should provide funding and technical support to women-led environmental projects. This not only fosters innovation but also ensures that solutions are tailored to local contexts.
Legal Protections: Strengthening legal frameworks to protect women environmental defenders from violence and harassment is crucial for sustaining their advocacy efforts.
Intersectional Data Collection: Collecting and analyzing gender-disaggregated data on climate impacts can help identify specific challenges and tailor interventions accordingly.
Conclusion
Climate change is not a gender-neutral phenomenon. Addressing it requires a nuanced understanding of the intersection between environmental degradation and social inequalities. Feminist environmentalism provides a powerful framework to tackle these challenges holistically, advocating for a world that values both ecological sustainability and gender justice. By empowering women and embracing inclusive policies, we can forge a path toward a more equitable and resilient future.
References
Amadi, L. A., Ogbanga, M. M., & Agena, J. E. (2015). Climate change and feminist environmentalism in the Niger Delta, Nigeria. African Journal of Political Science and International Relations, 9(9), 361-371.
Amadi, L., Wordu, S., & Ogbanga, M. (2015). Sustainable Development in Crisis? A Post Development Perspective. Journal of Sustainable Development in Africa, 17(1), 140-163.
Brick, P., & Cawley, R. M. (2008). Producing political climate change: the hidden life of US environmentalism. Environmental Politics, 17(2), 200-218.
Gilley, B. (2012). Authoritarian environmentalism and China’s response to climate change. Environmental politics, 21(2), 287-307.
Ogbanga, M. M. (2024). Oil, Gender and Unemployment: Social Issues in the Niger. Eduindex.
Pulver, S. (2007). Making sense of corporate environmentalism: An environmental contestation approach to analyzing the causes and consequences of the climate change policy split in the oil industry. Organization & environment, 20(1), 44-83.
Wright, C., & Nyberg, D. (2012). Working with passion: Emotionology, corporate environmentalism and climate change. Human Relations, 65(12), 1561-1587.
Stata is a powerful and user-friendly statistical software package widely used in academia, research, and professional fields for data analysis, data management, and graphics. It is especially popular among social scientists, economists, epidemiologists, and biostatisticians due to its comprehensive features and ease of use.
—
Key Features
1. Data Management
Stata offers a wide range of data management tools to efficiently handle datasets:
Import/export data from various formats like Excel, CSV, SPSS, SAS, and more.
Merge, append, reshape, and sort datasets.
Generate new variables, recode existing ones, and label data for clarity.
Handle missing data effectively with built-in commands.
2. Statistical Analysis
Stata supports a broad range of statistical analyses, including:
Descriptive Statistics: Mean, median, standard deviation, frequencies, and cross-tabulations.
2. Health Sciences: Analyzing clinical trials, epidemiological studies, and survival rates.
3. Social Sciences: Public policy evaluation, survey analysis, and social behavior research.
4. Business and Marketing: Predictive modeling, market segmentation, and financial analytics.
—
Pros and Cons
Pros
Comprehensive suite of features.
Intuitive syntax and user-friendly interface.
Highly active user community and robust documentation.
Suitable for both beginners and advanced users.
Cons
Steep learning curve for non-technical users.
Can be expensive compared to alternatives like R or Python.
Limited in advanced machine learning functionalities compared to specialized tools.
—
Getting Started with Stata
1. Installing Stata:
Visit Stata’s official website to purchase and download.
Install based on your operating system (Windows, Mac, or Linux).
2. Basic Commands:
Load a dataset:
use filename.dta
Summarize data:
summarize varname
Create a new variable:
generate newvar = expression
Run a regression:
regress y x1 x2
3. Learning Resources:
Stata’s inbuilt help system (help command).
Online tutorials, courses, and webinars.
Books and user guides provided by StataCorp.
—
Stata Editions
Stata offers various editions tailored to user needs:
1. Stata/MP: Multi-core processing for large datasets.
2. Stata/SE: Standard edition for moderately large datasets.
3. Stata/IC: Basic edition for smaller datasets.
4. Small Stata: Entry-level edition for educational purposes.
—
Stata remains a robust choice for data analysis due to its versatility and reliability, offering tools for handling complex data challenges across various fields.
PhD Students – How can you help your supervisors to give you the best supervision for your PhD?
In a PhD program, supervisor-supervisee relationship is very important.
Here are 10 things you can do on your part to get the best out of your PhD supervisors.
𝟏. 𝐒𝐡𝐨𝐰, 𝐝𝐨𝐧’𝐭 𝐭𝐞𝐥𝐥: Instead of telling your supervisor what you have worked on, show him/her the progress. For example, instead of saying that I have read 5 papers, you should say here are the critical summaries and 5 takeaways from these 5 papers that I think are useful for my research in these ways.
𝟐. 𝐓𝐚𝐤𝐞 𝐟𝐞𝐞𝐝𝐛𝐚𝐜𝐤 𝐩𝐨𝐬𝐢𝐭𝐢𝐯𝐞𝐥𝐲: If your supervisor criticizes you, actually he/she is not criticizing you but your work. This criticism is only for the purpose of improving your research and helping you to succeed.
𝟑. 𝐒𝐡𝐚𝐫𝐞 𝐦𝐞𝐞𝐭𝐢𝐧𝐠 𝐚𝐠𝐞𝐧𝐝𝐚 𝐚𝐧𝐝 𝐦𝐢𝐧𝐮𝐭𝐞𝐬: Send upfront the points about which you want to talk about in the meeting. Similarly, share what has been discussed in the meeting. It will only take around 10 minutes of your time.
𝟒. 𝐀𝐬𝐤, 𝐝𝐨𝐧’𝐭 𝐚𝐬𝐬𝐮𝐦𝐞: Do not assume outcomes from your supervisors. Instead, ask in a polite way. For example, do not assume that your supervisors will not allow you to apply for a research internship. Ask them.
𝟓. 𝐎𝐰𝐧 𝐲𝐨𝐮𝐫 𝐏𝐡𝐃: Your PhD is your project. After around 6 months, you are likely more expert on the topic than your supervisors. They are there to guide you through the process.
𝟔. 𝐑𝐞𝐦𝐢𝐧𝐝 𝐭𝐡𝐞𝐦: Supervisors have many things on their plates. It’s possible that their minds skip something. Give them a soft reminder if they need to get back to you on something such as feedback on a paper.
𝟕. 𝐒𝐞𝐞𝐤 𝐭𝐢𝐦𝐞𝐥𝐲 𝐟𝐞𝐞𝐝𝐛𝐚𝐜𝐤: Sending a paper draft to a supervisor one day before a submission deadline is a mistake on your end. Even if he/she provides the feedback, it might be shallow. Give them time.
𝟖. 𝐂𝐨𝐦𝐦𝐮𝐧𝐢𝐜𝐚𝐭𝐞 𝐜𝐥𝐞𝐚𝐫𝐥𝐲: Communicate clearly to your supervisors about any obstacles you are facing and any expectations you have. They have the experience to guide you accordingly but first, they need to know.
𝟗. 𝐃𝐨𝐧’𝐭 𝐫𝐞𝐩𝐞𝐚𝐭 𝐭𝐡𝐞 𝐬𝐚𝐦𝐞 𝐦𝐢𝐬𝐭𝐚𝐤𝐞𝐬: If your supervisors have corrected you about something, try not to repeat it. It will give them the impression that you did not value their feedback. If you don’t agree, discuss it with them.
𝟏𝟎. 𝐑𝐞𝐬𝐩𝐞𝐜𝐭, 𝐫𝐞𝐬𝐩𝐞𝐜𝐭, 𝐚𝐧𝐝 𝐫𝐞𝐬𝐩𝐞𝐜𝐭: Doesn’t matter how good or bad your relationship is with your supervisor, always respect them. I have hardly seen anyone successful who does not respect his/her teachers and supervisors.
The Dr. A.P.J. Abdul Kalam Young Research Fellowship (AKYRF) is an esteemed initiative established to encourage young researchers and scholars to make significant contributions to scientific and technological advancements in India. Named after Dr. A.P.J. Abdul Kalam, one of India’s most celebrated scientists and the 11th President of India, the fellowship is designed to honor his legacy of inspiring and nurturing young minds, fostering innovation, and promoting excellence in research.
Key Features and Objectives of the Fellowship
Inspiration from Dr. A.P.J. Abdul Kalam’s Vision: Dr. Kalam was deeply passionate about empowering youth and advancing India’s scientific and technological capabilities. The fellowship aims to continue his vision of fostering scientific and technological research, particularly in the fields of defense, space technology, and other cutting-edge areas that can contribute to the nation’s development.
Target Audience: The fellowship is primarily designed for young researchers, typically in the early stages of their career. The eligibility criteria often include:
Age limit (usually below 30 or 35 years depending on the program guidelines).
Researchers, scientists, or academicians working in areas aligned with Dr. Kalam’s vision of national progress, such as aerospace, defense, energy, environmental studies, and related fields.
Fields of Research: The fellowship encourages interdisciplinary research, with particular emphasis on areas of high strategic importance to India, such as:
Aerospace and space technology
Defense and national security
Renewable energy technologies
Biotechnology and healthcare
Environmental sustainability
Advanced computing and artificial intelligence
Research Grants and Support:
Funding: The fellowship provides financial support for research, including stipends for the researchers, travel grants, and project-based funding to carry out experiments and field studies.
Facilities and Infrastructure: Fellows are often provided access to world-class research facilities and labs, either within renowned institutions or through collaborations with industry partners.
Networking and Mentorship: Fellows have the opportunity to interact with leading scientists, professionals, and mentors, creating a conducive environment for learning, innovation, and growth.
Duration and Structure: The fellowship may typically last for one to two years, depending on the scope of the research proposal. During this time, the selected fellows are expected to focus on their research topics, present progress reports, and possibly engage with industry or academic institutions for collaboration.
Collaboration and Industry Linkages: One of the core aspects of the fellowship is its emphasis on collaboration with government research organizations, academic institutions, and industries. This creates a platform for translating research into practical, real-world applications that can benefit society and the country.
Promotion of Innovation: In line with Dr. Kalam’s own passion for innovation, the fellowship encourages young researchers to think creatively and engage in projects that have the potential for breakthroughs in scientific and technological knowledge.
Post-Fellowship Opportunities: After completing the fellowship, researchers often continue their work with further academic pursuits, industry partnerships, or as part of government projects. Many fellows go on to lead innovative projects, become part of strategic national institutions, or establish their own research initiatives.
Selection Criteria
The selection process for the Dr. A.P.J. Abdul Kalam Young Research Fellowship is rigorous and highly competitive. Some typical criteria include:
Academic Excellence: Applicants must have a strong academic background, usually with at least a postgraduate degree in the relevant field.
Research Proposal: A well-articulated research proposal outlining the objectives, methodology, expected outcomes, and potential impact of the research.
Recommendations: Letters of recommendation from academic or industry professionals who can vouch for the applicant’s capabilities and potential.
Innovative Thinking: The fellowship looks for individuals who exhibit original thinking, the ability to solve complex problems, and a desire to create a tangible impact on society.
Impact and Legacy
The Dr. A.P.J. Abdul Kalam Young Research Fellowship is more than just a financial aid program. It stands as a testament to Dr. Kalam’s commitment to nurturing the next generation of scientists and innovators. By focusing on high-impact areas such as defense, space exploration, and sustainability, the fellowship plays a crucial role in supporting India’s growth as a global leader in technology and research.
Many of the fellows go on to make significant contributions to their respective fields, advancing both scientific knowledge and the practical application of that knowledge. Moreover, the fellowship fosters a spirit of inquiry and excellence among the youth, aligning with Dr. Kalam’s vision of a developed India driven by innovation, research, and collaboration.
Conclusion
The Dr. A.P.J. Abdul Kalam Young Research Fellowship is a prestigious program that plays a pivotal role in supporting and motivating young researchers to pursue innovative and impactful scientific research. By providing financial support, research infrastructure, and valuable mentorship, it honors the legacy of Dr. A.P.J. Abdul Kalam and helps realize his dream of a technologically advanced and self-reliant India.
TERRE Policy Centre, environmental NGO based in Pune, Maharashtra dedicated to sustainable solutions, organises a Fellowship program every year for the young researchers of India in the remembrance of Late President and Scientist Dr. A. P. J. Abdul Kalam. This year we have announced the 07th Edition of Dr. A. P. J. Abdul Kalam Young Research Fellowship 2024-25.
Requesting you to encourage the young researchers of your University and Institutes to actively participate in the fellowship to make a considerable change for the future generation of our nation.
Important Dates: • Announcement of fellowship programme – 15th October 2024
Registration Open – 16th October 2024
Registration Last Date – 16th January 2025
Evaluation – March 2025
Interview of shortlisted applicants – April 2025
Result – May 2025
Fellowship Awardees Announcement – 27th July 2025
Attached below are the details of the fellowship.
Please consider the attached file as a personal invitation and kindly circulate the information among the students.
The field of Machine Learning (ML) is one of the most exciting and rapidly evolving domains in technology. With advancements in artificial intelligence, automation, and data science, the demand for skilled machine learning professionals has surged across industries. This article delves into the job prospects in machine learning, the skills required, the industries hiring, and future trends.
Why Machine Learning is in Demand
Machine Learning, a subset of Artificial Intelligence (AI), enables systems to learn from data and improve over time without explicit programming. Its applications span numerous fields such as healthcare, finance, e-commerce, and autonomous vehicles, driving innovation and efficiency. The global shift towards automation, data-driven decision-making, and intelligent systems has created a significant demand for ML professionals.
Key factors driving demand:
Explosion of Data: The massive growth of data from IoT devices, social media, and digital platforms requires sophisticated models to extract insights.
Advancements in Computing Power: With more accessible and powerful GPUs and cloud computing, ML solutions are becoming increasingly viable.
Cross-Industry Applications: From personalized recommendations to predictive maintenance, ML is transforming businesses.
Career Opportunities in Machine Learning
1. Data Scientist
Role: Use machine learning algorithms to analyze and interpret complex datasets.
Skills: Python/R, TensorFlow, statistical modeling, data visualization.
Industries: E-commerce, finance, healthcare, social media.
2. Machine Learning Engineer
Role: Develop, implement, and optimize machine learning models.
Skills: Proficiency in ML frameworks (Scikit-learn, PyTorch), software engineering, distributed computing.
Industries: Tech companies, startups, robotics.
3. AI Research Scientist
Role: Conduct research to develop new algorithms and advance ML techniques.
Skills: Deep learning, neural networks, mathematics, programming.
Industries: Research labs, universities, tech giants.
4. Business Intelligence Analyst
Role: Leverage ML to create actionable insights and improve business strategies.
Skills: Data analysis, SQL, business acumen, ML algorithms.
Industries: Retail, consulting, marketing.
5. NLP Specialist
Role: Work on language-based applications like chatbots, sentiment analysis, and translation tools.
Skills: Natural Language Processing, linguistics, deep learning.
Industries: Customer service, content management, social platforms.
6. Robotics Engineer
Role: Design and build intelligent systems for autonomous robots.
Skills: Robotics, reinforcement learning, control systems.
Industries: Manufacturing, defense, healthcare.
7. Autonomous Vehicle Engineer
Role: Develop systems for self-driving cars, including computer vision and sensor fusion.
Skills: Computer vision, C++, SLAM algorithms.
Industries: Automotive, transportation.
8. Cybersecurity Analyst
Role: Implement ML to predict and prevent cybersecurity threats.
Media and Entertainment: Content recommendation, video/audio processing.
Future Trends in Machine Learning Careers
Explainable AI (XAI): Demand for ML professionals who can create interpretable models.
Edge AI: Increased need for ML expertise in IoT and edge computing.
Hybrid Roles: Interdisciplinary skills combining ML with fields like genomics or environmental science.
AI Ethics: Specialists ensuring fairness, accountability, and transparency in ML models.
Conclusion
The job prospects in machine learning are vast and growing. As businesses and industries continue to adopt AI-driven solutions, the need for skilled professionals will only increase. For those with a passion for technology and innovation, a career in machine learning offers an exciting and lucrative pathway.
Whether you’re a recent graduate or a professional looking to pivot, now is the time to invest in developing machine learning skills and embrace a future shaped by intelligent systems.
Human Resources (HR) departments play a critical role in ensuring an organization’s workforce operates efficiently, ethically, and productively. With the increasing complexity of managing employees, HR professionals rely heavily on robust software solutions to streamline processes such as recruitment, payroll, performance evaluation, and compliance. In this article, we delve into the most popular HR management software, their features, and why they are essential for modern organizations.
1. Workday
Overview:
Workday is a cloud-based HR management software that provides a wide range of tools for workforce planning, talent management, and payroll operations. It is known for its intuitive user interface and data-driven insights.
Key Features:
Human Capital Management (HCM): Comprehensive tools for workforce planning, hiring, and employee management.
Payroll Management: Global payroll capabilities to handle multi-country operations.
Talent Optimization: Performance tracking, learning management, and succession planning.
Analytics: Real-time data analytics and reporting for better decision-making.
Why Workday?
Workday is particularly favored by large enterprises because of its scalability and integration capabilities. Its predictive analytics help HR teams proactively address workforce challenges.
2. BambooHR
Overview:
BambooHR is a highly popular HR management software among small and medium-sized businesses (SMBs). It focuses on simplifying HR tasks with its user-friendly platform.
Key Features:
Employee Database: Centralized storage for all employee information.
Recruitment Tools: Applicant tracking and onboarding features.
Performance Management: Tools for setting goals, tracking achievements, and conducting performance reviews.
Time-Off Tracking: Easy management of employee leave requests and vacation schedules.
Why BambooHR?
Its affordability and ease of use make BambooHR a go-to solution for SMBs. Additionally, its strong emphasis on employee engagement and feedback sets it apart.
3. SAP SuccessFactors
Overview:
SAP SuccessFactors is a cloud-based suite designed for enterprises seeking advanced HR tools. Its integration with other SAP modules makes it a comprehensive enterprise solution.
Key Features:
Core HR and Payroll: Centralized employee data and seamless payroll processing.
Recruiting and Onboarding: Advanced candidate search and automated onboarding workflows.
Learning and Development: Tools for employee training, certification, and career development.
Workforce Analytics: Advanced tools for workforce planning and analytics.
Why SAP SuccessFactors?
This software is ideal for organizations already using SAP products. It excels in handling complex HR needs for global organizations.
4. ADP Workforce Now
Overview:
ADP Workforce Now is a robust HR software aimed at businesses of all sizes. It is particularly well-known for its payroll and compliance features.
Key Features:
Payroll Processing: Handles payroll efficiently, including tax compliance.
HR Management: Tools for benefits administration, employee self-service, and performance tracking.
Time and Attendance: Timecard tracking and workforce scheduling.
Compliance Support: Regular updates to ensure compliance with changing labor laws.
Why ADP Workforce Now?
ADP’s longstanding reputation in payroll and compliance makes it a trusted solution. Its modular design also allows businesses to tailor it to their specific needs.
5. Zoho People
Overview:
Zoho People is part of the Zoho suite of business applications and is an excellent choice for small to medium-sized businesses.
Key Features:
Employee Management: Centralized database for employee records and personal details.
Time Tracking: Tools for attendance and timesheet management.
Performance Appraisals: Customizable appraisal systems for performance reviews.
Mobile App: Access HR functionalities on the go.
Why Zoho People?
Zoho People is known for its affordability and seamless integration with other Zoho applications, making it an excellent choice for companies already using the Zoho ecosystem.
In recent years, the conversation around gender equality in workplaces has gained significant momentum globally. While governments and organizations have made progress in public-sector employment through reservations and affirmative actions, the private sector often lags behind in ensuring adequate representation for women. The idea of introducing women reservation policies in private jobs is gaining traction as a necessary step toward fostering inclusive economic growth and addressing gender disparities in employment.
The Current Status of Women in Private Employment
Globally, women represent nearly half of the population, but their participation in the workforce, especially in leadership and technical roles, remains disproportionately low. According to a 2023 report by the World Economic Forum, women occupy only 26.7% of leadership positions in the private sector. Factors such as lack of access to quality education, societal expectations, and workplace discrimination contribute to these disparities.
In India, for instance, the female labor force participation rate in the private sector is as low as 23.3% (as per 2022 statistics), far below the global average of 47%. Despite advances in education and skill development, women remain underrepresented, especially in high-paying and decision-making roles. This trend has significant implications for economic growth, as studies show that gender-diverse organizations perform better and contribute positively to GDP.
Why Women Reservation in Private Jobs is Necessary
Addressing Systemic Discrimination Historical biases and social norms often marginalize women in private-sector hiring and promotions. By instituting reservation policies, companies can actively counter these biases and ensure fair representation in the workforce.
Promoting Economic Growth Women’s participation in the workforce is directly linked to economic prosperity. A McKinsey study suggests that closing the gender gap in employment could add $12 trillion to global GDP by 2025. Reservation policies can serve as a catalyst for unlocking this potential.
Reducing the Gender Pay Gap Women continue to earn less than men for the same roles, with a global pay gap of approximately 20%. By increasing the number of women in skilled and leadership positions, reservations can help narrow this gap.
Fostering Innovation and Productivity Diverse teams are proven to be more innovative and productive. Women’s inclusion at all levels of private employment can bring fresh perspectives, enhance decision-making, and improve workplace culture.
Achieving Social Equity Beyond economic considerations, reservation policies in private jobs promote social equity by empowering women and challenging patriarchal norms. It helps create role models for younger generations, inspiring them to pursue careers in diverse fields.
Challenges in Implementing Women Reservation in Private Jobs
While the benefits of women reservation are evident, its implementation in the private sector comes with challenges:
Resistance from Employers Many private-sector employers may view reservation policies as interference in their hiring practices, fearing it could compromise meritocracy.
Skill Gap Critics often point out that there is a mismatch between the skills women bring and the demands of certain roles. Addressing this requires parallel investments in education and vocational training.
Workplace Culture Without supportive policies like maternity leave, flexible hours, and anti-harassment measures, women may find it difficult to sustain long-term careers in male-dominated industries, even with reservations.
Legal and Policy Framework Unlike the public sector, the private sector operates on profit-driven motives, making it harder to enforce reservation policies without a robust legal framework.
Successful Models of Women Inclusion in Private Jobs
Several countries and companies have set examples in promoting women’s participation without formal reservation policies. For instance:
Nordic Countries: Through a combination of legislation and incentives, Nordic countries like Sweden and Norway have achieved nearly 40% female representation on corporate boards.
Diversity Quotas in Europe: Germany, France, and Italy have mandated gender quotas for boardrooms, leading to increased representation of women in leadership roles.
Corporate Initiatives: Companies like Unilever and TCS have introduced targeted programs to recruit, retain, and promote women, showcasing how private firms can take voluntary steps toward inclusivity.
How Women Reservation Can Work in Private Jobs
Legislation and Incentives Governments can mandate a minimum percentage of jobs in the private sector be reserved for women, especially in industries where they are underrepresented. Tax benefits and other incentives can encourage compliance.
Collaborative Skill Development Programs Partnerships between the government, private firms, and NGOs can help bridge the skill gap by providing vocational training tailored to industry demands.
Setting Benchmarks for Inclusion Companies should be encouraged to publish annual diversity reports and set benchmarks for female representation at all levels.
Supportive Workplace Policies Reservation should be complemented with policies that make workplaces more inclusive, such as mentorship programs, childcare facilities, flexible working hours, and robust anti-discrimination frameworks.
Monitoring and Accountability Regular audits and assessments are necessary to ensure companies meet their targets for women’s reservation and genuinely improve workplace diversity.
The Road Ahead: Striking a Balance
Introducing women reservation in private jobs is not just about meeting quotas; it’s about creating an ecosystem where women have equal opportunities to thrive. While legal mandates can kickstart the process, long-term success lies in building a culture of inclusivity and addressing systemic barriers. Governments, corporations, and civil society must work together to ensure these policies are both effective and sustainable.
As countries strive to achieve gender parity in all spheres of life, the private sector cannot remain an exception. Women reservation in private jobs is not just a moral imperative but also an economic and social necessity for a more equitable and prosperous future.
References
Bose, N., & Das, S. (2018). Political reservation for women and delivery of public works program. Review of Development Economics, 22(1), 203-219.
Dehalwar, K., & Sharma, S. N. (2024). Politics in the Name of Women’s Reservation. Contemporary Voice of Dalit, 2455328X241262562.
Dehalwar, K. Gender and Its Implications for Spatial Planning: Understanding the Impact. Track2Training
Kishwar, M. (2000). Equality of Opportunities vs Equality of Results: Improving Women’s Reservation Bill. Economic and Political Weekly, 35(47), 4151-4156.
Menon, N. (2000). Elusive’Woman’: feminism and women’s reservation bill. Economic and political weekly, 3835-3844.
Sharma, K. (2000). Power and representation: Reservation for women in India. Asian Journal of Women’s Studies, 6(1), 47-87.
Urban design is the interdisciplinary field that combines architecture, city planning, landscape architecture, and engineering to create functional, aesthetically pleasing, and sustainable urban environments. It is a critical discipline in shaping the future of cities, addressing challenges like population growth, climate change, and the need for more inclusive and equitable spaces.
1. What is Urban Design?
Urban design focuses on the large-scale organization and design of cities, towns, and communities. It encompasses the physical layout of neighborhoods, the arrangement of streets and public spaces, and the integration of buildings, infrastructure, and green spaces. Unlike architecture, which focuses on individual buildings, urban design deals with the broader spatial relationships between structures and their surroundings.
2. Key Principles of Urban Design
Urban design is guided by several core principles that ensure the creation of livable and sustainable urban environments:
Connectivity: Creating well-connected transport systems and pedestrian pathways to enhance accessibility and reduce reliance on cars.
Public Realm: Designing vibrant public spaces that encourage social interaction and community engagement.
Sustainability: Incorporating eco-friendly designs, such as green roofs, energy-efficient buildings, and renewable energy sources, to minimize environmental impact.
Resilience: Planning cities that can adapt to climate change, natural disasters, and economic shifts.
Identity and Place-Making: Preserving cultural heritage while fostering a sense of belonging through unique and meaningful urban spaces.
Inclusivity: Ensuring spaces are accessible and welcoming to people of all ages, abilities, and socio-economic backgrounds.
3. Components of Urban Design
Urban design involves several interconnected elements:
Urban Structure: The arrangement of zones, including residential, commercial, and industrial areas, as well as transport and infrastructure networks.
Public Spaces: Parks, plazas, streets, and other shared spaces that promote social interaction and enhance quality of life.
Buildings: The design and placement of buildings influence the aesthetic and functional character of a city.
Landscape: Incorporating natural elements such as trees, water bodies, and green belts to improve air quality and create appealing environments.
Transport and Mobility: Designing systems that balance the needs of pedestrians, cyclists, public transport, and private vehicles.
4. Historical Evolution of Urban Design
Urban design has evolved significantly over centuries, reflecting changing societal needs, technologies, and cultural values:
Ancient Cities: Cities like Mohenjo-Daro and Athens emphasized planned layouts, with streets, drainage systems, and public spaces.
Medieval Period: Walled cities with organic layouts focused on defense and community cohesion.
Industrial Revolution: Rapid urbanization led to overcrowded and polluted cities, prompting calls for better planning.
Modernist Movements: In the 20th century, urban design embraced geometric layouts, zoning, and high-rise buildings, as seen in Le Corbusier’s Radiant City.
Contemporary Approaches: Today, urban design emphasizes sustainability, inclusivity, and resilience, with smart cities
References
Adams, D., & Tiesdell, S. (2012). Shaping places: urban planning, design and development. Routledge.
Anttiroiko, A. V. (2013). U-cities reshaping our future: reflections on ubiquitous infrastructure as an enabler of smart urban development. AI & society, 28, 491-507.
Carmona, M. (2014). The place-shaping continuum: A theory of urban design process. Journal of Urban Design, 19(1), 2-36.
Dehalwar, K., & Sharma, S. N. (2023). Fundamentals of Area Appreciation and Space Perceptions.
Kumar, G., Vyas, S., Sharma, S. N., & Dehalwar, K. (2023). Planning and Development of Housing in Urban Fringe Area: Case of Bhopal (MP). GIS Business, 18(1), 1-14.
Palma Andrés, J. (2019). Modern Cities Need a Vision to Shape Their Future. City Policies and the European Urban Agenda, 21-65.
Sepe, M. (2020). Shaping the future: perspectives in research on, and the teaching of, urban design. Journal of Urban Design, 25(1), 28-31.
Sharma, S. N., & Dehalwar, K. (2023). Fundamentals of Planning and Design of Housing.
Are you passionate about journalism and eager to gain real-world experience in the media industry? Track2Training, a leading platform dedicated to skill development and professional growth, is offering an exciting internship opportunity for aspiring journalists. This internship is your chance to sharpen your writing, reporting, and media skills while contributing to a platform that values creativity and impactful storytelling.
About Track2Training
Track2Training is a dynamic platform focused on providing quality training and internship opportunities to students and professionals. It operates across multiple domains, including journalism, education, technology, and social impact. With a mission to nurture talent and foster innovation, Track2Training offers a robust learning environment for individuals looking to enhance their skills and make meaningful contributions to society.
Why Join the Journalism Internship at Track2Training?
This internship offers a unique blend of hands-on learning, mentorship, and professional exposure. Here’s why you should consider applying:
Practical Experience:
Work on real-time projects, including news reporting, feature writing, and content creation.
Gain experience in researching, editing, and publishing articles on a well-recognized platform.
Skill Development:
Develop essential journalism skills, including fact-checking, storytelling, and multimedia content creation.
Learn about journalistic ethics, audience engagement, and digital content strategies.
Guidance from Experts:
Receive mentorship from seasoned journalists and content creators at Track2Training.
Get valuable feedback to refine your writing and reporting skills.
Portfolio Building:
Publish your articles with bylines on Track2Training, building a professional portfolio to showcase your work.
Flexible Work Options:
The internship is designed to be remote, enabling you to work from anywhere.
Career Growth Opportunities:
Exceptional interns may be offered long-term collaborations or freelance opportunities with Track2Training.
Roles and Responsibilities
As a journalism intern at Track2Training, you will:
Research and write articles, blogs, and feature stories on various topics.
Conduct interviews and gather firsthand insights from subject matter experts.
Edit and proofread content to ensure accuracy, clarity, and relevance.
Collaborate with the editorial team to plan and execute engaging content.
Assist with multimedia projects, including podcasts, videos, and graphics.
Promote published content on social media to reach a wider audience.
Eligibility Criteria
Track2Training welcomes applications from students and recent graduates who meet the following requirements:
A background in journalism, mass communication, or related fields (preferred but not mandatory).
Strong writing and editing skills with a good command of the English language.
A passion for storytelling, current events, and digital media.
Familiarity with basic digital tools and social media platforms.
Self-motivated and able to meet deadlines in a fast-paced environment.
Internship Duration and Benefits
The internship duration ranges from 1 to 6 months, depending on the candidate’s availability and performance.
All interns will receive a certificate of completion at the end of the internship.
Top-performing interns may be considered for advanced roles or long-term opportunities.
How to Apply
To apply for the journalism internship at Track2Training, follow these steps:
Prepare a resume detailing your skills, education, and achievements.
Write a cover letter expressing your interest in journalism and why you want to join Track2Training.
Attach 2-3 samples of your written work (articles, essays, or blogs).
Submit your application via email to info@track2training.com with the subject line “Application for Journalism Internship.”
What Our Interns Say
“The internship at Track2Training was a turning point for me. The guidance I received helped me understand the nuances of journalism and build confidence in my abilities.” – Kavita Sharma
“Track2Training gave me the opportunity to publish my work and gain hands-on experience. The flexibility and mentorship were invaluable.” – Rohit Gupta
Conclusion
The journalism internship at Track2Training is more than just an opportunity—it’s a platform to learn, grow, and make a mark in the media industry. By joining this program, you’ll gain practical experience, build a strong portfolio, and develop the skills needed to succeed in journalism.
Don’t miss this chance to kickstart your journalism career. Apply now and become a part of Track2Training’s mission to empower aspiring professionals!
A technical paper is a specialized document that presents detailed information about a specific topic, often related to scientific research, engineering, technology, or other technical disciplines. These papers serve as a medium for researchers, professionals, and academics to share new findings, ideas, methodologies, or technologies with a targeted audience. Technical papers are characterized by their precision, depth of analysis, and reliance on data and evidence to support conclusions.
Purpose of a Technical Paper
The primary purpose of a technical paper is to:
Contribute to Knowledge: Disseminate new research findings, innovations, or advancements in a specific field.
Solve Problems: Address technical challenges or propose solutions based on research or experimentation.
Educate and Inform: Provide detailed explanations of complex concepts, making them accessible to other experts or practitioners in the field.
Facilitate Collaboration: Foster knowledge-sharing among professionals, academics, and industry leaders.
Key Features of a Technical Paper
Technical Rigor: A technical paper is grounded in accuracy, with well-defined methodologies and robust analysis. It relies on evidence, such as experimental results, theoretical models, or simulations.
Clear Structure: Technical papers follow a standardized format that allows readers to easily navigate the content. This structure often includes an abstract, introduction, methodology, results, discussion, and conclusion.
Specialized Audience: The language and depth of detail in a technical paper are tailored for a specific audience, such as engineers, scientists, or domain experts.
Use of Visuals: Figures, graphs, charts, and tables are commonly used to present data and enhance understanding.
Title: A concise and descriptive title that conveys the main topic of the paper.
Abstract: A brief summary of the paper, outlining the research problem, methods, key findings, and significance.
Introduction:
Defines the problem or question being addressed.
Provides background information and context.
States the objectives of the study or research.
Literature Review (if applicable):
Summarizes relevant research in the field.
Identifies gaps that the paper aims to address.
Methodology:
Describes the methods, tools, or processes used to conduct the research.
Provides enough detail for replication of the study.
Results:
Presents the findings of the study, often using visuals like graphs or tables.
Includes raw data, statistical analysis, or experimental outcomes.
Discussion:
Interprets the results and explains their implications.
Compares findings with existing literature.
Conclusion:
Summarizes key insights and contributions.
Highlights limitations and suggests directions for future research.
References:
Lists all sources cited in the paper, formatted according to a standard style (e.g., APA, IEEE, or MLA).
Appendices (if needed):
Includes supplementary material, such as raw data, mathematical derivations, or additional explanations.
Types of Technical Papers
Research Papers: Present original findings or discoveries in a specific field.
Review Papers: Summarize and synthesize existing research on a particular topic.
White Papers: Explain technical topics, often from an industry perspective, and advocate for a specific solution or approach.
Case Studies: Provide detailed accounts of real-world applications or projects.
Standards Papers: Define guidelines, standards, or protocols for technology or processes.
Tutorial Papers: Offer step-by-step instructions or educational content on a particular technique or methodology.
Importance of Technical Papers
Advancing Innovation: By sharing new insights, technical papers drive innovation in science and technology.
Building Expertise: They serve as a resource for professionals and students to deepen their knowledge.
Peer Review and Validation: Technical papers often undergo peer review, ensuring the credibility and reliability of the work.
Documentation and Record: They provide a permanent record of developments in a field, serving as a reference for future research.
Facilitating Communication: Technical papers enable collaboration and communication across academia, industry, and government.
Writing a Technical Paper
Plan and Research: Identify the key points, research thoroughly, and organize information logically.
Draft and Edit: Write the paper in a clear, concise style. Review multiple drafts to refine the content.
Use Visual Aids: Incorporate diagrams, tables, and charts to enhance clarity and support findings.
Seek Feedback: Share the draft with colleagues or mentors for constructive feedback.
Follow Guidelines: Adhere to formatting and submission guidelines specified by the intended publication or conference.
Common Challenges in Technical Paper Writing
Complexity: Striking a balance between technical detail and readability can be challenging.
Clarity: Avoiding jargon while maintaining precision requires careful word choice.
Plagiarism: Proper citation of sources is crucial to avoid academic misconduct.
Rejection: High standards in peer-reviewed journals mean many papers face rejection. Revisions and resubmissions are often part of the process.
Conclusion
Technical papers play a vital role in advancing knowledge and fostering innovation across technical and scientific fields. By adhering to rigorous standards and focusing on clarity, accuracy, and relevance, technical papers ensure the effective dissemination of information, enabling professionals and researchers to collaborate, innovate, and solve real-world problems. Whether contributing new findings or summarizing existing knowledge, technical papers are indispensable to the progression of technology and science.
References
Copeck, T., Barker, K., Delisle, S., Szpakowicz, S., & Delannoy, J. F. (1997). What is technical text?. Language Sciences, 19(4), 391-423.
Crowcroft, J. (2007). Net neutrality: the technical side of the debate: a white paper. ACM SIGCOMM Computer Communication Review, 37(1), 49-56.
Dehalwar, K., & Sharma, S. N. (2023). Fundamentals of Research Writing and Uses of Research Methodologies. Edupedia Publications Pvt Ltd.
Ehrenberg, A. S. C. (1982). Writing technical papers or reports. The American Statistician, 36(4), 326-329.
McConnell, S. (2002). How to write a good technical article. IEEE Softw., 19(5), 5-7.
A practice-oriented paper is a type of academic or professional writing that focuses on the practical application of theories, research findings, or concepts to real-world problems or settings. Unlike purely theoretical or research-focused papers, practice-oriented papers aim to bridge the gap between knowledge and action by offering insights, methods, tools, or strategies that practitioners can implement.
Key Characteristics of Practice-Oriented Papers:
Focus on Application:
Explains how concepts or findings can be applied in practical settings.
Often tailored to professionals or practitioners in a specific field (e.g., education, healthcare, engineering).
Actionable Recommendations:
Includes specific steps, tools, or techniques for solving a problem or improving outcomes.
Real-World Relevance:
Rooted in real-world challenges or case studies.
May draw on the author’s direct experience or data collected from practical scenarios.
Clear and Accessible Language:
Written to be understandable by non-academic audiences, such as field professionals.
Collaboration Between Theory and Practice:
Often links theoretical frameworks to their practical implementation.
Demonstrates how theoretical knowledge enhances practice.
Examples of Practice-Oriented Paper Topics:
In Education: “Strategies for Incorporating Technology into the Classroom for Enhanced Learning Outcomes.”
In Business: “Best Practices for Managing Remote Teams in a Post-Pandemic World.”
In Healthcare: “Implementing Evidence-Based Guidelines for Diabetes Management in Community Clinics.”
Common Formats:
Case studies.
How-to guides.
Policy briefs.
Reports on pilot programs or interventions.
Reflective essays based on practical experience.
Intended Audience:
The audience is usually professionals or stakeholders in the relevant field who are seeking actionable insights to improve their work, address challenges, or enhance effectiveness.
If you’re writing or using a practice-oriented paper, it’s essential to focus on actionable solutions and ensure that the content is both grounded in evidence and tailored to the practical needs of your audience.
References
Brem, A. (2024). Editorial Publishing in a Practice-Oriented Journal: Why and How You Should Do It. IEEE Engineering Management Review, 52(2), 6-8.
Castonguay, L. G., Atzil-Slonim, D., de Jong, K., & Youn, S. J. (2024). Practice-oriented research: An introduction to new developments and future directions. Administration and Policy in Mental Health and Mental Health Services Research, 51(3), 287-290.
Dehalwar, K., & Sharma, S. N. (2023). Fundamentals of Research Writing and Uses of Research Methodologies. Edupedia Publications Pvt Ltd.
Jonas, M., Littig, B., & Wroblewski, A. (Eds.). (2017). Methodological reflections on practice oriented theories. Springer.
Pettersen, I. N. (2015). Towards practice-oriented design for sustainability: the compatibility with selected design fields. International Journal of Sustainable Engineering, 8(3), 206-218.
Training and internship opportunities are critical for architecture and planning students as they bridge academic learning with practical application, enhancing skills and preparing students for professional careers. Below is a detailed discussion of various opportunities available:
1. Architectural Firms and Planning Consultancies
Roles: Interns in architectural firms work on design projects, develop CAD drawings, create 3D models, and assist with project documentation. In planning consultancies, tasks might include urban analysis, zoning studies, and report preparation.
Skills Developed:
Technical proficiency in software such as AutoCAD, SketchUp, Revit, and GIS tools.
Understanding client requirements and project feasibility.
Exposure to real-world constraints like budget, materials, and regulations.
Opportunities:
International firms like Foster + Partners, Gensler, or AECOM.
Local firms with a strong portfolio in housing, urban design, or infrastructure projects.
2. Government and Public Sector Internships
Opportunities:
Urban Development Authorities: Departments like municipal corporations, urban development ministries, or city planning bodies often offer internships to students in city planning, housing, or transport planning.
Heritage Conservation Departments: Roles in documentation, restoration planning, and heritage management.
Example:
Internships with agencies like HUDCO (Housing and Urban Development Corporation), Smart City Missions in India, or city planning departments in countries worldwide.
Benefits:
Exposure to policymaking and public-sector project execution.
Opportunities to work on large-scale public infrastructure projects.
3. Non-Governmental Organizations (NGOs) and Research Institutes
NGOs: Interning with organizations focused on sustainable development, disaster management, or housing for the underprivileged can offer unique experiences.
Research Institutes: Organizations like the National Institute of Urban Affairs (NIUA) or regional research bodies provide internships involving data analysis, policy formulation, or publishing research papers.
Skills Developed:
Social and environmental aspects of architecture and planning.
Grant-writing and stakeholder engagement.
4. Real Estate and Construction Companies
Roles: Interns may assist with site planning, feasibility studies, and project management tasks.
Notable Companies:
Real estate developers like CBRE, Jones Lang LaSalle (JLL), or regional property developers.
Learning Outcomes:
Insight into the commercial aspects of design and planning.
Hands-on experience with construction technologies and sustainability practices.
5. Academic and Teaching Assistantships
Many universities and colleges offer opportunities for students to work as teaching or research assistants during their studies.
Activities:
Assisting professors in research projects, model-making, or preparing teaching materials.
Benefits:
Deepened theoretical knowledge and academic networking.
Opportunities to publish papers or participate in conferences.
6. Specialized Design and Software Training Programs
Purpose: Enhance technical skills in areas like parametric design, Building Information Modeling (BIM), or GIS.
Programs:
Workshops and certifications by software companies such as Autodesk, Rhinoceros, or ESRI.
Online platforms like Coursera, edX, and LinkedIn Learning offer project-based learning modules.
Impact:
Stand out in the job market with advanced technical skills.
Learn about cutting-edge tools used in industry and academia.
7. Internships in Sustainability and Green Building Design
Opportunities: Internships in firms specializing in LEED certification, renewable energy integration, and sustainable urban design.
Example:
Green building councils or eco-architecture firms.
Skills Gained:
Techniques for energy modeling, water management, and lifecycle cost analysis.
Knowledge of global standards like LEED, BREEAM, or GRIHA.
8. International Internships and Exchange Programs
Organizations: Programs such as Erasmus+ in Europe or IAESTE (International Association for the Exchange of Students for Technical Experience) provide placements worldwide.
Advantages:
Exposure to global architectural and planning standards.
Networking with international professionals and peers.
Challenges:
May require competitive application and sponsorship for travel or accommodation.
9. Competitions and Live Projects
Competitions such as the Archiprix, Urban Labs, or national student design contests often include mentorship and training components.
Participating in these provides:
Practical problem-solving skills.
A portfolio of innovative projects.
10. Construction Site Internships
Experience:
Shadowing construction managers and understanding site operations.
Skills:
Learning construction techniques, material properties, and project coordination.
Suitability:
Essential for students interested in execution and project management.
Conclusion
Training and internship opportunities provide invaluable experiences for architecture and planning students, aligning their academic knowledge with professional needs. Proactively seeking internships in varied sectors such as design firms, NGOs, government bodies, and international platforms equips students with a diverse skill set and prepares them for multifaceted roles in their careers.
The inclusion of women in management positions is a critical marker of gender equality and organizational diversity. Over the decades, there has been progress in bridging the gender gap in leadership roles, but significant challenges remain. This discussion explores the current landscape, benefits of gender diversity in management, barriers faced by women, and strategies for achieving equitable representation.
1. Current Status of Women in Management
Global Trends: Despite growing awareness, women remain underrepresented in management positions worldwide. According to reports by organizations like the International Labour Organization (ILO) and McKinsey, women occupy about 29% of senior management roles globally as of 2023, with significant variation across industries and regions.
Regional Disparities:
In North America and Europe, women have made strides, particularly in the corporate and public sectors, supported by diversity policies and quotas.
In Asia-Pacific and the Middle East, cultural norms and societal expectations pose barriers, resulting in slower progress.
In Sub-Saharan Africa, entrepreneurship among women has risen, but their presence in formal management roles remains limited.
Industry-Specific Representation: Women are better represented in industries like healthcare, education, and hospitality, but their presence is significantly lower in technology, engineering, and manufacturing sectors.
2. Benefits of Women in Management
Enhanced Organizational Performance: Studies consistently show that companies with diverse leadership teams outperform those without in terms of profitability, innovation, and decision-making quality. Diverse perspectives lead to better problem-solving and strategic planning.
Improved Workplace Culture: Women leaders often promote inclusive workplace policies and practices, fostering an environment of collaboration, trust, and employee satisfaction.
Social and Economic Growth: Gender-diverse management contributes to economic growth by leveraging the full talent pool. When women thrive in leadership roles, they inspire and mentor future generations.
3. Challenges Facing Women in Management
Structural Barriers:
Glass Ceiling: Unofficial barriers prevent women from advancing to top leadership roles despite qualifications and performance.
Pay Gap: Women in management often earn less than their male counterparts for similar roles, perpetuating financial inequity.
Societal and Cultural Norms:
Gender stereotypes portray leadership as a predominantly male domain, creating biases in hiring and promotion.
Women often face societal expectations to prioritize family responsibilities, limiting their career advancement opportunities.
Organizational Challenges:
Lack of mentorship and sponsorship opportunities hinders career progression for women.
Workplace cultures that favor “masculine” leadership traits can marginalize women with different leadership styles.
Intersectional Disparities: Women from marginalized communities face compounded discrimination based on race, ethnicity, or socio-economic status, further limiting their opportunities.
4. Strategies to Promote Women in Management
Policy Interventions:
Quotas and Targets: Governments and organizations can set targets for female representation in leadership to drive accountability.
Equal Pay Policies: Enforcing transparency in pay structures ensures women receive equitable compensation.
Organizational Initiatives:
Leadership Development Programs: Offering training and development opportunities tailored to women prepares them for managerial roles.
Flexible Work Policies: Enabling work-life balance through remote work, parental leave, and flexible hours supports women in leadership.
Diversity and Inclusion Committees: Establishing committees to monitor and promote diversity initiatives ensures sustained progress.
Mentorship and Sponsorship: Senior leaders should mentor and sponsor aspiring women managers, providing them with guidance, networking opportunities, and advocacy.
Addressing Biases: Conducting unconscious bias training helps organizations identify and mitigate discriminatory practices in recruitment, evaluation, and promotion.
5. Case Studies
Norway’s Gender Quota in Boardrooms: Norway introduced a mandatory quota requiring 40% of board members in public companies to be women. This policy significantly increased female representation in senior roles and inspired similar initiatives globally.
Lean In Movement: Founded by Sheryl Sandberg, this initiative encourages women to pursue leadership roles while advocating for systemic changes in workplace policies and culture.
UN Women’s Empowerment Principles (WEPs): The WEPs provide guidance to businesses on promoting gender equality in the workplace, marketplace, and community. Companies adopting these principles report better gender balance in management.
6. Future Directions
Technological Innovation: Leveraging technology to provide virtual mentorship, networking platforms, and data-driven approaches to address gender disparities can accelerate change.
Focus on Intersectionality: Policies must consider intersectional barriers to ensure inclusivity for all women, including those from underrepresented groups.
Corporate Accountability: Organizations should publish annual diversity reports and set measurable goals to track progress in promoting women in management.
Cultural Shifts: Encouraging society to redefine leadership as inclusive and diverse is crucial. Schools, media, and community programs can play a role in challenging stereotypes.
7. Conclusion
The presence of women in management positions is not only a matter of fairness but also a strategic imperative for organizations aiming to thrive in a competitive, globalized world. While progress has been made, achieving gender parity in leadership requires a collective effort from governments, organizations, and society at large. By dismantling systemic barriers, promoting inclusive policies, and fostering cultural change, the vision of gender-equal leadership can become a reality.
References
Broadbridge, A., & Simpson, R. (2011). 25 years on: reflecting on the past and looking to the future in gender and management research. British journal of management, 22(3), 470-483.
Brush, C. G. (1992). Research on women business owners: Past trends, a new perspective and future directions. Entrepreneurship theory and practice, 16(4), 5-30.
Dehalwar, K., & Sharma, S. N. (2024). Politics in the Name of Women’s Reservation. Contemporary Voice of Dalit, 2455328X241262562.
Lyness, K. S., & Terrazas, J. M. (2006). Women in management: An update on their progress and persistent challenges. International Review of Industrial and Organizational Psychology 2006, 21, 267-294.
Madsen, S. R. (2012). Women and leadership in higher education: Current realities, challenges, and future directions. Advances in Developing Human Resources, 14(2), 131-139.
Concrete is one of the most widely used construction materials globally, accounting for a significant portion of the built environment. However, its production is responsible for approximately 8% of global carbon dioxide emissions, mainly due to cement manufacturing. In response to this environmental challenge, scientists and engineers have developed biocrete, a cutting-edge material poised to revolutionize the construction industry.
What is Biocrete?
Biocrete, also known as bio-concrete or living concrete, is an innovative material infused with biological components, typically microorganisms, to enhance its properties and sustainability. Unlike traditional concrete, biocrete integrates living systems that provide self-healing, reduced carbon footprint, and improved durability.
Biocrete comes in various forms, tailored to specific applications:
Self-healing biocrete: Incorporates bacteria that produce calcium carbonate to seal cracks.
Biologically-derived cement replacements: Use microbial processes to generate bio-based binders.
Algae-based biocrete: Employs algae for carbon sequestration during production.
The Science Behind Biocrete
1. Self-Healing Mechanism
Biocrete’s self-healing properties leverage bacteria such as Bacillus species, which remain dormant within the material until a crack forms. When exposed to water and oxygen through the crack, these bacteria become active, consuming calcium lactate and producing calcium carbonate. This calcium carbonate fills and seals the cracks, restoring the material’s integrity.
Microorganisms, such as Sporosarcina pasteurii, are utilized to precipitate calcium carbonate through metabolic processes. This biological method offers a sustainable alternative to conventional cement by reducing the need for high-temperature processes.
3. Algae-Based Solutions
Certain strains of algae, like Chlamydomonas reinhardtii, capture atmospheric CO₂ during photosynthesis and produce biomass and calcium carbonate. Integrating these algae into concrete production not only offsets carbon emissions but also creates a renewable cycle.
Advantages of Biocrete
Environmental Benefits:
Reduced Carbon Emissions: Biocrete eliminates or minimizes the use of traditional Portland cement, significantly lowering greenhouse gas emissions.
Carbon Sequestration: Algae-based and microbial processes can actively sequester carbon during production.
Durability:
Self-healing properties extend the lifespan of structures by reducing maintenance and preventing water infiltration through cracks.
Enhanced resistance to chemical attacks, especially in marine environments.
Resource Efficiency:
Utilizes biological and renewable inputs, reducing reliance on non-renewable resources.
Potential for using waste products, such as agricultural residues, as feedstocks for microbial processes.
Cost Savings:
Lower long-term maintenance costs due to self-healing.
Potential for reduced material costs as production scales up.
Applications of Biocrete
Infrastructure Repair: Self-healing biocrete is particularly useful for repairing bridges, tunnels, and roadways, where traditional maintenance is challenging and costly.
Green Building Projects: Architects and developers increasingly use biocrete in sustainable construction to meet environmental certifications.
Marine Structures: Biocrete’s resistance to seawater makes it ideal for offshore platforms, seawalls, and docks.
Customizable Design: Its properties can be tailored for specific applications, such as soundproofing or thermal insulation.
Challenges and Limitations
While biocrete holds immense promise, it faces several challenges:
Production Costs: Currently, biocrete is more expensive to produce than traditional concrete due to limited scalability and the cost of biological components.
Standardization: The construction industry lacks clear guidelines and standards for integrating biocrete into mainstream projects.
Durability in Extreme Conditions: The long-term performance of biocrete under extreme environmental stress requires further testing.
Public Perception: Adoption may be hindered by skepticism about the reliability of living materials in construction.
The Future of Biocrete
The growing emphasis on sustainable development and green technologies is likely to accelerate the adoption of biocrete. Researchers are exploring ways to:
Scale up production while reducing costs.
Improve the efficiency and resilience of biological processes.
Integrate biocrete with other smart construction technologies, such as sensors and robotics.
Governments and private organizations can play a pivotal role by funding research, creating incentives, and establishing standards that encourage the adoption of biocrete in construction projects.
Conclusion
Biocrete represents a transformative innovation in the construction industry. By blending biology with traditional materials, it offers a sustainable solution to the environmental challenges posed by conventional concrete. While hurdles remain, ongoing advancements in material science and biotechnology are set to make biocrete a cornerstone of sustainable infrastructure. As the world strives to reduce its carbon footprint, biocrete stands out as a promising step toward a greener future.
References
Hayakawa, M., Matsuoka, Y., & Shindoh, T. (1993). Development and application of superworkable concrete. In Special Concretes-Workability and Mixing (pp. 185-192). CRC Press.
Kerley, M. (2004). Structural identification of phases constituting biocrete acid resistant mortar.
Sharma, S. N., Prajapati, R., Jaiswal, A., & Dehalwar, K. (2024, June). A Comparative Study of the Applications and Prospects of Self-healing Concrete/Biocrete and Self-Sensing Concrete. In IOP Conference Series: Earth and Environmental Science (Vol. 1326, No. 1, p. 012090). IOP Publishing.
FormsPal.com is a dedicated organization that works to better support our communities and every individual, regardless of gender, age, nationality, or religion, by providing high-quality free legal templates and information online. This resource provides thousands of templates that are available for download with detailed instructions for filling. While everyone needs to have fundamental legal arrangements in place, such as a will of inheritance, real estate insurance, power of attorney in case of an emergency, and rental agreements, minorities are at a disadvantage when it comes to paying high attorney fees, taking time off their demanding jobs, and dealing with pre-tenancy issues. FormsPal solves this issue by providing legal documents for free. Thousands of templates are available for download with detailed instructions for filling.
Writing and Editing Services from Track2Training
Track2Training offers comprehensive writing and editing services tailored to meet the diverse needs of students, researchers, and professionals. Whether you are preparing academic manuscripts, articles, research papers, or creative works, their services ensure high-quality content with a professional touch.
Services Offered
Academic Writing Assistance
Research papers
Theses and dissertations
Essays and coursework
Editing and Proofreading
Grammar and syntax checks
Formatting as per specific style guides (APA, MLA, Chicago, etc.)
Ensuring clarity, coherence, and logical flow
Content Development
E-books
Articles and blog posts
Reports and white papers
Resume and Cover Letter Writing
Professional CV creation
Custom cover letters tailored for job applications
Creative Writing
Stories, poetry, and scripts
Editing for tone, style, and audience engagement
Plagiarism Checking and Reduction
Advanced tools for plagiarism detection
Assistance in rephrasing and citation
Why Choose Track2Training?
Expert Team: Experienced professionals from diverse fields.
Quick Turnaround: Timely delivery without compromising quality.
Customized Solutions: Services tailored to individual project requirements.
Affordable Rates: Competitive pricing with high value.
For more details, visit Track2Training or contact their support team to get started on your writing and editing needs.
The incidents of women lynching in Manipur have drawn significant attention to the issue of vigilantism and the dangers it poses, particularly to vulnerable groups such as women. It’s important to address the issue of mob attacks on women in the context of India and examine the complex factors contributing to such incidents. India, like many other societies, has deep-rooted gender inequalities and a patriarchal social structure. Despite significant progress in women’s rights and empowerment, there are still pockets of society where traditional gender norms and attitudes persist, leading to the marginalization and vulnerability of women. Some cultural norms and beliefs may perpetuate the notion that women are subordinate to men and should not challenge authority. This can result in the objectification and disrespect of women, making them targets of mob attacks in certain situations. In some cases, mob attacks on women may be used as a means of exerting control or punishment. Women who are perceived as deviating from societal norms or who assert their rights and freedoms may face hostility from conservative elements.
Despite progress in women’s empowerment, there are still areas where women face limited access to education, healthcare, and economic opportunities. This lack of empowerment can make them more susceptible to violence and abuse. The effectiveness of law enforcement and the justice system in addressing crimes against women can vary widely across regions in India. Weak law enforcement and slow justice processes may embolden perpetrators and encourage mob violence. Mob attacks often involve a group mentality where individuals may feel less accountable for their actions, leading to a sense of impunity. This can lead to the escalation of violence, especially against vulnerable targets like women. In some cases, mob attacks against women may be linked to underlying communal or caste tensions. Women from minority or marginalized communities may be targeted as part of larger conflicts.
Addressing these issues requires a multi-faceted approach:
Promoting gender equality and women’s empowerment through education, awareness campaigns, and economic opportunities.
Strengthening law enforcement and the justice system to ensure swift and fair action against perpetrators of violence.
Challenging cultural norms and beliefs that perpetuate gender inequality and discrimination.
Encouraging community engagement and dialogue to counter mob mentality and promote respect for women’s rights.
Enhancing women’s safety through measures like improved street lighting, safe public transportation, and community watch programs.
It’s important to recognize that progress is being made in India towards addressing these challenges, and numerous individuals and organizations are working tirelessly to improve the status of women and their safety. However, the issue remains complex and will require sustained efforts from all sections of society to achieve lasting change.
Animal husbandry, the practice of raising and breeding animals for various purposes, has been an integral part of human civilization for thousands of years. It plays a crucial role in improving livelihoods worldwide, particularly in rural communities. Animal husbandry offers a wide range of benefits, including food security, economic opportunities, environmental sustainability, and social development. This essay explores the usefulness of animal husbandry in enhancing livelihoods and highlights its significance in meeting the challenges of a rapidly changing world.
Food Security and Nutrition
One of the primary advantages of animal husbandry is its contribution to food security and nutrition. Livestock serves as an essential source of high-quality protein, essential minerals, and vitamins. Animal products such as meat, milk, and eggs provide vital nutrients necessary for human growth and development. Moreover, animal husbandry diversifies dietary options, making communities less reliant on a limited range of crops. This resilience is especially valuable in areas prone to agricultural risks, such as droughts or pests, as livestock can utilize marginal lands and convert low-quality forage into valuable protein sources.
Economic Opportunities
Animal husbandry offers numerous economic opportunities, particularly for rural communities. Livestock production creates jobs along the entire value chain, from breeding and rearing animals to processing and marketing animal products. Many small-scale farmers and pastoralists depend on livestock as a primary source of income and livelihood. By engaging in animal husbandry, individuals can generate a sustainable income, improve their financial stability, and escape the cycle of poverty.
Furthermore, animal husbandry contributes to rural economies by stimulating local markets. It encourages the growth of supporting industries such as veterinary services, animal feed production, and equipment manufacturing. Additionally, the sale of animals and their by-products generates revenue that can be invested in education, healthcare, and infrastructure development, leading to overall community advancement.
Environmental Sustainability
Animal husbandry, when practiced sustainably, plays a vital role in environmental conservation. Well-managed livestock systems can contribute to soil fertility, enhance nutrient cycling, and promote biodiversity. Animals, through their grazing patterns, help maintain grasslands and prevent the encroachment of invasive species. Moreover, livestock waste can be used as organic fertilizer, reducing the dependency on chemical inputs and enhancing soil health.
Furthermore, animal husbandry can foster sustainable land management practices. By employing rotational grazing and adopting agroforestry techniques, farmers can optimize land utilization and minimize soil erosion. Additionally, integrated farming systems that combine crop cultivation with livestock rearing contribute to resource efficiency and reduce waste. Such practices promote the preservation of natural resources and mitigate the environmental impact of agricultural activities.
Social Development and Resilience
Animal husbandry plays a pivotal role in social development, especially in marginalized communities. By engaging in animal husbandry, individuals gain valuable skills and knowledge, empowering them to become self-reliant and independent. Livestock rearing provides opportunities for vocational training and capacity building, enabling individuals to enhance their agricultural practices and improve productivity.
Moreover, animal husbandry can contribute to gender equality and women empowerment. In many societies, women play a significant role in livestock management, which allows them to generate income and actively participate in decision-making processes. By recognizing and supporting women’s involvement in animal husbandry, communities can achieve more equitable and inclusive development.
Furthermore, animal husbandry can enhance community resilience in the face of external shocks such as natural disasters or economic downturns. Diversifying livelihood options by incorporating livestock rearing reduces vulnerability and provides a safety net during difficult times. It creates opportunities for income generation and asset accumulation, enabling communities to bounce back from crises and secure their future.
Conclusion
Animal husbandry offers a range of benefits that contribute to improving livelihoods globally. It plays a critical role in ensuring food security, creating economic opportunities, promoting environmental sustainability, and fostering social development. By recognizing the importance of animal husbandry and supporting sustainable practices, societies can harness its full potential for the betterment of individuals and communities. As we navigate the challenges of a rapidly changing world, animal husbandry will continue to play a pivotal role in shaping resilient and prosperous livelihoods.
References
Adepoju Abimbola, O., & Oluwakemi, A. O. (2013). Livelihood diversification and welfare of rural households in Ondo State, Nigeria. Journal of Development and Agricultural, 5(12), 482-489.
Allison, E. H., & Ellis, F. (2001). The livelihoods approach and management of small-scale fisheries. Marine policy, 25(5), 377-388.
Belcher, B., Ruiz-Pérez, M., & Achdiawan, R. (2005). Global patterns and trends in the use and management of commercial NTFPs: implications for livelihoods and conservation. World development, 33(9), 1435-1452.
Chambers, R., & Conway, G. (1992). Sustainable rural livelihoods: practical concepts for the 21st century. Institute of Development Studies (UK).
Herrero, M., Thornton, P. K., Gerber, P., & Reid, R. S. (2009). Livestock, livelihoods and the environment: understanding the trade-offs. Current Opinion in Environmental Sustainability, 1(2), 111-120.
Serrat, O., & Serrat, O. (2017). The sustainable livelihoods approach. Knowledge solutions: Tools, methods, and approaches to drive organizational performance, 21-26.
Sharma, S. N., Chatterjee, S., & Dehalwar, K. (2023). Mahatma Gandhi National Rural Employment Guarantee Scheme: Challenges and Opportunities. Think India Journal, 26(1), 7-15.
Williams, T. O. (2004). Sustainable crop-livestock production for improved livelihoods and natural resource management in West Africa. ILRI (aka ILCA and ILRAD).
GIS Day is an international event celebrated annually on the third Wednesday of November. It serves as a platform to showcase the significant contributions of Geographic Information Systems (GIS) to society, science, and various industries. This day was first initiated in 1999 by Esri, a leading GIS software company, as a part of Geography Awareness Week. The idea was to inspire curiosity about geography and promote the importance of spatial thinking.
Purpose of GIS Day
GIS Day is dedicated to:
Raising Awareness: Educating people about GIS technology and its transformative applications in understanding spatial patterns, solving complex problems, and making informed decisions.
Showcasing Innovation: Demonstrating real-world GIS applications in areas such as urban planning, environmental conservation, disaster management, transportation, and public health.
Building Community: Bringing together GIS professionals, students, educators, and enthusiasts to share knowledge, experiences, and innovations.
Importance of GIS
GIS is a powerful tool that integrates data from various sources to visualize, analyze, and interpret spatial relationships. Its applications are vast:
Urban Planning: Designing sustainable cities, optimizing land use, and improving infrastructure.
Environmental Management: Tracking deforestation, monitoring wildlife, and managing water resources.
Disaster Response: Mapping areas affected by natural disasters to coordinate relief efforts.
Health Care: Identifying disease outbreaks and improving healthcare delivery.
Transportation: Optimizing logistics, route planning, and managing traffic systems.
How GIS Day is Celebrated
Workshops and Seminars: Educational institutions, government bodies, and organizations host workshops and seminars to introduce GIS concepts and software.
Exhibitions: Professionals and students showcase GIS projects, demonstrating its impact on various fields.
Hands-On Activities: Participants engage in interactive activities, such as map-making and geocaching, to explore the fun side of GIS.
Community Mapping: Collaborative mapping projects are organized to address local issues, like mapping safe routes, water sources, or underserved areas.
Guest Lectures: GIS experts share insights, latest trends, and real-world applications of GIS technology.
Significance for Students and Enthusiasts
For students and budding GIS professionals, GIS Day offers an excellent opportunity to:
Explore career prospects in GIS and related fields.
Network with industry leaders and academics.
Gain hands-on experience with GIS tools and software.
Themes and Innovations
Every GIS Day may highlight specific themes such as smart cities, climate change, or disaster resilience. It is also a platform to unveil advancements in GIS technology, like 3D mapping, AI integration, or real-time geospatial analysis.
Impact of GIS Day
GIS Day fosters a deeper understanding of geography and geospatial technology. It encourages the next generation to pursue careers in geospatial sciences, contributing to solutions for global challenges like urbanization, climate change, and natural disasters.
Key Takeaway
GIS Day is more than just a celebration of technology; it is a reminder of the interconnectedness of our world and the potential of spatial thinking to address complex problems. Whether you’re a professional, a student, or simply curious, GIS Day offers a window into the power of mapping and the endless possibilities it holds.
References
Sadvari, J., Koshoffer, A., Gorham, R. B., & Phillips, K. (2020). GIS Day across the Association of Research Libraries: Outreach, Education, and Collaboration. Journal of Map & Geography Libraries, 16(3), 283-299.
Sharma, S. N., Dehalwar, K., & Singh, J. (2023). Cellular Automata Model for Smart Urban Growth Management.
Weimer, K. H., Olivares, M., & Bedenbaugh, R. A. (2012). GIS day and web promotion: Retrospective analysis of US ARL libraries’ involvement. Journal of Map & Geography Libraries, 8(1), 39-57.
Coupling and coordination are two key concepts often studied together in software engineering, systems design, and organizational research. When used as part of a research technique, these concepts explore how components of a system or organization interact and depend on each other. Here’s a detailed explanation:
1. Coupling
Coupling refers to the degree of interdependence or linkage between components in a system. It measures how tightly two or more elements (modules, teams, or subsystems) are connected or reliant upon each other.
Types of Coupling in Software and Research:
Tight Coupling:
Strong dependency between components.
Changes in one component heavily affect others.
Leads to reduced flexibility and scalability.
Example: In software, tightly coupled modules require simultaneous modification for changes.
Loose Coupling:
Minimal dependency between components.
Greater flexibility and easier maintenance.
Preferred for modular designs, as each component can evolve independently.
Example: Microservices architecture.
Data Coupling:
When modules share data explicitly.
Example: Passing parameters between functions.
Control Coupling:
One component dictates the behavior of another by sending control information.
Example: Passing a flag that alters execution.
Research Focus on Coupling:
Coupling is analyzed to understand system behavior, predict change impacts, or identify potential failures.
In organizations, coupling research examines how closely teams or departments depend on one another and how this impacts productivity, resilience, and innovation.
2. Coordination
Coordination refers to the mechanisms and processes used to manage dependencies between different entities (e.g., software modules, organizational teams, or processes).
Coordination Techniques:
Direct Coordination:
Entities communicate directly, often through real-time communication or interaction.
Example: Standup meetings in agile teams.
Indirect Coordination:
Managed through intermediaries like shared resources, schedules, or tools.
Example: Using version control systems in software development.
Synchronous vs. Asynchronous Coordination:
Synchronous: Real-time interaction, e.g., video calls.
Asynchronous: Delayed interaction, e.g., emails or task boards.
Implicit vs. Explicit Coordination:
Implicit: Coordination happens automatically through shared understanding or workflows.
Explicit: Clearly defined roles, processes, and instructions.
Research Focus on Coordination:
Studying coordination helps identify bottlenecks, inefficiencies, and communication barriers.
Investigates how systems adapt to changes in requirements or unexpected events.
Coupling and Coordination in Research:
When studied together, coupling and coordination provide insights into the complexity of systems and their efficiency:
Key Research Techniques:
Dependency Analysis:
Identifying and mapping dependencies in a system or organization.
Used in system design and organizational behavior studies.
Network Analysis:
Visualizing and analyzing the relationships and dependencies between entities.
Example: Social network analysis for team coordination.
Simulation Models:
Simulating tightly coupled or loosely coupled systems to observe performance under different coordination mechanisms.
Case Studies:
In-depth exploration of specific instances of coupled systems or coordinated teams to identify best practices and challenges.
Empirical Studies:
Data-driven approaches using surveys, interviews, or metrics to measure coupling and coordination.
Applications Across Domains:
Software Engineering:
Design loosely coupled modules with effective coordination through APIs or middleware.
Example: Object-oriented programming promotes low coupling and high cohesion.
Organizational Research:
Analyzing how inter-team dependencies and coordination tools affect productivity.
Example: Investigating the use of agile practices for team collaboration.
System Design:
Balancing tight coupling for performance with loose coupling for flexibility.
Example: Designing IoT systems with minimal interdependence between devices.
Process Management:
Studying how manufacturing or logistics systems handle coupling and coordination.
Summary
Coupling and coordination research techniques involve analyzing interdependencies and communication mechanisms within systems or organizations. While coupling focuses on how tightly entities are linked, coordination emphasizes the processes for managing these dependencies. Together, these concepts guide the design of efficient, adaptable, and scalable systems.
References
Li, J., Fang, H., Fang, S., & Siddika, S. E. (2018). Investigation of the relationship among university–research institute–industry innovations using a coupling coordination degree model. Sustainability, 10(6), 1954.
Lodhi, A. S., Jaiswal, A., & Sharma, S. N. (2024). Assessing bus users satisfaction using discrete choice models: a case of Bhopal. Innovative Infrastructure Solutions, 9(11), 1-27.
Sharma, S. N., & Adeoye, M. A. (2024). New Perspectives on Transformative Leadership in Education.
Yan, B. R., Dong, Q. L., Li, Q., Amin, F. U., & Wu, J. N. (2021). A study on the coupling and coordination between logistics industry and economy in the background of high-quality development. Sustainability, 13(18), 10360.
Zhao, Y., Hou, P., Jiang, J., Zhai, J., Chen, Y., Wang, Y., … & Xu, H. (2021). Coordination study on ecological and economic coupling of the Yellow River Basin. International journal of environmental research and public health, 18(20), 10664.
The phenomenon of rising land prices in urban areas is a critical issue affecting urban planning, housing affordability, and economic development. Over recent decades, urban land prices have surged globally, driven by complex interrelated factors. This escalation impacts individuals, businesses, and governments alike, shaping urban landscapes and influencing societal structures.
Key Factors Influencing Land Prices in Urban Areas
1. Demand and Supply Dynamics
Population Growth: Urbanization leads to an influx of people into cities, increasing demand for residential, commercial, and industrial spaces. As the urban population grows, the limited availability of land drives up prices.
Limited Land Availability: Urban areas often face constraints such as geographical boundaries, zoning regulations, and environmental considerations, which limit the supply of developable land, thereby pushing prices higher.
2. Economic Development
Infrastructure Development: Proximity to infrastructure such as transportation networks, schools, hospitals, and utilities makes certain areas more desirable, increasing land values.
Economic Opportunities: Cities with robust economic activity attract businesses and workers, increasing demand for land. Regions with thriving industries, tech hubs, or business districts experience sharper price increases.
3. Government Policies and Regulations
Zoning Laws: Regulations that dictate land use can impact prices significantly. For instance, limiting residential development in certain areas can lead to higher prices due to scarcity.
Taxation and Subsidies: Policies such as property taxes, incentives for development, or subsidies for affordable housing can indirectly affect land prices.
4. Speculation and Investment
Real Estate Speculation: Land is often purchased as an investment with the expectation of price appreciation. Speculative activities can artificially inflate land prices, especially in rapidly growing urban centers.
Foreign Investment: In some cities, foreign investors buy land or property as an asset, driving up local prices and reducing affordability for residents.
5. Economic Indicators
Inflation: As inflation increases, the nominal value of land rises, reflecting the general increase in prices within an economy.
Interest Rates: Lower interest rates make borrowing cheaper, encouraging investment in real estate and driving up land prices. Conversely, higher rates can cool demand.
6. Urbanization and Changing Lifestyles
Lifestyle Shifts: Preferences for urban living due to employment opportunities, better education, healthcare, and entertainment options drive demand for land in cities.
Densification Trends: With limited horizontal expansion possibilities, cities grow vertically, increasing the value of land plots that allow high-density development.
7. Technological Advancements
Smart Cities and Digital Connectivity: Land in areas with advanced digital infrastructure, such as high-speed internet and smart utilities, tends to command a premium.
Impact of Remote Work: While remote work trends during the COVID-19 pandemic initially shifted demand to suburban areas, urban hubs with diversified economic bases remain attractive.
8. Environmental and Geographic Factors
Geographical Constraints: Cities located near coastlines, mountains, or other natural barriers face limitations on expansion, making available land more valuable.
Climate Change and Resilience: Land in areas considered less vulnerable to climate risks such as flooding or hurricanes can become more desirable, increasing prices.
9. Cultural and Social Factors
Prestige and Reputation: Certain neighborhoods gain a reputation for prestige, safety, or cultural vibrancy, attracting affluent buyers and increasing prices.
Educational and Social Amenities: Proximity to top schools, universities, or cultural institutions can elevate land values in specific urban pockets.
10. Global and Local Events
Pandemics and Crises: Events like pandemics may temporarily disrupt trends, such as by increasing interest in suburban living. However, cities often rebound due to their economic and social advantages.
Major Events: Hosting global events like the Olympics or World Expos can boost land prices in the host city due to infrastructure development and international attention.
Consequences of Rising Land Prices
The increase in land prices in urban areas leads to several consequences, including:
Housing Affordability Crisis: High land prices make housing unaffordable for lower and middle-income groups, exacerbating social inequalities.
Urban Sprawl: People move to suburban or peri-urban areas in search of affordable housing, leading to sprawling cities and increased commuting times.
Displacement and Gentrification: Long-standing communities may be displaced as wealthier groups purchase properties, altering the social fabric of neighborhoods.
Economic Polarization: High land costs can deter small businesses and startups, concentrating economic power in the hands of larger entities.
Conclusion
The rise in urban land prices is a multifaceted issue shaped by economic, social, environmental, and political factors. Managing this trend requires a delicate balance of policy interventions, such as encouraging sustainable urban planning, enforcing regulations to curb speculation, and promoting equitable access to affordable housing. Understanding these dynamics is crucial for governments, developers, and residents to navigate the challenges and opportunities posed by urban land price escalation.
References
Bogin, A., Doerner, W., & Larson, W. (2019). Local house price dynamics: New indices and stylized facts. Real Estate Economics, 47(2), 365-398.
Colsaet, A., Laurans, Y., & Levrel, H. (2018). What drives land take and urban land expansion? A systematic review. Land Use Policy, 79, 339-349.
Ma, J., Cheng, J. C., Jiang, F., Chen, W., & Zhang, J. (2020). Analyzing driving factors of land values in urban scale based on big data and non-linear machine learning techniques. Land use policy, 94, 104537.
Quigley, J. M., & Rosenthal, L. A. (2005). The effects of land use regulation on the price of housing: What do we know? What can we learn?. Cityscape, 69-137.
Sharma, S. N. Land-Use Zones in Urban Planning.
Dehalwar, K., & Sharma, S. N. (2024). Social Injustice Inflicted by Spatial Changes in Vernacular Settings: An Analysis of Published Literature.
The Core-Periphery Model, developed by John Friedmann in 1966, is a framework used to understand the spatial structure of economic development and regional disparities. It explores how economic activities, resources, and development tend to concentrate in certain areas (the core), leaving other areas (the periphery) less developed. The model is particularly significant in the fields of geography, regional planning, and development economics, as it highlights the unequal distribution of economic power and resources across different regions.
Key Concepts of the Core-Periphery Model
Core Region:
The core is the center of economic, political, and social power.
It is characterized by high levels of industrialization, urbanization, and infrastructure development.
The core regions typically have a concentration of capital, technology, skilled labor, and investment.
Examples include major metropolitan cities or developed countries (e.g., New York, London, Tokyo).
Periphery Region:
The periphery consists of areas that are less economically developed, with lower levels of industrialization and urbanization.
These regions often depend on primary economic activities like agriculture, mining, or raw material extraction.
Peripheral regions tend to have lower levels of income, education, and infrastructure.
Examples include rural areas or developing countries that are economically dependent on the core.
Semi-Periphery Region (added in later refinements of the model):
These are transitional regions that lie between the core and periphery.
They exhibit some characteristics of the core but still face challenges similar to those in the periphery.
Semi-peripheral regions may be emerging economies or rapidly developing cities (e.g., India, Brazil, South Africa).
Stages of Development According to Friedmann
Friedmann’s model identifies four stages in the spatial development of regions:
Pre-Industrial Society:
Economic activities are widely dispersed with little concentration.
Traditional economies dominate, with a focus on agriculture and subsistence activities.
There is minimal differentiation between core and periphery regions.
Emergence of the Core:
Industrialization leads to the growth of certain regions, creating a core area.
The core attracts investments, industries, and skilled labor, becoming an economic hub.
Peripheral areas remain underdeveloped, leading to a spatial economic imbalance.
Core-Dominated Economy:
The core continues to expand, accumulating more economic power and resources.
The periphery becomes increasingly dependent on the core for economic activities, capital, and technology.
This dependence creates a hierarchical relationship, reinforcing regional disparities.
Spatial Integration:
Over time, development policies, infrastructure projects, and technological advancements may reduce regional disparities.
The economic benefits of the core can spill over to the periphery, promoting regional integration.
This stage aims for a more balanced spatial distribution of economic activities.
Mechanisms of Core-Periphery Dynamics
Polarization Effect:
Economic growth tends to concentrate in the core, attracting more resources, investments, and skilled labor.
This process, known as “cumulative causation,” leads to the growth of core regions at the expense of peripheral regions.
Backwash Effect:
The core extracts resources, labor, and capital from the periphery, further weakening the peripheral regions.
This can lead to a drain of talent and resources from rural or underdeveloped areas to more prosperous urban centers.
Spread Effect:
The core’s growth may eventually lead to positive spillover effects in the periphery, such as increased investments, technology transfer, and job creation.
This can happen through policies aimed at decentralization, regional development, and infrastructure improvements.
Implications of the Core-Periphery Model
Economic Inequality:
The model highlights the uneven economic development between core and peripheral regions, which can lead to social and economic inequalities.
Policy Formulation:
Policymakers can use this model to devise strategies for balanced regional development, such as promoting investment in peripheral areas, decentralizing industries, and improving infrastructure.
Urbanization Trends:
It explains the rapid urbanization and concentration of population in metropolitan areas, as people migrate from rural peripheries to urban cores in search of better economic opportunities.
Criticisms of the Core-Periphery Model
Over-Simplification:
The model is criticized for being too simplistic, as it divides regions into binary categories of core and periphery without accounting for the complexities of regional dynamics.
Lack of Consideration for Globalization:
The model was developed in the 1960s, before the rise of globalization and digital technologies, which have altered the spatial distribution of economic activities.
Limited Applicability:
The model may not be fully applicable to all regions, especially in the context of modern economies where multiple cores and decentralized economic activities exist.
Applications of the Core-Periphery Model
Regional Planning and Development:
The model is used to guide regional development policies, focusing on reducing disparities between core and peripheral areas.
Urban Studies:
It helps in analyzing urbanization patterns, city growth, and migration trends.
Economic Geography:
The model provides insights into the spatial distribution of economic activities, helping economists understand the factors driving regional disparities.
Example: Application in India
Core Regions:
Major metropolitan areas like Mumbai, Delhi, and Bengaluru serve as economic cores, with high levels of industrialization, services, and technology.
Peripheral Regions:
Rural areas in states like Bihar, Odisha, and parts of Northeast India remain less developed, with economies primarily dependent on agriculture and limited industrialization.
Semi-Periphery Regions:
States like Gujarat, Tamil Nadu, and Maharashtra show mixed characteristics, with both developed urban centers and underdeveloped rural areas.
Conclusion
The Core-Periphery Model by Friedmann offers a valuable framework for understanding the spatial dynamics of economic development. While it has limitations, it provides a useful lens for examining regional disparities, informing policy interventions aimed at promoting balanced development and reducing economic inequality.
References
Baldwin, R. E. (2001). Core-periphery model with forward-looking expectations. Regional science and urban economics, 31(1), 21-49.
Borgatti, S. P., & Everett, M. G. (2000). Models of core/periphery structures. Social networks, 21(4), 375-395.
Castro, S. B., Correia‐da‐Silva, J., & Mossay, P. (2012). The core‐periphery model with three regions and more. Papers in Regional Science, 91(2), 401-419.
Forslid, R., & Ottaviano, G. I. (2003). An analytically solvable core‐periphery model. Journal of Economic Geography, 3(3), 229-240.
Klimczuk, A., & Klimczuk-Kochańska, M. (2023). Core-periphery model. In The palgrave encyclopedia of global security studies (pp. 239-245). Cham: Springer International Publishing.
Sharma, S. N. Exploring the Urban Growth Pole Theory.
Sharma, S. N., Dehalwar, K., Kumar, G., & Vyas, S. (2023). Redefining Peri-urban Urban Areas. Thematics Journal of Geography, 12(3), 7-13.
Increasing public participation in the planning process is vital to ensure inclusive, transparent, and community-centered outcomes. Effective measures to enhance public engagement in plan-making involve a mix of education, accessibility, technology, and trust-building. Below are detailed steps to increase public participation in planning:
1. Education and Awareness
Public Awareness Campaigns: Use media campaigns, workshops, and community meetings to educate citizens about the importance of planning and its impact on their lives.
Simplified Information: Create easy-to-understand summaries of technical documents to help non-experts grasp the issues.
Outreach in Schools and Colleges: Engage younger generations through educational programs in schools and colleges to cultivate a culture of civic participation.
Citizen Guides: Publish “How-to” guides to explain how citizens can contribute meaningfully to planning processes.
2. Accessible Communication Channels
Multi-Language Communication: Provide documents and announcements in multiple languages relevant to the local population.
Use of Visual Aids: Share maps, charts, and infographics to present complex plans in a more comprehensible manner.
Inclusive Venues and Timings: Host meetings in locations accessible to all, including those with disabilities, and schedule them at times convenient for working individuals.
Helplines and Support Desks: Offer dedicated phone lines, email support, and in-person helpdesks to address public queries.
3. Digital Tools and Technology
Interactive Websites and Apps: Create platforms where people can view plans, submit feedback, and track the progress of their inputs.
Virtual Public Meetings: Offer live streaming and interactive Q&A sessions for those who cannot attend in person.
Online Surveys and Polls: Use digital surveys to gather broad-based opinions efficiently.
GIS Tools: Enable the public to view geographic data interactively, allowing them to understand spatial planning implications better.
4. Participatory Workshops and Forums
Community Visioning Workshops: Facilitate workshops where residents can brainstorm ideas and prioritize issues.
Focus Groups: Conduct small, focused discussions with specific demographic groups (e.g., women, youth, seniors) to ensure their voices are heard.
Citizen Panels: Form panels or advisory groups of residents to regularly consult during the planning process.
Hackathons and Design Jams: Organize events where participants collaborate on innovative solutions for urban challenges.
5. Proactive Outreach
Door-to-Door Engagement: Send planners or volunteers to homes to distribute materials and discuss the process.
Engagement with Local Organizations: Partner with community groups, NGOs, and resident welfare associations to act as bridges between the government and the public.
Mobile Units: Use vans or kiosks to reach underserved or remote areas to engage with the public directly.
6. Feedback Mechanisms
Transparent Feedback Loops: Regularly update participants on how their feedback has been incorporated or why certain suggestions were not feasible.
Public Dashboards: Create online dashboards showing public contributions and decisions made at each stage.
Recognition Programs: Acknowledge active participants through certificates, public mentions, or awards.
7. Legal and Policy Frameworks
Mandatory Public Consultation Requirements: Ensure legal provisions for minimum public consultation periods and incorporate public input as a mandatory step in the planning process.
Citizen Assemblies: Institutionalize regular citizen assemblies to discuss and deliberate on planning issues.
Grievance Redressal Systems: Establish mechanisms to address concerns or complaints related to the planning process.
8. Building Trust and Transparency
Anti-Corruption Measures: Ensure that the planning process is free from corruption and favoritism to build trust.
Open Data Policies: Share all non-confidential planning data publicly to allow independent analysis.
Public Monitoring Committees: Enable community representatives to monitor and report on planning developments.
9. Incentives for Participation
Stipends or Honorariums: Provide compensation for time and effort spent by citizens participating in lengthy consultations.
Recognition of Contributions: Highlight contributions through media or social media platforms.
Gamification: Use gamified approaches like reward points for participating in surveys or contributing ideas.
10. Cultural and Contextual Sensitivity
Local Festivals and Events: Tie consultations to popular cultural events to attract larger audiences.
Tailored Approaches: Adapt engagement strategies to align with the social, cultural, and economic dynamics of the community.
11. Long-Term Engagement Strategies
Citizen Capacity Building: Invest in long-term training for citizens to enhance their understanding of planning principles and decision-making processes.
Institutionalized Roles: Form permanent citizen committees that regularly interact with planning authorities.
Continual Feedback Opportunities: Provide year-round avenues for citizens to provide feedback beyond formal consultation periods.
By combining these measures, authorities can foster greater public involvement, resulting in plans that are not only better aligned with community needs but also enjoy broader support and legitimacy.
References
Dehalwar, K., & Sharma, S. N. (2023). Fundamentals of Area Appreciation and Space Perceptions.
Dehalwar, K., & Sharma, S. N. (2024). Social Injustice Inflicted by Spatial Changes in Vernacular Settings: An Analysis of Published Literature.
Dehalwar, K., & Sharma, S. N. (2024). Politics in the Name of Women’s Reservation. Contemporary Voice of Dalit, 2455328X241262562.
Haklay, M., Jankowski, P., & Zwoliński, Z. (2018). Selected modern methods and tools for public participation in urban planning–a review. Quaestiones Geographicae, 37(3), 127-149.
Lane, M. B. (2005). Public participation in planning: an intellectual history. Australian geographer, 36(3), 283-299.
Sharma, S. N. (2014). Participatory Planning in Plan Preparation. BookCountry.
Sharma, S. N. (2013). Participatory Planning in Practice. Lulu. com.
Sharma, S. N. (2018). Review of National Urban Policy Framework 2018. Think India Journal, 21(3), 74-81.
Sharma, S. N. (2018). Transformation of Aspirational Districts Programme: A Bold Endeavor Towards Progress. Think India Journal, 21(4), 197-206.
Sharma, S. N. (2005). Evaluation of the JnNURM Programme of Government of India for Urban Renewal. Think India Journal, 8(2), 1-7.
Thomas, H. (2003). Public participation in planning. In British planning policy (pp. 187-206). Routledge.
Unplanned waste disposal is a critical environmental issue that affects ecosystems, public health, and the planet’s overall sustainability. It occurs when waste materials are discarded without proper treatment or consideration for their impact, leading to environmental contamination, health hazards, and socio-economic challenges.
The World Bank estimates that global waste production will increase by 70% by 2050 unless urgent action is taken. Rapid urbanization, population growth, and consumerism exacerbate the problem, particularly in developing nations where waste management infrastructure is often inadequate.
Types of Waste and Their Impact
Municipal Solid Waste (MSW): Includes household garbage, food waste, and packaging materials. Improper disposal results in unsanitary conditions, pest infestations, and methane emissions from landfills.
Hazardous Waste: Includes industrial chemicals, batteries, and medical waste. These materials can leach toxic substances into soil and water, harming ecosystems and human health.
Plastic Waste: Plastics take centuries to decompose and often end up in oceans, harming marine life and entering the food chain.
E-Waste: Discarded electronics release heavy metals like lead and cadmium, contaminating soil and groundwater.
Environmental Consequences of Unplanned Waste Disposal
Soil Contamination: Leachates from landfills contain toxic chemicals that degrade soil quality, making it unsuitable for agriculture.
Water Pollution: Improperly disposed waste can contaminate rivers, lakes, and groundwater with harmful substances, disrupting aquatic ecosystems and jeopardizing clean water supplies.
Air Pollution: Open burning of waste releases dioxins, furans, and other harmful pollutants, contributing to respiratory diseases and climate change.
Biodiversity Loss: Waste in natural habitats harms wildlife, either through ingestion, entanglement, or habitat destruction.
Climate Change: Decomposing organic waste generates methane, a potent greenhouse gas contributing to global warming.
Public Health Implications
Disease Outbreaks: Unmanaged waste creates breeding grounds for disease vectors such as mosquitoes and rodents, increasing the prevalence of diseases like malaria and dengue fever.
Respiratory Issues: Pollutants from waste burning cause respiratory problems, particularly among vulnerable groups such as children and the elderly.
Chemical Exposure: Direct contact with hazardous waste or contaminated water can lead to skin disorders, neurological issues, and even cancer.
Mental Health Impact: Communities living near poorly managed waste sites often experience stress, anxiety, and reduced quality of life.
Socio-Economic Effects
Economic Burden: Healthcare costs rise due to increased disease prevalence, while local governments face escalating expenses for cleanup and mitigation.
Aesthetic and Property Value Loss: Unplanned waste disposal reduces the attractiveness of neighborhoods and lowers property values.
Impact on Livelihoods: Fisherfolk, farmers, and tourism-dependent communities suffer due to environmental degradation.
Solutions and Strategies for Sustainable Waste Management
Policy and Regulation:
Governments should enforce strict regulations on waste disposal and management.
Polluter pays principle and extended producer responsibility can incentivize businesses to minimize waste.
Infrastructure Development:
Building modern recycling facilities, composting units, and waste-to-energy plants.
Implementing robust waste collection and segregation systems.
Community Engagement:
Educating the public about the importance of reducing, reusing, and recycling.
Organizing community clean-up drives and awareness campaigns.
Innovative Technologies:
Using AI and IoT for efficient waste tracking and management.
Developing biodegradable alternatives to plastic and other non-decomposable materials.
International Cooperation:
Sharing best practices and technologies between nations.
Supporting global agreements like the Basel Convention on hazardous waste.
Conclusion
Unplanned waste disposal poses a significant threat to environmental health, public safety, and economic stability. Addressing this challenge requires collective action from governments, businesses, and individuals. By adopting sustainable practices and investing in effective waste management systems, society can mitigate the adverse effects and move toward a cleaner, healthier future.
References
Dehalwar, K., & Sharma, S. N. (2024). Social Injustice Inflicted by Spatial Changes in Vernacular Settings: An Analysis of Published Literature.
Guerrero, L. A., Maas, G., & Hogland, W. (2013). Solid waste management challenges for cities in developing countries. Waste management, 33(1), 220-232.
Imam, A., Mohammed, B., Wilson, D. C., & Cheeseman, C. R. (2008). Solid waste management in Abuja, Nigeria. Waste management, 28(2), 468-472.
Kumar, G., Vyas, S., Sharma, S. N., & Dehalwar, K. (2024). Challenges of Environmental Health in Waste Management for Peri-urban Areas. In Solid Waste Management: Advances and Trends to Tackle the SDGs (pp. 149-168). Cham: Springer Nature Switzerland.
Nanda, S., & Berruti, F. (2021). Municipal solid waste management and landfilling technologies: a review. Environmental chemistry letters, 19(2), 1433-1456.
Sharma, S. N., Dehalwar, K., & Singh, J. (2024). Emerging Techniques of Solid Waste Management for Sustainable and Safe Living Environment. In Solid Waste Management: Advances and Trends to Tackle the SDGs (pp. 29-51). Cham: Springer Nature Switzerland.
Sharma, S. N. (2013). Sustainable development strategies and approaches. International Journal of Engineering and Technical Research (IJETR), 2.
Shekdar, A. V. (2009). Sustainable solid waste management: An integrated approach for Asian countries. Waste management, 29(4), 1438-1448.
AuthorAID is a global network and online platform aimed at helping researchers in developing countries, especially early-career researchers, improve their academic writing, publication skills, and overall research capabilities. It is an initiative that supports the development of high-quality research by providing mentorship, resources, and training to researchers who often face significant challenges in accessing academic publishing, funding, and networking opportunities.
The program is a project of the International Network for the Availability of Scientific Publications (INASP), a UK-based development organization that works to improve the quality and accessibility of research and knowledge in developing countries.
AuthorAID’s mission is to bridge the gap between researchers from developed and developing countries in terms of research development, capacity building, and access to scientific knowledge. Specifically, AuthorAID aims to:
Improve Research Quality: Help researchers enhance the quality of their academic papers and publications through training, feedback, and peer review support.
Facilitate Publication: Assist early-career researchers in navigating the academic publishing process, including how to write, format, and submit papers for journals.
Mentorship: Connect early-career researchers with mentors from around the world who can provide guidance on improving research and career development.
Foster Networking and Collaboration: Encourage collaboration between researchers across different countries, regions, and academic disciplines.
Enhance Capacity: Provide training and resources on a wide range of research-related topics, from research methodology and grant writing to effective communication and academic writing skills.
Key Features and Services of AuthorAID
Online Platform and ResourcesAuthorAID offers a comprehensive online platform that includes:
Webinars and Online Courses: Free webinars and self-paced online courses on various topics, such as writing research papers, publishing in journals, understanding impact factors, and navigating peer review.
Research and Writing Guides: A library of articles, manuals, and guides on research methods, writing techniques, and publication strategies tailored to the needs of researchers in developing countries.
Discussion Forums: A platform for researchers to share experiences, ask questions, and discuss challenges related to academic writing, publishing, and research.
Mentorship ProgramOne of the core offerings of AuthorAID is its mentorship program, which connects early-career researchers with experienced mentors in their respective fields. Mentors provide advice and guidance on a wide range of issues, including:
Improving research methodology and writing skills.
Navigating the complexities of the peer review process.
Identifying appropriate journals for submission.
Developing successful grant proposals.
Career guidance and professional development.
Researchers seeking mentorship can sign up through the AuthorAID platform, where they are matched with mentors who have expertise in their specific areas of research.
Researcher NetworkingThe AuthorAID platform facilitates networking among researchers through the following:
Collaborative Projects: Researchers can find potential collaborators, both within their country and internationally, for joint research projects, papers, and publications.
Social Media and Community Engagement: Through social media groups (e.g., LinkedIn, Twitter, and Facebook), AuthorAID connects researchers, providing opportunities for interaction and knowledge-sharing.
Publication and Peer Review SupportOne of the most significant barriers for researchers from developing countries is navigating the publication process. AuthorAID offers a variety of tools to assist researchers, including:
Publication Advice: Practical advice on how to write and submit manuscripts for peer review and how to interpret reviewer feedback.
Peer Review Training: Offering workshops and materials to help researchers become better at reviewing papers and understanding the peer review process.
Journal Matching Service: A tool that helps researchers find appropriate journals for their work based on the content of their papers.
Grants and Funding InformationWhile AuthorAID does not provide direct funding, the platform offers valuable information and advice on where to find research funding and how to write successful grant proposals. This includes:
Funding Databases: Access to information about various funding opportunities for researchers in developing countries.
Grant Writing Workshops: Practical training on how to write strong and competitive research grant applications.
Impact of AuthorAID
AuthorAID has made a significant impact on the research community, particularly in the Global South. By providing critical support to researchers in low- and middle-income countries, the platform has:
Improved Research Outcomes: Many researchers have been able to successfully publish in high-impact journals, leading to greater visibility for their work.
Enhanced Collaboration: By connecting researchers from around the world, AuthorAID has helped establish research partnerships that may not have otherwise occurred.
Increased Confidence: Early-career researchers who may have felt isolated or unsure about their work have gained confidence through mentoring and peer support.
Capacity Building: The wide variety of resources and training available on the platform has helped researchers build essential skills for their academic careers.
Challenges and Future Directions
Despite its success, AuthorAID faces several challenges:
Language Barriers: Many researchers in developing countries struggle with English-language proficiency, which can limit their ability to publish in international journals. AuthorAID is working to address this by offering resources and support in multiple languages.
Funding Limitations: While AuthorAID helps researchers find funding, the availability of grants and financial support for researchers in developing countries remains a critical issue.
Infrastructure and Access to Technology: In some regions, internet access and access to the necessary tools for online research and publication remain barriers.
Looking to the future, AuthorAID aims to expand its services, enhance the reach of its mentorship program, and continue developing resources tailored to the needs of researchers in diverse settings.
Conclusion
AuthorAID plays a vital role in strengthening the research capacity of scholars in developing countries. By providing mentorship, resources, and training on academic writing, publishing, and networking, the platform empowers researchers to overcome the barriers they face and contribute valuable knowledge to the global scientific community. It is a powerful tool for anyone seeking to make a meaningful impact through research and to foster greater collaboration between the Global South and Global North.
The initiative stands as a testament to the importance of global cooperation in advancing knowledge and research, ensuring that scholars from all parts of the world have the resources and support they need to succeed.
References
Bruijns, S. R., Banner, M., & Jacquet, G. A. (2017). Improving publication quality and quantity for acute care authors from low-and middle-income settings. Annals of Emergency Medicine, 69(4), 462-468.
Dehalwar, K., & Sharma, S. N. (2023). Fundamentals of Research Writing and Uses of Research Methodologies. Edupedia Publications Pvt Ltd.
Gastel, B. (2013). AuthorAID: An international service and chance to serve. Medical Writing, 22(4), 284-287.
Gastel, B. (2015). AuthorAID and editors: collaborating to assist authors in developing countries.
Harris, S. (2019). Truth and Lies in Academic Publishing: Distrust in Research Highlights the Importance of Education in Critical Thinking Skills. Refer, 35(2), 30-34.
Nobes, A. (2016). AuthorAID–supporting early career researchers in developing countries. The Biochemist, 38(5), 39-41.
Obino, F., Salomon, S., & Zanfini, L. (2023). Financing without doing harm: for virtuous mechanisms to support African social science research. In Financing without doing harm: for virtuous mechanisms to support African social science research: Obino, Francesco| uSalomon, Sophie| uZanfini, Linda. Paris, France: Éditions AFD.
Shashok, K. (2010). How AuthorAID in the Eastern Mediterranean helps researchers become authors. The Write Stuff, 9(1), 43-6.
As a ritual/festival, Halloween is celebrated on October 31 worldwide. Since this year, Diwali/Kali Puja will be celebrated on October 31, 2024, so, on October 30, 2024, in the gated community, Hyderabad, where I have been living with my family for 7/8 years, Halloween was celebrated on October 30, 2024. In the gated community known as Libdom Luxury Villas (Raj Reddy Valley), Bandlaguda Jagir, Hyderabad, children, irrespective of age and gender, celebrate different festivals and rituals, including Halloween. Before writing about the Halloween ritual enjoyed by our campus children, let me highlight a few points about our gated community. This gated community is spread over 17 acres of land with indoor and outdoor games, a gym, a park, a swimming pool, a function hall, etc. Altogether, 190 families (a few might be unoccupied) live in this gated community; each has a duplex house and little land surrounding it. In the land, all nurture flowers, some vegetables, fruits, etc. The most highlighting point is that this gated campus consists of different religions, castes, and languages (people of various States), representing a mini-India in the true sense. On October 30, 2024, children enjoyed Halloween by dressing vis-à-vis wearing masks like ghosts, vampires, witches, animals, and others. Around 70 children, irrespective of age and gender, participated in the Halloween. It is noteworthy to mention that kids and teenagers, by forming groups – each group consisting of 7 to 8 children based on their age group and friendship enthusiastically visited almost every villa (wearing different dresses or masks as mentioned already), and elders of each villa spontaneously provided them candy, chocolate, or sweets. As a senior citizen, I thoroughly enjoyed their enthusiasm, happiness, joy, and cheerfulness. Regarding Halloween, I am presenting a few lines collected from Britannica (britannica.com/story/why-do-we-celebrate-halloween). “Halloween has been around for more than a thousand years. Originally a religious observance, it became increasingly secular over the centuries until its religious trappings disappeared. Today, Halloween is considered a holiday for dress-up and fun, especially for children. Halloween’s origins can be traced back to the ancient Celtic festival known as Samhain, held on November 1 in contemporary calendars. It was believed that on that day, the souls of the dead returned to their homes, so people dressed in costumes and lit bonfires to ward off spirits. This way, popular Halloween tropes such as witches, ghosts, and goblins became associated with the holiday. In the 7th century CE, Pope Boniface IV created All Saints Day, originally celebrated on May 13. A century later, Pope Gregory III moved the holiday to November 1, likely as a Christian substitute for the pagan festival of Samhain. The day before, the saintly celebration became known as All Hallows Eve or Halloween. Though the holiday began in Celtic regions of Ireland, the United Kingdom, and France, it quickly spread to other parts of the world. The first American colonists in New England were forbidden to celebrate it for religious reasons, though it enjoyed some popularity in the Southern colonies. By the 1800s, fall festivals marking the seasonal harvest incorporated Halloween elements, and Irish immigrants escaping the devastating Potato Famine brought with them many Halloween traditions that remain today.” Incidentally, this year, on October 30, 2024, there is a ritual associated with Hindu belief known as Bhoot Chaturdashi Tithi. There are different opinions about Bhoot Chaturdashi Tithi. Many people also think that the soul of the ancestors comes to the mortal world on this date. Anyway, in all cases, there is a reference to the arrival of evil forces. Fourteen lamps are lit to get rid of this evil energy. The light of these fourteen lamps is believed to destroy all evil forces. I am a senior citizen, 68 years old, so I was happy to observe our children’s enthusiasm for performing Halloween. ( I express my deep sense of gratitude to Dr. P. Vidya Sagar, Forensic Expert, Villa 161, Libdom Villa, for organising the event) Prof Shankar Chatterjee, Hyderabad
Interviews are a central method of gathering qualitative data across disciplines, particularly in research, psychology, human resources, and customer service. Broadly, interviews can be classified into structured, semi-structured, and unstructured types. Each of these types serves a unique purpose and provides varying levels of flexibility and control over the data-gathering process. Here’s a detailed breakdown of each type:
1. Structured Interviews
Definition: Structured interviews are a standardized approach to interviewing where the interviewer follows a predetermined set of questions, asked in a specific order, with little to no deviation. The questions are often closed-ended, focusing on eliciting specific information from respondents.
Key Characteristics:
Standardization: All interviewees are asked identical questions in the same sequence, ensuring consistency across interviews.
Fixed Response Options: Often, structured interviews include closed-ended questions, allowing for objective comparison across responses.
Limited Flexibility: The interviewer does not deviate from the script, leaving little room for follow-up or probing questions.
Objective Scoring: In many cases, responses can be scored or rated, making it possible to quantify results.
Advantages:
Reliability and Consistency: Because the structure is rigid, responses are easier to compare and analyze statistically, which improves the reliability of findings.
Efficiency: Structured interviews tend to be shorter and more focused, making them ideal when time or resources are limited.
Reduced Interviewer Bias: With a fixed set of questions, the likelihood of interviewer bias affecting responses is minimized.
Disadvantages:
Limited Depth: Structured interviews lack flexibility, making it difficult to explore topics beyond the predetermined questions, which may limit the depth of information gathered.
Inflexible Responses: Respondents may find it challenging to fully express their thoughts within the confines of closed-ended questions.
Applications:
Hiring and Recruitment: Structured interviews are common in initial screening processes, where specific job-related competencies are evaluated.
Surveys: Many survey-based interviews (e.g., census interviews) use structured formats for consistency and reliability.
Research Studies: Structured interviews are often used in studies that require quantifiable data, such as psychological assessments or standardized tests.
2. Semi-Structured Interviews
Definition: Semi-structured interviews use a blend of predetermined questions and the flexibility to explore topics as they arise. Interviewers start with a set of key questions but can deviate to probe for additional information based on the respondent’s answers.
Key Characteristics:
Guided Structure: A framework of core questions is provided, but the interviewer can ask follow-up questions, depending on responses.
Flexibility: Unlike structured interviews, semi-structured interviews allow for spontaneous questions that provide richer data.
Open-Ended Questions: Questions are generally open-ended, allowing interviewees to elaborate and provide nuanced responses.
Advantages:
Balance of Consistency and Flexibility: Semi-structured interviews combine the structure needed to guide the conversation with the flexibility to explore unplanned topics in depth.
In-Depth Data Collection: The open-ended nature allows for deeper insights, as participants can share more detailed, personal information.
Improved Rapport: Semi-structured interviews foster a more conversational style, which can make interviewees feel more comfortable and open.
Disadvantages:
Time-Consuming: Semi-structured interviews require more time to conduct and analyze, as responses are often longer and more complex.
Interviewer Skill Dependency: The effectiveness of semi-structured interviews depends on the interviewer’s ability to ask relevant follow-up questions and guide the conversation.
Subjective Interpretation: Because responses are open-ended, interpretation can be subjective, requiring careful analysis to avoid biases.
Applications:
Qualitative Research: Semi-structured interviews are frequently used in fields like sociology, anthropology, and psychology to gather rich qualitative data.
Customer Feedback: Organizations often use semi-structured interviews to understand customer needs and preferences in detail.
Performance Appraisals: Semi-structured interviews are common in performance evaluations, where feedback can be explored in depth through a blend of preset and flexible questions.
3. Unstructured Interviews
Definition: Unstructured interviews are the most flexible type, with no predetermined set of questions. Instead, the interviewer and interviewee engage in an open, free-flowing conversation where topics can evolve based on the participant’s responses.
Key Characteristics:
Complete Flexibility: The interviewer can ask any question based on the conversation flow, without being constrained by a script or structure.
Participant-Led: Often, the participant’s responses guide the direction of the interview, allowing for exploration of topics that might not have been initially considered.
High Depth and Detail: Unstructured interviews often yield highly detailed and personal insights, as interviewees are free to discuss topics in-depth.
Advantages:
Depth and Richness of Data: Because there is no structure, interviewees can express themselves freely, leading to unique, valuable insights.
Adaptability: Unstructured interviews are ideal for exploring complex, sensitive topics where a structured approach might limit expression.
Rapport Building: The conversational nature often helps interviewees feel at ease, fostering a sense of trust that can yield honest responses.
Disadvantages:
Difficulty in Analysis: Data from unstructured interviews can be challenging to organize and analyze, as responses vary widely and lack uniformity.
Interviewer Skill Requirement: Successful unstructured interviews require high interviewer skills, including active listening, adaptability, and the ability to ask relevant probing questions.
Time-Consuming: Without a predetermined structure, unstructured interviews can be lengthy, both in conducting and analyzing responses.
Applications:
Exploratory Research: Often used in exploratory studies where the objective is to uncover new insights or hypotheses rather than test existing ones.
Therapy and Counseling: Therapists often use an unstructured approach, allowing clients to direct conversations based on what they feel comfortable sharing.
Investigative Journalism: Journalists frequently use unstructured interviews to gather in-depth, personal stories that may reveal new angles to a story.
Summary Table
Interview Type
Structure
Flexibility
Data Depth
Common Applications
Structured
High
Low
Low
Surveys, hiring, standardized research
Semi-Structured
Moderate
Moderate
Moderate
Qualitative research, feedback, appraisals
Unstructured
None
High
High
Therapy, exploratory research, journalism
In choosing an interview type, one should consider the purpose of the interview, the desired depth of information, available time, and the skills of the interviewer. Structured interviews provide consistency, while unstructured ones allow for richer insights, and semi-structured interviews offer a balance between the two.
References
Adeoye‐Olatunde, O. A., & Olenik, N. L. (2021). Research and scholarly methods: Semi‐structured interviews. Journal of the american college of clinical pharmacy, 4(10), 1358-1367.
Brinkmann, S. (2014). Unstructured and semi-structured interviewing. The Oxford handbook of qualitative research, 2, 277-299.
Dehalwar, K., & Sharma, S. N. (2023). Fundamentals of Research Writing and Uses of Research Methodologies. Edupedia Publications Pvt Ltd.
Dehalwar, K., & Sharma, S. N. (2024). Exploring the Distinctions between Quantitative and Qualitative Research Methods. Think India Journal, 27(1), 7-15.
Dehalwar, K. (Ed.). (2024). Basics of Research Methodology-Writing and Publication. EduPedia Publications Pvt Ltd.
Kumar, G., Vyas, S., Sharma, S. N., & Dehalwar, K. (2024). Challenges of Environmental Health in Waste Management for Peri-urban Areas. In Solid Waste Management: Advances and Trends to Tackle the SDGs (pp. 149-168). Cham: Springer Nature Switzerland.
Low, J. (2019). Unstructured and semi–structured interviews in Health Research. Researching Health: Qualitative, Quantitative and Mixed methods. London: Sage publications, 123-41.
Miller, P. R., Dasher, R., Collins, R., Griffiths, P., & Brown, F. (2001). Inpatient diagnostic assessments: 1. Accuracy of structured vs. unstructured interviews. Psychiatry research, 105(3), 255-264.
Segal, D. L., Coolidge, F. L., O’Riley, A., & Heinz, B. A. (2006). Structured and semistructured interviews. In Clinician’s handbook of adult behavioral assessment (pp. 121-144). Academic Press.
Sharma, S. N., Lodhi, A. S., Dehalwar, K., & Jaiswal, A. (2024, June). Life Cycle Assessment (LCA) of Recycled & Secondary Materials in the Construction of Roads. In IOP Conference Series: Earth and Environmental Science (Vol. 1326, No. 1, p. 012102). IOP Publishing.


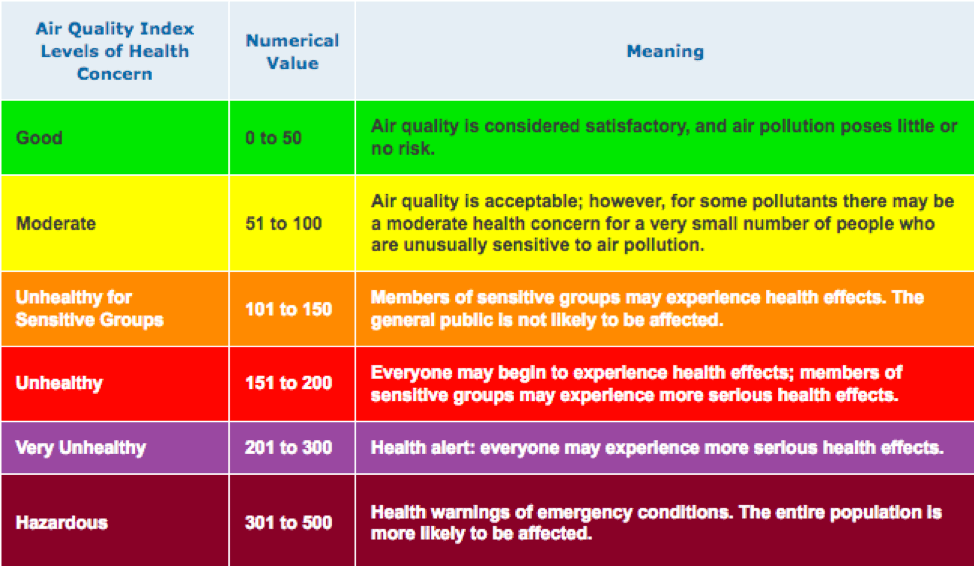


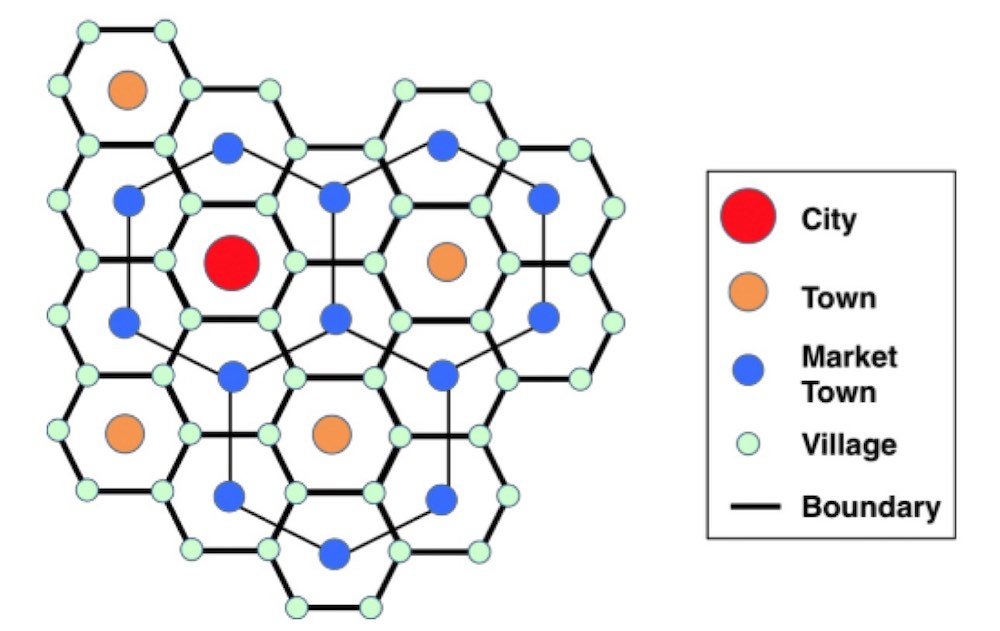


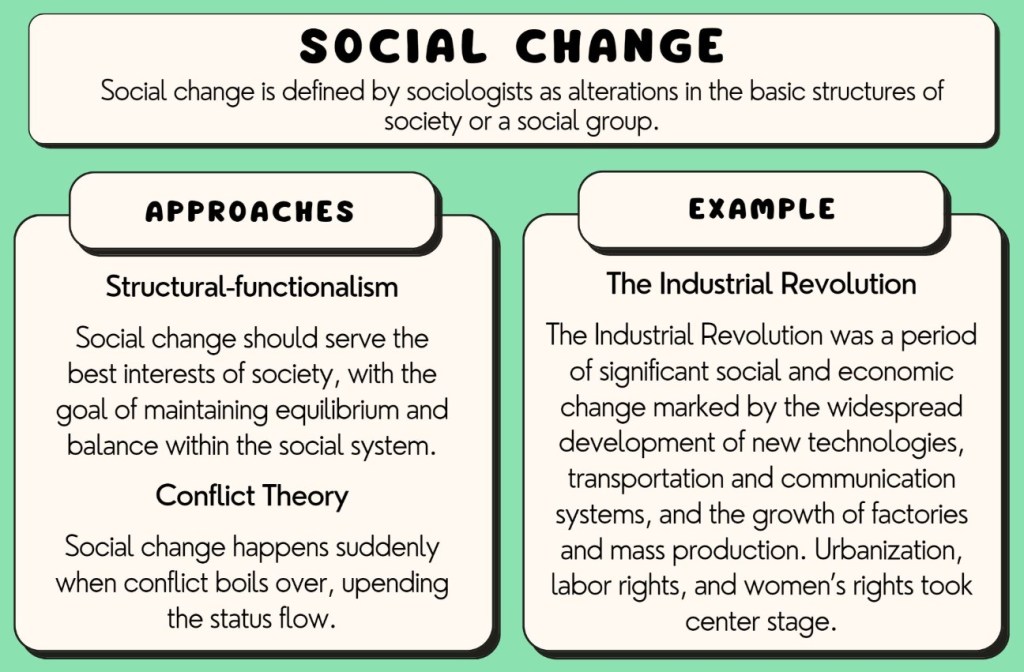
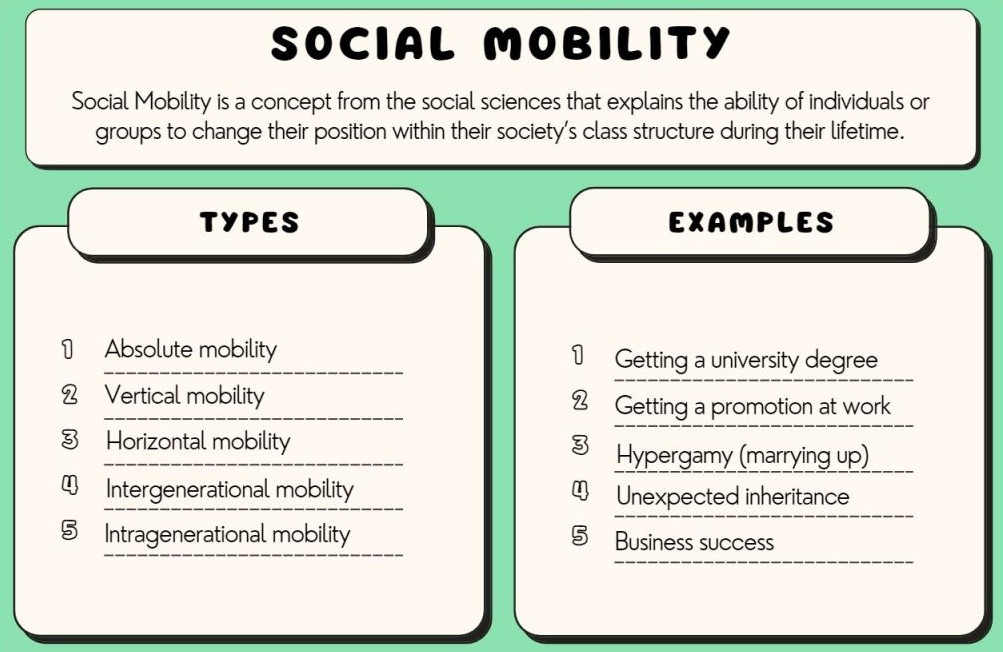


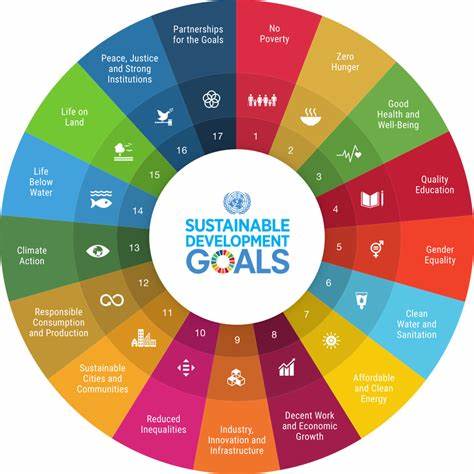


You must be logged in to post a comment.