Arithmetic, Geometrical, and Decadal Population Growth methods, including formulas and their interpretation. These are widely used techniques in demography and urban planning to estimate or analyze population growth trends.
1. Arithmetic Growth Method
โ Definition:
The Arithmetic growth method assumes that the population increases by a constant number of people every year. This method is suitable for short-term projections and when population growth is linear or slow.
โ Formula:
Where:
PtP_tPtโ = Projected population at time ttt
P0P_0P0โ = Base year population
rrr = Average annual increase in population
ttt = Number of years from base year
โ How to calculate r:
If data from two known years is available: r=PnโP0nr = \frac{P_n – P_0}{n}r=nPnโโP0โโ
Where:
PnP_nPnโ = Population at the end of nnn years
P0P_0P0โ = Initial population
nnn = Number of years between the two known populations
So, for 2015: P2015=50,000+(1,000ร15)=65,000P_{2015} = 50,000 + (1,000 \times 15) = 65,000P2015โ=50,000+(1,000ร15)=65,000
2. Geometric Growth Method
โ Definition:
In the Geometric growth method, the population increases at a constant rate (percentage) every year. Each yearโs increase is compounded on the previous year’s population. It follows exponential growth.
โ Formula:
Where:
PtP_tPtโ = Projected population at time ttt
P0P_0P0โ = Base year population
rrr = Annual growth rate (expressed as a decimal, e.g., 2% = 0.02)
The Decadal Growth Method calculates the percentage increase in population over a 10-year (decade) period. Itโs commonly used in census analysis to measure long-term growth trends.
โ Formula:
Where:
P0P_0P0โ = Population at the start of the decade
Chitra Vishwanath is a renowned Indian architect celebrated for her pioneering work in sustainable architecture, ecological planning, and the use of vernacular materials. Based in Bengaluru (Bangalore), Karnataka, she is the principal architect of Biome Environmental Solutions, a multidisciplinary firm that integrates architecture with ecological engineering. Through her practice, Chitra Vishwanath has become a leading figure in climate-responsive architecture, water-sensitive urban design, and resource-efficient housing in India.
๐ฉโ๐ Early Life and Education
Chitra Vishwanath was born in Kerala and raised in Delhi. She pursued architecture at the School of Architecture, CEPT University, in Ahmedabad, which is known for its strong foundation in climate-responsive and regional design. Her education and upbringing in different parts of India helped shape her sensitivity to the local climate, culture, and materials, which became central to her design philosophy.
Sustainability and Ecology: Her buildings minimize environmental impact and actively restore ecological balance.
Use of Local and Natural Materials: She is especially known for using mud (compressed earth blocks), stone, bamboo, and lime โ avoiding cement and synthetic materials when possible.
Water Conservation: She advocates rainwater harvesting, groundwater recharge, and wastewater recycling in all her designs.
Energy Efficiency: Her buildings use passive solar techniques, natural ventilation, and daylighting to reduce reliance on artificial systems.
Community-Centric Design: She promotes inclusive development, particularly focusing on rural areas and marginalized communities.
Integration of Architecture and Nature: Her projects blend seamlessly with the landscape and promote biodiversity.
Chitra believes in living what she designs, evident from her own mud house in Bengaluru, which functions entirely off-grid, harvests water, recycles waste, and exemplifies sustainable living.
๐ Key Projects and Contributions
1. Biome Environmental Solutions
Chitra is the principal architect and managing director of this interdisciplinary firm that works on architecture, ecological sanitation, rainwater harvesting, and landscape design. It brings together engineers, ecologists, planners, and architects.
2. Her Own Residence and Office (Bangalore)
Built using stabilized mud blocks (SMBs) made on site.
Includes solar power, composting toilets, rainwater harvesting, and greywater recycling.
It is both a living laboratory and an example of how urban households can be made sustainable.
3. Design of Eco-Sensitive Schools and Institutions
Has worked on designing rural schools, community centers, and institutions across Karnataka and Tamil Nadu.
Emphasis on low-cost, high-impact construction with natural cooling and ventilation.
4. Water Projects
Biome has undertaken urban water audits, lake rejuvenation, and rainwater harvesting systems across Bengaluru.
Worked with government agencies and citizen groups for sustainable urban water management.
๐ฟ Materials and Technology
Chitra Vishwanath is known for advocating and using the following materials:
Mud Blocks (Compressed Earth Blocks): Stabilized using minimal cement or lime, produced on-site.
Lime Plaster: Breathable, antibacterial, and low-carbon.
Bamboo: For structural and non-structural elements.
Stone and Terracotta: Locally sourced and culturally relevant.
Recycled and Upcycled Materials: Wherever possible, she incorporates reused wood, bricks, and other materials.
These materials are not just environmentally responsible but are also deeply connected to Indiaโs cultural heritage.
๐ Water and Sanitation Advocacy
Chitra and Biome are widely respected for their water literacy and rainwater harvesting efforts:
Helped design and implement over 1000+ rainwater harvesting systems in urban and rural settings.
Worked with public institutions, schools, and residential layouts.
Promotes the idea of zero-discharge campuses, where all water used is harvested, reused, and recycled.
๐งโ๐คโ๐ง Social Responsibility and Community Work
Chitra Vishwanath has been involved in:
Empowering local masons and artisans by training them in sustainable building techniques.
Supporting urban poor communities in developing affordable, safe, and eco-friendly housing.
Collaborating with NGOs, academic institutions, and government agencies on climate-resilient infrastructure.
๐ Recognition and Influence
While Chitra Vishwanath may not seek fame, her work has been widely recognized:
Invited Speaker at TEDx, design conferences, and architecture schools.
Featured in national and international platforms for her contributions to ecological architecture.
Recognized as a thought leader in sustainable design in India.
She continues to mentor young architects, emphasizing ethical practice, environmental stewardship, and contextual relevance.
๐ Publications and Advocacy
Chitra writes and speaks regularly on topics such as:
Mud architecture
Water conservation in urban planning
Sustainable living practices
Vernacular architecture in contemporary India
She strongly advocates that architects should be environmentalists, and that architecture should be part of the solution to Indiaโs climate and housing challenges.
๐ง Conclusion
Chitra Vishwanath stands out as a pioneer of sustainable and context-sensitive architecture in India. Her work goes beyond buildings โ she fosters ecosystems, empowers communities, and creates models for climate-resilient living. In a time when architecture is often driven by spectacle and commercial gain, Chitraโs work serves as a humble, powerful reminder of what architecture can and should do: serve people, respect nature, and nurture the planet.
Her lifeโs mission โ to build in harmony with nature and inspire others to do the same โ continues to influence urban designers, architects, ecologists, and changemakers across India and the world.
Ludwig Mies van der Rohe (1886โ1969) was a pioneering German-American architect and one of the most influential figures in modern architecture. Known for his minimalist approach, Mies is celebrated for his famous dictum “Less is more” and his commitment to clarity, simplicity, and modern materials like steel and glass. His designs emphasized open space, rational structures, and functionalism, and his work laid the foundation for what is now called the International Style in architecture.
๐ง Early Life and Background
Full Name: Maria Ludwig Michael Mies
Born: March 27, 1886, Aachen, Germany
Died: August 17, 1969, Chicago, USA
Mies was born into a family of stone masons, which exposed him early on to construction and craftsmanship. Though he had no formal architectural education, he gained experience working in his fatherโs workshop and later under established architects in Berlin, including Peter Behrens, a major figure in early modernism. At Behrensโ office, Mies worked alongside Walter Gropius and Le Corbusier โ all of whom would later define modernist architecture.
๐ Architectural Philosophy
๐น โLess is Moreโ
Mies championed minimalism, where every element has a clear function and unnecessary ornamentation is eliminated. His famous motto, “Less is more,” became a core principle of modernist design.
๐น Universal Space
He introduced the idea of universal spaceโopen, flexible floor plans made possible by modern structural techniques using steel frames and glass walls.
๐น Truth to Materials
Mies believed in expressing the true nature of materialsโsteel should look like steel, glass like glass. He did not try to disguise the materials but celebrated their essence.
๐น Architecture as Order
He viewed architecture as a disciplined expression of form and order, influenced by classical proportions and a rationalist approach.
๐ Key Projects
1. Barcelona Pavilion (1929)
Location: Barcelona, Spain
Built for: German Pavilion at the 1929 International Exposition
Style: Minimalist, open-plan space using glass, steel, and marble
Famous Furniture: The Barcelona Chair, designed with Lilly Reich
This iconic structure is a symbol of modernism and spatial purity. Though demolished after the exhibition, it was reconstructed in 1986 and is widely studied today.
2. Villa Tugendhat (1930)
Location: Brno, Czech Republic
A luxury private home that employed open-plan living and modern materials.
One of the first residential buildings to use a steel frame structure.
Famous for its large curved glass windows, onyx wall, and custom furniture.
3. Seagram Building (1958) (with Philip Johnson)
Location: New York City, USA
A landmark skyscraper that defines the International Style: sleek, rectilinear, and monumental.
Use of bronze-toned I-beams as decorative (but honest) elements on the facade.
Pioneered the idea of a public plaza in front of the building, influencing urban skyscraper design in America.
4. Farnsworth House (1951)
Location: Plano, Illinois, USA
A weekend retreat for Dr. Edith Farnsworth, a single-room glass house elevated on stilts.
Radical for its complete transparency and openness to nature.
Considered a masterpiece of modernist residential design.
5. Illinois Institute of Technology (IIT) Campus (1938โ58)
Mies was the head of the architecture department and designed many of the buildings on the campus.
The Crown Hall (1956), the architecture building, is especially famous for its steel and glass box design.
His work at IIT became a model for educational campuses worldwide.
๐ซ Role as Educator
Mies was a passionate teacher and a profound influence on architectural education:
Director of the Bauhaus (1930โ1933), Germanyโs most avant-garde design school, until it was closed by the Nazis.
Fled to the United States in 1937 and became head of the architecture school at Illinois Institute of Technology (IIT) in Chicago.
At IIT, he reformed the curriculum around modernist principles and trained a generation of influential architects.
โ๏ธ Move to the United States
Mies emigrated to the United States in 1937 due to increasing Nazi hostility toward modernist art and architecture, which they viewed as “degenerate.” In America, he found a new platform to experiment with skyscrapers, free plans, and industrial materials.
๐ Awards and Recognition
AIA Gold Medal (1960)
Royal Gold Medal by RIBA (1959)
Numerous buildings listed as historic landmarks
Widely recognized as one of the โBig Threeโ of modernism (with Le Corbusier and Gropius)
๐ Notable Contributions to Furniture Design
Mies also designed iconic modern furniture, often with his collaborator Lilly Reich, such as:
Barcelona Chair
Brno Chair
MR Lounge Chair
These pieces are celebrated for their elegance, simplicity, and use of modern materials like tubular steel and leather.
๐ Death and Legacy
Ludwig Mies van der Rohe died on August 17, 1969, in Chicago. His ashes were buried near the graves of his architect students at Graceland Cemetery.
Legacy:
Mies van der Roheโs International Style became the global language of corporate and institutional architecture from the 1950sโ1970s.
His designs inspired countless office buildings and skyscrapers around the world.
His clear, rational architectural grammar continues to influence architects today.
Museums, design schools, and architecture faculties continue to study his work and philosophy as foundational in modern architecture.
๐ง Conclusion
Ludwig Mies van der Rohe was a master of modernism โ a man who stripped architecture down to its essence and reshaped how we think about space, materials, and form. Whether through the clean lines of the Seagram Building or the transparent grace of the Farnsworth House, Mies created timeless works that emphasize order, openness, and honesty.
His legacy is immortalized not only in his buildings and furniture but also in his ideas, which remain a cornerstone of architectural thought across the globe. In every minimalist structure, in every glass-and-steel skyscraper, the influence of Mies can still be seen โ a testament to his enduring vision of โless is more.โ
Balkrishna Vithaldas Doshi (1927โ2023) โ affectionately known as B.V. Doshi โ was a visionary Indian architect whose work bridged the worlds of tradition and modernity, and played a transformative role in shaping post-independence Indian architecture. He is widely celebrated for his humane approach to design, commitment to sustainability, and dedication to social housing, education, and culture. As the first Indian architect to receive the Pritzker Architecture Prize in 2018, Doshiโs legacy extends beyond buildings to influence generations of architects and planners.
๐ง Early Life and Education
B.V. Doshi was born on August 26, 1927, in Pune, Maharashtra, into a family of furniture makers. His early exposure to craftsmanship and traditional Indian aesthetics would later shape his architectural philosophy.
He studied at the Sir J.J. School of Architecture in Mumbai. However, it was his time in Europe during the early 1950s that had a profound impact on his thinking. Doshi worked under the legendary modernist Le Corbusier in Paris and later in Chandigarh and Ahmedabad, where he supervised major projects. He also collaborated with Louis Kahn on the Indian Institute of Management (IIM) Ahmedabad.
๐ Architectural Philosophy
B.V. Doshiโs architecture was deeply rooted in Indian traditions, climatic responsiveness, social responsibility, and human-centric design. He was a pioneer of modern Indian architecture who adapted modernist principles to the Indian context, fusing them with local materials, construction techniques, and cultural motifs.
Key principles in Doshiโs work:
Synthesis of tradition and modernity
Use of natural light and ventilation
Community-focused spaces
Affordable and low-cost housing
Sustainability and local materials
Spatial hierarchy and interactivity
Celebration of courtyards, terraces, and verandas
๐ Major Works
1. Aranya Low-Cost Housing, Indore (1989)
One of Doshi’s most significant contributions to social housing.
Designed for economically weaker sections, Aranya consists of over 6,500 residences.
Encourages incremental growth, allowing families to expand or modify their homes.
Winner of the Aga Khan Award for Architecture (1995).
2. Indian Institute of Management (IIM), Bangalore (1977โ1992)
A sprawling campus of interlinked courtyards, stone corridors, and shaded walkways.
The design reflects ancient Indian temples and educational spaces, creating contemplative environments.
3. CEPT University, Ahmedabad (1966 onwards)
Doshi founded and designed the campus of Centre for Environmental Planning and Technology (CEPT).
A model of flexible, open, and democratic learning spaces.
Features exposed brickwork, natural light, and a strong sense of place.
4. Tagore Memorial Hall, Ahmedabad (1967)
Inspired by Indian temple architecture and brutalist aesthetics.
Known for its bold concrete forms and acoustics suitable for performing arts.
5. Amdavad ni Gufa (1995)
An underground art gallery built in collaboration with artist M.F. Husain.
Organic, cave-like forms with domes, mosaics, and undulating surfaces.
A symbolic fusion of art, architecture, and nature.
6. Sangath, Ahmedabad (1981)
Doshiโs own architectural studio.
โSangathโ means โmoving togetherโ in Sanskrit.
Built with sunken vaults, white mosaic surfaces, and shaded gardens, it reflects his approach to spatial experimentation and climate sensitivity.
๐ Awards and Recognition
Pritzker Architecture Prize (2018)
First Indian to win this prestigious award.
Jury citation praised Doshi for โalways designing for the backdrop of life… never architecture for architectureโs sake.โ
Royal Institute of British Architects (RIBA) Gold Medal (2022)
One of the worldโs highest honors in architecture, awarded for lifetime achievement.
Other Recognitions:
Padma Shri (1976)
Padma Bhushan (2020)
Aga Khan Award for Architecture (1995)
Numerous honorary doctorates and international acclaim
๐ Academic and Institutional Contributions
Founder of CEPT University, a leading institution for architecture and planning in India.
Taught and mentored generations of students.
Served on design committees for national policy on architecture and planning.
Advocated for architecture as a tool for social change.
๐ Writings and Influence
B.V. Doshi was a prolific speaker, thinker, and writer. His lectures, interviews, and writings reflect a deep philosophical engagement with architecture as a cultural, spiritual, and emotional practice.
His Work Emphasized:
Timelessness over trends
Contextual relevance over global styles
Joyful spaces that promote human interaction
Democracy in spatial design
The spiritual dimension of built form
๐ Death and Legacy
B.V. Doshi passed away on January 24, 2023, at the age of 95, in Ahmedabad. His passing marked the end of an era, but his ideas live on through his students, institutions, and built works.
Legacy Highlights:
Regarded as the father of modern Indian architecture
Celebrated globally as a humanist architect
Inspired new generations to design with empathy, humility, and sustainability
His buildings remain active, evolving spaces โ not static monuments
๐ง Conclusion
Balkrishna Vithaldas Doshi was more than an architect โ he was a philosopher, educator, and social reformer who believed in the power of design to improve lives. He showed the world how architecture could be deeply modern yet rooted in tradition; humble yet monumental; and sustainable yet imaginative.
Frank Lloyd Wright (1867โ1959) was one of the most influential and iconic architects of the 20th century. Known for developing the philosophy of organic architecture, he left behind a legacy that continues to shape the way we design homes, buildings, and spaces. Wright’s visionary designs integrated buildings with their environments, emphasized harmony between the natural world and the built form, and often broke conventional architectural norms.
๐งโ๐จ Early Life and Education
Frank Lloyd Wright was born on June 8, 1867, in Richland Center, Wisconsin, USA. His early life was marked by strong influences from both his parents:
His mother, Anna Lloyd Jones, believed he would become an architect and encouraged his development through Froebel education methods, which emphasized geometric forms and design.
His father, William Wright, was a preacher and musician. Though his parents divorced when Wright was young, their influence shaped his early thinking.
Wright never formally graduated from any architecture school. In 1887, he moved to Chicago during a construction boom and found work at the prestigious firm of Adler and Sullivan, where he apprenticed under Louis Sullivan, often called the “father of skyscrapers.” Sullivan’s philosophy of “form follows function” deeply influenced Wright.
Wright coined and championed the concept of organic architecture, which means that a building should:
Be integrated into its environment
Use local materials
Reflect the needs and nature of its inhabitants
Have fluid, open spaces
He believed that buildings should grow naturally from their surroundings, like a tree growing from the ground. This vision was not just aestheticโit was a response to industrialization, urban sprawl, and poor housing conditions.
๐ Major Works and Styles
1. Prairie Style (1900sโ1910s)
Wright developed the Prairie School of architecture, inspired by the flat, horizontal lines of the American Midwest landscape.
Features included low-pitched roofs, overhanging eaves, horizontal lines, and open floor plans.
Notable Prairie Houses:
Robie House (1909), Chicago, IL โ Considered a masterpiece of Prairie design.
Unity Temple (1905โ08), Oak Park, IL โ An early example of concrete used innovatively in architecture.
2. Usonian Houses (1930sโ1950s)
Designed as affordable housing for middle-class Americans during the Great Depression.
Usonian homes were single-story, L-shaped, had no basements or attics, and featured built-in furniture, radiant floor heating, and carports.
Notable Usonian Example:
Jacobs House (1937), Madison, WI โ The first true Usonian house.
3. Integration with Nature
Wright’s belief in harmony with nature reached its peak in his most famous work:
๐๏ธ Fallingwater (1935), Pennsylvania
A house built over a waterfall, with cantilevered balconies and local stonework.
Often cited as one of the greatest architectural works of the 20th century.
๐ Other Landmark Projects
๐ท Taliesin (1911โ1959)
Wrightโs own home and studio in Spring Green, Wisconsin.
Rebuilt several times after fires and constantly modified, it served as a testing ground for his ideas.
๐ท Taliesin West (1937)
Wrightโs winter home and architectural school in Scottsdale, Arizona.
Blended desert rock and wood, emphasizing the Southwestern environment.
๐ท The Guggenheim Museum (1959), New York
An iconic spiral-shaped art museum.
Designed to let visitors experience art in a continuous flow.
๐ Global Impact and Influence
Frank Lloyd Wright designed over 1,000 structures, of which around 532 were built. His work influenced generations of architects worldwide and continues to be studied for its innovation in:
Open floor planning
Structural engineering (e.g., cantilevers)
Use of natural light
Integration with landscape
Human-centric design
His disciples spread his ideas internationally, and the Taliesin Fellowship, which he founded in 1932, trained many architects who went on to successful careers.
๐ Awards and Recognition
Royal Institute of British Architects Gold Medal (1941)
American Institute of Architects Gold Medal (1949)
Named the “Greatest American Architect of All Time” by the AIA in 1991.
In 2019, eight of his buildings, including Fallingwater, Unity Temple, and the Guggenheim Museum, were inscribed on the UNESCO World Heritage List as โThe 20th-Century Architecture of Frank Lloyd Wright.โ
๐ Writings and Legacy
Wright was not only an architect but also a prolific writer and thinker. His works include:
“The Natural House” (1954) โ Outlined his vision for simple, sustainable homes.
“An Autobiography” (1932) โ A philosophical and detailed account of his life and work.
His legacy is preserved by:
The Frank Lloyd Wright Foundation
The Taliesin Preservation
Numerous museums, archives, and tours around his built works.
โฐ๏ธ Death and Final Years
Frank Lloyd Wright passed away on April 9, 1959, at the age of 91. He was active in architectural work until the end of his life, leaving behind unfinished designs and a rich architectural philosophy that redefined modern architecture.
๐ Conclusion
Frank Lloyd Wright was more than just an architectโhe was a cultural figure who reshaped how we think about space, nature, and design. His organic philosophy of building harmoniously with the environment, combined with his innovative use of space, light, and materials, made him a pioneer of modern architecture. His ideas continue to inspire architects and environmental designers around the globe, underscoring the timelessness of his vision.
A literature review is a critical component of any research study. It helps in understanding existing knowledge, identifying research gaps, and building a theoretical foundation for new investigations. Over time, various methods and frameworks have been developed to conduct literature reviews more systematically and transparently. Here are some of the key techniques:
1. Traditional Literature Survey (Narrative Review)
Overview:
Also called narrative review, this is the most conventional and flexible approach.
Involves summarizing and synthesizing existing literature based on the author’s subjective selection.
Key Features:
Broad overview of a topic.
Thematic or chronological organization.
Focuses on theoretical perspectives, concepts, and debates.
Strengths:
Useful for conceptual exploration or theoretical discussions.
Allows interpretation and critical thinking.
Limitations:
No formal methodology, making it prone to bias.
Less reproducible and transparent compared to systematic reviews.
2. Systematic Literature Review (SLR)
Overview:
A rigorous and structured method to review literature.
Seeks to identify, evaluate, and synthesize all relevant studies on a specific topic or question.
Steps Involved:
Define a research question.
Develop inclusion/exclusion criteria.
Conduct systematic searches in databases.
Screen titles, abstracts, and full texts.
Extract data and analyze findings.
Strengths:
Reproducible and transparent.
Minimizes bias.
Suitable for evidence-based research.
Limitations:
Time-consuming and complex.
May exclude qualitative insights.
Use Cases:
Medicine, education, social sciences, and policy-making.
3. PRISMA (Preferred Reporting Items for Systematic Reviews and Meta-Analyses)
Overview:
PRISMA is a reporting framework, not a review method per se.
It provides a checklist and flow diagram to enhance the transparency and quality of systematic reviews and meta-analyses.
A structured model for literature reviews introduced by Booth et al.
Balances systematic rigor with flexibility.
Components:
Search: Identify literature using keywords, databases, and grey literature.
Appraisal: Evaluate the quality, relevance, and rigor of each study.
Synthesis: Group, compare, and contrast findings.
Analysis: Interpret results, identify gaps, and derive implications.
Strengths:
Allows a structured yet adaptable approach.
Suitable for both qualitative and quantitative studies.
Limitations:
Still requires researcher judgment for synthesis and analysis.
Use Cases:
Useful for interdisciplinary research, education, and social sciences.
5. Scoping Review
Overview:
Explores the extent, range, and nature of research on a topic.
Often used to map evidence and identify gaps.
Key Features:
Broad focus.
No detailed quality appraisal (unlike systematic reviews).
May include grey literature.
Strengths:
Great for exploratory purposes.
Helps formulate precise research questions.
Limitations:
May lack depth in synthesis.
Does not usually assess study quality.
Use Cases:
Preliminary stage of large projects or policy development.
6. Meta-Analysis
Overview:
A quantitative extension of a systematic review.
Combines statistical data from multiple studies to calculate a pooled effect size.
Key Features:
Requires studies with similar designs and measurable outcomes.
Provides numerical summary of evidence.
Strengths:
Increases statistical power.
Helps in confirming patterns.
Limitations:
Not suitable for qualitative data.
Requires statistical expertise.
7. Meta-Synthesis
Overview:
A technique to integrate and interpret qualitative research findings.
Focuses on themes and conceptual models.
Strengths:
Deepens understanding of human experiences and perceptions.
Useful in social sciences and humanities.
Limitations:
Subjective interpretation.
Cannot be generalized statistically.
8. Rapid Review
Overview:
A time-efficient alternative to systematic reviews.
Uses streamlined methods for quick evidence synthesis.
Strengths:
Faster and less resource-intensive.
Useful for policy or urgent decision-making.
Limitations:
May compromise rigor and comprehensiveness.
9. Integrative Review
Overview:
Integrates data from both experimental and non-experimental studies.
Synthesizes past empirical and theoretical literature.
Strengths:
Offers a comprehensive understanding of complex phenomena.
Flexible and inclusive.
Limitations:
Requires careful organization and strong justification.
๐ Comparison of Major Review Techniques
Technique
Scope
Rigor
Time Needed
Suitable For
Narrative Review
Broad
Low
Short
General understanding
Systematic Review
Focused
High
Long
Evidence-based studies
PRISMA
Focused
Very High
Long
Medical/social science reviews
SALSA
Moderate
Medium
Moderate
Thematic reviews, education
Scoping Review
Broad
Medium
Moderate
Mapping literature
Meta-Analysis
Narrow
Very High
Long
Quantitative studies
Meta-Synthesis
Narrow
Medium
Long
Qualitative research
Rapid Review
Focused
Medium
Short
Time-sensitive topics
Integrative Review
Moderate
Medium
Moderate
Mixed-methods synthesis
โ๏ธ Conclusion
Choosing the right literature review technique depends on your research objectives, available time, field of study, and type of data. For a basic understanding, a narrative review may suffice, while a systematic or PRISMA-guided review is essential for evidence-based disciplines. Methods like SALSA, scoping reviews, and meta-syntheses offer flexible and in-depth alternatives for complex or interdisciplinary topics.
Each technique, when used properly, strengthens the foundation of your research and enhances the quality and credibility of your academic work.
References
Dehalwar, K., & Sharma, S. N. (2023).ย Fundamentals of research writing and uses of research methodologies. Edupedia Publications Pvt Ltd.
Sharma, S. N., & Dehalwar, K. (2025). A Systematic Literature Review of Transit-Oriented Development to Assess Its Role in Economic Development of City.ย Transportation in Developing Economies,ย 11(2), 23.
Sharma, S. N., & Dehalwar, K. (2024). Review of Evergreen ILS: Highly-Scalable Open Source Library Management Solution.ย Available at SSRN 4853757.
Sharma, S. N., & Dehalwar, K. (2025). Assessing the Transit-Oriented Development and Travel Behavior of the Residents in Developing Countries: A Case of Delhi, India.ย Journal of Urban Planning and Development,ย 151(3), 05025018.
Sharma, S. N. (2024). Understanding Scientometric Analysis: Applications and Implications.Track2Training
Sharma, S. N. (2018). Review of National Urban Policy Framework 2018.ย Think India Journal,ย 21(3), 74-81.
Sharma, S. N., Singh, D., & Dehalwar, K. (2024). Surrogate safety analysis-leveraging advanced technologies for safer roads.ย Suranaree Journal of Science and Technology,ย 31(4), 010320.
Dehalwar, K., & Sharma, S. N. (2024). Social Injustice Inflicted by Spatial Changes in Vernacular Settings: An Analysis of Published Literature.
VOSviewer (Visualization of Similarities Viewer) is a widely used software tool for constructing and visualizing bibliometric networks. Developed by Nees Jan van Eck and Ludo Waltman at the Centre for Science and Technology Studies (CWTS) of Leiden University, the Netherlands, VOSviewer plays a crucial role in conducting systematic and in-depth literature reviews by enabling researchers to analyze large volumes of scientific data from databases like Scopus, Web of Science, and Dimensions.
Key Features of VOSviewer
Network Visualization
Visualizes bibliometric networks such as:
Co-authorship (authors, institutions, countries)
Co-citation (authors, sources)
Bibliographic coupling
Co-occurrence of keywords or terms
Text Mining
Extracts important terms from the titles and abstracts of scientific articles.
Useful for identifying emerging trends and patterns in specific research fields.
Interactive Visual Maps
Nodes (items) represent units like authors or terms.
Edges (links) show relationships like citation or co-occurrence.
Color, size, and distance indicate clusters, strength of connections, and relevance.
Clustering
Groups related items together using clustering algorithms.
Helps to understand the structure and thematic areas of the research domain.
Ease of Use
Simple interface with support for large-scale data.
Export and integration options for further analysis.
Why Use VOSviewer for Literature Review?
Conducting a literature review involves analyzing, synthesizing, and identifying gaps in existing research. VOSviewer enhances this process in the following ways:
1. Mapping Research Trends
Identifies frequently occurring keywords and their interrelationships.
Detects emerging research topics and how they have evolved over time.
2. Identifying Influential Authors and Journals
Through co-citation and bibliographic coupling, VOSviewer highlights leading contributors and key sources in a field.
3. Cluster Analysis for Thematic Categorization
Helps categorize literature into coherent themes.
Facilitates systematic classification and thematic discussion.
4. Detecting Research Gaps
By visually analyzing clusters and isolated nodes, researchers can identify under-researched areas.
5. Efficient and Scalable Analysis
Handles large datasets (thousands of articles) quickly.
Reduces manual effort in reviewing vast literature.
Steps to Use VOSviewer in Literature Review
Data Collection
Export bibliographic data (in RIS, CSV, or BibTeX format) from databases like:
Scopus
Web of Science
Dimensions
CrossRef
PubMed (indirectly through conversion)
Data Preprocessing
Clean and filter data to avoid duplication and irrelevant entries.
Use VOSviewerโs thesaurus file to merge similar terms (e.g., “AI” and “Artificial Intelligence”).
Import into VOSviewer
Choose the appropriate analysis type (co-authorship, co-occurrence, citation, etc.)
Select items and thresholds (e.g., minimum number of occurrences)
Visualization and Interpretation
Explore clusters, link strengths, and node proximities.
Analyze based on size, color coding (e.g., citation impact, publication year), and linkages.
Reporting
Take screenshots or export visualizations.
Include maps in your literature review to support your narrative.
Example Use Case: Literature Review on Artificial Intelligence in Education
Author Co-citation Map identifies leading researchers in the domain.
Temporal Analysis (color by year) shows how the field evolved, e.g., shift from adaptive learning to generative AI.
Limitations of VOSviewer
Limited to bibliometric and text-based data; cannot assess article quality.
Interpretation requires domain knowledge to avoid misrepresentation.
Doesn’t support data from Google Scholar due to export limitations.
Lacks in-depth statistical tools (needs to be combined with R, Python, or Bibliometrix for advanced analysis).
Integration with Other Tools
Can be combined with Bibliometrix (R package) or CiteSpace for deeper bibliometric or citation analysis.
Works well alongside NVivo or ATLAS.ti for qualitative review.
Conclusion
VOSviewer is an essential tool for researchers undertaking systematic, scoping, or narrative literature reviews. By enabling visualization of the intellectual structure of a research field, it transforms complex bibliographic data into understandable patterns. Whether mapping keyword trends, identifying top authors, or classifying research themes, VOSviewer adds scientific rigor and clarity to literature reviews.
References
Dehalwar, K., & Sharma, S. N. (2023).ย Fundamentals of research writing and uses of research methodologies. Edupedia Publications Pvt Ltd.
Sharma, S. N., & Dehalwar, K. (2025). A Systematic Literature Review of Transit-Oriented Development to Assess Its Role in Economic Development of City.ย Transportation in Developing Economies,ย 11(2), 23.
Sharma, S. N., & Dehalwar, K. (2024). Review of Evergreen ILS: Highly-Scalable Open Source Library Management Solution.ย Available at SSRN 4853757.
Sharma, S. N., & Dehalwar, K. (2025). Assessing the Transit-Oriented Development and Travel Behavior of the Residents in Developing Countries: A Case of Delhi, India.ย Journal of Urban Planning and Development,ย 151(3), 05025018.
Sharma, S. N. (2024). Understanding Scientometric Analysis: Applications and Implications.Track2Training
Sharma, S. N. (2018). Review of National Urban Policy Framework 2018.ย Think India Journal,ย 21(3), 74-81.
Sharma, S. N., Singh, D., & Dehalwar, K. (2024). Surrogate safety analysis-leveraging advanced technologies for safer roads.ย Suranaree Journal of Science and Technology,ย 31(4), 010320.
Dehalwar, K., & Sharma, S. N. (2024). Social Injustice Inflicted by Spatial Changes in Vernacular Settings: An Analysis of Published Literature.
Van Eck, N. J., & Waltman, L. (2010). Software survey: VOSviewer, a computer program for bibliometric mapping. Scientometrics, 84(2), 523โ538. https://doi.org/10.1007/s11192-009-0146-3
Natural disasters, especially floods, are increasingly affecting vulnerable communities around the world, and children are often the most impacted. In India, recurrent flooding in states like Assam, Bihar, Odisha, and Kerala has had devastating effects on educational continuity and early childhood care. Schools and Anganwadisโintegral to child development and learningโare frequently damaged or disrupted. This underscores the urgent need to adopt child-centric Disaster Risk Reduction (DRR) strategies and build resilient educational and care infrastructure in flood-prone zones.
1. Why Child-Centric DRR Matters
Children are not just passive victims of disastersโthey are active stakeholders whose rights to safety, education, and well-being must be protected. Child-centric DRR:
Recognizes the unique vulnerabilities of children.
Focuses on minimizing disruption to learning and care.
Ensures childrenโs voices are included in planning and preparedness.
Enhances psychological and social resilience through supportive environments.
2. Understanding the Risk: Flood Impacts on Schools and Anganwadis
Floods affect educational institutions in several ways:
Structural damage: Buildings collapse or become unusable due to waterlogging.
Learning loss: Closure of facilities causes prolonged interruption of education.
Health risks: Unsanitary conditions lead to disease outbreaks among children.
Psycho-social trauma: Exposure to disaster causes long-term mental health issues in children.
Anganwadis, which serve children aged 0โ6 years, are even more vulnerable due to their location in community buildings and limited funding for resilient infrastructure.
3. Principles for Building Resilient Schools and Anganwadis
a. Location and Site Planning
Avoid constructing in low-lying or floodplain areas.
Use GIS-based hazard mapping to identify safe zones.
Raise plinth levels and construct on stilts or elevated platforms in high-risk areas.
b. Climate-Resilient Infrastructure
Use flood-resistant materials and designs that allow for quick drying and easy cleaning.
Ensure robust drainage systems to prevent water stagnation.
Install rainwater harvesting and water purification units to ensure safe drinking water post-disaster.
c. Multipurpose Use and Community Integration
Design schools and Anganwadis as community disaster shelters.
Include safe storage spaces for learning materials and emergency kits.
Ensure inclusive design for children with disabilities.
d. Green and Safe Spaces
Create safe outdoor play areas with flood-tolerant landscaping.
Include kitchen gardens and child-friendly environments to support nutrition and well-being.
4. Institutional and Capacity Strengthening
a. School and Anganwadi Disaster Management Plans (DMPs)
Prepare child-friendly DMPs that involve children in evacuation drills and safety education.
Form School Safety Committees and link them with local DRR bodies.
b. Training and Sensitization
Train Anganwadi workers and teachers in first aid, child protection, and psychological first aid.
Conduct regular mock drills and safety education activities for children.
c. Interdepartmental Coordination
Ensure collaboration between education, women and child development, disaster management, and public works departments.
Leverage schemes like the National Disaster Response Fund (NDRF) or District Mineral Funds for resilient infrastructure.
5. Technology and Innovation in Resilience Building
Use digital early warning systems to alert institutions in advance of floods.
Implement e-learning solutions and mobile education units for continued access during displacement.
Deploy solar-powered lights and communication tools in remote areas.
6. Case Studies and Best Practices
a. Biharโs Flood-Resistant Schools
In flood-prone districts of Bihar, UNICEF and local authorities piloted raised school buildings with floating furniture and elevated storage. This helped ensure continuity of learning even during monsoon floods.
b. Keralaโs Multi-Hazard Resilient Anganwadis
Post-2018 floods, Kerala redesigned Anganwadis with elevated foundations, emergency kits, and community awareness components.
c. Assamโs Child-Friendly DRR Initiatives
NGOs partnered with local governments to train children in flood preparedness, build child-centric evacuation plans, and provide psychosocial care post-disaster.
7. Policy and Financing Support
Incorporate DRR in National Education Policy and Integrated Child Development Services (ICDS) guidelines.
Allocate dedicated budget lines for school and Anganwadi resilience in disaster-prone districts.
Tap into CSR funds, state disaster mitigation funds, and international climate financing.
8. Moving Forward: Strategic Recommendations
Mainstream DRR in education and childcare planning at all levels.
Promote community-led infrastructure design for better acceptance and sustainability.
Ensure every new Anganwadi and school in flood zones is built with resilience as a core component.
Empower children as DRR ambassadors through age-appropriate education and participation.
Build evidence and data systems for monitoring school safety and child well-being during disasters.
Resilient schools and Anganwadis are not just about bricks and mortarโthey are about protecting futures. By embedding child-centric DRR in the planning, design, and operation of these institutions, we can ensure that every flood or disaster becomes a moment of learning, not loss. Investing in such resilience is not only a humanitarian imperative but also a foundational step toward sustainable development and child rights protection.
Population projection is an essential tool in demography, urban planning, public health, and economic forecasting, as it estimates future population size and structure. Among the many projection techniques, the Survival Method is one of the most widely used for medium- to long-term projections because it incorporates age- and sex-specific survival rates and accounts for births, deaths, and migration.
The Survival Method is particularly important when a planner needs age-structured projections for policy formulation, resource allocation, and infrastructure planning.
2. Concept of the Survival Method
The Survival Method projects the population by following each cohort (a group of people born in the same year or period) over time and applying survival rates to estimate how many people remain in that cohort in future years.
The method is called โsurvivalโ because:
It uses life tables or survival ratios to determine what proportion of a cohort will survive to the next age group in the next projection period.
It moves each age cohort forward through time, reducing it according to mortality, and adding new births for the youngest cohort.
3. Data Requirements
To apply the Survival Method, the following data are typically needed:
Base-Year Population Data
Classified by age and sex.
Usually obtained from a census or population register.
Survival Ratios / Life Tables
Probability of surviving from one age group to the next over a given time interval.
Derived from mortality rates, adjusted for the local population.
Fertility Rates (for projecting new births)
Age-specific fertility rates (ASFRs) for females in childbearing ages (usually 15โ49 years).
Migration Data
Estimates of net migration by age and sex, if applicable.
4. Step-by-Step Procedure
Step 1: Prepare Base-Year Age-Sex Population
Organize the population into standard 5-year age groups (0โ4, 5โ9, 10โ14, โฆ, 80+), separated by male and female.
Step 2: Obtain Survival Ratios
From life tables, determine the proportion of people who survive from one age group to the next over the projection interval (e.g., 5 years).
Example: If the survival ratio from age 10โ14 to age 15โ19 is 0.98, it means 98% of those aged 10โ14 will survive to the 15โ19 group after 5 years.
Step 3: Apply Survival Ratios to Cohorts
Multiply each cohort by the corresponding survival ratio to get the population in the next age group for the next projection period.
Example: Base-year population (age 10โ14): 20,000 Survival ratio to age 15โ19: 0.98 Projected 15โ19 age group (next period) = 20,000 ร 0.98 = 19,600.
Step 4: Project the Youngest Age Group (Births)
Calculate expected births during the projection period using age-specific fertility rates and the projected number of women in childbearing ages.
Example:
ASFR for women aged 20โ24 = 0.08 (meaning 80 births per 1,000 women over the 5-year period).
Multiply ASFR by the number of women in that age group.
Sum births across all childbearing age groups to get total births.
Apply infant and child survival ratios to estimate how many survive to age 0โ4 in the next period.
Step 5: Adjust for Migration (If Applicable)
Add or subtract net migration by age group before moving to the next projection cycle.
Step 6: Repeat for Each Projection Interval
Continue moving cohorts forward for each projection period until the desired future year is reached.
5. Example (Simplified)
Base-Year Population (2025) โ Males Only:
Age Group
Population
Survival Ratio
Projected Pop. (2030)
0โ4
10,000
0.995
(Births projected)
5โ9
9,800
0.995
9,751
10โ14
9,500
0.990
9,405
15โ19
9,200
0.985
9,062
…
…
…
…
For the 0โ4 age group in 2030, births are calculated based on projected women in reproductive ages and then multiplied by infant/child survival ratios.
6. Advantages of the Survival Method
Age-specific projection: Produces detailed breakdowns by age and sex.
High accuracy for medium-term projections (10โ30 years) when data are good.
Can incorporate fertility, mortality, and migration separately.
Useful for planning schools, hospitals, housing, pensions, etc.
7. Limitations
Requires reliable and detailed data (age-sex population, life tables, fertility rates).
Less accurate for small populations due to statistical fluctuations.
Long-term projections (>40 years) may be less reliable because fertility, mortality, and migration trends can change unexpectedly.
More complex than simple growth rate methods.
8. Applications
Urban planning โ predicting future demand for housing and infrastructure.
Health planning โ estimating needs for hospitals and elderly care.
Education planning โ forecasting school enrollment.
Labour market forecasting โ anticipating changes in the working-age population.
Social security and pension planning โ understanding aging trends.
โ In short, the Survival Method (Cohort-Survival) is a systematic way to move each age cohort forward in time, adjusting for mortality, fertility, and migration, to produce age-structured, sex-specific population projections. Its strength lies in its demographic realism and policy relevance, making it a standard in official statistical agencies and planning institutions.
Choosing a thesis topic is one of the most important decisions in a studentโs academic journey, as it shapes the direction of your research, determines the skills youโll develop, and often influences your career opportunities. A good thesis topic should balance personal interest, academic significance, feasibility, and originality. Below is a detailed step-by-step guide on how to choose the right thesis topic.
1. Understand the Purpose of a Thesis
Before choosing a topic, you must be clear about why you are writing a thesis:
To demonstrate your ability to conduct independent research.
To contribute new knowledge or insights in your field.
To develop critical thinking, problem-solving, and writing skills.
To strengthen your academic profile for future studies or employment.
A thesis is not just a large assignmentโitโs your opportunity to show mastery of your discipline.
2. Identify Your Interests
The most successful thesis topics are ones you are genuinely curious about.
List your favorite subjects from your coursework.
Think about topics you enjoy reading or talking about.
Reflect on any personal or professional experiences that inspire questions.
๐ Tip: Passion alone is not enough; your topic must also be academically valuable and researchable.
3. Review the Current Literature
Conduct a preliminary literature review to understand:
What has already been studied.
Which research gaps still exist.
Current debates, trends, or emerging fields in your area.
Use Google Scholar, Scopus, Web of Science, and university databases to explore:
Key authors and landmark studies.
Popular methodologies.
Areas lacking recent research.
4. Consider Feasibility
Your thesis topic must be realistic given your:
Timeframe (usually 6 monthsโ2 years).
Available resources (equipment, software, datasets).
Access to data and participants (if empirical research).
๐ Example: If you have only 6 months, choosing a large-scale international survey might be unrealistic.
5. Align with Your Academic and Career Goals
Ask yourself:
Does this topic align with my specialization?
Will it strengthen my profile for further studies or a specific job?
Can it lead to publishable research or conference presentations?
Will it help me build a network in my desired industry or field?
6. Check for Originality and Contribution
A good thesis should add something new to the field. Originality can mean:
Studying an under-researched population.
Applying an existing theory to a new context.
Using a novel methodology.
Combining two fields in an interdisciplinary way.
Avoid topics that are too broad or too narrow:
Too broad: “Climate Change” โ impossible to cover in one thesis.
Too narrow: “Impact of Rainfall on Mango Tree in One Village in May 2024” โ limited scope and relevance.
7. Discuss with Advisors and Peers
Seek feedback from:
Your thesis supervisor (they can guide scope, relevance, and feasibility).
Other faculty members in your department.
Peers who have completed their thesis.
Industry professionals if your topic is applied research.
They can:
Suggest literature you may have missed.
Warn about potential challenges.
Help refine your research question.
8. Narrow Down and Define Your Research Question
Once you have a broad area of interest:
Brainstorm possible angles within that area.
Ask a specific question your thesis will answer.
Ensure it is clear, focused, and researchable.
๐ Example Progression:
Broad area: Sustainable urban transport.
Narrower: Electric buses in metropolitan cities.
Final question: “What are the economic and environmental impacts of replacing diesel buses with electric buses in Delhi?”
9. Test Your Topic Against Key Criteria
Before finalizing, check if your topic is:
Relevant to your field.
Interesting to you and your audience.
Original in contribution.
Feasible in time, resources, and data availability.
Clear and specific in scope.
Ethically acceptable (especially if involving human participants).
10. Be Flexible
Research is unpredictableโdata might be unavailable, or results may not support your hypothesis. Choose a topic that allows for adjustments without losing its core value.
Common Mistakes to Avoid
โ Choosing a topic only because itโs โeasyโ or โpopular.โ โ Picking something too broad to manage. โ Ignoring resource or data limitations. โ Failing to check if the topic has already been over-researched. โ Selecting a topic youโre not personally interested in.
Conclusion
Choosing a thesis topic is a strategic decision that requires balancing personal interest, academic value, feasibility, and originality. Start early, explore broadly, seek feedback, and refine your idea into a clear research question. The right topic will not only make your thesis journey smoother but also set a strong foundation for your academic and professional future.
India has no single comprehensive urbanization policy document, but multiple initiatives, programmes, and committees have shaped the approach:
First & Second Five-Year Plans (1951โ61): Focus on rural development, little attention to cities.
Third & Fourth Plans (1961โ74): Recognition of rapid urban growth, emergence of metropolitan planning.
National Commission on Urbanisation (NCU, 1986): Landmark effort; stressed strengthening of small and medium towns, reducing pressure on metros, and promoting balanced regional growth.
Post-1990s (Economic Liberalization): Market-driven urbanization, rise of SEZs, industrial corridors.
โ In summary: Indiaโs urbanization policy has evolved gradually, but challenges persist. The basic issues revolve around imbalanced growth, inadequate housing & infrastructure, weak governance, and environmental degradation. A comprehensive National Urbanization Policy should address these with integrated planning, inclusive strategies, and sustainable urban growth models.
ATAL Academy stands for AICTE Training and Learning Academy. It is an initiative of the All India Council for Technical Education (AICTE) launched in 2018 to improve the quality of technical education in India by building capacities of teachers, researchers, and technical staff through short-term Faculty Development Programmes (FDPs) in emerging and relevant domains. The Academyโs aim is to support institutions in fostering research, innovation, and entrepreneurship by upskilling faculty with contemporary knowledge, pedagogy, and hands-on exposure. JIIT
(Note: ATAL Academy is distinct fromโbut complementary toโthe Atal Innovation Mission (AIM) under NITI Aayog, which focuses on broader innovation ecosystems like Atal Tinkering Labs and incubation. The ATAL FDPs are specifically faculty capacity-building via AICTE.)Eduindex News
2. Objectives
The core objectives of ATAL Academy FDPs are to:
Impart quality training in emerging areas of technology and pedagogy to faculty and technical staff.
Enhance teaching and research capabilities in institutions to align with evolving academic and industry trends.
Promote innovation and entrepreneurship mindset through exposure to new tools, interdisciplinary themes, and best practices.
Create a nationwide reach, including remote and underrepresented regions, by funding and supporting FDPs across India.
Enable networking and collaboration among academicians, researchers, and industry experts. JIITEduindex News
3. Course Categories and Structure (2025โ26)
For the academic year 2025โ26, the ATAL Academy FDPs are divided mainly into two categories: JIIT
Basic FDPs โ Typically 6 days long.
Grant-in-aid: โน3,50,000 per approved programme.
Advanced FDPs โ Typically 12 days long.
Grant-in-aid: โน6,00,000 per approved programme.
Both are conducted in offline mode (with separate provisions for online FDPs outlined in their scheme documents), and are meant to cover frontier topics in engineering, management, architecture, design, sciences, and allied technical areas. JIIT
There are separate scheme documents for online FDPs (e.g., six-day online programmes) with their own guidelines, eligibility, minimum participant thresholds, and funding ceilings, reflecting adaptation post-COVID to digital delivery. Scribd
4. Proposal Submission and Approval Process
Who Can Propose: Faculty from AICTE-approved institutions (engineering, management, architecture, pharmacy, etc.) act as coordinators and submit proposals on behalf of their institutes through the ATAL Academy online portal. JIIT
Portal & Registration: Coordinators and participants register at the official ATAL Academy portal. Faculties must fill institutional details, upload necessary documents (e.g., ID, NOC), and submit the FDP proposal in the prescribed format. mitfgc.in
Limits & Restrictions:
Institutes that were awarded consecutively in earlier years may have restrictions (e.g., those awarded in both 2023โ24 and 2024โ25 may not be considered for 2025โ26 in some categories).
Coordinators who already had FDPs in 2024โ25 may be ineligible for selection in 2025โ26 for the same category. JIIT
Selection: Submitted proposals are evaluated per scheme guidelines; shortlisted programmes receive sanction orders. For online FDPs, there are additional conditions like minimum participant numbers and coordinator experience criteria. Scribd
5. Funding and Financial Support
Grant-in-Aid: As noted, approved offline Basic and Advanced FDPs receive fixed grants (โน3,50,000 and โน6,00,000 respectively). JIIT
Online FDPs: Funding details differ (e.g., specified ceiling of around โน1,00,000 for certain six-day online programmes) with guidelines to cover resource persons, platform management, and administration. Scribd
No Participant Fees: ATAL FDPs are generally free for participants; no fee is charged from attending faculty or students in approved programmes. smec.ac.in
6. Eligibility and Roles
Coordinators: Usually faculty members with requisite teaching/industry experience (details vary between online vs offline schemes), responsible for designing the course, securing resource persons, and overall execution. Scribd
Participants: Faculty, researchers, and technical staff from AICTE-approved institutions; sometimes open to others based on the specific FDP advertisement. Selection is often first-come-first-served or as per the brochureโs criteria. smec.ac.in
Resource Persons: Experts in the thematic areaโoften drawn from academia, research organizations, or industryโwho deliver the content of the FDP. Eduindex News
7. Delivery Modes
Offline FDPs: Conducted in-person at host institutions, structured over multiple days with lectures, hands-on sessions, interactions, and project/case study components as per the theme. JIIT
Online FDPs: Designed to leverage digital platforms, including live sessions, recorded content, and virtual interaction; the online scheme emphasizes adaptability to rapid changes and broader reach. Scribd
8. Logistics, Certification, and Follow-up
Logistics: Host institutions are expected to manage venue, scheduling, resource-person coordination, and participant communication. Online FDPs require platform setup, digital attendance mechanisms, and content management systems. Scribd
Certification: Participants who fulfill attendance and assessment criteria receive certificates of participation/completion from ATAL Academy. smec.ac.in
Feedback & Reporting: Feedback collection and submission of post-programme reports are mandatory for closure and future eligibility. Scribd
9. Benefits
For Faculty/Participants: Exposure to updated and emerging technical knowledge, pedagogical enhancement, networking, and potential research/industry collaborations. Eduindex News
For Host Institutions: Capacity building of their teaching/research staff, elevation in academic quality, visibility through high-quality thematic programmes. JIIT
10. Recent and Live Examples (2025)
Numerous FDPs are ongoing or recently conducted in 2025 on specialized topics (e.g., AI-embedded precision farming, circular economy themes, biomaterials for tissue engineering, etc.), showing active implementation and thematic diversity. indianresearchers.comAnnamacharya University –
The portal for 2025โ26 shows that the list of accepted offline and online FDPs is released and open for participant applications. atalacademy.aicte.gov.in
11. Actionable Steps to Engage
To Propose/Host an ATAL FDP:
Select a timely and high-impact theme aligned with emerging technology or pedagogy. Scribd
Register as coordinator on the ATAL Academy portal and prepare the proposal per the scheme document (basic vs advanced or online). JIITmitfgc.in
Finalize resource persons, prepare detailed curriculum/brochure, and submit before the specified deadlines. Scribd
Upon approval, promote the programme, manage logistics, collect feedback, and submit final reports. Scribd
To Participate:
Monitor the ATAL Academy portal or specific host institute announcements for open registrations; register early (often first-come-first-served). smec.ac.in
12. Comparison (briefly vis-ร -vis similar schemes)
Unlike GIAN which brings international experts for short-term credit-bearing courses with foreign faculty engagement, ATAL FDPs are capacity-building programmes primarily for Indian faculty/staff to upgrade skills in emerging areas through funded, often free, training. JIITEduindex News
Summary
ATAL Academyโs FDPs are structured, funded faculty upskilling programmes under AICTE aimed at strengthening technical education and research ecosystem in India. They include both offline (basic and advanced) and online formats, have concrete grant support, clear eligibility and proposal procedures, and are actively being rolled out in 2025 with diverse thematic offerings. JIITScribdatalacademy.aicte.gov.in
Influenced deeply by Mahatma Gandhiโs philosophy, he consciously chose a path of simplicity, service, and local resilience in architecture Hindustan Times.
Lived in north Indiaโs Pithoragarh region from 1948 to 1963, working on health and housing projects, before establishing his base in Kerala (Trivandrum)Hindustan Times.
A firm believer in low-cost, sustainable architecture, Baker pioneered using local materials, passive ventilation, and minimal energy consumption well before โgreen architectureโ became common discourse bennykuriakose+15Wikipedia+15STIRworld+15.
His guiding principles included:
Use on-site and local materials, preferably within a five-mile radius.
Design with a strong awareness of climate, topography, and natural lighting.
Residential and institutional work across Kerala and beyond, including:
Loyola Chapel & Auditorium (Trivandrum), Pallikoodam School (Kottayam), Mitraniketan (Vagamon), Salim Ali Centre, Indian Coffee House, Slum redevelopment units in Chengalchoola thehindu.com+2Wikipedia+2Wikipedia+2.
Developed affordable housing projects such as fishermenโs housing and rural schemesโeven in the hilly regions of Pithoragarhโoften under the aegis of COSTFORD (Centre of Science & Technology for Rural Development) with CM C. Achutha Menon and KN Raj in the mid-1980s indianexpress.com+2Aฮถ South Asia+2Wikipedia+2.
โจ Legacy & Recognition
Fondly called “Daddy” by workers and students, reflecting his involvement in every brick laid on site Wikipedia.
Awards include:
Padma Shri (1990), MBE (1983), UN Roll of Honour (1992), International architectural recognitions from IUA and the Netherlands Wikipedia+1Wikipedia+1.
The Laurie Baker Centre for Habitat Studies in Kerala continues to teach and disseminate his ideas on sustainable architecture and cost-effective housing Hindustan Times+7lauriebaker.net+7STIRworld+7.
๐ง Why Laurie Baker Still Matters
His architecture is rooted in social equityโbeauty was not reserved for the affluent.
Preโemptive sustainability: rainwater harvesting, passive cooling, minimal resource use decades ahead of the global agenda.
A true vernacular modernist, combining low-tech local craft with thoughtful design to elevate ordinary materials.
Today, his buildings are seen as living museums, still teaching lessons on climate-responsive, humane architecture thehindu.comWikipedia.
Laurie Bakerโs life teaches us that architecture need not be fossil-fuel-intensive or elitist. With empathy, craftsmanship, thrift, and respect for context, it can uplift communities, gracefully blend with environment, and stand the test of time.
Full Name: Ieoh Ming Pei Born: April 26, 1917 โ Guangzhou, China Died: May 16, 2019 โ New York City, USA Nationality: Chinese-American Profession: Architect, Designer, Urban Planner Known For: Modernist architectural designs blending geometric forms with cultural symbolism
Early Life and Education
I. M. Pei was born into a wealthy banking family in Guangzhou, China, and spent much of his childhood in Hong Kong and Shanghai. Fascinated by buildings from a young age, he was particularly inspired by the Western-style architecture of Shanghaiโs Bund and the gardens of Suzhou.
In 1935, Pei moved to the United States to study architecture.
Undergraduate: Massachusetts Institute of Technology (MIT) โ Graduated in 1940
Graduate: Harvard Graduate School of Design โ Studied under Walter Gropius and Marcel Breuer, pioneers of the Bauhaus movement
This exposure to both Western modernism and his Chinese heritage deeply influenced his later architectural style.
Architectural Philosophy
I. M. Peiโs designs combined modernist principlesโsimplicity, geometry, and functionalityโwith contextual sensitivity to culture, history, and environment. He believed architecture should balance aesthetic beauty, structural innovation, and human experience.
Key characteristics of his work:
Use of Geometric Shapes โ Triangles, squares, and pyramids
Integration with Nature โ Designing buildings to harmonize with surroundings
Cultural References โ Subtle incorporation of traditional motifs
Innovative Materials โ Glass, steel, and concrete used in expressive ways
Career Highlights
In 1955, Pei founded I. M. Pei & Associates (later Pei Cobb Freed & Partners). Over a career spanning six decades, he designed some of the worldโs most iconic buildings.
Notable Works
Louvre Pyramid, Paris (1989)
Glass and metal pyramid serving as the entrance to the Louvre Museum
Initially controversial, it became a celebrated symbol of Parisian modernism
Bank of China Tower, Hong Kong (1990)
Striking skyscraper with a crystalline faรงade
Inspired by bamboo shoots, symbolizing growth and prosperity
John F. Kennedy Presidential Library, Boston (1979)
Sleek modernist design overlooking the sea
Honors President Kennedyโs vision and legacy
East Building, National Gallery of Art, Washington, D.C. (1978)
Famous for its triangular geometry and innovative use of space
Museum of Islamic Art, Doha, Qatar (2008)
Blends modern architecture with traditional Islamic design elements
Rock and Roll Hall of Fame, Cleveland (1995)
Unique combination of glass pyramids and modernist forms
Awards and Recognition
I. M. Pei received numerous honors for his contributions to architecture:
Pritzker Architecture Prize (1983) โ Often called the Nobel Prize of architecture
AIA Gold Medal (1979)
Praemium Imperiale (1989)
Presidential Medal of Freedom (1992, USA)
Legacy
I. M. Pei passed away at the age of 102, leaving behind a legacy of buildings that continue to inspire architects and the public alike. His work transcended mere functionality, blending cultural storytelling with architectural innovation.
His designs stand as timeless examples of how modern architecture can respect tradition while embracing the future.
National Housing Policy, National Urban Transport Policy (2006), National Habitat Standards set sectoral guidelines.
The Centre also facilitates data collection (Census, NSSO, NIUA, MoHUA reports).
d. Addressing Regional Imbalances
Central policies encourage growth centers, industrial corridors (e.g., DMIC, Chennai-Bengaluru Corridor), and SEZs to spread urbanization.
Promotes urbanโrural linkages via Rurban Mission.
2. State-Level Policies
Urban development is primarily a State subject under the Indian Constitution (though the Centre has a supportive role). States are crucial in implementation and governance.
a. Urban Planning and Land Use
States prepare Master Plans, Regional Plans, Town Planning Schemes through Development Authorities and Municipal Corporations.
Land acquisition, zoning, building regulations โ managed by state agencies.
b. Policy Formulation
Many states have their State Urban Policies/Housing Policies.
Urban planning, land use, implementation of schemes, empowering ULBs, local policies
State Housing Policies, Master Plans, Urban Dev. Authorities
โ In summary:
National policies set the direction, funding, and reforms, ensuring that urbanization supports national goals like balanced development, economic growth, and sustainability.
State-level policies translate these into local planning, land use, governance, and service delivery, tailoring urban strategies to regional realities.
For successful urbanization, synergy between national vision, state execution, and ULB empowerment is essential.
Dame Zaha Hadid was an Iraqi-British architect, widely recognized as one of the most influential figures in contemporary architecture. Known as the โQueen of Curves,โ she revolutionized architectural design with her futuristic, fluid, and dynamic forms that defied traditional conventions. In 2004, she became the first woman to receive the Pritzker Architecture Prize, the highest honor in architecture.
2. Early Life and Education
Birth: 31 October 1950, Baghdad, Iraq.
Family background: Born into an influential family; her father was an industrialist and politician, and her mother was an artist.
Education: Studied mathematics at the American University of Beirut before moving to London in 1972 to study architecture.
Architectural Association School of Architecture (AA), London: She trained under Rem Koolhaas and Elia Zenghelis, where she developed her unique style influenced by Russian Suprematism and avant-garde movements.
3. Career Beginnings
Founded her own firm Zaha Hadid Architects (ZHA) in 1979 in London.
Initially faced challenges, as her radical designs were considered too experimental and โunbuildable.โ
Early works were mostly conceptual drawings and paintings, such as the Peak Leisure Club project in Hong Kong (1983), which gained international recognition but was never constructed.
4. Architectural Style
Zaha Hadidโs architecture is characterized by:
Fluidity: Buildings with flowing, organic curves inspired by natural landscapes.
Parametric design: Use of advanced computer modeling and digital tools.
Deconstructivism: Breaking away from traditional rigid forms, creating fragmented yet harmonious structures.
Light and movement: Dynamic spaces that seem to flow, often described as โfrozen motion.โ
Futuristic vision: Designs resembling spaceships, waves, and organic forms.

5. Major Works
a) Vitra Fire Station (Weil am Rhein, Germany, 1993)
Her first major built project.
Angular, sharp concrete forms resembling a frozen explosion.
b) MAXXI Museum of 21st Century Arts (Rome, Italy, 2009)
A fluid structure with sweeping curves and interconnected spaces.
Won the 2010 Stirling Prize.
c) London Aquatics Centre (2012, for the Olympic Games)
Wave-like roof inspired by the movement of water.
Considered one of her most iconic and widely admired projects.
d) Guangzhou Opera House (China, 2010)
Designed like two river-worn pebbles.
Combines technology and organic form seamlessly.
e) Heydar Aliyev Cultural Center (Baku, Azerbaijan, 2012)
One of her most celebrated works.
Fluid, flowing white structure with no straight lines, symbolizing a break from rigid Soviet architecture.
f) Other Notable Works
Sheikh Zayed Bridge (Abu Dhabi, 2010)
Dongdaemun Design Plaza (Seoul, 2014)
The Rosenthal Center for Contemporary Art (Cincinnati, USA, 2003)
Pritzker Architecture Prize (2004) โ first woman recipient.
Stirling Prize (2010 & 2011) โ for MAXXI Museum and Evelyn Grace Academy, London.
Dame Commander of the Order of the British Empire (DBE, 2012).
Royal Gold Medal (2016) โ first woman to receive it in her own right.
Countless other international honors, cementing her status as one of the worldโs greatest architects.
7. Legacy and Philosophy
Zaha Hadid challenged the male-dominated world of architecture and broke barriers for women.
Believed in โpushing the boundariesโ of architecture using technology and imagination.
Her firm, Zaha Hadid Architects, continues to design groundbreaking projects after her death.
She has inspired a new generation of architects to think beyond geometry and rigidity.
8. Death
Zaha Hadid passed away on 31 March 2016 in Miami, Florida, due to a heart attack while being treated for bronchitis.
Her death was a huge loss to the architectural world, but her legacy endures through her works and her firm.
9. Conclusion
Zaha Hadid was not just an architectโshe was a visionary artist, a pioneer of digital architecture, and a symbol of innovation and resilience. Her bold, unconventional, and futuristic designs reshaped skylines around the world and proved that architecture can be both functional and poetic. She remains an inspiration for architects, artists, and dreamers who dare to see beyond limitations.
The British rule led to the rise of Indian nationalism as people began to resist colonial rule. The British came to India, thousands of kilometers away, to exploit our human, natural, mineral, and other resources. Because of their misrule, the freedom movement started, and many people sacrificed their lives. On July 31, 1940, Udham Singh was hanged to death in London. Udham Singh (birth name Sher Singh; December 26, 1899โJuly 31, 1940) was an Indian revolutionary belonging to the Ghadar Party and the Hindustan Socialist Republican Association (HSRA), known for assassinating Michael O’Dwyer, the former Lieutenant Governor of the Punjab in India, on March 13, 1940. Udham Singh assassinated Michael O’Dwyer in revenge for the Jallianwala Bagh massacre in Amritsar in 1919, for which O’Dwyer was responsible and of which Singh himself was a witness. Sher Singhโs mother died when he was about three years old, and his father passed away a few years later. Orphaned at a young age, he and his elder brother were admitted to the Central Khalsa Orphanage in Amritsar in 1907. They were initiated into the Sikh religion at the orphanage, and Sher Singh was renamed Udham Singh. Singh was furious because of the Jallianwala Bagh massacre. On April 13, 1919, at least 10,000 people assembled at Jallianwala Bagh for a peaceful protest against the Rowlatt Acts, legislation passed by the British that year, which allowed certain political cases to be tried without juries and permitted the internment of the accused without trial. The British officer Reginald Dyer arrived at the protest site and ordered his troops to seal off the exit and open fire on the unarmed crowd, killing indiscriminately. Singh was serving water to the attendees at the time of the attack and watched it. This sparked in him a hatred for colonial rule. The Lieutenant Governor of Punjab at the time, Michael OโDwyer, not only condoned Reginald Dyerโs actions but also justified them. Later on, Michael OโDwyer went back to London. Singh came to London and decided on his action. He came to know that Michael OโDwyer would be attending an event at Caxton Hall in Westminster on March 13, 1940, and chose this opportunity to assassinate him. Singh reached the hall with a loaded gun, and after OโDwyer had given a speech, Singh shot him twice. OโDwyer fell to the floor and succumbed to the gunshot wounds. Singh was subsequently tried and convicted of murder and hanged on July 31, 1940. While in custody, he used the name ‘Ram Mohammad Singh Azad,’ which represents the three major religions (Hinduism, Islam, and Sikhism, respectively) in united India. Singhโs actions evoked different reactions in India. Overall public sentiment was positive, with several Indian nationalists, including many Congress supporters, supporting his action and considering him a hero and a martyr. Revolutionary Netaji Subhas Chandra Bose approved of Singhโs actions. But Mahatma Gandhi and Jawaharlal Nehru denounced the assassination. The patriotic feelings of Singh can be understood because before the judge had passed the sentence, Singh said, “I am not afraid to die. I am proud to die.โฆ I have great sympathy with the workers of England, but I am against the dirty British government.” Like all Indians, we respect this great hero and martyr. (Sources of this article are, a) britannica.com/biography/Udham-Singh and b)wikipedia.org/wiki/Udham_Singh)
Fertility refers to the actual reproductive performance of an individual, couple, group, or population. It is a demographic concept that quantifies the frequency of childbirth in a population over time.
II. Fertility Trends
Definition:
Fertility trends refer to changes in fertility rates over time, influenced by social, economic, biological, and political factors.
Global Patterns:
Declining fertility in developed nations due to urbanization, higher education levels, career focus, and contraceptive access.
Higher fertility in developing regions due to early marriage, lower education, cultural norms, and limited family planning.
III. Fertility and Social Behavior
Social factors affecting fertility:
Marriage patterns: Early and universal marriage often results in higher fertility.
Education level: Higher female education is associated with lower fertility.
Employment: Working women tend to delay childbirth or have fewer children.
Cultural norms: Beliefs about ideal family size, gender roles, and childbearing influence fertility.
Religion: Some religious doctrines encourage higher fertility.
IV. Fertility and Biological Behavior
Biological factors influencing fertility:
Age of woman: Fertility peaks in the 20s and declines after 35.
Health and nutrition: Poor health reduces fertility.
Infertility: Biological infertility (in either partner) limits reproductive outcomes.
Menstrual and ovulation cycles: Timing affects conception probability.
Postpartum amenorrhea and lactation: These naturally suppress ovulation and reduce birth intervals.
V. Differential Fertility
Differential fertility refers to variations in fertility across different subgroups of the population. These differences can be due to:
1. Ethnic Groups:
Cultural values and traditions around family size vary.
E.g., In multi-ethnic countries, one ethnic group may exhibit higher fertility rates than others.
2. Socio-Economic Groups:
Lower-income groups may have higher fertility due to less contraceptive use and higher child mortality.
Wealthier, urban, and more educated groups tend to have fewer children.
3. Mobility and Migration:
Migrants may initially retain high fertility but adopt host-country norms over time.
Mobile populations may have reduced access to reproductive healthcare.
4. Location (Urban vs Rural):
Urban residents usually have fewer children due to better education, healthcare, and employment opportunities.
Rural areas may show higher fertility due to agricultural labor needs and lower access to contraception.
VI. Measures of Fertility
Fertility is quantified using several statistical indicators. Below are the main fertility measures with formulas and explanations:
1. Crude Birth Rate (CBR)
Definition:
Total number of live births per 1,000 people in a given year.
Formula:
Example:
If there are 20,000 live births in a population of 1,000,000: CBR=?
Limitations:
Not age-specific.
Includes total population, even those not of reproductive age.
2. Age-Specific Fertility Rate (ASFR)
Definition:
Number of births per 1,000 women in a specific age group (usually 5-year intervals).
Formula:
Example:
If women aged 25โ29 have 3,000 births and their population is 100,000: ASFR25โ29=?
3. Total Fertility Rate (TFR)
Definition:
Average number of children a woman would have during her reproductive years (typically ages 15โ49), based on current ASFRs.
Formula:
The sum is over all reproductive age groups.
Length of age interval is usually 5 years.
Example:
If the ASFRs add up to 600 across all age groups: TFR=600ร51,000=3.0ย childrenย perย womanTFR =?
Interpretation:
TFR of 2.1 is considered the replacement-level fertility (in developed countries).
TFR > 2.1 = population growth; TFR < 2.1 = population decline (without migration).
4. Net Reproduction Rate (NRR)
Definition:
Average number of daughters a woman would have in her lifetime if she were subject to current age-specific fertility and mortality rates.
Formula:
NRR focuses on female children, since only they can reproduce.
Interpretation:
NRR = 1 โ each woman is replaced by one daughter โ stable population.
NRR > 1 โ population grows.
NRR < 1 โ population declines (without migration).
VII. Summary Table of Fertility Measures
Measure
Formula
Unit
Use
Crude Birth Rate (CBR)
Per 1,000 population
General fertility indicator
Age-Specific Fertility Rate (ASFR)
Per 1,000 women (age group)
Detailed analysis of fertility across age groups
Total Fertility Rate (TFR)
Children per woman
Best measure of fertility potential
Net Reproduction Rate (NRR)
Daughters per woman
Population replacement measure accounting for mortality
VIII. Conclusion
Fertility is influenced by complex social, economic, cultural, and biological factors. Understanding fertility measures like CBR, ASFR, TFR, and NRR is essential for population policy, healthcare planning, and socio-economic development. Differential fertility across ethnic, regional, and economic lines highlights the need for targeted interventions.
References
De Bruijn, B. J., & De Bruijn, B. J. (2006).ย Fertility: theories, frameworks, models, conceptsย (pp. 549-569). na.
Kumar, G., Vyas, S., Sharma, S. N., & Dehalwar, K. (2025). Urban growth prediction using CA-ANN model and spatial analysis for planning policy in Indore city, India.ย GeoJournal,ย 90(3), 139.
McNicoll, G. (1980). Institutional determinants of fertility change.ย Population and development review, 441-462.
Morgan, S. P., & Hagewen, K. J. (2005). Fertility. Inย Handbook of populationย (pp. 229-249). Boston, MA: Springer US.
Whelpton, P. K., & Kiser, C. V. (1945). Trends, determinants, and control in human fertility.ย The Annals of the American Academy of Political and Social Science,ย 237(1), 112-122.
detailed explanation of key measures of mortality, including definitions, formulas, and interpretations for:
Crude death rate
Age-specific death rate
Infant mortality rate
Neonatal mortality rate
Adjusted/standardized death rate
1. Crude Death Rate (CDR)
Definition:
The crude death rate is the total number of deaths in a population over a given period (usually a year) per 1,000 individuals.
Formula:
Example:
If a country has 50,000 deaths in a year and a mid-year population of 5,000,000: CDR=?
Limitations:
Doesn’t account for age structure of the population.
Can be misleading when comparing countries with different age demographics.
2. Age-Specific Death Rate (ASDR)
Definition:
ASDR measures the death rate within a specific age group per 1,000 people in that group.
Formula:
Example:
If there are 500 deaths among people aged 65โ74 and that groupโs population is 50,000: ASDR=?
Use:
Helps identify high-risk age groups.
More accurate than crude death rate for health planning and analysis.
3. Infant Mortality Rate (IMR)
Definition:
IMR refers to the number of deaths of infants under 1 year of age per 1,000 live births in a given year.
Formula:
Example:
If 1,200 infants die in a year and there were 100,000 live births: IMR=?
Importance:
Reflects health care quality, nutrition, and maternal health.
A key indicator of social and economic development.
4. Neonatal Mortality Rate (NMR)
Definition:
The NMR refers to the number of deaths of infants within the first 28 days of life per 1,000 live births.
Formula:
Example:
If there are 600 deaths within 28 days among 100,000 live births: NMR=?
Use:
Assesses quality of prenatal and immediate postnatal care.
5. Adjusted or Standardized Death Rate (SDR)
Definition:
Standardized death rate adjusts the crude death rate to eliminate the effects of differences in age distribution. It allows comparison between populations with different age structures.
Why Standardize?
Populations with more elderly people will naturally have higher crude death rates, even if the healthcare system is good. Standardization accounts for this.
Methods of Standardization:
Two common methods:
Direct standardization
Indirect standardization
A. Direct Standardization
Formula:
Steps:
Multiply each age-specific death rate by the standard population for that age group.
Sum all the products.
Divide by the total standard population.
Use:
For comparing mortality between countries or over time using a common standard.
B. Indirect Standardization (Often used when age-specific rates are not available)
Steps:
Use standard population’s age-specific death rates.
Apply them to your study population to find expected deaths.
Compare observed vs. expected deaths.
Standardized Mortality Ratio (SMR):
SMR = 100: mortality is equal to standard.
SMR > 100: higher mortality than standard.
SMR < 100: lower mortality than standard.
Summary Table:
Measure
Formula
Denominator
Use/Significance
Crude Death Rate (CDR)
Entire population
General mortality level
Age-Specific Death Rate
Age group population
Risk in specific age groups
Infant Mortality Rate (IMR)
Live births
Maternal/child health indicator
Neonatal Mortality Rate
Live births
Immediate newborn care indicator
Standardized Death Rate
Standard population
Removes age structure bias in comparisons
References
Kumar, G., Vyas, S., Sharma, S. N., & Dehalwar, K. (2024). Challenges of environmental health in waste management for peri-urban areas. Inย Solid Waste Management: advances and trends to tackle the SDGsย (pp. 149-168). Cham: Springer Nature Switzerland.
Morris, R. F. (1957). The Interpretation of Mortality Data in Studies on Population Dynamics1.ย The Canadian Entomologist,ย 89(2), 49-69.
Ogbanga, M. M., & Sharma, S. N. (2024). Climate Change and Mental Heat. EduPub
Siegel, J. S. (2011). Concepts and basic measures of mortality. Inย The Demography and Epidemiology of Human Health and Agingย (pp. 73-134). Dordrecht: Springer Netherlands.
Sheil, D., Burslem, D. F., & Alder, D. (1995). The interpretation and misinterpretation of mortality rate measures.ย Journal of Ecology, 331-333.
Stocks, P. (1944). The measurement of morbidity.
Sharma, S. N., Dehalwar, K., Yadav, K., & Verma, D. (2025). Urban Street Canyon Turbulence and Vehicular Pollution Dispersion.
Zeighami, E. A., & Morris, M. D. (1983). The measurement and interpretation of proportionate mortality.ย American Journal of Epidemiology,ย 117(1), 90-97.
Demographic variables refer to the statistical characteristics of human populations used primarily in research, marketing, policy-making, and social sciences to identify and understand different segments within a population. These variables help describe, analyze, and predict behavior patterns, preferences, and trends among groups of people. They are essential in both qualitative and quantitative research because they allow for the classification and segmentation of target audiences.
Below is a detailed breakdown of the major demographic variables:
Age is one of the most fundamental demographic variables. It categorizes individuals based on their age group (e.g., children, teenagers, adults, seniors). It influences:
Consumer behavior (e.g., preferences for technology, fashion, food)
Health and medical needs
Educational interests
Social and economic priorities
Age groups commonly used:
0โ14 years (children)
15โ24 years (youth)
25โ54 years (working-age adults)
55โ64 years (pre-retirement)
65+ years (elderly)
2. Gender (or Sex)
Gender refers to whether someone identifies as male, female, or non-binary/other. Traditionally, this variable was limited to biological sex (male/female), but contemporary research often includes gender identity for inclusivity and accuracy.
Influences:
Employment patterns
Purchasing decisions
Healthcare needs
Social roles and expectations
3. Income
Income refers to the monetary earnings of an individual or household. It is usually measured annually and is a key variable in economic research, marketing, and social studies.
Categories often used:
Low income
Middle income
High income
Impacts:
Spending habits
Access to education and healthcare
Living standards
Investment and savings behavior
4. Education Level
This variable indicates the highest level of education an individual has attained. It is a strong predictor of job prospects, income, and lifestyle.
Typical categories:
No formal education
Primary education
Secondary education
Higher education (college/university)
Postgraduate education
Influences:
Employment opportunities
Political participation
Health awareness
Media consumption
5. Occupation
Occupation refers to the kind of job or profession an individual is engaged in. This helps categorize people based on skill levels, industry sectors, and work environments.
Categories:
White-collar (e.g., managers, professionals)
Blue-collar (e.g., factory workers, technicians)
Service industry (e.g., waitstaff, customer service)
Unemployed
Retired
6. Marital Status
Marital status describes a personโs legal relationship status. It plays a crucial role in shaping family structure, financial responsibilities, and lifestyle choices.
Common categories:
Single
Married
Divorced
Widowed
Separated
Cohabiting (not legally married but living together)
7. Religion
Religion refers to the spiritual beliefs and practices followed by individuals or groups. It can influence values, behaviors, dietary choices, holidays observed, and attitudes toward social issues.
Examples:
Christianity
Islam
Hinduism
Buddhism
Judaism
Non-religious/Atheist
8. Ethnicity or Race
This variable categorizes people based on shared cultural, national, or racial characteristics. It’s often used in studies of health disparities, education access, political representation, and cultural practices.
Examples:
Caucasian
African descent
Asian
Hispanic/Latino
Indigenous
Mixed race
9. Geographic Location
This refers to the physical location where an individual resides, including country, region, state, city, or even neighborhood.
Impact areas:
Climate preferences
Political views
Cultural norms
Language
Access to resources and services
10. Family Size and Structure
This variable accounts for the number of individuals in a household and their relationships to each other.
Includes:
Nuclear family (parents and children)
Extended family (includes relatives)
Single-parent family
Childless couples
Applications:
Housing needs
Consumption patterns
Healthcare planning
Educational services
11. Language
Language spoken at home or as a first language is another important demographic factor, especially in multicultural or multilingual societies. It impacts communication strategies in marketing and public services.
Applications of Demographic Variables
Demographic variables are used in a variety of domains:
Marketing: To segment customers and tailor advertising.
Public Policy: For resource allocation, program planning, and social welfare.
Healthcare: To understand needs and disparities.
Education: To plan curriculum, school locations, and funding.
Political Science: For voter profiling and electoral strategy.
Conclusion
Demographic variables provide a structured way to understand human populations. By categorizing people based on measurable traits, researchers, policymakers, and businesses can identify patterns, predict behaviors, and create targeted strategies. While these variables are powerful, they are often used alongside psychographic, behavioral, and geographic variables for deeper insights.
References
Dehalwar, K., & Sharma, S. N. (2023).ย Fundamentals of research writing and uses of research methodologies. Edupedia Publications Pvt Ltd.
Goldberg, L. R., Sweeney, D., Merenda, P. F., & Hughes Jr, J. E. (1998). Demographic variables and personality: The effects of gender, age, education, and ethnic/racial status on self-descriptions of personality attributes.ย Personality and Individual differences,ย 24(3), 393-403.
Gutiรฉrrez, J. L. G., Jimรฉnez, B. M., Hernรกndez, E. G., & Pcn, C. (2005). Personality and subjective well-being: Big five correlates and demographic variables.ย Personality and individual differences,ย 38(7), 1561-1569.
Lam, D. (1997). Demographic variables and income inequality.ย Handbook of population and family economics,ย 1, 1015-1059.
Pollak, R. A., & Wales, T. J. (1981). Demographic variables in demand analysis.ย Econometrica: Journal of the Econometric Society, 1533-1551.
Sharma, S. N., & Dehalwar, K. (2025). Assessing the Transit-Oriented Development and Travel Behavior of the Residents in Developing Countries: A Case of Delhi, India.ย Journal of Urban Planning and Development,ย 151(3), 05025018.
The study of population, or demography, is the scientific investigation of human populations, focusing on their size, structure, distribution, and changes over time. It analyzes how and why populations grow or decline, how people move, and how demographic trends affect society. This field provides critical information for planning and policy-making in areas like health, education, housing, labor markets, and environmental sustainability.
A population refers to a group of individuals living in a specific geographic area who share certain social or biological characteristics. For example, the population of a city includes all its residents regardless of age or background. The study of such populations allows researchers to track trends in health, education, income, and mobility.
2. Importance of Population Studies
Population studies are vital for making informed decisions in governance and development. By understanding population trends, governments can anticipate future needs, such as how many schools or hospitals will be required, how to manage food supply, and how to prepare for aging populations or urban expansion. It also helps global agencies monitor human development and inequality.
3. Key Components of Population Study
a) Population Size
Population size refers to the total number of individuals living in a specific area at a given time. Knowing this helps planners assess demand for services like healthcare, education, and infrastructure. It also allows comparisons between countries or regions.
b) Population Density
Population density measures how many people live per unit area (e.g., per square kilometer). High density may indicate urban crowding, while low density often suggests rural or underdeveloped areas. Understanding density helps in planning transportation, housing, and utilities.
c) Population Distribution
This term describes how people are spread across a region or the world. Population distribution is influenced by natural features (like rivers and mountains), economic factors (such as job availability), and political stability. Uneven distribution can lead to overuse of resources in some areas and underdevelopment in others.
d) Population Structure
Population structure refers to the composition of a population, usually broken down by age and sex. It is often visualized using population pyramids. Understanding this helps forecast future needs โ for example, a young population will need more schools, while an aging population will require more healthcare services.
e) Population Growth
Population growth indicates the rate at which the number of individuals in a population is increasing. It is influenced by birth rates, death rates, and migration. Rapid population growth can strain resources, while population decline can affect the workforce and economy.
4. Demographic Processes
a) Fertility
Fertility refers to the actual number of children born to women in a population. It is measured using indicators like the Crude Birth Rate or Total Fertility Rate. Fertility is influenced by culture, education, access to contraception, and government policies.
b) Mortality
Mortality is the frequency of deaths in a population over a specific period. Important measures include the Crude Death Rate and Infant Mortality Rate. Mortality rates help assess the overall health conditions and the effectiveness of medical services in a society.
c) Migration
Migration is the movement of people from one place to another, either within a country (internal migration) or between countries (international migration). It affects population size, cultural composition, and the labor force, and can be driven by economic, social, or environmental factors.
5. Population Theories
a) Malthusian Theory
This theory, proposed by Thomas Malthus, suggests that population growth tends to outpace food production, leading to shortages, famine, and conflict. Although criticized, the theory sparked debate on sustainable development and resource management.
b) Demographic Transition Theory
This theory explains how societies transition from high birth and death rates to low ones as they develop economically. It outlines four or five stages of demographic change, and helps in predicting population trends in developing versus developed nations.
c) Marxist Theory
The Marxist perspective views population issues as consequences of unequal resource distribution rather than natural laws. It argues that poverty and overpopulation stem from capitalism and advocates for social reforms to ensure equitable access to resources.
6. Population Data Sources
Population studies rely on data collected through censuses, surveys, and administrative records. Censuses offer a complete population snapshot, while surveys and records provide detailed information on births, deaths, migration, education, and employment. Accurate data is essential for effective planning and analysis.
7. Challenges in Population Studies
Demographic research faces various challenges, including outdated or inaccurate data, especially in less developed regions. Tracking migration and undocumented populations can be complex. Additionally, ethical issues arise when collecting sensitive information from vulnerable groups, such as minorities or refugees.
8. Applications of Population Studies
Demographic insights are used to design public policies, predict workforce needs, control disease outbreaks, plan cities, and manage natural resources. Whether it’s allocating healthcare funding or responding to a refugee crisis, population studies play a critical role in both immediate decision-making and long-term planning.
Conclusion
The study of population is essential for understanding how societies function and change. It equips governments, researchers, and international organizations with the tools to address pressing challenges such as urbanization, aging, poverty, and environmental degradation. By analyzing population trends and dynamics, we can build more equitable and sustainable futures.
References
Dehalwar, K., & Sharma, S. N. (2023).ย Fundamentals of research writing and uses of research methodologies. Edupedia Publications Pvt Ltd.
Emerson, E., Kiernan, C., Alborz, A., Reeves, D., Mason, H., Swarbrick, R., … & Hatton, C. (2001). The prevalence of challenging behaviors: A total population study.ย Research in developmental disabilities,ย 22(1), 77-93.
Hull, M. G., Glazener, C. M., Kelly, N. J., Conway, D. I., Foster, P. A., Hinton, R. A., … & Desai, K. M. (1985). Population study of causes, treatment, and outcome of infertility.ย Br Med J (Clin Res Ed),ย 291(6510), 1693-1697.
Szklo, M. (1998). Population-based cohort studies.ย Epidemiologic reviews,ย 20(1), 81-90.
Sharma, S. N., & Dehalwar, K. (2025). Assessing the Transit-Oriented Development and Travel Behavior of the Residents in Developing Countries: A Case of Delhi, India.ย Journal of Urban Planning and Development,ย 151(3), 05025018.
Sharma, S. N. (2024). Role of Demography & Rahul Gandhi in Karnataka State Election Results. Track2Training
Masterโs degree with a minimum of 55% marks or an equivalent grade in any discipline of Social Sciences, Humanities, or Interdisciplinary Streams from a recognized university/institution.
Skills Required:
Applicants must have:
A good understanding of research methodology and statistical tools used in social science research
Proficiency in data analysis
Strong communication skills
Working knowledge of MS Office applications (Word, Excel, PowerPoint)
Additionally, the ideal candidate should demonstrate strong organizational abilities and a willingness to learn and contribute effectively to research activities.
Selection Process:
Only shortlisted candidates will be invited for an interaction/interview.
Note:
1.ย This internship is neither a job nor does it provide any assurance of future employment with ICSSR.
2.ย Candidates must submit their applicationsย onlineย only. [Go to app.icssr.org > Apply for Vacancy > Login > Apply Now against Full-time Internship Programme 2025-26]
3.ย The completed application must be submitted byย 18th August, 2025ย (last date to be filled in).
4.ย ICSSR reserves the right to modify or cancel the internship programme or the selection process, if necessary.
5.ย The internship will be based atย ICSSR, New Delhi.
6.ย Very limited residential accommodation is available, only for female candidates, on a twin-sharing basis. All other candidates must make their own living arrangements during the internship period.
7.ย Interns will be required to workย offline,ย 40 hours per week, fromย Monday to Friday (9:30 A.M. to 6:00 P.M.),ย including aย half-hour lunch break.
For filling online application for Senior Internshipย LINK to APPLY
Bachelorโs degree (B.A. /B.Sc./B.com) with a minimum of 55% marks or an equivalent grade in any discipline of Social Sciences, Humanities, or Interdisciplinary Streams from a recognized university/institution.
The candidate must have successfully completed their degree in the year 2024 or thereafter.
As on the date of application, the candidate must not be enrolled in or pursuing any full-time Post Graduate programme.
Skills Required:
Applicants must have:
A good understanding of research methodology and statistical tools used in social science research
Proficiency in data analysis
Strong communication skills
Working knowledge of MS Office applications (Word, Excel, PowerPoint)
Additionally, the ideal candidate should demonstrate strong organizational abilities and a willingness to learn and contribute effectively to research activities.
Selection Process:
Only shortlisted candidates will be invited for an interaction/interview.
Note:
1.ย This internship is neither a job nor does it provide any assurance of future employment with ICSSR.
2.ย Candidates must submit their applicationsย onlineย only. Go to app.icssr.org > Apply for Vacancy > Login > Apply Now against Full-time Internship Programme 2025-26
3.ย The completed application must be submitted byย 18th August, 2025ย (last date to be filled in).
4.ย ICSSR reserves the right to modify or cancel the internship programme or the selection process, if necessary.
5.ย The internship will be based atย ICSSR, New Delhi.
6.ย Very limited residential accommodation is available, only for female candidates, on a twin-sharing basis. All other candidates must make their own living arrangements during the internship period.
7.ย Interns will be required to workย offline,ย 40 hours per week, fromย Monday to Friday (9:30 A.M. to 6:00 P.M.),ย including aย half-hour lunch break.
For filling online application for Junior Internshipย LINK to APPLY
Mortality, defined as the incidence of death within a population, is a critical indicator of public health and social well-being. Over time, mortality trends have shown a general decline globally, particularly due to advancements in medicine, sanitation, nutrition, and public health infrastructure. However, disparities persist due to a combination of biological and social determinants.
1. Biological Factors Affecting Mortality
Biological factors refer to innate or genetically influenced aspects that contribute to mortality. These include:
Genetics: Inherited conditions like sickle cell anemia, cystic fibrosis, or certain cancers influence life expectancy. Genetic predisposition can also affect how one responds to diseases or environmental hazards.
Age: Mortality rates vary significantly by age group. Infants and the elderly often have higher mortality rates due to weaker immune systems and greater vulnerability to diseases.
Sex/Gender (Biological Aspect): Biologically, women tend to live longer than men globally. This is attributed to hormonal differences (e.g., estrogen may offer some protection against heart diseases), genetic factors (e.g., two X chromosomes), and risk behavior tendencies often higher in males.
Health Conditions: Chronic conditions like hypertension, diabetes, and obesity increase the risk of premature death. Infectious diseases also remain leading causes of death in many developing countries.
2. Social Factors Influencing Mortality
Social determinants of health play a powerful role in shaping mortality patterns across populations. These include:
A. Gender and Mortality
Women typically live longer than men, but may experience more non-fatal chronic conditions. Men’s higher mortality is linked to occupational hazards, higher rates of risky behaviors (e.g., smoking, alcohol use), and lower rates of healthcare utilization.
Maternal mortality is a significant concern in many low-income countries, where inadequate healthcare access during pregnancy and childbirth remains a major issue.
Gender-based violence, discrimination, and access to education and healthcare also skew mortality rates differently for men and women in various regions.
B. Race and Ethnicity
Racial disparities in mortality are evident in many countries. For example, in the United States, Black Americans have higher mortality rates than White Americans, particularly from preventable or manageable conditions such as heart disease, cancer, and homicide.
Causes include systemic racism, historical disadvantages, economic inequality, and reduced access to quality healthcare, nutritious food, and safe living environments.
Indigenous populations across the world (e.g., Native Americans, Aboriginal Australians) often suffer higher mortality due to poverty, marginalization, and reduced access to health services.
C. Social Structure and Class
Socioeconomic status (SES) is one of the most powerful predictors of mortality. Individuals from lower-income groups face higher mortality rates due to factors like poor housing, underemployment, lack of insurance, and environmental hazards.
Education: Those with higher educational attainment often have lower mortality due to better health literacy, more stable employment, and healthier lifestyles.
Inequality in wealth distribution is associated with poorer overall public health outcomes, even in economically advanced societies.
D. Lifestyle and Behavioral Factors
Diet, physical activity, and substance use directly influence mortality. Tobacco use alone is responsible for over 8 million deaths annually worldwide. Poor diet and sedentary behavior contribute to obesity and cardiovascular disease.
Mental health: Depression, anxiety, and other disorders, if unaddressed, can lead to higher suicide rates and risky behaviors increasing mortality risk.
Health-seeking behavior: Individuals who delay or avoid medical help due to cultural, psychological, or economic reasons are at greater risk of preventable mortality.
E. Occupational Hazards
Manual labor and high-risk jobs, often held by lower-income or less educated individuals, are associated with higher mortality. Examples include construction, mining, fishing, and factory work.
Workplace stress, long working hours, exposure to hazardous materials, and lack of health insurance all exacerbate mortality risks.
The COVID-19 pandemic also highlighted occupational disparitiesโessential workers (often from minority and lower-income backgrounds) faced greater exposure and mortality risk.
F. Social Status and Marginalization
Social capitalโthe strength of social networks and community tiesโcan impact health outcomes. Isolation and lack of support are linked to higher mortality, especially among the elderly.
Discrimination and stigmaโbased on gender identity, sexual orientation, caste, religion, or immigration statusโcan lead to chronic stress and reduced access to healthcare, ultimately increasing mortality.
Conclusion: Intersecting Factors and Policy Implications
Mortality is not merely a biological inevitability but is deeply shaped by intersecting social, economic, and environmental conditions. Understanding mortality trends through a multifactorial lens helps:
Governments prioritize investments in public health, sanitation, and education.
Healthcare systems target interventions toward vulnerable groups.
Researchers design equitable health policies and interventions.
Communities advocate for structural reforms to reduce health disparities.
Reducing mortality disparities requires a holistic approachโone that integrates biomedical interventions with social justice, economic reform, and inclusive policy frameworks.
Writing about the socio-demographic profile of your city involves presenting key social and demographic characteristics in a structured and informative way. Here’s a simple guide to help you write it effectively:
๐ How to Write the Socio-Demographic Profile of Your City
1. Introduction
Start with a brief introduction of the city:
Name of the city
Location (state, country)
Historical or cultural background (optional)
Purpose of the socio-demographic profile (e.g., for research, planning, development)
Example:
Bhopal, the capital city of Madhya Pradesh, is known for its rich cultural heritage and historical significance. This socio-demographic profile aims to highlight key population characteristics for planning and policy development.
2. Population Characteristics
Include:
Total population
Population growth rate
Population density
Urban vs rural population (if applicable)
Example:
As per the 2011 Census, Bhopal had a population of 1.8 million, with a population density of 8500 persons per sq km. The city has shown a steady population growth of 2.7% annually.
3. Age and Gender Distribution
Age groups (0โ14, 15โ59, 60+)
Sex ratio (number of females per 1000 males)
Example:
The city has a youthful population with 60% in the working-age group (15โ59 years). The sex ratio stands at 918 females per 1000 males.
4. Literacy and Education
Literacy rate (overall, male, female)
Educational institutions and attainment levels
Example:
The literacy rate in Bhopal is 85%, with male literacy at 90% and female literacy at 79%. The city hosts several reputed universities and schools.
5. Occupation and Employment
Major employment sectors (agriculture, industry, services)
Employment rate/unemployment rate
Informal sector data (if available)
Example:
The majority of the population is employed in the service sector, including government jobs, education, and IT services. The informal sector also plays a significant role, particularly in transportation and street vending.
6. Religion and Caste Composition
Dominant religions
Scheduled Castes/Scheduled Tribes percentage
Minorities and their representation
Example:
Hinduism is the predominant religion, followed by Islam. Scheduled Castes form 12% and Scheduled Tribes 3% of the population.
7. Household and Family Structure
Average household size
Type of families (nuclear/joint)
Housing conditions
Example:
The average household consists of 5 members. A shift towards nuclear families has been observed in recent years. A significant percentage of households live in owned, pucca houses.
8. Migration and Mobility
In-migration and out-migration trends
Reasons for migration (education, employment, marriage)
Example:
Bhopal has seen a rise in in-migration, especially from nearby districts, due to better employment and educational opportunities.
9. Access to Basic Services
Water supply, sanitation, electricity
Health care access
Public transport
Example:
90% of the urban population has access to electricity and piped water supply. Public health infrastructure is improving but still needs expansion in peripheral areas.
10. Conclusion
Summarize the key takeaways and mention why understanding these socio-demographic aspects is important for planners, researchers, or policymakers.
Example:
Understanding the socio-demographic fabric of Bhopal helps in identifying developmental needs, planning for infrastructure, and ensuring inclusive growth.
Thomas Robert Malthus (1766โ1834) was an English cleric, scholar, and economist known for his influential theories on population dynamics. His work โAn Essay on the Principle of Populationโ (1798) laid the foundation for demographic studies and influenced generations of economists, policymakers, and scientists. Malthus proposed that population growth, if left unchecked, would inevitably outstrip food production, leading to famine, disease, and societal collapse. This essay explores Malthusโs principles of population, the stages of population growth, and examines them with suitable justifications and examples from history and contemporary society.
Malthusian Principles of Population
Malthusโs population theory revolves around two key principles:
Population Grows Geometrically (Exponential Growth) According to Malthus, human populations tend to grow in a geometric progression (i.e., 1, 2, 4, 8, 16โฆ), doubling every 25 years if unchecked. This rapid growth, he argued, is driven by humansโ natural reproductive tendencies.
Food Supply Grows Arithmetically (Linear Growth) In contrast, Malthus believed that agricultural production increases only in an arithmetic progression (i.e., 1, 2, 3, 4, 5โฆ), limited by land availability, soil fertility, and technological constraints. Therefore, food production cannot keep up with population growth over time.
From this imbalance, he concluded that population growth would eventually surpass the means of subsistence unless checked by โpositiveโ and โpreventiveโ checks.
Malthusian Checks on Population
Malthus identified two types of checks to control population growth:
Preventive Checks โ These are voluntary measures to limit reproduction, including:
Moral restraint (delaying marriage, celibacy)
Birth control (although not explicitly supported by Malthus)
Societal norms limiting family size
Positive Checks โ These are natural consequences that increase the death rate:
Famine
Disease (e.g., plague, cholera)
War
Natural disasters
These checks are natureโs way of restoring the balance between population and resources when preventive measures fail.
Criticism and Relevance of Malthusian Theory
Although revolutionary, Malthusโs theory was criticized for being too pessimistic and for underestimating human innovation. Critics, particularly during and after the Industrial Revolution, pointed out that technological advancements in agriculture (e.g., mechanization, fertilizers, GMOs) have allowed food production to keep pace with or even exceed population growth.
Yet, Malthusโs ideas remain relevant in specific contexts:
In Sub-Saharan Africa, many countries still face challenges like food insecurity and high fertility rates.
The Rwanda genocide (1994) is often cited as a tragic example where high population density, land scarcity, and poverty contributed to conflict.
The concept of โcarrying capacityโ in environmental science, often linked to Malthusian ideas, is used to evaluate the sustainable limits of ecosystems.
Stages of Population Growth: The Demographic Transition Model (DTM)
Although Malthus did not describe population change in stages, modern demography interprets his insights within the Demographic Transition Model (DTM). The DTM outlines five stages of population growth, reflecting changes in birth and death rates over time.
Stage 1: High Stationary Stage
High birth rate and high death rate result in slow population growth.
Pre-industrial societies with poor healthcare, sanitation, and food security.
Example: Medieval Europe, tribal communities in pre-modern Africa or South America.
Justification: High mortality from diseases, famines, and wars limits population expansion.
Stage 2: Early Expanding Stage
High birth rate remains, but death rate declines due to improvements in health, hygiene, and food availability.
Leads to population explosion.
Example: Many African countries today (e.g., Niger, Democratic Republic of Congo).
Justification: Access to vaccinations, clean water, and better nutrition reduces infant mortality, but cultural norms still favor large families.
Stage 3: Late Expanding Stage
Birth rates begin to fall, while death rates continue to decline, slowing population growth.
Transition toward urbanization and industrialization.
Example: India, Egypt, and parts of Southeast Asia.
Justification: Increased education, especially for women, access to contraception, and changes in societal values lead to smaller families.
Stage 4: Low Stationary Stage
Low birth and death rates stabilize the population.
Seen in highly industrialized nations.
Example: United States, United Kingdom, Australia.
Justification: Better living standards, high cost of child-rearing, and career prioritization lead to low fertility rates.
Stage 5: Declining Stage (Optional/Controversial)
Birth rate falls below death rate, leading to population decline.
Aging populations and shrinking workforce become major concerns.
Example: Japan, Germany, South Korea.
Justification: High levels of urbanization, economic pressures, and lifestyle preferences result in fewer children.
Contemporary Relevance and Neo-Malthusianism
While classical Malthusian predictions did not fully materialize, the Neo-Malthusian school emerged in the 20th century, stressing concerns about overpopulation and environmental degradation. The Club of Romeโs โLimits to Growthโ (1972) echoed Malthusian themes, warning about finite resources and ecological collapse.
Today, global challenges such as:
Climate change
Water scarcity
Urban overcrowding
Food insecurity in conflict zones
โฆhave revived interest in Malthusian thinking, especially in policymaking, urban planning, and sustainability discourse.
Conclusion
Thomas Malthusโs population theory, though developed over two centuries ago, continues to influence how we understand demographic dynamics and resource management. His core ideaโthat unchecked population growth has limitsโremains a foundational concern in todayโs globalized world. While technological advancement has postponed the crises Malthus envisioned, uneven development and ecological limits reinforce the importance of balancing population growth with sustainable resource use. The Demographic Transition Model helps contextualize his theory across different stages of development, reminding us that demographic change is not only inevitable but also manageable through informed policy, education, and innovation.
References
Malthus, T. R. (1798). An Essay on the Principle of Population.
UN Department of Economic and Social Affairs, Population Division (2024).
World Bank. (2023). Fertility Rate and Demographic Indicators.
Dehalwar, K., & Sharma, S. N. (2023).ย Fundamentals of research writing and uses of research methodologies. Edupedia Publications Pvt Ltd.
Dehalwar, K., & Sharma, S. N. (2024). Social Injustice Inflicted by Spatial Changes in Vernacular Settings: An Analysis of Published Literature.
Dehalwar, K. (2015).ย Basics of environment sustainability and environmental impact assessment. Edupedia Publications Pvt Ltd.
Dehalwar, K., & Sharma, S. N. (2023). Fundamentals of Area Appreciation and Space Perceptions.
Sharma, S. N., & Dehalwar, K. (2023). Fundamentals of Planning and Design of Housing.
The landscape of education and paediatric mental health has consistently evolved to adapt to the increasing understanding of neurodevelopmental disorders such as Attention Deficit Hyperactivity Disorder (ADHD) and Autism Spectrum Disorder (ASD).ADHD and autism assessment training has become pivotal for practitioners who work within these fields. Proficiency in this area not only promotes accurate diagnosis but also supports the unlocking of individuals’ potential through tailored intervention strategies.
With the complexity and variety of symptoms presented in ADHD and ASD, it is imperative that professionals are equipped with a comprehensive skill set to identify and understand the nuances of these conditions. A specialist approach through dedicated training benefits both the assessor and the clients by ensuring that assessments are carried out effectively and ethically, leading to the appropriate allocation of resources and support.
Understanding ADHD and ASD
ADHD is characterised by excessive activity, difficulty maintaining attention, and impulsive behaviour. Conversely, autism is a developmental disorder that affects communication and behaviour, with a spectrum ranging from high-functioning to more challenging conditions. Although both disorders are distinct, they can share overlapping symptoms, necessitating expertise in differential diagnosis.
Benefits of Training for Practitioners
For practitioners, thorough training in ADHD and autism assessment equips them with the knowledge to discern between the two disorders, and also to identify comorbidities. It contributes to the accuracy of diagnosis, which in turn, informs the direction of subsequent educational and therapeutic interventions.
Multi-Dimensional Assessment Approach
A holistic approach to assessment is vital. This incorporates multiple methodologies, including clinical interviews, behavioural observations, psychoeducational testing, and collaboration with other professionals such as teachers and occupational therapists. Through a multi-dimensional lens, practitioners can gain a comprehensive view of the child’s abilities and challenges.
Embracing Best Practices in Assessment
Embracing best practices in assessment implies staying informed about the latest research, using validated assessment tools, and continuing professional development. Practitioners must also be sensitive to cultural and linguistic diversity in their assessments to uphold inclusivity and equity in the diagnostic process.
Collaboration with Families and Educators
Effective assessments require collaboration with the child’s wider support network. Families and educators play an integral role in providing context and continuity of care, which are essential for successful intervention plans. Equally, practitioners must effectively communicate their findings and recommendations to all stakeholders involved.
Impact on Educational Planning
An accurate diagnosis shapes the educational planning for a child with ADHD or autism. It enables educators to design individualised learning plans that accommodate the child’s needs, strengths, and learning styles. This focus on personalised education maximises a child’s chances for success and encourages their engagement in the learning process.
Empowering Individuals Through Training
Specialist assessment training empowers professionals to make informed decisions that have profound impacts on the lives of individuals with ADHD and autism. By developing a nuanced understanding of these conditions, practitioners can foster supportive environments that enable these individuals to thrive academically, socially, and emotionally.
Professional Development Opportunities
Continuous professional development opportunities are crucial in maintaining a practitioner’s competence in ADHD and autism assessments. The landscape of mental health and educational intervention is continually evolving, and it is therefore essential that practitioners remain current with emerging practices and theories.
Transformative Outcomes
The efficacy of comprehensive ADHD and autism assessment training translates into transformative outcomes for the individuals concerned. With the right diagnosis and support, there is tremendous potential for individuals with ADHD or autism to lead fulfilling and productive lives.
Choosing the Right Training Program
When seeking training programs for ADHD and autism assessments, it is necessary to select programs that offer the depth and breadth of knowledge required. Training should encompass current methodologies and ethical standards, and be delivered by experienced professionals in the field.
The Role of Technology in Assessment
Technology has made substantial contributions to the field of assessment, facilitating the use of interactive tools and online platforms. It allows for engaging and accurate assessment procedures, making training in technology usage a key component of current assessment programs.

Conclusion
Mastering the complexities of ADHD and autism assessments is a challenging but rewarding endeavour. It provides professionals with the capability to identify and aid some of the most vulnerable in society. The ongoing pursuit of excellence in this field through comprehensive assessment training programs is essential in realising the full potential of individuals with ADHD and autism. For assessors committed to unlocking this potential, the acquisition of these specialised skills is an invaluable investment in their professional expertise and in the lives of those they serve.
In summary, the mastery of ADHD and autism assessment is not just a professional requirement but a moral imperative that stands to positively change the trajectory of many young lives. By engaging in dedicated ADHD and autism assessment training, professionals are equipped to unlock the doors to a brighter future for children and adults alike, serving as catalysts in their journey towards a fulfilling and self-sufficient life.
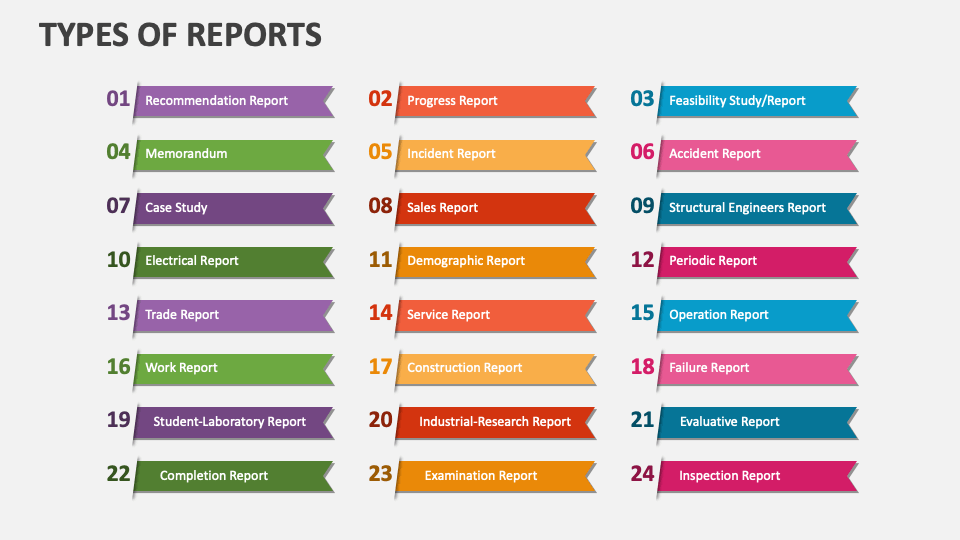
In todayโs evolving academic landscape, scholars who complete their PhDs often find themselves faced with two prominent early-career options: pursuing a postdoctoral research position (postdoc) or accepting a role as a contract (or adjunct) faculty member. While both roles allow scholars to remain within the academic ecosystem and contribute meaningfully to their institutions, they differ significantly in purpose, expectations, responsibilities, and long-term career implications.
This blog post provides a detailed comparison between postdoctoral positions and contract faculty roles to help early-career academics make informed choices based on their goals, interests, and aspirations.
1. Purpose and Primary Focus
Postdoctoral Researcher:
Purpose: To deepen research expertise, gain independence, and build a strong academic portfolio (publications, grants, collaborations).
Focus: Primarily research-oriented, though may include limited teaching, supervision, or mentoring.
Postdocs are seen as a transitional phase between PhD and a permanent research or faculty position.
Contract Faculty:
Purpose: To meet institutional teaching needs, often on a temporary or semester-wise basis.
Focus: Primarily teaching-focused, with heavy course loads and little to no research expectations or funding.
Positions are often renewed annually or by semester and are driven by immediate teaching demand rather than long-term research output.
2. Job Responsibilities
Postdoc:
Conducts advanced research under a principal investigator (PI) or independently.
Writes and publishes scholarly articles.
Applies for research grants or fellowships.
May supervise graduate students and present findings at conferences.
Occasionally teaches a course or guest lectures, but this is not always required.
Contract Faculty:
Teaches multiple courses each semester, often across different subjects or departments.
Engages in limited to no research, as institutional support and time for research are minimal.
May advise students or participate in administrative tasks but lacks formal power or long-term influence within departments.
3. Employment Status and Benefits
Postdoc:
Typically hired on a fixed-term research contract (1โ3 years), often with renewal based on funding.
May be funded through a grant, fellowship, or institutional program.
Benefits (healthcare, retirement) vary widely by institution and country.
Seen as a “trainee” role in many systems, meaning less job security and fewer employee rights.
Contract Faculty:
Employed on semester-wise or annual contracts.
Often receives a fixed teaching stipend per course or term.
Limited or no access to health benefits, research funds, or sabbaticals.
Considered contingent faculty, with little institutional leverage and minimal chances of promotion.
4. Career Advancement and Future Prospects
Postdoc:
Designed as a stepping stone to a tenure-track or permanent research position.
Successful postdocs can transition to assistant professor roles, research scientists, or independent investigators.
Opportunities to build a strong CV through publications, grants, and collaborative projects.
Competitive, with pressure to achieve high research output in a short time.
Contract Faculty:
Advancement options are limited.
Rarely leads to tenure-track positions unless institutional hiring policies change or the candidate has an exceptional teaching and research record.
More suitable for those who want to focus on teaching or are using the position as a temporary option while seeking permanent roles.
Can serve as a long-term career for some, but often lacks stability or upward mobility.
5. Skill Development and Academic Profile
Postdoc:
Gains high-level research experience, advanced technical skills, and exposure to interdisciplinary work.
Develops grant writing, project management, and academic publishing expertise.
Builds a profile attractive to research institutions and funding agencies.
Contract Faculty:
Gains extensive teaching experience, including curriculum design, classroom management, and student assessment.
May improve public speaking, time management, and student mentorship skills.
Less emphasis on research means slower growth in publishing or funding record, which could hinder research-based academic job applications.
6. Institutional Role and Recognition
Postdoc:
Valued as part of the research infrastructure of the institution.
Contributes to scientific output, lab productivity, and innovation.
Often works behind the scenes and may lack visibility or formal status in departmental decision-making.
Contract Faculty:
Plays a crucial role in teaching and curriculum delivery.
Students may view them as primary educators, but institutions may offer little recognition, respect, or support.
Often excluded from faculty meetings, tenure discussions, or strategic planning.
7. Geographic and Disciplinary Variations
In STEM fields, postdoc positions are more common and often necessary before applying for tenure-track jobs.
In humanities and social sciences, contract faculty roles are more prevalent due to fewer postdoc opportunities and lower research funding.
Different countries also treat these roles differently. For example, in Europe, postdocs are often better compensated and more integrated into academic systems than in some parts of Asia or North America.
Which Path Should You Choose?
The decision between a postdoc and a contract faculty position depends on your long-term career goals:
Goal
Recommended Path
Want a research-intensive academic career
Postdoc
Want to gain more publications and grants
Postdoc
Interested in teaching as a primary profession
Contract Faculty
Need a short-term academic job for financial or location reasons
Contract Faculty
Planning to move to industry later
Either, depending on field and role
Conclusion: Two Paths, Different Journeys
Both postdoc and contract faculty roles are vital to the functioning of academic institutions. Each offers unique experiences, benefits, and challenges. While postdoctoral positions favor research-intensive growth and are ideal for those aiming for research careers, contract faculty roles provide stability in teaching and can serve as meaningful academic experiences, particularly for those passionate about pedagogy.
Understanding the differences between the two can help early-career scholars make strategic decisions about where to invest their time, energy, and passion. Regardless of the path chosen, each role offers opportunities to contribute to academia and shape the future of knowledge.
Embarking on a PhD is much more than a research endeavorโit’s an emotional and intellectual expedition. The journey is not a straight line but a progression through different zones that shape your development as a scholar. Understanding these zonesโComfort, Fear, Learning, and Growthโcan help you reflect, adapt, and thrive. Letโs explore each one and how to navigate them.
1. The Comfort Zone: Where Everything Feels Safe but Stagnant
At the beginning of your PhDโor even during the long, quiet research phasesโitโs easy to settle into the comfort zone. This is the space of familiarity, predictability, and low risk.
Here, you do what you know:
You read the same familiar authors.
You engage with ideas that donโt challenge you.
You hesitate to speak up in seminars or share your work.
This zone feels safe, but it’s deceptive. Staying too long here can lead to intellectual stagnation and a false sense of progress. You might feel “busy,” but youโre not necessarily growing.
Signs you’re stuck:
You avoid presenting your work.
You rarely ask questions in research meetings.
You havenโt written or submitted anything new.
You’re not pushing your intellectual boundaries.
How to break out: Take small steps:
Attend a journal club.
Present just one slide in a research seminar.
Read something outside your primary topic.
Engage in a new conversation that challenges your assumptions.
Stretching your comfort zone incrementally is the key to unlocking progress.
2. The Fear Zone: When Self-Doubt Takes the Lead
Almost every PhD student enters the fear zone at some point. This is the stage where anxiety, uncertainty, and imposter syndrome creep in.
You begin to question:
โIs my idea good enough?โ
โWill I be rejected?โ
โAm I behind compared to others?โ
You might endlessly revise a paper not because itโs not readyโbut because youโre not ready. You delay submissions. You shy away from your supervisor. The what ifs become louder than your goals.
Signs you’re in the fear zone:
You revise endlessly but never submit.
You compare yourself constantly to others.
You avoid discussing your work.
You assume you’re not good enough.
How to move forward:
Submit anyway. Feedback is part of the process.
Share your fears with peers or supervisorsโyouโll realize theyโre common.
Accept that fear signals careโit means your work matters to you.
Donโt let fear paralyze you. Let it push you toward the learning that follows.
3. The Learning Zone: Where Real Progress Begins
If comfort is stillness and fear is hesitation, the learning zone is momentum. This is where your PhD starts to take formโnot just in output, but in confidence.
Hereโs what changes:
You submit papersโsome are accepted, others arenโt.
You attend conferences not just to listen, but to present.
You try new tools (like R, Zotero, or NVivo) to refine your work.
You explore collaborations across departments or even countries.
You begin to see research as a journey. You seek feedback instead of fearing it. You’re not perfect, but you’re productive.
Signs youโre in the learning zone:
You attend and present at academic events.
You explore new methods or technologies.
You maintain a pipeline of papers at various stages.
You talk with researchers beyond your department.
How to stay here:
Be consistent, not perfect.
Track progress: one small win each week adds up.
Reflect: What did I learn this month? Who did I learn it from?
The learning zone isn’t about having all the answersโit’s about being curious enough to keep asking questions.
4. The Growth Zone: Where Research Becomes Impact
This is where your PhD transforms from personal development to public contribution. In the growth zone, your work has purpose beyond the thesis.
You start connecting your research to real-world challenges. Whether itโs policy, society, or industryโyou now see your research as a piece of a larger puzzle.
You publish not just to graduate, but to inform. You apply for grants. You mentor juniors. Youโre invited to speak, review, or teach. Feedback is no longer threateningโitโs a valuable tool.
Signs youโre in the growth zone:
Your work addresses real-world or interdisciplinary issues.
You publish in respected journals.
You collaborate with industry or global teams.
You contribute to grant proposals or research policy.
Youโre invited to review or speak.
How to stay here:
Stay purpose-driven, not output-obsessed.
Keep learningโbut also keep teaching.
Donโt forget your why. Let it guide your next steps.
You might not live in the growth zone every dayโbut once you’ve been here, you’ll know what you’re striving for.
Final Thoughts: All Zones Are Natural
Itโs important to remember: youโll pass through all these zonesโsometimes more than once. You are not failing if you’re in the comfort zone. You are not weak if you’re struggling in fear.
What matters is that you donโt get stuck.
The PhD journey is less about perfection and more about progress.
So hereโs the simplest goal:
Move. Learn. Grow.
Pause today and ask yourself:
Where am I right now?
Whatโs one small step I can take this week?
Every slide presented, every draft submitted, every conversation initiatedโit all counts. Your growth is happening, even when you donโt see it.
Stay honest. Stay brave. Keep moving forward.
Your PhD is not just a degreeโit’s your transformation.
References
Gould, J. (2015). How to build a better PhD.ย Nature,ย 528(7580), 22.
Bunton, D. (2005). The structure of PhD conclusion chapters.ย Journal of English for academic purposes,ย 4(3), 207-224.
Dehalwar, K. (2015).ย Basics of environment sustainability and environmental impact assessment. Edupedia Publications Pvt Ltd.
Dehalwar, K., & Sharma, S. N. (2023).ย Fundamentals of research writing and uses of research methodologies. Edupedia Publications Pvt Ltd.
Hockey, J. (1991). The social science PhD: A literature review.ย Studies in Higher Education,ย 16(3), 319-332.
Kumar, G., Vyas, S., Sharma, S. N., & Dehalwar, K. (2025). Urban growth prediction using CA-ANN model and spatial analysis for planning policy in Indore city, India.ย GeoJournal,ย 90(3), 139.
Sharma, S. N., & Dehalwar, K. (2023). Fundamentals of Planning and Design of Housing.
Sharma, S. N., & Dehalwar, K. (2025). A Systematic Literature Review of Transit-Oriented Development to Assess Its Role in Economic Development of City.ย Transportation in Developing Economies,ย 11(2), 23.
Sharma, S. N., Singh, S., Kumar, G., Pandey, A. K., & Dehalwar, K. (2025, June). Role of Green Buildings in Creating Sustainable Neighbourhoods. Inย IOP Conference Series: Earth and Environmental Scienceย (Vol. 1519, No. 1, p. 012018). IOP Publishing.
Sharma, S. N., & Dehalwar, K. (2025). Assessing the Transit-Oriented Development and Travel Behavior of the Residents in Developing Countries: A Case of Delhi, India.ย Journal of Urban Planning and Development,ย 151(3), 05025018.
Sharma, S. N., Singh, D., & Dehalwar, K. (2024). Surrogate safety analysis-leveraging advanced technologies for safer roads.ย Suranaree Journal of Science and Technology,ย 31(4), 010320.
Van Rooij, E., Fokkens-Bruinsma, M., & Jansen, E. (2021). Factors that influence PhD candidatesโ success: the importance of PhD project characteristics.ย Studies in Continuing Education,ย 43(1), 48-67.
Traditional fourโstep models aggregate trips and treat demand as static, making them illโsuited for todayโs dynamic mobility landscape. Activityโbased approaches overcome these limits by simulating what people actually doโtheir daily activity programmesโand deriving the travel those activities generate. One of the earliest and most influential of these systems is ALBATROSSโฏโโฏAโฏLearningโBasedโฏTransportation Oriented Simulation System, developed at Eindhoven University of Technology for the Dutch Ministry of Transport at the turn of the century. Over 25โฏyears the platform has matured from a proofโofโconcept scheduler into a multiโday, multiโagent laboratory used for policy design across Europe and beyond. journals.sagepub.comjournals.sagepub.com
2โฏโฏConceptual Foundations
ALBATROSS is ruleโbased rather than utilityโmaximising. The system first mines activityโdiary data with the CHAID decisionโtree algorithm, extracting a hierarchy of โifโthenโ rules (e.g., if female, fullโtime worker, weekday โ schedule work between 08:00โ16:30). During simulation each synthetic agent consults this rule base when deciding
Whether to perform an activity,
Where to do it,
With whom,
When and for how long, and
Which mode/route to use.
Logical, spatial, temporal and institutional constraints (e.g., shop opening hours, maximum travel time budgets) are enforced by a dedicated repair agent that reschedules infeasible programmes until a coherent 24โh agenda emerges. The microโsimulation then translates the agenda into timeโstamped trips, producing OD matrices, route flows and emissions inventories that can feed mesoโ or microsimulation assignment models. journals.sagepub.com
26 decisionโtrees; thousands of conditional rules
Scheduler
Generates daily agendas sequentially
Rule base, constraints, landโuse GIS
Activity lists with startโend times
Constraint Repair
Ensures feasibility
Transport network, opening hours
Revised agendas
Mobility Allocator
Assigns mode/route
Networks, service levels, fare tables
Trip records with mode, path, time
4โฏโฏEvolution of ALBATROSS
Version
Milestones & New Capabilities
1.0โฏ(2000)
Ruleโbase extracted from Dutch National Travel Survey; singleโday forecasts; validation on Eindhoven region. journals.sagepub.com
Transferability Testsโฏ(2002)
Rules trained in one town applied to two others; 75โ90โฏ% accuracy in activity participation & timing, demonstrating spatial transferability. journals.sagepub.com
FEATHERS Integrationโฏ(~2008)
Scheduler embedded in Flemish FEATHERS framework; added population synthesis, assignment and emission calculators for policy analysis in Belgium. mdpi.com
Scenario Engineโฏ(2012)
Used to explore ageingโpopulation scenarios, adjusting lifeโcycle parameters and leisure propensities. link.springer.com
ALBATROSSโฏIVโฏ(2018)
Multiday horizon; lifeโtrajectory events, weather sensitivity, EV choice, carโsharing, MaaS, energy modules, parallel computing (40ร faster). trid.trb.org
2020โ24 Extensions
Realโtime calibration with smartphone GPS, synthetic social networks, API hooks for dynamic traffic assignment and digitalโtwin dashboards (ongoing PhD and Horizon Europe projects). intechopen.com
5โฏโฏApplications in Travel Prediction
5.1โฏUrban Pricing & DemandโManagement
Dutch metropolitan authorities employ ALBATROSS to test cordon tolls, parking pricing and speedโlimit schemes. Simulations capture peakโspreading and interโmodal shifts more realistically than fourโstage models because agents can reโtime or chain activities.
5.2โฏInfrastructure & Service Planning
By feeding ALBATROSS output OD matrices into dynamic assignment models (e.g., PTVโฏVisum, Aimsun), planners evaluate queueโlengths and unreliability on future corridors, supporting phased rail upgrades and BRT projects.
5.3โฏSocioโDemographic Scenarios
The ageingโpopulation study showed that postponing retirement age by five years increases AM peak trips by only 2โฏ% but raises midday leisure travel 15โฏ%, demanding offโpeak service adjustments rather than additional peak capacity. link.springer.com
5.4โฏNew Mobility Services
ALBATROSSโฏIV embeds choice sets for carโsharing, demandโresponsive transit and MobilityโasโaโService bundles. Policy labs in Utrecht and Antwerp evaluate subscription tariffs and stationโbased EV fleets, projecting up to 8โฏ% privateโcar VKT reduction under high adoption. trid.trb.org
5.5โฏEnergy & Emissions Accounting
The integrated fuelโandโemission ledger combined with activity diaries produces hourly emission profiles, enabling lowโemissionโzone design and benchmarking against EU Fitโforโ55 targets.
5.6โฏTransferability to Emerging Contexts
While most case studies are European, the ruleโbased architecture is dataโagnostic. Pilot calibrations using Delhiโs 2018 household survey demonstrate that 60โฏ% of rules remain valid after reโestimation of only timeโwindow parametersโpromising for quick deployment in TOD influence zones such as Mukundpur or Dwarka.
6โฏโฏValidation & Performance
Activity participation: Mean Absolute Error (MAE) โโฏ3โฏ% by activity purpose.
Startโtime distributions: KolmogorovโSmirnov Dโฏโคโฏ0.08 across three Dutch cities.
Mode splits: Within ยฑ4โฏ% of observed for work, education, shopping.
Rule logic may โlockโinโ past behaviour; limited behavioural dynamics without reโtraining
Fast microsimulationโsuitable for scenario sweeps
Less grounded in microโeconomic theory than utilityโbased models
Modularโcan slot into landโuse, energy, emissions pipelines
Constraint repair can fail under extreme counterfactuals, needing manual tuning
8โฏโฏFuture Research Directions
Hybrid MLโฏ+โฏRule Systems: Use gradientโboosted trees or graph neural nets to update rule probabilities on streaming data.
Realโtime Digital Twins: Fuse ALBATROSS with mobileโphone OD inference for 15โminute rolling forecasts of transit loads.
EquityโAware Modules: Embed genderโ, incomeโ and accessibilityโexplicit welfare indicators to align with SDGโฏ11.
Integration with Dynamic Traffic Assignment (DTA): Tight coupling to dayโtoโday traffic flow signals to study shock propagation (e.g., metro shutdowns, extreme weather).
Deployment in Global South: Rapid calibration toolkits and openโsource rule libraries to help cities like Delhi, Jakarta and Lagos leapfrog from fourโstage models to activityโbased analytics.
9โฏโฏConclusion
ALBATROSS pioneered ruleโbased activity scheduling and remains a versatile engine for travel prediction. Its dataโdriven rule hierarchies offer transparency and computational efficiency, while successive versions have incorporated multiday dynamics, new mobility options and environmental accounting. Realโworld applicationsโfrom Dutch toll pilots to Belgian EV scenariosโshow that ALBATROSS can reproduce complex behavioural responses and guide evidenceโbased transport policy. As richer data streams and realโtime digital twins become mainstream, ALBATROSSโs modular design positions it well to remain at the heart of nextโgeneration travelโprediction ecosystemsโhelping planners shape sustainable, equitable and resilient mobility futures.
References
Application of Albatross for Scenario Development: Future Travel Behavior in an Ageing Population. (2012). In T. Arentze & H. Timmermans, Springer Geography (pp. 147โ171). Springer Netherlands. https://doi.org/10.1007/978-94-007-2518-8_8
Arentze, T., Hofman, F., Van Mourik, H., & Timmermans, H. (2000). ALBATROSS: Multiagent, Rule-Based Model of Activity Pattern Decisions. Transportation Research Record: Journal of the Transportation Research Board, 1706(1), 136โ144. https://doi.org/10.3141/1706-16
Arentze, T., Hofman, F., Van Mourik, H., & Timmermans, H. (2002). Spatial Transferability of the Albatross Model System: Empirical Evidence from Two Case Studies. Transportation Research Record: Journal of the Transportation Research Board, 1805(1), 1โ7. https://doi.org/10.3141/1805-01
Recent Progress in Activity-Based Travel Demand Modeling: Rising Data and Applicability. (2021). In A. Tajaddini, G. Rose, K. M. Kockelman, & H. L. Vu, Models and Technologies for Smart, Sustainable and Safe Transportation Systems. IntechOpen. https://doi.org/10.5772/intechopen.93827
Sharma, S. N., & Dehalwar, K. (2025). Assessing the Transit-Oriented Development and Travel Behavior of the Residents in Developing Countries: A Case of Delhi, India. Journal of Urban Planning and Development, 151(3), 05025018. https://doi.org/10.1061/JUPDDM.UPENG-5468
Sharma, S. N., Kumar, A., & Dehalwar, K. (2024). The Precursors of Transit-oriented Development. Economic & Political Weekly, 59(14), 16โ20. https://doi.org/10.5281/zenodo.10939448
Citing research papers is a fundamental part of academic writing. Whether you are writing a term paper, thesis, dissertation, journal article, or conference paper, proper citation ensures your work is credible, ethical, and built upon established knowledge. Failure to cite sources appropriately can lead to accusations of plagiarism and academic dishonesty. This article provides a comprehensive guide on how to cite a research paper correctly, with examples, citation styles, tips, and tools.
1. Why Citation Matters
Citing a research paper serves several important purposes:
Acknowledgment: It gives credit to the original author(s) for their work and ideas.
Transparency: It allows readers to trace the origin of facts, arguments, or data.
Support: It strengthens your arguments by backing them with scholarly evidence.
Citing is not just about formality; itโs about engaging in a scholarly conversation with the research community.
2. When to Cite
You should cite a research paper (or any source) in your own paper when:
You quote directly from another source.
You paraphrase or summarize someone else’s ideas.
You use data, figures, or tables from other research.
You refer to findings, theories, or arguments proposed in a previous study.
You want to critique, compare, or contrast previous literature.
However, common knowledge (e.g., “The Earth revolves around the sun”) does not need citation.
3. Choosing the Right Citation Style
Different disciplines use different citation styles. The most commonly used styles include:
APA (American Psychological Association): Used in social sciences, education, and psychology.
MLA (Modern Language Association): Used in literature, humanities, and arts.
Chicago/Turabian: Used in history, fine arts, and some social sciences.
IEEE (Institute of Electrical and Electronics Engineers): Used in engineering and computer science.
Harvard Style: Common in many fields in UK and Commonwealth countries.
Check your journalโs or institutionโs guidelines before starting. Each style has its own format for in-text citations and references.
4. In-Text Citation: How to Cite Within the Body
Citations in the body of your paper are known as in-text citations. Their purpose is to briefly identify the source of the information and link it to a more detailed reference at the end of the paper.
a. APA Style (Author-Date)
Example: Urban heat islands significantly affect city temperatures (Oke, 1982).
b. MLA Style (Author-Page)
Example: “The city breathes differently in summer” (Oke 45).
c. Chicago Style (Footnote)
Example: The phenomenon of urban heat islands is well-documented.ยน ยนTimothy R. Oke, Boundary Layer Climates (London: Routledge, 1982), 45.
d. IEEE Style (Numbered)
Example: As shown in previous studies [1], temperature anomalies are common in urban cores.
Paraphrased content still needs citationโeven if the wording is your own.
5. Reference List or Bibliography
This section comes at the end of your paper and provides complete details of each source cited in the text. The format depends on the citation style.
a. APA Style
Oke, T. R. (1982). Boundary Layer Climates. Routledge.
b. MLA Style
Oke, Timothy R. Boundary Layer Climates. Routledge, 1982.
c. Chicago Style
Oke, Timothy R. Boundary Layer Climates. London: Routledge, 1982.
d. IEEE Style
[1] T. R. Oke, Boundary Layer Climates, London: Routledge, 1982.
Ensure consistency throughout the paper. Every in-text citation must match a reference entry.
6. Citing Online Research Papers
Online research papersโwhether open-access or behind paywallsโmust be cited with attention to the source URL or DOI.
MLA: Srivastava, Amit. “Smart Mobility in Indian Cities.” Journal of Urban Studies, vol. 25, no. 3, 2023, pp. 45โ58. doi:10.1234/jus.2023.00321.
If no DOI is available, include the full URL and the access date if required.
7. Quoting, Paraphrasing, and Summarizing
a. Quoting
Use the exact words from the source within quotation marks.
โThe smart city concept remains vaguely definedโ (Mehta, 2020, p. 112).
b. Paraphrasing
Rewriting the original idea in your own words.
Mehta (2020) notes that there is no universally accepted definition of the smart city model.
c. Summarizing
Condensing the main idea of a larger section or paper.
Recent literature outlines multiple challenges in operationalising the smart city framework (Mehta, 2020).
Avoid overusing direct quotesโparaphrasing shows your understanding and is preferred in most academic contexts.
8. Avoiding Common Mistakes
Do not mix citation styles. Choose one and follow it consistently.
Always cite the original source rather than citing another authorโs mention of it (unless you’re citing a secondary source explicitly).
Be careful with auto-generated citationsโdouble-check them for accuracy.
Avoid citing too few or too many papers. Strike a balance between showing your literature awareness and making an original contribution.
9. Using Citation Management Tools
There are many tools to help you organize and generate citations:
Zotero (Free and open-source; great for browser capture and Word integration)
Mendeley (Popular among STEM fields)
EndNote (Commercial but powerful; widely used in academia)
CiteThisForMe and EasyBib (Online tools for quick citation generation)
Google Scholar (Provides citation formats in multiple stylesโclick the โciteโ icon under each result)
These tools can save time, especially when dealing with large numbers of references, and reduce human error.
10. Final Tips for Ethical and Effective Citation
Stay organized: Start collecting citations while reviewing literature.
Take notes: Write down the context in which you plan to use each paper.
Use a citation tracker: Keep a spreadsheet or use software to track what youโve cited and where.
Follow journal guidelines: Each publisher may have unique formatting rules.
Lastly, always err on the side of over-citing rather than under-citing. It shows respect for intellectual property and safeguards your work from plagiarism.
Conclusion
Citing research papers while writing your own paper is an essential skill that reflects your academic integrity, diligence, and respect for scholarship. It ensures that your contributions are contextualized within the broader body of knowledge, and that your readers can follow your intellectual journey. By understanding when and how to cite, choosing the correct style, and using helpful tools, you can produce clear, ethical, and well-structured academic writing.
Let your citations tell the story of how your research is part of a larger academic conversationโand let them empower your arguments, not just support them.
References
Dehalwar, K., & Sharma, S. N. (2023).ย Fundamentals of research writing and uses of research methodologies. Edupedia Publications Pvt Ltd.
Dehalwar, K., & Sharma, S. N. (2024). Politics in the Name of Womenโs Reservation.ย Contemporary Voice of Dalit, 2455328X241262562.
Jain, S., Dehalwar, K., & Sharma, S. N. (2024). Explanation of Delphi Research Method and Expert Opinion Surveys.
Kumar, G., Vyas, S., Sharma, S. N., & Dehalwar, K. (2023). Planning and Development of Housing in Urban Fringe Area: Case of Bhopal (MP).ย GIS Business,ย 18(1), 1-14.
Sharma, S. N., Dehalwar, K., & Singh, J. (2024). Emerging techniques of solid waste management for sustainable and safe living environment. Inย Solid Waste Management: Advances and Trends to Tackle the SDGsย (pp. 29-51). Cham: Springer Nature Switzerland.
Sharma, S. N., & Dehalwar, K. (2025). Assessing the Transit-Oriented Development and Travel Behavior of the Residents in Developing Countries: A Case of Delhi, India.ย Journal of Urban Planning and Development,ย 151(3), 05025018.
Sharma, S. N., & Dehalwar, K. (2025). A Systematic Literature Review of Transit-Oriented Development to Assess Its Role in Economic Development of City.ย Transportation in Developing Economies,ย 11(2), 1-21.
In the competitive landscape of today’s job market, gaining practical experience has become more crucial than ever. Internships stand as invaluable opportunities for individuals to bridge the gap between theoretical knowledge and real-world application. Beyond merely padding a resume, internships serve as transformative experiences that shape careers and futures. Let’s delve into why internships are so vital in the journey of professional growth.
Internships offer hands-on experience that classrooms often can’t replicate. Whether in a corporate setting, research lab, or non-profit organization, interns have the chance to apply their theoretical knowledge to actual projects, tasks, and challenges. This practical exposure not only enhances their understanding but also equips them with skills that are highly valued by employers.
2. Skill Development:
Internships provide a platform for skill development across various domains. From communication and teamwork to problem-solving and adaptability, interns are immersed in an environment that demands multifaceted skills. Moreover, they often have the opportunity to learn industry-specific tools, technologies, and best practices, giving them a competitive edge in their chosen field.
3. Networking Opportunities:
The connections made during an internship can be invaluable. Interns interact with professionals in their field, building relationships that could potentially lead to mentorship, job opportunities, or valuable recommendations in the future. Networking within the industry not only enhances career prospects but also fosters a sense of community and support.
4. Clarifying Career Goals:
Internships serve as a testing ground for career aspirations. Many students enter internships with a general idea of their desired career path but may find their interests evolving as they gain practical experience. Internships offer a low-risk environment to explore different roles, industries, and work cultures, helping individuals clarify their career goals and make informed decisions about their future.
5. Resume Enhancement:
A solid internship experience can significantly bolster a resume. Employers often seek candidates with relevant work experience, and internships provide exactly that. Even if the internship is not directly related to the desired job, the transferable skills and demonstrated initiative are highly valued by recruiters. Internship experiences can set candidates apart in a competitive job market, increasing their chances of landing desirable positions.
6. Confidence Building:
Internships are not just about acquiring technical skills; they also contribute to personal growth. Successfully navigating the challenges of an internship instills confidence in interns, validating their abilities and preparing them for future professional endeavors. Overcoming obstacles, receiving constructive feedback, and achieving tangible results during an internship can significantly boost self-assurance and resilience.
7. Pathway to Employment:
For many, internships serve as a pathway to full-time employment. Employers often use internships as a recruitment tool, preferring to hire candidates who have already demonstrated their capabilities and fit within the organizational culture. Interns who perform well and exhibit a strong work ethic are more likely to be offered permanent positions, making internships a strategic investment in one’s future career.
In conclusion, internships play a pivotal role in shaping the next generation of professionals. They offer a dynamic learning environment where individuals can develop skills, clarify career goals, build networks, and gain the confidence needed to thrive in today’s workforce. Embracing the opportunities presented by internships is not only advantageous for individual career growth but also contributes to a more skilled and adaptable workforce overall. Therefore, students and aspiring professionals alike should actively seek out and make the most of internship opportunities available to them.
References
Binder, J. F., Baguley, T., Crook, C., & Miller, F. (2015). The academic value of internships: Benefits across disciplines and student backgrounds. Contemporary Educational Psychology, 41, 73-82.
Bukaliya, R. (2012). The potential benefits and challenges of internship programmes in an ODL institution: A case for the Zimbabwe Open University. International journal on new trends in education and their implications, 3(1), 118-133.
Davis, J., Steen, T., & Rubin, S. (1987). A study of the internship experience. Journal of Experiential Education, 10(2), 22-24.
Metzger, S. V. (2002). Employers’ perceptions of the benefits of college internship programs. University of Idaho.
Narayanan, V. K., Olk, P. M., & Fukami, C. V. (2010). Determinants of internship effectiveness: An exploratory model. Academy of Management Learning & Education, 9(1), 61-80.
Sharma, S. N. Enhancing Safety Analysis with Surrogate Methods: A Focus on Uncontrolled Traffic Intersections.
Sharma, S. N. The Complex Reality of Delhiโs Slums: A Closer Look at Urban Informality.
Wolinsky-Nahmias, Y., & Auerbach, A. H. (2022). Evaluating the design and benefits of internship programs. Journal of Political Science Education, 18(4), 584-604.
Family and social structures serve as the cornerstone of human society, providing support, guidance, and a sense of belonging. These intricate webs of relationships shape our identities, influence our behaviors, and contribute significantly to our overall well-being. Understanding the dynamics of family and social structures offers insights into the fabric of society and the mechanisms through which individuals interact and thrive.
The Importance of Family: Family, in its various forms, plays a pivotal role in shaping individuals from early childhood through adulthood. The nuclear family, consisting of parents and their children, forms the basic unit of society. Within this unit, familial bonds are nurtured, values are transmitted, and emotional support is provided. Beyond the nuclear family, extended families, comprising relatives such as grandparents, aunts, uncles, and cousins, offer additional layers of support and interconnectedness.
The family serves as a primary agent of socialization, imparting cultural norms, values, and traditions to its members. Through interactions within the family unit, individuals learn essential life skills, develop their identities, and acquire social roles. Moreover, the family provides emotional security and serves as a buffer against the stresses of life, fostering resilience and cohesion.
Variations in family structures exist across cultures and societies, reflecting diverse norms, beliefs, and practices. While some societies emphasize extended family networks and communal living arrangements, others prioritize nuclear family units and individual autonomy. These variations underscore the adaptive nature of family structures in response to socio-cultural contexts and economic realities.
Challenges and Transformations: Despite its significance, the traditional notion of the family has undergone considerable transformation in recent decades. Socioeconomic changes, such as urbanization, globalization, and economic disparities, have reshaped family dynamics and roles. Factors such as increased mobility, dual-career households, and shifting gender norms have altered traditional family patterns, leading to greater diversity in family structures and functions.
Challenges such as family breakdown, divorce, and single-parent households highlight the complexities inherent in contemporary family life. While these changes may pose challenges, they also offer opportunities for redefining family roles, fostering inclusivity, and promoting resilience. Moreover, alternative family arrangements, including blended families, same-sex partnerships, and chosen families, challenge conventional norms and expand the notion of kinship and support networks.
Social Structures and Community: Beyond the family unit, social structures encompass broader networks of relationships and affiliations within society. These structures include friendships, community organizations, religious institutions, and professional networks, among others. Social structures provide avenues for social interaction, cooperation, and collective action, contributing to social cohesion and mutual support.
Communities serve as essential extensions of the family, offering additional layers of social support and belonging. Within communities, individuals forge connections, share resources, and collaborate on shared goals and interests. Moreover, communities play a vital role in fostering social capital, promoting civic engagement, and addressing collective challenges such as poverty, inequality, and social injustice.
Conclusion: Family and social structures form the scaffolding of human society, shaping our identities, relationships, and experiences. From the intimate bonds of the family unit to the broader networks of community and society, these structures provide the foundation for individual growth, collective well-being, and societal resilience. As society continues to evolve, understanding and nurturing these bonds are essential for fostering inclusive, thriving communities where all individuals can flourish.
References
Garland, D. S. R. (1990). Creating and Nurturing Families.ย Review & Expositor,ย 87(2), 317-334.
Holland, M. (2012).ย Social bonding and nurture kinship: compatibility between cultural and biological approaches. Maximilian Holland.
Bengtson, V. L. (2001). Beyond the nuclear family: the increasing importance of multigenerational bonds: the burgess award lecture.ย Journal of marriage and family,ย 63(1), 1-16.
Hoffmann, J. P., & Dufur, M. J. (2018). Family social capital, family social bonds, and juvenile delinquency.ย American Behavioral Scientist,ย 62(11), 1525-1544.
The Renaissance period in Europe (14thโ17th century) marked a transformative phase in the history of urban planning. Emerging after the Medieval era, it represented a shift from irregular, defense-oriented towns to planned, aesthetically ordered, and human-centered cities. Inspired by the revival of classical Greek and Roman ideas, Renaissance planners emphasized geometry, symmetry, proportion, and visual harmony.
This period laid the foundation for modern urban design by integrating art, architecture, and planning into a unified vision.
1. Context of Renaissance Urban Development
7
Key Influences:
Revival of classical knowledge (Greek and Roman)
Growth of trade and wealthy merchant classes
Rise of powerful city-states (Italy, France)
Decline of feudalism and reduced need for defense
Planning Implication:
Focus shifted from security โ aesthetics, order, and civic life
2. Key Characteristics of Renaissance Planning
2.1 Geometric and Symmetrical Planning
Cities designed using regular geometric forms
Emphasis on symmetry, proportion, and balance
2.2 Planned Urban Spaces
Introduction of designed squares (piazzas)
Streets aligned to create visual perspectives
2.3 Integration of Architecture and Urban Design
Buildings and spaces designed as a unified composition
Planning Principle:
City as a work of art (urban aesthetics and order)
3. Radial and Axial Planning
6
Features:
Roads radiating from a central point
Straight avenues connecting key landmarks
Visual corridors and axes
Examples:
Palmanova
Versailles
Planning Principle:
Visual order and monumentality
Emphasis on perspective and movement
4. Piazza (Public Square) as Urban Core
6
Characteristics:
Central open space surrounded by important buildings
Used for social, political, and cultural activities
Streets designed for both function and visual impact
Planning Principle:
Efficient circulation combined with aesthetics
6. Fortification and Ideal Cities
7
Star-Shaped Fortifications
Developed due to gunpowder warfare
Geometric bastions for better defense
Ideal City Concept
Theoretical models of perfectly planned cities
Based on symmetry, order, and harmony
Planning Principle:
Combination of defense with geometry and aesthetics
7. Zoning and Land Use
Characteristics:
Separation of functions:
Administrative
Residential
Religious
Organized spatial distribution
Planning Principle:
Functional organization within a planned framework
8. Role of Architecture
Features:
Uniform building facades
Classical elements (columns, domes, arches)
Harmonized skyline
Planning Principle:
Unity between architecture and urban form
9. Examples of Renaissance Cities
9.1 Florence
Center of Renaissance culture
Planned public spaces and architectural harmony
9.2 Rome
Redeveloped with axial roads and monuments
Integration of classical heritage
9.3 Palmanova
Ideal planned city with star-shaped layout
9.4 Versailles
Grand axial planning centered on palace
10. Key Planning Principles of Renaissance Europe
The major principles include:
Geometry and Symmetry
Axial and Radial Planning
Centrality of Public Spaces (Piazza)
Integration of Architecture and Planning
Aesthetic and Visual Order
Functional Zoning
Monumentality and Grandeur
Planned Urban Design (Ideal Cities)
11. Comparison with Medieval Planning
Aspect
Medieval Towns
Renaissance Cities
Layout
Organic, irregular
Planned, geometric
Streets
Narrow, winding
Wide, straight
Focus
Defense
Aesthetics and order
Public Spaces
Limited
Central and designed
Planning Approach
Incremental
Pre-planned
12. Relevance to Modern Planning
Renaissance planning has strongly influenced modern urban design:
Boulevards and avenues โ Modern city planning
Public squares โ Urban plazas and civic spaces
Axial planning โ Capital city design (e.g., New Delhi)
Urban aesthetics โ City beautification and design guidelines
In TOD context:
Structured layouts improve accessibility and connectivity
Public spaces enhance user satisfaction and safety
Conclusion
The Renaissance period marked a decisive shift in urban planning from the defensive and organic forms of the medieval era to planned, ordered, and aesthetically driven cities. By integrating geometry, architecture, and public space, Renaissance planners created cities that were not only functional but also visually harmonious and socially vibrant.
The principles of Renaissance planningโsuch as symmetry, axiality, and civic space designโcontinue to shape modern urban planning practices. They demonstrate that cities are not merely functional entities but also expressions of culture, art, and human aspiration, making Renaissance Europe a cornerstone in the evolution of urban design.
The Figure-Ground Theory is a foundational concept in urban design that helps in analyzing and understanding the relationship between built forms (figures) and the open spaces (grounds) that surround and define them. Rooted in principles of Gestalt psychology and architectural morphology, this theory provides a visual and analytical method to interpret the urban fabric by distinguishing solid mass (buildings) from voids (open spaces). It plays a crucial role in understanding spatial organization, connectivity, enclosure, and the overall quality of urban environments.
1. Origin and Conceptual Basis
The term โfigure-groundโ was originally used in Gestalt psychology, where it referred to the human perception of visual elements as either the object of focus (figure) or the background (ground). In urban design, this concept was adopted and developed most notably by theorists like Colin Rowe and Fred Koetter, especially in their influential work โCollage Cityโ (1978), where they emphasized the importance of the figure-ground diagram as a tool for analyzing urban space.
In an urban context:
Figure = The built elements, such as buildings, monuments, or blocks.
Ground = The open space around and between these built forms, including streets, plazas, parks, and courtyards.
2. Purpose and Utility in Urban Design
Figure-ground theory serves multiple purposes in the practice and pedagogy of urban design:
A. Analyzing Spatial Hierarchy
The theory reveals how different types of spaces are ordered within a city โ from tightly enclosed courtyards to wide open plazas. It helps in understanding:
Public vs. Private space
Dominant vs. Subordinate structures
Primary vs. Secondary networks (e.g., major streets vs. alleys)
B. Understanding Urban Morphology
Through figure-ground diagrams, designers and planners can trace the evolution of urban form, assess the compactness or sprawl of development, and evaluate density and grain (fine or coarse) of urban patterns.
C. Evaluating Connectivity and Accessibility
The layout of built forms and open spaces reveals how pedestrian and vehicular flows operate. A balanced figure-ground relationship enhances walkability, visual continuity, and social interaction, while imbalances may cause segregation, inaccessibility, or monotony.
D. Guiding Urban Design Interventions
By studying figure-ground relationships, designers can:
Identify underutilized spaces for infill or revitalization.
Propose new developments that respect or enhance existing spatial structure.
Create more legible, coherent, and meaningful urban environments.
3. Figure-Ground Diagram as a Tool
The figure-ground diagram is the primary tool used to visualize and interpret this theory. It typically involves a black-and-white map:
Black (or solid color) = Built forms (figure)
White (or negative space) = Open spaces (ground)
This simplified abstraction helps:
Strip away non-essential elements to focus purely on spatial relationships.
Compare urban blocks across different cities or historical periods.
Assess enclosure, openness, and edge conditions.
Example:
A traditional European city center (like Rome or Paris) often shows a high degree of figure-ground balance โ with a dense network of built forms interspersed with well-defined open squares and streets.
A modernist development (such as Le Corbusierโs Radiant City) often shows dispersed buildings floating in open space, resulting in a lower figure-ground ratio and reduced spatial definition.
4. Applications and Implications
A. Historic Preservation and Urban Infill
Figure-ground studies can help preserve the character of historic cores by guiding sensitive infill projects that maintain the existing spatial grain and hierarchy.
B. Transit-Oriented Development (TOD)
TOD areas often require compact, connected, and mixed-use urban forms. Figure-ground theory can be used to ensure appropriate density, enclosure, and human-scale design in such developments.
C. Urban Legibility and Imageability
According to Kevin Lynchโs concepts in โThe Image of the City,โ figure-ground relationships contribute to how clearly people can read and navigate the city. Strong spatial definition improves the mental map of urban dwellers.
D. Sustainable and Livable Design
Well-proportioned built-to-open space ratios can influence microclimate, social interaction, safety, and walkability, all of which contribute to urban sustainability and livability.
5. Limitations and Critiques
While figure-ground theory is a powerful tool, it also has limitations:
Over-simplification: It reduces complex spatial realities to binary visuals, ignoring building heights, uses, and materials.
Contextual Blindness: It may not capture the socio-cultural dynamics, economic conditions, or lived experiences of urban space.
Static Representation: The diagrams are snapshots in time and do not reflect temporal changes, such as seasonal use or day-night variation.
To overcome these, figure-ground analysis is often supplemented with section drawings, land-use maps, 3D models, and behavioral studies.
6. Conclusion
The Figure-Ground Theory remains a core analytical framework in urban design. It distills the city into its fundamental spatial components โ solids and voids โ enabling planners and designers to read, compare, and shape urban form with greater clarity. Though simple in its graphic expression, it offers deep insights into the organization, legibility, and quality of urban spaces. When integrated with other design tools and socio-cultural analysis, it becomes an invaluable method for crafting cities that are both functional and humane.
References
Grossberg, S. (1994). 3-D vision and figure-ground separation by visual cortex.ย Perception & psychophysics,ย 55(1), 48-121.
Hebbert, M. (2016). Figure-ground: History and practice of a planning technique.ย Town Planning Review,ย 87(6), 705-728.
Roberts, L. D. (1986). The figure-ground model for the explanation of the determination of indexical reference.ย Synthese, 441-486.
Wever, E. G. (1927). Figure and ground in the visual perception of form.ย The American Journal of Psychology,ย 38(2), 194-226.
The 74th Constitutional Amendment Act, 1992 was a landmark reform in India’s urban governance landscape. It provided constitutional status to Urban Local Bodies (ULBs) like Municipal Corporations, Municipal Councils, and Nagar Panchayats, recognizing them as the third tier of government.
The 12th Schedule of the Constitution, added through this amendment, lists 18 functional items that Municipalities are responsible for. These functions ensure a decentralized, participatory, and efficient framework for urban governance.
๐ฐ Overview of the 18 Functions in the 12th Schedule
1. Urban Planning Including Town Planning
Urban planning involves formulating land-use policies, zoning regulations, master plans, and development control to guide the orderly growth of urban areas. ULBs play a pivotal role in preparing and implementing Development Plans and Town Planning Schemes in alignment with state-level urban policy.
2. Regulation of Land Use and Construction of Buildings
Municipalities regulate building permits, enforce development control norms, ensure adherence to zoning regulations, and prevent unauthorized constructions. This ensures planned development, safety, and optimized land use.
3. Planning for Economic and Social Development
ULBs contribute to local economic development by supporting markets, industries, and small businesses, while also implementing welfare programs in health, education, housing, and skill development to address urban poverty and inequality.
4. Roads and Bridges
Maintenance, construction, and widening of municipal roads, flyovers, footpaths, and bridges fall under the municipalityโs domain. They ensure connectivity, road safety, and traffic decongestion within city limits.
5. Water Supply for Domestic, Industrial, and Commercial Purposes
Municipalities manage water sourcing, treatment, and distribution. They ensure equitable access to potable water and promote water conservation, leak management, and metering systems.
6. Public Health, Sanitation, Conservancy, and Solid Waste Management
ULBs oversee disease control, public health campaigns, sanitation drives, street cleaning, and integrated solid waste management. Effective service delivery in this function is crucial for urban hygiene and environmental health.
7. Fire Services
Fire safety is a municipal mandate, involving provision of fire stations, emergency response teams, fire-fighting infrastructure, and regulatory checks for fire compliance in buildings and public spaces.
8. Urban Forestry, Protection of the Environment, and Promotion of Ecological Aspects
Municipalities are expected to implement urban greening programs, manage green belts and biodiversity parks, and enforce environmental regulations like air and noise pollution control.
9. Safeguarding the Interests of Weaker Sections of Society Including the Handicapped and Mentally Retarded
ULBs must ensure inclusive policies that support vulnerable groups through social housing, accessible infrastructure, education, and special assistance programs.
10. Slum Improvement and Upgradation
A key function of ULBs is improving the quality of life in urban slums by providing basic services, upgrading housing, implementing in-situ redevelopment projects, and promoting livelihood opportunities.
11. Urban Poverty Alleviation
Municipalities run programs like skill development, self-employment schemes, microfinance, shelter homes, and targeted subsidies for urban poor, often under centrally or state sponsored schemes like NULM.
12. Provision of Urban Amenities and Facilities such as Parks, Gardens, Playgrounds
Recreational infrastructure like parks and playgrounds enhances urban livability. ULBs are tasked with creating and maintaining these public spaces for community health and well-being.
13. Promotion of Cultural, Educational, and Aesthetic Aspects
ULBs support the arts, preserve heritage sites, and organize cultural events. They also promote urban aesthetics through design guidelines and beautification projects.
14. Burials and Burial Grounds; Cremations, Cremation Grounds; and Electric Crematoriums
ULBs are responsible for the management of public burial and cremation facilities, including upkeep, hygiene, and promoting eco-friendly alternatives like electric crematoriums.
15. Cattle Pounds; Prevention of Cruelty to Animals
Municipalities manage cattle pounds, enforce regulations against stray animals, and work with NGOs to promote animal welfare and sterilization programs.
16. Vital Statistics Including Registration of Births and Deaths
The registration of births, deaths, and marriages is a legal function of municipalities, which also act as custodians of this crucial demographic data.
17. Public Amenities Including Street Lighting, Parking Lots, Bus Stops, and Public Conveniences
ULBs ensure the provision and maintenance of basic civic infrastructure that supports mobility and public hygiene, especially in crowded urban environments.
18. Regulation of Slaughter Houses and Tanneries
Municipalities regulate these units to ensure hygiene, compliance with environmental laws, and humane practices, along with zoning to prevent nuisance in residential areas.
๐๏ธ Conclusion: A Pillar of Decentralized Urban Governance
The 12th Schedule empowers Urban Local Bodies to function as effective self-governing institutions. However, success depends on financial devolution, technical capacity, and accountability mechanisms. As Indian cities face rapid urbanization, fulfilling these 18 functions through participatory and sustainable governance models is essential to build inclusive, resilient, and liveable urban futures.
References
Datta, A. (1994). Institutional aspects of urban governance in India.ย Indian Journal of Public Administration,ย 40(4), 616-632.
Idiculla, M. (2023). The Travails of Urban Planning in India: An Examination of the Planning Law Regime of Bangalore.ย The Chinese Journal of Comparative Law,ย 11(1), cxad002.
Kumbhar, S. Urban Governance in India.ย Constitutional Government and Democracy in India| For UG, PG & aspirants of State and Civil Service Exams| By Pearson, 311.
Kundu, D. (2020). Urbanisation in India: Towards a national urban policy framework and smart cities.ย Developing National Urban Policies: Ways Forward to Green and Smart Cities, 89-119.
Rao, P. S. N. Urban Decentralisation and Regional Planning in India: Negotiating State-Local Relations.
Sivaramakrishnan, K. C. (2013). Revisiting the 74th Constitutional Amendment for better metropolitan governance.ย Economic and Political Weekly, 86-94.
Efficient Management of Accounts Receivable and Recovery of Outstanding Debts
Track2Training offers professional Credit Control Management Services to help organizations maintain financial stability by effectively managing receivables, enforcing credit terms, and recovering old outstanding payments. With structured processes, follow-ups, and analytics, we reduce the risk of bad debts and ensure consistent cash flow.
Business Process Integration with Best Practices, Process Review, and SOP Design
Track2Training provides expert services in ERP Software Implementation and Business Process Integration, helping organizations streamline operations, improve decision-making, and enhance overall productivity. Our approach combines deep functional understanding with industry best practices to ensure your ERP system becomes a strategic asset, not just a software deployment.
Experienced in Conducting Internal Audits, Process Improvement, and Ensuring Regulatory Compliance
Track2Training provides professional Auditing Services designed to strengthen your organizationโs internal controls, ensure legal and financial compliance, and identify opportunities for process optimization. With a team of experienced auditors and domain experts, we deliver insights that not only highlight risks but also pave the way for operational excellence.
Professional Support for Seamless Business Operations
Track2Training offers reliable and efficient Administrative and Secretarial Support Services to help organizations maintain smooth day-to-day operations. Our team of professionals ensures timely execution of clerical, coordination, documentation, and governance-related tasks, enabling business leaders to focus on core strategy and growth.
Ensuring Strict Adherence to Regulatory Requirements Across All Functions
Track2Training offers robust Compliance Assurance Services to help organizations maintain full alignment with applicable legal, financial, HR, and operational regulations. In an evolving regulatory environment, our expert team ensures that your business stays risk-free, audit-ready, and compliant with national and industry-specific standards.
Compliance Assurance is the process of systematically reviewing and monitoring an organizationโs operations to ensure it follows all relevant laws, guidelines, and internal policies. It helps protect the organization from penalties, reputational damage, and operational disruptions.
โ Scope of Track2Trainingโs Compliance Assurance Services
โ๏ธ Regulatory Compliance Monitoring
Adherence to labor laws (EPF, ESI, Minimum Wages, Gratuity, etc.)
GST and income tax compliance
Shops & Establishment Act and Factory Act compliance
FCRA and CSR compliance for NGOs and nonprofits
Environmental, health, and safety compliance (where applicable)
๐ HR & Payroll Compliance
Ensuring employee onboarding, payroll, and exits meet statutory requirements
Accurate deductions for PF, ESI, TDS, and professional tax
Timely submission of returns and forms
POSH compliance including IC constitution and training
๐งพ Documentation & Filing
Maintenance of statutory registers and records
Timely filing of monthly, quarterly, and annual reports
Compliance calendars and reminders
Digitized document control for easy audit and reference
๐ง Internal Compliance Audits & Risk Reviews
Periodic internal audits to identify gaps
Compliance risk assessments and scorecards
Recommendations and corrective action plans
Training for staff on compliance procedures
๐ Compliance Reporting to Management
Monthly/Quarterly compliance status reports
Highlighting red flags, pending obligations, and upcoming filings
Support for board and investor reporting
๐ฏ Why Choose Track2Training for Compliance Assurance?
โ๏ธ Comprehensive Coverage across labor, financial, tax, HR, and sector-specific laws
๐ Proactive Monitoring with alerts and tracking systems to avoid delays
๐ง Expert Team Support โ Legal, financial, and HR compliance experts
๐งพ Audit-Ready Documentation โ Ensures smooth external audits and inspections
๐ Confidential and Reliable โ High standards of data protection and integrity
๐ฅ Ideal For:
Startups and SMEs
Educational Institutions and NGOs
Corporates with multi-state operations
Entities under CSR or donor reporting obligations
๐ Stay Compliant. Stay Confident.
Partner with Track2Training to minimize compliance risk and focus on sustainable growth.
Accurate Monthly MIS and Critical Business Insights for Strategic Decision-Making
Track2Training offers professional Management Reporting Services to equip business leaders, NGOs, startups, and educational institutions with timely, data-driven insights for better decision-making. We specialize in preparing customized Monthly Management Information System (MIS) reports and critical financial/operational dashboards aligned with your organizational goals.
Management Reporting involves the systematic preparation of detailed, timely reports that present an organization’s financial, operational, and strategic performance. These reports are key tools for decision-makers to evaluate progress, allocate resources efficiently, and anticipate future trends.
โ What Track2Training Offers
๐ Monthly MIS Reports
Profit & Loss Statement (Monthly and YTD)
Balance Sheet Overview
Cash Flow Summary
Budget vs Actual Analysis
Revenue and Cost Tracking by Department/Project
Variance Analysis with visual cues and commentary
๐ Critical Reporting & Dashboards
Custom KPIs based on your operational model (e.g., cost per employee, income per unit, fund utilization rate)
Expense Trends and Overheads Report
Receivables and Payables Aging Summary
Payroll and Headcount Reports
Project-wise or Branch-wise Performance Reports
๐ Forecasting & Trend Analysis
Comparative data from previous periods
Financial forecasting and ratio analysis
Cash flow projections and liquidity tracking
๐๏ธ Report Formats and Delivery
Excel, PDF, and presentation-ready formats
Interactive dashboards using Google Sheets, Zoho Analytics, or Power BI (on request)
Reports delivered monthly, quarterly, or as per organizational needs
๐ฏ Why Choose Track2Training for MIS & Management Reporting?
๐ Custom-Built Reports โ Tailored to your managementโs strategic priorities
๐ง Business-Driven Insights โ Not just numbers, but clear analysis and interpretations
โฑ๏ธ Timely Deliverables โ Consistent and on-time reporting schedules
๐ Visual Representation โ Charts, graphs, and summaries for easy understanding
๐ Confidential and Secure โ Strict data privacy protocols
๐งฉ Who Can Benefit?
SMEs and growing startups needing financial discipline
NGOs requiring fund utilization reports for donors
Timely Preparation and Finalization of Accounts and Financial Statements
Track2Training offers expert services in Periodic Account Reviews and Finalization of Books, ensuring that your organizationโs financial data is accurate, up-to-date, and ready for audits, filings, and strategic decision-making. We support businesses, NGOs, institutions, and startups in maintaining financial discipline with reliable reviews and timely financial closure.
๐ What This Service Includes
โ Periodic Financial Reviews
Monthly, quarterly, or half-yearly financial health checks
Review of income and expenditure trends
Reconciliation of bank accounts, ledgers, and sub-ledgers
Verification of outstanding receivables/payables
Error identification and rectification suggestions
โ Ledger Scrutiny and Adjustments
Comprehensive scrutiny of general ledger accounts
Identification of mismatches, duplication, or misclassifications
Posting of necessary journal entries and adjustments
Asset and liability reconciliations
โ Finalization of Books of Accounts
Preparation and closure of books at financial year-end
Generation of key financial statements:
Profit and Loss Account
Balance Sheet
Cash Flow Statement
Notes to Accounts
Adjustment of provisions for depreciation, taxes, and outstanding liabilities
โ Coordination with Auditors & Tax Consultants
Support in statutory and internal audits
Drafting of audit schedules and reports
Responding to auditor queries and facilitating document flow
Support in income tax, GST, and other compliance finalizations
โ Reporting & Advisory
MIS and financial reports tailored for decision-making
Advisory on accounting best practices and process improvements
Highlighting red flags or cash flow concerns
๐ฏ Why Choose Track2Training?
๐งพ Audit-Ready Books โ Clean and organized records for smooth audit processes
๐ง Experienced Account Professionals โ Skilled in multi-sector and multi-software accounting
๐ Timely Deliverables โ Avoid delays in statutory filings and financial closures
๐ Transparency and Accuracy โ Detailed verification ensures compliance and reliability
๐ Strategic Insights โ Financial clarity for better forecasting and business planning
Streamlined Outsourcing Solutions for Efficient Financial Operations
Track2Training provides Comprehensive Bookkeeping and Account Management Services tailored to meet the diverse financial needs of startups, small businesses, NGOs, and growing enterprises. Our goal is to help you maintain accurate, real-time financial records while ensuring compliance with statutory norms โ all through a cost-effective, outsourced model.
๐ฐ Cost-Effective โ Reduce overhead costs of maintaining an in-house finance team
๐งพ Audit-Ready Documentation โ Transparent, organized, and compliant record-keeping
๐ Confidentiality Assured โ Secured data handling with integrity and non-disclosure protocols
โฑ๏ธ Focus on Core Business โ Let us manage your books while you focus on growth
๐ ๏ธ Customizable Service Packages
Choose from Monthly, Quarterly, or Annual Plans based on your business size and operational complexity. Services are available both onsite and remotely.
๐ Get Started with Track2Training
Ensure smooth financial operations and peace of mind with our expert bookkeeping and accounting services.
Identifying and Onboarding the Right Talent to Drive Success
Track2Training offers end-to-end Recruitment Services that help organizations attract, evaluate, and onboard the most suitable candidates for their workforce needs. Our goal is to connect employers with talent that aligns not only with job requirements but also with the culture and vision of the organization. Whether youโre a startup or an established enterprise, our customized hiring solutions are designed to fuel your growth with the right people.
Track2Training provides expert Labor Law Compliance Services to help organizations understand, implement, and maintain full compliance with Indiaโs complex labor legislation. Our services ensure that your business operations align with statutory requirements, thereby minimizing legal risk and fostering a law-abiding, ethical work culture.
Labor laws in India are designed to protect employee rights, ensure fair treatment, and promote healthy employer-employee relationships. Non-compliance can lead to:
Heavy penalties and fines
Legal disputes or litigation
Suspension of operations or licenses
Loss of employee trust and brand reputation
Track2Training helps you stay compliant, up to date, and audit-ready โ without the stress.
โ Scope of Labor Law Compliance Services
Statutory Compliance Audit
Comprehensive audit of existing HR, payroll, and labor practices
Identification of gaps and non-compliance risks
Compliance scorecard with actionable recommendations
Registrations & Licenses Support
Registration under relevant labor laws such as:
Shops and Establishment Act
Factories Act
EPF & ESI
CLRA (Contract Labor Regulation & Abolition Act)
Payment of Bonus Act, Gratuity Act, Minimum Wages Act, etc.
Monthly & Annual Compliance Management
Timely preparation and filing of:
PF, ESI, and TDS returns
Labor Welfare Fund (LWF)
Professional Tax (PT)
Gratuity and Bonus calculations
Maintenance of Statutory Registers & Records
Preparation and upkeep of:
Attendance and wage registers
Leave registers
Form-16s and salary slips
Muster rolls and accident registers
Drafting of Labor Law Policies and Notices
Drafting compliant employment contracts, appointment letters, and HR policies
Workplace display notices in regional languages as required by law
Labor Inspections & Legal Support
Handling labor inspections and audit queries
Representation before labor departments if required
Assistance with labor disputes and settlements
๐ฏ Benefits of Choosing Track2Training
๐ End-to-End Compliance Support
โ๏ธ Expert Legal Guidance from Labor Law Specialists
โฑ๏ธ Timely Updates on Legislative Changes
๐ Risk Mitigation and Legal Safeguards
๐งพ Audit-Ready Documentation and Reports
๐ค Peace of Mind for Employers and HR Teams
๐ Connect with Track2Training for Labor Law Compliance
Ensure your business remains legally compliant, ethically strong, and employee-friendly with Track2Training.
Track2Training offers specialized POSH Training Services to help organizations comply with the Sexual Harassment of Women at Workplace (Prevention, Prohibition and Redressal) Act, 2013, and to foster a safe, respectful, and inclusive workplace for all employees. Our training is designed for employees at all levels โ from interns and staff to senior management and Internal Committee (IC) members.
๐ก๏ธ Why POSH Training is Essential
Legal compliance with the POSH Act, 2013
Prevention of workplace harassment and toxic culture
Empowering employees to understand their rights and responsibilities
Building a safe and inclusive organizational environment
Protecting the reputation and credibility of the organization
โ Track2Trainingโs POSH Training Modules
Awareness Training for Employees
Understanding sexual harassment: types and examples
Workplace behavior: boundaries and communication
Rights and responsibilities of employees under POSH
Reporting mechanisms and confidentiality
Specialized Training for Internal Committee (IC) Members
Formation and role of the IC under the POSH Act
Investigative procedures and timelines
Handling complaints with neutrality and sensitivity
Documentation and legal implications
Manager & Leadership Training
Role of leadership in fostering a harassment-free workplace
Managing escalations and supporting employees
Ethical leadership and organizational culture
POSH Policy Drafting & Implementation Support
Assistance in formulating a POSH policy customized to your organization
Communication strategies for effective implementation
Integration into onboarding and induction programs
๐ฏ Modes of Delivery
๐งโ๐ซ Onsite Workshops โ Interactive sessions with real-life case studies, role plays, and discussions
๐ป Online Live Training โ Virtual sessions for distributed teams across geographies
๐น Recorded Sessions & Microlearning Modules โ Flexible and accessible POSH learning options
Track2Training offers professional Payroll Management Services to ensure organizations process employee compensation accurately, timely, and in full compliance with statutory regulations. This service is ideal for startups, MSMEs, NGOs, educational institutions, and mid-to-large businesses looking to streamline payroll operations while minimizing errors and risks.
Payroll Management involves the administration of employee salaries, wages, bonuses, deductions, and tax withholdings. It also includes compliance with labor laws, filing of statutory returns, and generation of payslips and reports. Effective payroll management ensures employee satisfaction, financial accuracy, and regulatory compliance.
โ Key Features of Track2Trainingโs Payroll Management Services
Accurate Payroll Processing
Monthly salary calculation based on attendance, leave, working hours, and other variables
Overtime, bonus, and incentive calculations
Auto-generation of payslips
Statutory Compliance
PF, ESI, TDS, Gratuity, and Professional Tax calculations and filings
Timely generation and submission of statutory returns and challans
POSH, Shops and Establishment Act, and other regulatory updates
Track2Training offers comprehensive HR Audit Services designed to assess and strengthen the human resource function of organizations. This service provides a structured review of HR policies, practices, systems, and documentation to ensure compliance with legal standards, identify performance gaps, and recommend actionable improvements for enhanced organizational effectiveness.
An HR Audit is a systematic examination of the human resources function to evaluate its effectiveness, efficiency, and alignment with organizational goals. Track2Trainingโs HR Audit service is both diagnostic and strategic, aiming to not only highlight what needs correction but also what can be improved to support growth and transformation.
โ Scope of HR Audit by Track2Training
Track2Training’s HR Audit covers a wide range of areas, including but not limited to:
Policy Review & Compliance Check
Verification of compliance with labor laws and employment regulations (e.g., Shops & Establishment Act, Factories Act, EPF, ESI, POSH, etc.)
Evaluation of existing HR policies for legal accuracy and practical applicability
Review of employee handbooks and code of conduct
Recruitment & Onboarding
Assessment of hiring practices and documentation
Review of induction processes and probation policies
Performance Management Systems
Evaluation of appraisal processes, KPIs, and goal-setting frameworks
Alignment of performance reviews with career progression and rewards
Training & Development
Review of L&D policies, training calendars, and skill gap assessments
Effectiveness of training programs in achieving desired outcomes
Employee Engagement & Communication
Feedback mechanisms, grievance redressal processes, and internal communication systems
Culture audits to gauge employee morale and workplace inclusiveness
Compensation & Benefits
Review of pay structures, incentives, and statutory benefits
Benchmarking against industry standards
HRIS and Data Management
Evaluation of digital HR tools, data protection practices, and record-keeping
GDPR and data privacy compliance (where applicable)
Exit Management
Analysis of resignation, termination, and exit interview processes
Post-exit obligations and knowledge transfer mechanisms
๐ Deliverables of the HR Audit
Audit Report with observations and gap analysis
Compliance checklist and risk flagging
Action Plan with prioritized recommendations
Policy Improvement Suggestions
Implementation Support (optional)
๐ฏ Benefits of HR Audit with Track2Training
Ensures legal and statutory compliance
Identifies risks and inefficiencies
Enhances HR operational effectiveness
Aligns HR strategy with organizational objectives
Builds a transparent and accountable HR system
Helps prepare for future expansions, certifications, and funding audits
๐ Connect with Track2Training
Empower your HR department with expert insights and practical reforms.
Track2Training offers specialized consultancy and training services focused on HR Policies & Framework Development, aimed at enabling organizations to build structured, effective, and legally compliant human resource systems. This service is designed for startups, growing businesses, academic institutions, NGOs, and established enterprises seeking to align their HR strategies with broader organizational goals.
โ Policy Drafting Aligned with Organizational Objectives
Track2Training works closely with clients to draft customized HR policies that directly support their mission, vision, and strategic goals. Rather than using a one-size-fits-all template, the team ensures that every policy reflects the unique values, operational culture, and regulatory requirements of the organization.
โ Development of Comprehensive HR Frameworks
A strong HR framework forms the backbone of organizational governance and employee relations. Track2Training assists in developing detailed frameworks that cover:
Recruitment & Onboarding
Compensation & Benefits
Leave and Attendance
Performance Management
Disciplinary and Grievance Handling
Remote Work and Hybrid Policies
Learning & Development Protocols
Exit and Separation Policies
โ Legal and Regulatory Compliance
All policies and frameworks are developed with a keen focus on Indian labor laws and applicable international standards where relevant. This ensures that organizations are not only fair and transparent but also protected against legal risks.
โ Employee-Centric and Inclusive Approach
Track2Training incorporates principles of diversity, equity, and inclusion (DEI) into the HR framework, ensuring that the workplace fosters a positive and productive environment for all employees.
โ Workshops and Capacity Building
Beyond policy documentation, Track2Training conducts capacity-building workshops for HR personnel and leadership teams to:
Implement the new policies effectively
Handle policy-related queries
Monitor compliance and performance
Update frameworks based on feedback and evolving business needs
โ Digital Integration and HR Tools
The service also includes guidance on integrating policies into digital HRMS (Human Resource Management Systems) platforms for easier access, monitoring, and updates.
Why Choose Track2Training for HR Policy Development?
Industry-aligned best practices
Expert consultants with academic and corporate HR experience
Custom, scalable solutions
Transparent process and timely delivery
Organizations partnering with Track2Training can expect a strategic HR infrastructure that not only meets legal standards but also boosts employee satisfaction and organizational efficiency.
The Digital Object Identifier (DOI) system is a standardized method used for identifying and accessing digital content, especially in academic and professional publishing. A DOI provides a persistent, unique alphanumeric string that is permanently assigned to a piece of intellectual propertyโsuch as a research paper, book, thesis, dataset, or reportโso it can be reliably cited and accessed online.
๐น What is a DOI?
A DOI is a unique identifier for a digital object. It serves two main purposes:
Identification โ Each DOI is unique and assigned only to one content item.
Persistent Linking โ The DOI provides a permanent web link to the content, even if the content’s location (URL) changes over time.
๐น Structure of a DOI
A DOI usually looks like this: 10.1234/abcd5678
10 is the DOI prefix, which indicates the DOI system.
1234 is the registrant code (unique to the publisher or assigning organization).
abcd5678 is the suffix, chosen by the publisher to identify a specific item.
Permanent Accessibility: Unlike URLs that can become obsolete, DOIs always redirect to the latest location of the resource.
Accurate Citation: Academic publishers, universities, and researchers use DOIs in citations to ensure content can always be accessed and verified.
Content Integrity: DOIs are part of a global infrastructure managed by trusted organizations, adding credibility to the research.
Interoperability: DOIs are used across systems (CrossRef, DataCite, ORCID, Scopus, Web of Science, etc.) for indexing, linking, and managing scholarly content.
๐น Who Issues DOIs?
DOIs are issued by Registration Agencies (RAs) accredited by the International DOI Foundation (IDF). The two most prominent RAs are:
CrossRef โ For scholarly and journal articles, books, conference proceedings, etc.
DataCite โ For datasets and research data.
These agencies work with publishers and institutions who register content and assign DOIs.
๐น Use of DOI in Citations
A research article citation using DOI may look like this:
Using DOI instead of a simple web address ensures that even if the article moves to a different website, the DOI link will still direct the reader correctly.
Increased Discoverability: Indexed in academic databases like Google Scholar, Scopus, Web of Science.
Citation Tracking: Enables tools to track how often and where your work is cited.
Research Impact: Helps build author profiles with verified publication records (ORCID integration).
Global Reach: DOIs are recognized and accessed worldwide, enhancing the visibility of the content.
Credibility: Publication with DOI is often seen as a sign of legitimacy and academic integrity.
๐น Getting a DOI for Your Work
Authors and researchers typically get a DOI when they publish with:
Academic journals that are CrossRef members
Book publishers who assign DOIs
Institutional repositories (like university archives)
DOI services like Zenodo, Figshare, or through EduPub, Pen2Print, or IJR Journal (as you may be working with)
๐น Examples of Platforms Using DOI
Google Scholar โ indexes and links using DOIs
ORCID โ links publications to authors via DOI
CrossRef Metadata Search โ searches articles using DOIs
Scopus/Web of Science โ bibliographic databases using DOIs for citation tracking
๐น Final Thoughts
A DOI is more than just a digital labelโit’s a critical infrastructure for ensuring trust, accessibility, and continuity in academic publishing. Whether you’re an author, publisher, or researcher, embracing the DOI system ensures your work remains citable, discoverable, and permanent in the digital academic landscape.
The Global Initiative of Academic Networks (GIAN) is a flagship scheme by the Ministry of Education, Government of India, launched in 2015โ16, with a brief pause during COVID, and now in its Phase 4indiascienceandtechnology.gov.in+15legacyias.com+15drishtiias.com+15. Here’s an in-depth breakdown:
Bridge knowledge gaps: Offer Indian students and faculty exposure to the latest global developments in niche fields, with emphasis on real-world applications and hands-on learning. aspireias.com+2drishtiias.com+2gian.iitkgp.ac.in+2
๐๏ธ 2. Scope & Eligibility
Host institutions: Initially confined to top-tier institutesโIITs, IIMs, IISc, IISERs, NITs, IIITs, Centralโฏand selected StateโฏUniversities (NAAC A+), later expanding to other quality universities. indiascienceandtechnology.gov.in+2gian.iitkgp.ac.in+2aspireias.com+2
Course duration: Short-term programsโ1 week (12โ14 hrs) or 2 weeks (20โ28 hrs), with both in-person and hybrid/virtual options. gktoday.in+5legacyias.com+5jnu.ac.in+5
Funding model: Visiting experts receive travel support + honorarium:
Implementation committees: Includes a national-level Implementation Committee headed by Secretary (HE, MoE), sectional committees categorizing topics (e.g., Physical Sciences, Management, Humanities), and a pool of reviewers. gian.iitkgp.ac.in+1aspireias.com+1
Brand ambassadors: Eminent global academics (e.g., Manjul Bhargava, Princeton) promote and enrich the scheme. gktoday.in+1gian.iitkgp.ac.in+1
๐ 5. Impact & Reach
Course rollout: As of March 2025, 2,163 courses approved across India (with 1,848 completed). gian.iitkgp.ac.in
Global diversity: Visiting experts predominantly from the US (41%), followed by UK, Germany, Canada, France, Italy, Nordic countries, China, Japan, Taiwan, ASEAN, etc. drishtiias.com+1iaspoint.com+1
May 2025: A 15-day GIAN course on Sustainable Urbanism at NIT-Patna with international experts, emphasizing practical interdisciplinary training. timesofindia.indiatimes.com
๐ 7. Future Expansion
Phaseโ4 rollout is underway (from Dec 2023), with plans to:
Skill enrichment: Indian students and faculty gain exposure to cutting-edge, applied knowledge directly from international experts.
Collaborative research: Opens avenues for co-authored research, joint projects, and networking.
Global academic profile: Reinforces India’s position in the international academic ecosystem, building capabilities and fostering innovation.
โ Summary Table
Aspect
Details
Launched
2015โ16
Hosts
IITs, IIMs, IISc, IISERs, NITs, IIITs, select State universities
Visitors
Global scientists & entrepreneurs
Course length
1 week (12โ14โฏhrs) or 2 weeks (24โ28โฏhrs)
Honoraria
US$โฏ8k / 12k + travel & incidentals
Funding allocated
โน126 crore (~US$โฏ15M)
Courses approved
2,163 (1,848 completed)
Intl. experts
~41% US, rest from Europe & Asia
Phase 4
Active since late 2023
๐ Conclusion
GIAN is a well-structured and impactful initiative, positioning India as a hub for global academic collaboration. With robust institutional frameworks, financial backing, and expanding participation from both Indian and international academics, it’s playing a key role in fostering quality education, research, and innovation.
The Chenab Bridge in Jammu and Kashmir is the highest in the world and was inaugurated by Prime Minister Narendra Modi on June 6, 2025. The project is part of the 272 kilometres Udhampur-Srinagar-Baramulla Railway Link (USBRL), which was approved in 2003.ย One of the major contributors to the construction of the engineering marvel is Dr G Madhavi Latha, professor at the Indian Institute of Science (IISc) in Bengaluru. She was involved in the Chenab Bridge project for 17 years as a geotechnical consultant.ย Her expertise in rock engineering proved indispensable over the course of 17 years of dedicated involvement.
She worked closely with Afcons, the contractor of the bridge, in the planning, design, and construction of the structure, focusing on the obstacles posed by the terrain. Prof. Latha completed her B. Tech in Civil Engineering in 1992 from the Jawaharlal Nehru Technological University, where she achieved first class with distinction. She bagged a gold medal as an M.Tech student at the National Institute of Technology, Warangal. Her specialisation was in Geotechnical Engineering. Dr Latha completed her doctorate from IIT-Madras in 2000 in Geotechnical Engineering.
Over the years, she received several awards. In 2021, she was given the Best Woman Geotechnical Researcher award by the Indian Geotechnical Society. She was also named in the Top 75 Women in STEAM of India in 2022. Iโ would like to mention that STEAM education is an approach to teaching STEM subjects that incorporates artistic skills, such as creative thinking and design. The name derives from the acronym STEM, with an “A” added to stand for the arts. STEAM programmes aim to teach students innovation, critical thinking, and the application of engineering or technology in imaginative designs or creative approaches to real-world problems, while building on students’ mathematical and scientific foundations. The challenging topography, weather conditions, and remote location of the Chenab Bridge made construction a difficult endeavour in the region.
Prof. Latha’s team adopted a โdesign-as-you-go approachโ to overcome all obstacles. This meant innovating in real-time based on geological conditions such as fractured rocks, hidden cavities, and varying rock properties, which were not apparent in early surveys. The team performed complex calculations and design modifications to accommodate the actual rock mass conditions encountered during construction. Her contributions included advice on the design and placement of rock anchors to improve stability.
She recently published a paper in the Indian Geotechnical Journal’s women’s special issue titled โDesign as You Go: The Case Study of Chenab Railway Bridge.โ The paper describes how the design of the bridge has evolved continuously, with the overall structure, location, and type being the only constants to suit the geological conditions of the site. The project was constructed for Rs 1,486 crore. The Chenab Bridge has been described as the “biggest civil-engineering challenge faced by any railway project in India in recent historyโ by the Government. The 359-metre bridge is taller than the Eiffel Tower by 35 metres. The project aims to enhance connectivity in the Kashmir Valley. With the development of this project, Jammu and Kashmir’s economic growth is expected to accelerate at a high rate.
A tagline is more than just a catchy phrase or a marketing gimmickโit’s a critical element of branding that can shape public perception, influence behavior, and enhance an organization’s identity. Whether it’s a commercial company, a non-profit organization, an educational institution, or a startup, a well-crafted tagline communicates a core message and connects with audiences on an emotional or intellectual level. In todayโs competitive landscape, where attention spans are short and the noise is constant, the importance of a strong tagline cannot be overstated.
1. Defines and Reinforces Brand Identity
A tagline serves as a verbal logoโa succinct expression of the companyโs mission, values, or promise. It complements the brand name and visually presented logo to complete the brandโs identity. For instance, Nikeโs โJust Do Itโ embodies action, empowerment, and motivation. Similarly, NGOs use taglines like โBecause Every Life Mattersโ to emphasize humanitarian values and social commitment.
A powerful tagline can answer questions like:
What does this organization stand for?
What kind of impact does it aim to create?
Why should people care?
2. Enhances Brand Recall
Taglines are designed to be memorable. A well-written tagline sticks in the minds of people long after they see or hear it. This is crucial for brand recall, especially when competing for attention in a crowded market or cause-driven space. Short, rhythmic, and emotionally resonant taglines are more likely to be remembered and repeated.
In the case of an NGO, a memorable tagline can help keep the cause alive in public consciousness, increasing the chances of engagement, volunteering, or donations.
3. Builds Emotional Connection
A tagline has the power to evoke emotions, which plays a significant role in consumer and donor decision-making. While products or services address practical needs, taglines tap into aspirations, hopes, and values. For a company, this could be about innovation, sustainability, or customer focus. For an NGO, it could be about justice, compassion, or empowerment.
By striking an emotional chord, taglines build trust and affinity, making people more likely to support, share, or advocate for the brand.
4. Differentiates from Competitors
A tagline provides a chance to highlight what makes a brand unique. In sectors where multiple entities offer similar services or advocate for similar causes, a tagline can be the differentiator. It communicates whatโs distinctive about the organization in a succinct, engaging way.
For example:
For-profit: โThink Differentโ (Apple) separated Apple from the generic PC crowd.
Non-profit: โBe the Changeโ (inspired by Gandhiโs quote) invites personal responsibility and action, often used by social justice campaigns.
5. Provides Consistency in Messaging
A tagline offers a consistent anchor point for all communication efforts. It helps ensure that across advertising, social media, events, and public speeches, the core message remains aligned. This consistency builds familiarity and reinforces brand positioning over time.
For NGOs, consistent use of a tagline across campaigns and reports can build a strong narrative and help supporters instantly identify the organization and its cause.
6. Boosts Marketing and Outreach
A strong tagline is a marketerโs asset. It:
Adds power to advertising campaigns.
Helps in social media virality.
Enhances storytelling.
Increases the impact of public service announcements or product promotions.
When included on websites, banners, flyers, and digital content, taglines act as hooks that capture interest and prompt further exploration.
7. Inspires Internal Stakeholders
Taglines are not only for external audiences. Internally, a well-articulated tagline can serve as a motivational motto. Employees, volunteers, partners, and stakeholders rally around it, especially when it encapsulates the organization’s mission or vision in a meaningful way.
It can instill pride, direction, and a shared sense of purpose within teamsโsomething particularly important for NGOs and social enterprises driven by mission rather than profit.
8. Facilitates Brand Expansion and Endurance
A timeless and versatile tagline allows a brand to grow and evolve without losing its essence. It can remain relevant even as products, services, or projects diversify. A tagline like โConnecting Peopleโ (Nokia) transcends individual products and applies broadly to the companyโs evolving portfolio.
For NGOs, a broad tagline such as โTransforming Livesโ can stay relevant across different programsโfrom education to healthcare to environmental advocacy.
Crafting an Effective Tagline
To harness all these benefits, crafting an effective tagline involves:
Clarity โ Avoid jargon. Keep it simple.
Brevity โ Ideally under 7 words.
Relevance โ Reflect your mission, product, or impact.
Emotion โ Use words that stir feeling.
Originality โ Stand out from competitors.
Timelessness โ Avoid trends that may fade quickly.
Conclusion
A tagline is more than a clever phraseโit is a strategic communication tool that can shape identity, inspire trust, and drive engagement. For companies, it enhances branding and customer loyalty. For NGOs, it encapsulates purpose and fuels advocacy. Whether you are launching a startup, building a global brand, or leading a grassroots movement, a compelling tagline is your chance to make a lasting first impressionโand a powerful final echo.
This news update highlights the role of G20 nations in enhancing disaster risk reduction. G20 countries play a crucial role in addressing and mitigating the impact of disasters globally. Here we examines the key initiatives and strategies employed by G20 nations in disaster risk reduction, including policy frameworks, financial commitments, and collaboration mechanisms. It explores the importance of strengthening resilience, promoting early warning systems, and improving disaster preparedness and response capacities. Furthermore, the abstract emphasizes the significance of international cooperation and knowledge sharing in tackling the complex challenges posed by disasters. The aim is to provide insights and recommendations for enhancing global disaster risk reduction efforts.
The G-20 meeting, which included the Disaster Risk Reduction Working Group (DRRWG), highlighted significant opportunities for improving disaster risk reduction worldwide. Participants from various countries, including government officials, industry experts, private sector representatives, and stakeholders, gathered in Mumbai to explore innovative approaches and financing methods for sustainable development. By identifying opportunities and proposing measures, the experts aimed to minimize the impact of disasters on vulnerable communities. Given the increasing number of disasters and climate change-related risks, which result in an Annual Average Loss of $218 billion or 9% of average annual infrastructure investment, the second meeting of the DRRWG in the G-20 becomes highly significant. This meeting provides an opportunity to address the need for financing disaster risk reduction (DRR) through discussions on development finance. The topics covered include public and private financing, social protection, knowledge sharing, and international funding mechanisms for disaster response, recovery, and reconstruction.
Experts emphasized the importance of infrastructure risk assessment tools and data platforms, as well as the adoption of a ‘build back better’ approach that integrates ecosystem-based strategies and involves local communities. The meeting also tackled other important agendas, such as establishing national frameworks, incentivizing private investments, and supporting disaster preparedness, all contributing to the creation of a more resilient future. Comprehensive Risk Assessment is needed for conducting thorough risk assessments that encompass various hazards, vulnerabilities, and exposure levels are essential. This scientific approach helps identify high-risk areas and informs targeted mitigation efforts. Developing and implementing reliable early warning systems enables timely and effective response to potential disasters. These systems should be based on scientific data and advanced technologies to provide accurate and timely alerts to at-risk communities. Recognizing the impact of climate change on disaster risks, integrating climate change adaptation measures into disaster risk reduction strategies is crucial. This involves assessing climate-related risks, implementing adaptive measures, and promoting resilient infrastructure. Recognizing the role of ecosystems in reducing disaster risks, adopting ecosystem-based approaches is essential. Preserving and restoring natural ecosystems such as wetlands, mangroves, and forests can provide natural barriers and buffer against hazards. Implementing and enforcing robust building codes based on scientific knowledge and engineering standards is vital. This includes incorporating measures to enhance structural integrity, seismic resistance, and other relevant factors to minimize the vulnerability of buildings and infrastructure. There is urgent need for promoting scientific knowledge and awareness among the public about disaster risks, preparedness, and response measures is crucial. Effective communication strategies and educational programs can empower communities to make informed decisions and take appropriate actions. Government should focus on encouraging scientific research and development in the field of disaster risk reduction helps generate new knowledge, innovative solutions, and evidence-based practices. This includes funding research initiatives and promoting collaboration among academia, practitioners, and policymakers.
There is need to foster collaboration among governments, international organizations, civil society, academia, and the private sector. Engaging various stakeholders with scientific expertise and diverse perspectives can lead to more effective and sustainable disaster risk reduction measures. Government should promote the sharing of scientific data, information, and best practices across borders and institutions. Open access to relevant data and research findings allows for better understanding, analysis, and informed decision-making in disaster risk reduction. There is need for strengthening scientific and technical capacities at local, national, and regional levels is essential for implementing enhanced disaster risk reduction measures. This includes providing training, resources, and expertise to enable effective risk management and response capabilities within communities and institutions.
In conclusion, adopting enhanced disaster risk reduction measures in a scientific manner is crucial for building resilient communities and mitigating the impacts of disasters. By implementing comprehensive risk assessments, developing early warning systems, integrating climate change adaptation, incorporating ecosystem-based approaches, strengthening building codes, and promoting public awareness, we can make significant progress in reducing disaster risks. Furthermore, investing in research and development, fostering multi-stakeholder collaboration, promoting data sharing and open access, and focusing on capacity building are essential for advancing our understanding of disasters and implementing effective solutions. It is through the application of scientific knowledge, innovation, and collaboration that we can create a safer and more resilient future. By embracing these measures and approaches, we can minimize the devastating impacts of disasters, protect vulnerable communities, and promote sustainable development. Together, let us work towards a world where disaster risk reduction is prioritized and implemented in a scientifically sound manner, ensuring the well-being and safety of present and future generations.
References
Bose, S., & Nanthini, S. (2023). Multilateralism and Disaster Management in the Global South: A Case Study for the G20. Observer Research Foundation, 20.
Dehalwar, K., & Singh, J. (2015). Current State of Water Management System: Case Review of Bhopal, Madhya Pradesh.ย International Journal of Civil, Structural, Environmental and Infrastructure Engineering Research and Development (IJCSEIERD),ย 5(6), 35-40.
Mehraj, T., & Khaki, N. Climate Change and Disaster Risk Reduction: Role of G20 in Making Sustainable Lifestyle. Youth Participation in Disaster Risk Management and Climate Change Adaptation, 153.
Roy, L. (2024). Role of G20 in attaining sustainable development goals: a review. Edumania-An International Multidisciplinary Journal, 2(1), 60-76.
Shaw, R., & Kishore, K. (2023). Disaster risk reduction and G20: A major step forward. Progress in Disaster Science, 17, 100274.
Narrative explanation of the research steps developed by SN Sharma, Research Head at Track2Training, structured as a story that brings each step to life:
Title: The Quest for Cleaner Cities โ A Research Journey
Meet Riya, a young researcher at Track2Training, working under the guidance of Dr. SN Sharma, the Research Head. Riya was tasked with investigating the effectiveness of municipal waste management systems in Indian metro cities. Dr. Sharma introduced her to his five-step research process: Data Collection, Data Sorting, Data Categorising, Data Analysis, and Writing Research in a Convincing Manner.
Step 1: Data Collection โ The Treasure Hunt Begins
Riya began her journey by gathering raw information from multiple sources โ government reports, citizen feedback surveys, social media complaints, interviews with municipal workers, and even photos of dump yards. Just like a treasure hunter collecting clues, she ensured her data pool was rich and diverse.
Dr. Sharma’s advice:โBe inclusive. Every voice, every record, every photo is a piece of the puzzle.โ
Step 2: Data Sorting โ Cleaning the Clutter
Soon, Riyaโs desk was overflowing with information โ useful and useless tangled together. She began the sorting process: removing duplicates, correcting typos, and eliminating irrelevant entries (like posts about rain delays instead of waste management). It was like decluttering a messy room so she could finally see the floor.
Dr. Sharma guided her:โSort with care. Junk data can mislead even the smartest researcher.โ
Step 3: Data Categorising โ Organising the Library
With a clean dataset, Riya grouped her information into meaningful categories: ‘Collection Methods’, ‘Public Satisfaction’, ‘Government Initiatives’, ‘Private Contractors’, and ‘Common Complaints’. Each category was like a bookshelf where similar ideas could sit together, making patterns easier to spot.
Dr. Sharma noted:โCategorising is about structure. It turns a sea of information into a map.โ
Step 4: Data Analysis โ Finding the Story Behind the Numbers
Now came the most exciting part. Riya used statistical tools and qualitative analysis techniques to uncover trends. She noticed that cities with decentralized waste collection had higher satisfaction rates. She found that complaints increased during monsoon months, and contractor performance was worst in areas with poor road infrastructure.
Dr. Sharma smiled:โAnalysis turns facts into insight. This is where research speaks truth to power.โ
Step 5: Writing Research in a Convincing Manner โ Giving Voice to Truth
Riya now had everything: facts, figures, patterns, and insights. But she knew that unless her findings were communicated clearly and persuasively, they would be ignored. She crafted her research report with powerful narratives, compelling evidence, and actionable recommendations. She used charts to show trends, quotes to humanize data, and a structured flow to keep her readers engaged.
Dr. Sharma emphasized:โGood research not only discovers truthโit persuades others to act on it.โ
Her report was not just informativeโit was inspiring. It helped city planners see the gaps, encouraged stakeholders to innovate, and even made it to a national urban planning conference.
Conclusion: Thanks to Dr. SN Sharmaโs five-step research methodโData Collection, Data Sorting, Data Categorising, Data Analysis, and Writing in a Convincing MannerโRiya transformed complex problems into clear, compelling solutions. Her journey showed that research isnโt just about studying the worldโitโs about changing it.
Eco-tourism is a form of responsible travel that emphasizes exploring natural environments while minimizing negative impacts on the environment and supporting local communities. Chopta, located in the Rudraprayag district of Uttarakhand, India, is a popular destination for eco-tourism due to its beautiful landscapes and snow-capped Himalayan peaks. This mini-Switzerland of India offers a range of eco-tourism activities, including trekking, bird watching, camping, and nature walks, which provide visitors with opportunities to appreciate the natural beauty of the region while supporting local communities and conservation efforts. This abstract highlights the benefits of eco-tourism in Chopta, which include promoting sustainable development, creating economic opportunities for local communities, and conserving natural resources.
Keywords
Eco-tourism, Chopta, Rudraprayag, Destinations of Ecotourism, Mountain Trekking, Tourism
1. Introduction
Eco-tourism, also known as sustainable tourism, is a type of responsible travel that focuses on exploring and experiencing natural environments while also minimizing negative impacts on the environment and supporting local communities (Salem et al., 2020). Eco-tourism aims to promote environmental conservation, support local economies, and provide educational opportunities for visitors. Eco-tourism activities typically involve exploring natural environments, such as forests, mountains, or beaches, while minimizing impact on the environment. This may involve staying in eco-friendly accommodations, using renewable energy sources, conserving water, reducing waste, and participating in activities that do not harm the natural environment.
In addition to environmental considerations, eco-tourism also focuses on supporting local communities. This may involve hiring local guides and staff, purchasing locally produced goods, and supporting local conservation efforts (Zwirn et al., 2005). By supporting local communities, eco-tourism can help to create sustainable economic opportunities and reduce negative impacts on the environment. Overall, eco-tourism is a type of travel that promotes responsible and sustainable practices while providing visitors with opportunities to explore and appreciate natural environments. It is an important way to support conservation efforts and sustainable development, while also providing educational and enriching experiences for travelers.
In India, thenmala in Kerela -first eco-tourism resort (Rao & Pawar, 2013). And now there are many eco-tourist destinations being developed in different parts of India. India is home to a wide range of ecotourism destinations that offer visitors the opportunity to explore the country’s natural beauty while supporting sustainable development and conservation efforts. Some popular ecotourism destinations in India include:
Ladakh: This high-altitude region in the northernmost part of India is known for its stunning mountain scenery and unique culture.
Sundarbans: Located in West Bengal, the Sundarbans is the largest delta mangrove forest in the world and home to a variety of wildlife, including the Bengal tiger.
Western Ghats: This mountain range on the western coast of India is a UNESCO World Heritage Site and home to a rich biodiversity of plants and animals.
Andaman and Nicobar Islands: These islands in the Bay of Bengal are known for their pristine beaches, coral reefs, and unique wildlife.
Kaziranga National Park: Located in Assam, this national park is home to the one-horned Indian rhinoceros and other endangered species.
Kanha National Park: This national park in Madhya Pradesh is known for its population of Bengal tigers and efforts to protect the Barasingha deer.
Spiti Valley: This remote valley in the Himalayas is known for its stunning landscapes, unique culture, and opportunities for adventure activities like trekking and mountaineering.
Coorg: Located in the Western Ghats in Karnataka, Coorg is known for its coffee plantations, lush forests, and waterfalls.
These are just a few examples of the many ecotourism destinations that India has to offer. Each destination offers a unique opportunity to explore and appreciate the country’s natural beauty while supporting sustainable development and conservation efforts.
1.1. About Chopta
Chopta is a beautiful destination located in the Rudraprayag district of Uttarakhand, India. It is a popular destination for eco-tourism and attracts nature lovers, trekkers, and bird watchers from all over the world. Chopta is also known as the ‘Mini Switzerland’ of India due to its beautiful landscapes and snow-capped Himalayan peaks. Eco-tourism in Chopta is an excellent way to explore the natural beauty of the region while also supporting local communities and preserving the environment (Everand et al., 2019). Some popular eco-tourism activities in Chopta include trekking, bird watching, camping, and nature walks.
Figure 1: Morphological Map of the Chopta Valley showing glacial and para-glacial landforms
One of the most popular treks in Chopta is the Tungnath and Chandrashila Trek. This trek takes you through beautiful forests of oak, rhododendron, and deodar trees, and offers stunning views of the Himalayan peaks.
Figure 2: Map showing the trekking routes to Chandrashila and Deoriatal in Chopta Valley.
The trek is moderate in difficulty and can be completed in 2-3 days. Bird watching is another popular eco-tourism activity in Chopta. The region is home to a variety of bird species, including the Himalayan Monal, Koklass Pheasant, and Snow Partridge. You can also spot other wildlife species like musk deer, bharal, and foxes in the region. Camping is a great way to experience the natural beauty of Chopta while also minimizing your impact on the environment. There are several campsites in Chopta that offer comfortable tents, bonfires, and delicious local cuisine. Most campsites also organize nature walks and other eco-friendly activities. In addition to eco-tourism activities, Chopta is also home to several ancient temples, including the Tungnath Temple, which is the highest Shiva temple in the world (Nigam, 2002). The region also has several hot springs and waterfalls that are worth visiting.
Overall, eco-tourism in Chopta, Rudraprayag, Uttarakhand, India is an excellent way to experience the natural beauty of the region while also supporting local communities and preserving the environment.
A visitor should observe and appreciate the natural, social and cultural heritage of the area.
Exclusively assisted by the local communities living in the area.
Visitors must leave a zero carbon footprint
2. Findings and Discussion
Eco-tourism in Chopta, Rudraprayag, Uttarakhand, India is a great way to explore the natural beauty of the region while supporting local communities and conservation efforts. The region offers a variety of eco-tourism activities, including trekking, bird watching, camping, and nature walks, which provide visitors with an opportunity to experience the region’s unique biodiversity (Chaudhary et al., 2022).
One of the strengths of eco-tourism in Chopta is that it supports sustainable development and helps to create economic opportunities for local communities. By promoting responsible tourism practices, eco-tourism can help to ensure that the region’s natural resources are conserved and that local communities benefit from tourism activities (Azem & Sarker, 2013). This can help to create a sustainable economic base that supports the local population.
Another strength of eco-tourism in Chopta is that it promotes environmental conservation. By emphasizing responsible tourism practices, such as reducing waste, conserving water, and minimizing impact on natural environments, eco-tourism can help to preserve the region’s biodiversity and protect it for future generations (Chaudhary et al., 2022).
However, there are also some potential limitations to eco-tourism in Chopta. For example, as the region becomes more popular with tourists, there is a risk of over-tourism, which can have negative impacts on the environment and local communities. Additionally, some eco-tourism activities, such as trekking, can have a negative impact on the natural environment if not properly managed (Biswas, 2017).
Chopta, Rudraprayag is a popular ecotourism destination in Uttarakhand, India, known for its natural beauty and opportunities for adventure activities. Here are some of the activities that visitors can enjoy in Chopta:
Trekking: Chopta is a popular starting point for trekking expeditions to nearby mountain peaks, including Tungnath and Chandrashila. These treks offer stunning views of the Himalayas and are suitable for both novice and experienced trekkers.
Camping: Visitors can enjoy camping in Chopta, with several campsites offering tents and other camping equipment. Camping in Chopta offers a unique opportunity to connect with nature and enjoy the serene surroundings.
Bird watching: Chopta is home to a wide variety of bird species, making it a great destination for bird watching enthusiasts. The best time to visit for bird watching is during the summer months when migratory birds can also be spotted.
Wildlife spotting: Chopta is home to a variety of wildlife, including Himalayan black bears, musk deer, and snow leopards. Visitors can explore the surrounding forests and try to spot these and other animals.
Photography: The stunning landscapes of Chopta provide ample opportunities for photography, with views of snow-capped Himalayan peaks, lush forests, and meadows.
Yoga and meditation: Visitors can take advantage of the serene surroundings of Chopta to practice yoga and meditation, with several retreat centers and yoga schools offering classes.
Snow sports: During the winter months, Chopta receives snowfall, making it a popular destination for snow sports like skiing and snowboarding.
These are just a few examples of the activities that visitors can enjoy in Chopta, Rudraprayag. Each activity offers a unique opportunity to explore and appreciate the natural beauty of the region.
Here is a SWOT analysis of eco-tourism in Chopta, Rudraprayag:
Strengths:
Chopta is located in a region of stunning natural beauty, with snow-capped Himalayan peaks and a rich biodiversity.
Eco-tourism in Chopta can promote sustainable development and economic opportunities for local communities.
There is a growing interest in eco-tourism, and Chopta is well-positioned to capitalize on this trend.
Weaknesses:
Lack of infrastructure and facilities may hinder the growth of eco-tourism in Chopta.
Limited awareness among visitors of the importance of responsible tourism practices may lead to negative impacts on the environment and local communities.
There is a risk of over-tourism, particularly during peak season, which could have negative impacts on the environment and local communities.
Opportunities:
Develop eco-friendly accommodations and infrastructure to attract eco-tourists.
Promote responsible tourism practices to visitors to reduce negative impacts on the environment and local communities.
Partner with local communities to create new eco-tourism activities and support conservation efforts.
Threats:
Climate change and natural disasters could have negative impacts on the region’s biodiversity and eco-tourism industry.
The COVID-19 pandemic has led to a decline in tourism, which could impact the eco-tourism industry in Chopta.
Competition from other eco-tourism destinations could limit the growth of eco-tourism in Chopta.
3. Conclusions
In conclusion, eco-tourism in Chopta, Rudraprayag, Uttarakhand, India is a valuable way to explore the natural beauty of the region while supporting local communities and conservation efforts. However, it is important to balance the benefits of eco-tourism with potential limitations and ensure that tourism activities are managed responsibly to minimize negative impacts on the environment and local communities.
In conclusion, Eco-tourism in Chopta, Rudraprayag, Uttarakhand, India offers a unique opportunity for visitors to explore and appreciate the region’s natural beauty while supporting local communities and conservation efforts. By promoting responsible tourism practices, eco-tourism can help to create sustainable economic opportunities for local communities, while preserving the region’s natural resources and biodiversity.
However, it is important to acknowledge that eco-tourism in Chopta is not without its potential limitations, such as the risk of over-tourism and negative impacts on the environment if tourism activities are not properly managed. Therefore, it is crucial to ensure that eco-tourism in the region is managed responsibly to minimize negative impacts and to maintain the long-term sustainability of the industry.
Overall, eco-tourism in Chopta, Rudraprayag, Uttarakhand, India is a valuable way to explore and appreciate the natural beauty of the region, while supporting sustainable development and conservation efforts. With responsible management and support from local communities, eco-tourism can continue to thrive in the region and provide visitors with an enriching and sustainable travel experience.
4. Recommendations
Here are 10 recommendations for eco-tourism in Chopta, Rudraprayag, Uttarakhand, India:
Develop and implement a sustainable tourism plan that prioritizes responsible tourism practices, such as reducing waste and conserving water.
Work with local communities to promote eco-tourism and ensure that they benefit from tourism activities.
Develop eco-friendly accommodations that use renewable energy sources and promote sustainable tourism practices.
Promote local conservation efforts and work with local communities to protect the region’s biodiversity.
Offer eco-tourism activities that are designed to minimize negative impacts on the environment, such as guided nature walks and bird watching tours.
Manage trekking and camping activities responsibly to minimize negative impacts on the environment and ensure that visitors follow Leave No Trace principles.
Develop educational programs for visitors to promote environmental awareness and conservation efforts.
Encourage visitors to use eco-friendly transportation options, such as public transportation or bicycles.
Promote the use of locally produced goods and services to support the local economy.
Monitor tourism activities to ensure that they are managed responsibly and that negative impacts on the environment and local communities are minimized.
References
Azam, M., & Sarker, T. (2013). Green tourism in the context of climate change towards sustainable economic development in the South Asian Region. SSRN.
Biswas, S. N. (2017). Developing Promotional Strategy Of Ecotourism In Himalayan State: Sikkim, India. In Tourism Marketing (pp. 245-259). Apple Academic Press.
Chaudhary, S., Kumar, A., Pramanik, M., & Negi, M. S. (2022). Land evaluation and sustainable development of ecotourism in the Garhwal Himalayan region using geospatial technology and analytical hierarchy process. Environment, Development and Sustainability, 1-42.
Everard, M., Gupta, N., Scott, C. A., Tiwari, P. C., Joshi, B., Kataria, G., & Kumar, S. (2019). Assessing livelihood-ecosystem interdependencies and natural resource governance in Indian villages in the Middle Himalayas. Regional Environmental Change, 19, 165-177.
Nigam, D. (2002). Tourism, environment, and development of Garhwal Himalaya. Mittal Publications.
Rao, N. M., & Pawar, R. (2013). Assessment of community participation in ecotourism and conservation at Dandeli Wildlife Sanctuary, Karnataka, India. In National Conference on Biodiversity: Status and Challenges in Conservatio (pp. 88-93).
Salam, M. A., Lindsay, G. R., & Beveridge, M. C. (2000). Eco-tourism to protect the reserve mangrove forest the Sundarbans and its flora and fauna. Anatolia, 11(1), 56-66.
Sharma, S. N. (2013). Sustainable Development Strategies and Approaches. International Journal of Engineering and Technical Research (IJETR), 2.
Sharma, Shashikant Nishant. (2017). Challenges and Opportunities for Tourist Destination Mussoorie. Think India Quarterly, 20(4), 95โ102. https://doi.org/10.5281/zenodo.7847343
Sharma, Shashikant Nishant. (2020). Challenges and Opportunities for Tourism in Dehradun. Studies in Indian Place Names, 40(93), 135โ140. https://doi.org/10.5281/zenodo.7847592
Zwirn, M., Pinsky, M., & Rahr, G. (2005). Angling ecotourism: issues, guidelines and experience from Kamchatka. Journal of Ecotourism, 4(1), 16-31.
Sri Aurobindo Ghosh, also known as Aurobindo Ghose, was a profound philosopher, spiritual leader, nationalist, poet, and educationist of modern India. Born on August 15, 1872, in Kolkata, he played a significant role in Indiaโs struggle for independence and later turned towards spiritual pursuits in Puducherry. His contributions to the field of education are immense and visionary. He believed that education should aim at the integral development of the individual โ body, mind, and spirit. His educational philosophy laid the foundation of what is now called โIntegral Education.โ
Philosophy of Education Sri Aurobindoโs concept of education was deeply spiritual and holistic. He rejected the colonial model of education that emphasized rote learning and mechanical reproduction of knowledge. Instead, he emphasized the inner awakening of the individual. According to him, the aim of education is not merely to prepare the individual for a career but to nurture the soul, intellect, and character.
He stated:
“Education to be true must not be a machine-made fabric, but a true building or living evocation of the powers of the mind and spirit of the human being.”
His philosophy integrates elements of Indian culture, yoga, and spirituality with a rational and scientific approach to learning.
Principles of Integral Education Sri Aurobindo, along with his spiritual collaborator The Mother (Mirra Alfassa), developed the idea of Integral Education, which includes five major aspects:
Physical Education โ Development of the body to make it strong and healthy.
Vital Education โ Control and utilization of desires, emotions, and instincts.
Mental Education โ Development of the power of concentration, reasoning, and thinking.
Psychic Education โ Cultivation of the inner being and soul consciousness.
Spiritual Education โ Awakening the spiritual consciousness and connecting with the divine.
This concept of education focuses not only on academic learning but on the complete and balanced growth of a human being.
Establishment of Educational Institutions One of Sri Aurobindo’s most notable contributions to education was the establishment of the Sri Aurobindo International Centre of Education (SAICE) in Pondicherry in 1952, following his vision. It was designed to implement his ideas of Integral Education. The institution does not follow the conventional system of exams, grades, and textbooks; instead, it fosters self-learning, freedom, and creativity.
Moreover, the Auroville project, initiated by The Mother in 1968 as an experimental city based on the principles of human unity and spiritual growth, reflects Sri Aurobindoโs educational ideals and continues to influence alternative education globally.
Emphasis on National Education Before his spiritual journey, during the Indian freedom struggle, Sri Aurobindo advocated for a National System of Education that would reflect Indiaโs heritage and cultural values. He believed that British colonial education alienated Indian youth from their roots and made them mentally subservient. He called for an education system that would instill patriotism, moral strength, and national pride.
He once said,
“The first necessity is the liberation of the soul of India. That is the aim of education.”
Educational Writings Sri Aurobindo wrote extensively on education. His works such as The Human Cycle, National System of Education, Essays on the Gita, and The Synthesis of Yoga offer deep insights into the purpose and methods of true learning. His educational thoughts are not confined to the classroom; they are part of a larger vision of human evolution and consciousness.
Legacy and Relevance Today Sri Aurobindoโs educational philosophy has gained international recognition for its holistic and futuristic vision. His emphasis on self-discovery, moral development, and spiritual realization is increasingly relevant in todayโs fast-paced and materialistic world. Integral Education offers an alternative to conventional models by nurturing well-rounded, compassionate, and aware individuals.
His ideas have influenced many alternative schools and educational thinkers in India and abroad. Institutions like Mirambika (Delhi), Auro Mirra International School (Bangalore), and Auroville schools carry forward his legacy.
Conclusion Sri Aurobindo Ghosh was much more than a political revolutionary; he was a visionary educator who saw education as a sacred process of unfolding the divine in the human. His contributions continue to inspire educators and institutions to look beyond marks and degrees and focus on shaping human potential. His idea of Integral Education is a timeless gift to humanity, emphasizing that the ultimate aim of education is self-realization and the transformation of society through enlightened individuals.
References
Ghosh, S., & Roy, S. (2023). An insight into Rishi Aurobindo’s thoughts on education: assimilated views.ย The Social Science Review A Multidisciplinary Journal,ย 1(2), 89-96.
Rani, C. (2017). A study of educational vision of Aurobindo Ghosh.ย The International Journal of Indian Psychology,ย 5(1), 48-51.
Sharma, S. N. Indian Knowledge SystemsโA Short Review. Eduindex News
Sharma, S. N., & Adeoye, M. A. (2024). New Perspectives on Transformative Leadership in Education. EduPub. New Delhi
West Bengal is in the news like a hot cake because of corruption, which can be observed from top to bottom. Before that, readers know that during any election, the worst type of violence occurred in the State. The present CM and the home minister failed to control law and order, that is why criminals recently caused mayhem in Mothabari and Murshidabad. The Murshidabad incident was so horrible that the Calcutta High Court ordered the deployment of central forces in the violence-hit district of Murshidabad, where three people were killed and arson, looting, and destruction of houses took place for several hours. Still, State police did not take any action; instead, they were silent spectators. So, thanks to the Calcutta High Court for intervening to save the lives and properties of innocent civilians from the notorious criminals. Another issue is corruption. Corruption has engulfed the entire state of West Bengal, from top to bottom, and the teachers’ recruitment scam involves the West Bengal School Service Commission (WBSSC) and all other segments across the State. In this regard, by referring to http://www.thehindu.com/November 21, 2024/Shrabana Chatterjee, “Chief Minister Mamata Banerjee on November 21, 2024, came down heavily on a section of the State police after Trinamool Congress leaders raised concerns about police inaction in the past week. She claimed that certain sections of officers, workers, and police personnel were taking bribes and were indulging in potato, sand, coal, and cement smuggling and tarnishing the good name of the State”. She further, said, โLower-level officers, workers, and some police officers take bribes in smuggling sand, coal, and cement theft.โ Anyway, on May 15, 2025, the police lathi-charged the protesting jobless teachers (who lost their jobs ) in front of Bikash Bhavan, Salt Lake, Kolkata. Notably, the Supreme Court ordered the cancellation of 25,735 teachers’ jobs because of corruption by some state government officials. The jobless teachers had been sitting in their positions since morning on May 15, 2025. Unfortunately, the police lathi-charged the protesters at night to disperse them. There was widespread tension. Many people sat down on the road. But they were also dragged away from the area. Many teachers, both men and women, were injured following the police action, which persisted for over an hour and in repeated phases, with some protestors seen bleeding from various body parts, including from their heads. Many local people also vented their anger against the police action. The police personnel displayed deplorable behaviour. Prof Shankar Chatterjee, Hyderabad
Modeling user behavior for public transport users is an essential endeavor in urban planning, transportation engineering, behavioral economics, and smart mobility systems. It helps in understanding how and why individuals make certain transit choices, which can inform infrastructure development, policy-making, demand forecasting, and service design. This essay outlines a comprehensive approach to modeling public transport user behavior, encompassing theoretical foundations, methodologies, data sources, modeling techniques, and practical applications.
1. Introduction
Public transport systems are critical to sustainable urban development. Understanding user behavior within these systems is necessary to design efficient, user-friendly, and environmentally sustainable transportation networks. User behavior modeling involves identifying the factors that influence individuals’ travel decisions, such as mode choice, route selection, departure time, and frequency of use. Accurately modeling this behavior allows for improved system performance, reduced congestion, and enhanced commuter satisfaction.
2. Theoretical Foundations
2.1 Behavioral Theories
Several behavioral theories underpin travel behavior modeling:
Rational Choice Theory assumes that individuals make decisions that maximize their utility based on travel time, cost, convenience, and reliability.
Theory of Planned Behavior (TPB) incorporates attitudes, subjective norms, and perceived behavioral control to predict intention and behavior.
Habitual Behavior Theory highlights that not all decisions are conscious or rational; many are habitual and influenced by routine.
Bounded Rationality suggests that decision-makers aim for satisfactory rather than optimal solutions due to cognitive limitations.
2.2 Utility Theory
In discrete choice modeling, users are assumed to choose the option with the highest perceived utility. Utility is typically a function of measurable variables like travel time and cost, as well as unobservable preferences.
3. Data Collection and Sources
Effective modeling requires high-quality data. Common sources include:
Smart Card Data (e.g., tap-in/tap-out times and locations)
Mobile Phone GPS Data
Social Media and Web Scraping for sentiment and location
Automatic Passenger Counting (APC) Systems
CCTV and Wi-Fi/Bluetooth Tracking
Each data source offers different insights and granularity, and often, multiple sources are integrated for comprehensive modeling.
4. Modeling Methodologies
4.1 Descriptive Analysis
Basic statistical analysis helps understand general patterns, such as peak usage hours, preferred routes, and user demographics.
4.2 Discrete Choice Models (DCMs)
These are the most widely used tools for modeling individual travel decisions. Examples include:
Multinomial Logit (MNL)
Nested Logit
Mixed Logit / Random Parameters Logit
These models estimate the probability of a user choosing a particular option from a finite set of alternatives.
4.3 Agent-Based Modeling (ABM)
ABMs simulate individual agents (users) and their interactions within a transport network. This method captures emergent phenomena, such as congestion and modal shift, based on user rules and preferences.
4.4 Machine Learning Approaches
Recent advancements include the use of:
Decision Trees, Random Forests
Neural Networks
Support Vector Machines (SVM)
Deep Learning for Pattern Recognition
These are data-driven methods that often outperform traditional models in prediction accuracy but may lack interpretability.
4.5 Hybrid Models
Combining statistical methods with machine learning or behavioral theory allows for more robust and explainable models.
5. Factors Influencing User Behavior
Several variables influence transport user behavior:
Understanding the relative importance of these factors is crucial for targeted interventions.
6. Applications of User Behavior Models
6.1 Transit Planning
Behavior models help optimize routes, schedules, and capacity planning.
6.2 Demand Forecasting
Models predict how many people will use certain services under varying scenarios, such as fare changes or new infrastructure.
6.3 Policy Simulation
Scenarios such as congestion pricing, subsidies, or vehicle restrictions can be tested virtually.
6.4 Smart Mobility Integration
Behavior modeling informs the integration of services like bike-sharing, ride-hailing, and micro-transit.
6.5 Personalized Travel Recommendations
Real-time behavior modeling supports personalized route suggestions and service alerts.
7. Challenges and Limitations
Data Privacy Concerns
Model Transferability across Cities
Behavioral Complexity and Non-Linearity
Technological and Infrastructure Constraints
Equity Considerations
Efforts must be made to address these challenges, particularly ensuring ethical use of data and avoiding biases.
8. Future Directions
Real-Time Adaptive Models that update with live data
Integration with Smart City Platforms
Use of Wearable Devices and IoT Sensors
Explainable AI for Transparent Decision-Making
Behavioral Nudges and Gamification to Influence Choice
The future of transport behavior modeling lies in dynamic, personalized, and predictive systems supported by AI and ubiquitous data.
9. Conclusion
Modeling user behavior in public transport is a multifaceted task requiring a blend of theoretical insight, empirical data, and advanced analytics. As cities grow and mobility demands evolve, robust user behavior models will be critical to creating adaptive, efficient, and user-centered transportation systems. By embracing interdisciplinary methods and emerging technologies, stakeholders can not only predict how people move but also shape the future of urban mobility.
References
Buliung, R. N., & Kanaroglou, P. S. (2007). Activityโtravel behaviour research: conceptual issues, state of the art, and emerging perspectives on behavioural analysis and simulation modelling.ย Transport Reviews,ย 27(2), 151-187.
Clifton, K. J., & Handy, S. L. (2003). Qualitative methods in travel behaviour research. Inย Transport survey quality and innovationย (pp. 283-302). Emerald Group Publishing Limited.
Dehalwar, K., & Sharma, S. N. (2024). Social Injustice Inflicted by Spatial Changes in Vernacular Settings: An Analysis of Published Literature.
Dehalwar, K., & Sharma, S. N. (2023).ย Fundamentals of research writing and uses of research methodologies. Edupedia Publications Pvt Ltd.
Dehalwar, K. S. S. N., & Sharma, S. N. (2024). Exploring the distinctions between quantitative and qualitative research methods.ย Think India Journal,ย 27(1), 7-15.
Jones, P. M., Dix, M. C., Clarke, M. I., & Heggie, I. G. (1983).ย Understanding travel behaviourย (No. Monograph).
Kutter, E. (1973). A model for individual travel behaviour.ย Urban studies,ย 10(2), 235-258.
Pel, A. J., Bliemer, M. C., & Hoogendoorn, S. P. (2012). A review on travel behaviour modelling in dynamic traffic simulation models for evacuations.ย Transportation,ย 39, 97-123.
Sharma, S. N., & Dehalwar, K. (2025). Assessing the Transit-Oriented Development and Travel Behavior of the Residents in Developing Countries: A Case of Delhi, India.ย Journal of Urban Planning and Development,ย 151(3), 05025018.
Sharma, S. N., Kumar, A., & Dehalwar, K. (2024). The Precursors of Transit-oriented Development.ย EPW Economic & Political Weekly,ย 59(16), 14.
Sharma, S. N. (2019). Review of most used urban growth models.ย International Journal of Advanced Research in Engineering and Technology (IJARET),ย 10(3), 397-405.
Van Acker, V., Van Wee, B., & Witlox, F. (2010). When transport geography meets social psychology: toward a conceptual model of travel behaviour.ย Transport reviews,ย 30(2), 219-240.
Wardman, M. (1988). A comparison of revealed preference and stated preference models of travel behaviour.ย Journal of transport economics and policy, 71-91.
You must be logged in to post a comment.