
By Dileep Verma (Research Expert and Associate Editor of Track2training, New Delhi, India)
Social psychology often studies concepts that cannot be observed directly. Attitudes, perceived discrimination, social identity, trust, human dignity, prejudice, perceived inclusion, behavioural intentions, and psychological well-being are examples of latent constructs. Researchers usually measure these concepts through multiple questionnaire items rather than a single observed variable. Structural equation modelling (SEM) is particularly useful in such situations because it allows researchers to examine measurement quality and relationships among constructs within an integrated statistical framework.
SmartPLS 4 provides several SEM approaches in one graphical environment, including partial least squares structural equation modelling (PLS-SEM), consistent PLS (PLSc), confirmatory composite analysis (CCA), covariance-based SEM (CB-SEM), and confirmatory factor analysis (CFA) (Ringle et al., 2024). The choice among these methods should follow the theoretical conception of the constructs and the purpose of the analysis rather than software convenience.
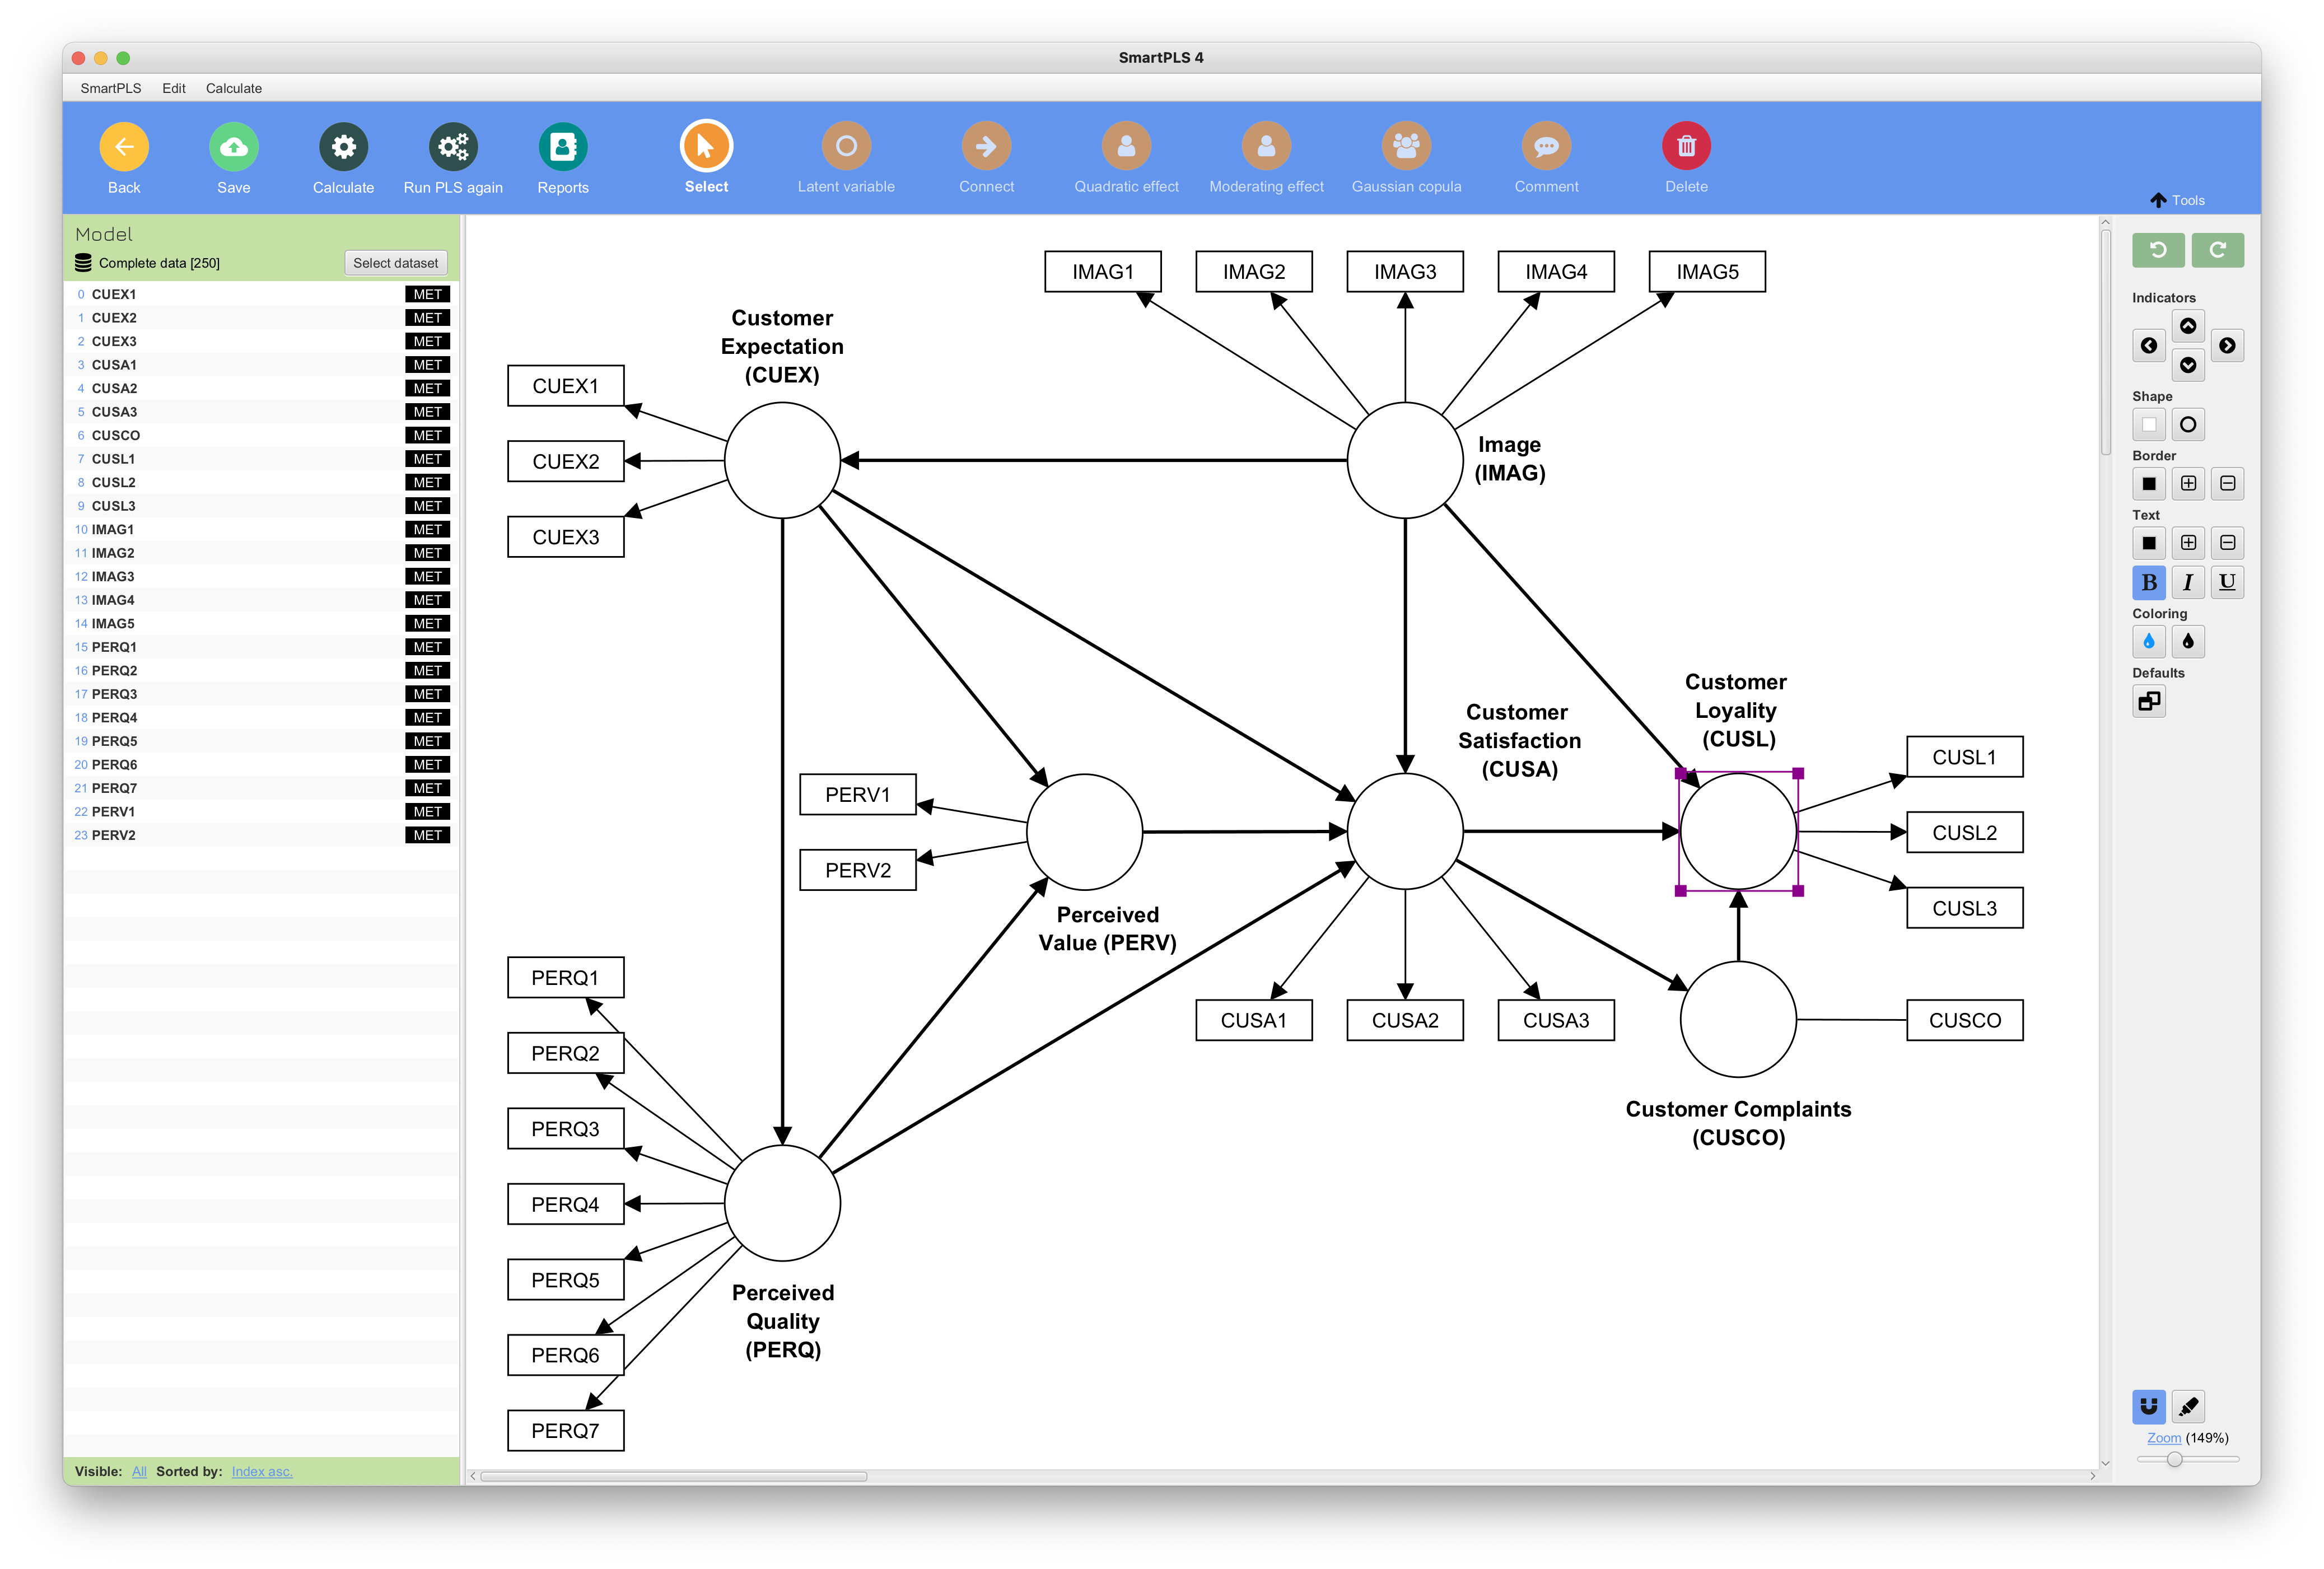
CFA, CCA and PLS-SEM: An Important Distinction
Researchers should distinguish CFA from CCA. CFA belongs to the common-factor tradition and is normally associated with CB-SEM. SmartPLS now supports CFA through its CB-SEM functionality using maximum-likelihood estimation. CFA asks whether observed indicators adequately represent hypothesised latent factors and is commonly used before evaluating structural relationships in CB-SEM (Hair et al., 2018; Hair et al., 2025).
CCA serves a related confirmatory purpose within composite-based SEM, including PLS-SEM. Hair, Howard, and Nitzl (2020) proposed CCA as a systematic procedure for assessing measurement-model quality in PLS-SEM. Current SmartPLS documentation nevertheless notes continuing methodological debate about CCA and does not recommend treating it as the only approach to measurement-model assessment.
This distinction matters in social psychology. If a researcher conceptualises psychological attributes as common factors that generate observed responses, CFA may be appropriate. If the research model uses composite-based estimation and emphasises explanation or prediction of relationships among constructs, PLS-SEM may be suitable.
Confirmatory Assessment of the Measurement Model
Before interpreting relationships among psychological constructs, researchers need to establish that the measures have acceptable reliability and validity.
For reflective constructs, outer loadings provide an initial assessment of indicator reliability. A loading of approximately 0.708 or higher is desirable because 0.70820.708^2 is approximately 0.50, indicating that the construct explains about half of the indicator’s variance (Hair et al., 2022). Indicators with loadings between 0.40 and 0.708 should not be deleted automatically. Researchers should consider theoretical content and whether removing an item improves composite reliability and AVE. Very weak indicators, particularly those below 0.40, generally require closer scrutiny.
Internal consistency is then assessed. Cronbach’s alpha (α), rho_A, and composite reliability (rho_c) are commonly reported. Values of 0.70 or above generally indicate acceptable reliability in established research, while values between 0.70 and 0.95 are usually desirable for composite reliability. Values above approximately 0.95 may indicate that indicators are excessively similar or redundant (Hair et al., 2022).
Convergent validity is commonly evaluated using the Average Variance Extracted (AVE). An AVE ≥ 0.50 indicates that a construct explains at least half of the variance in its indicators on average.
A practical reporting guide is therefore:
Outer loadings: preferably ≥ 0.708
Cronbach’s α: generally ≥ 0.70
rho_A: generally ≥ 0.70
Composite reliability (rho_c): approximately 0.70–0.95
AVE: ≥ 0.50
These thresholds should guide judgement rather than operate as mechanical rules for deleting questionnaire items.
Discriminant Validity: Give Priority to HTMT
Social-psychological constructs are often conceptually related. Perceived discrimination may correlate with social exclusion; dignity may correlate with psychological well-being; and attitudes may correlate strongly with behavioural intentions. Researchers therefore need to demonstrate that supposedly different constructs are empirically distinguishable.
The Heterotrait-Monotrait ratio (HTMT) has become the preferred criterion for evaluating discriminant validity in PLS-SEM (Henseler et al., 2015). An HTMT value below 0.85 represents a conservative criterion, while 0.90 is frequently used when constructs are conceptually close.
Older PLS-SEM studies frequently report the Fornell-Larcker criterion and cross-loadings. These can still appear as supplementary information, but current SmartPLS guidance describes them as outdated for establishing discriminant validity because they may fail to identify validity problems that HTMT detects.
Thus, a modern PLS-SEM study should normally give greater weight to HTMT and, where appropriate, bootstrap-based HTMT inference.
From Measurement to the Structural Model
Once measurement quality has been established, researchers can assess the structural model. The analysis commonly considers collinearity, path coefficients (β), coefficient of determination (R²), effect size (f²), statistical significance, confidence intervals, and predictive assessment where relevant (Hair et al., 2019; Hair et al., 2022).
For example, a social psychologist might hypothesise:
Perceived discrimination → Social exclusion → Psychological well-being
or:
Institutional inclusion → Human dignity → Perceived policy impact
PLS-SEM allows researchers to estimate these relationships simultaneously while accounting for the measurement of each construct.
Why 5,000 Bootstrap Samples?
PLS-SEM commonly uses non-parametric bootstrapping to assess the statistical uncertainty of estimated relationships. A researcher can generate 5,000 bootstrap samples, repeatedly re-estimate the model, and obtain standard errors, t-values, p-values, and confidence intervals.
The analytical sequence can be expressed as:
Original sample → 5,000 bootstrap resamples → repeated model estimation → sampling distribution → confidence intervals and significance tests
Researchers should therefore report the path coefficient (β), bootstrap standard error, t-value or p-value, and confidence interval, rather than relying solely on whether p < .05.
Bootstrapping is particularly useful for indirect effects and mediation, where researchers need to assess the indirect pathway itself rather than infer mediation simply because separate component paths are statistically significant.
What About Model Fit?
This is an area where CFA and PLS-SEM should not be mixed.
For CFA conducted through CB-SEM, researchers may examine global fit statistics such as χ², CFI, TLI, RMSEA and SRMR. Common guidelines often regard CFI/TLI around 0.90 or higher, RMSEA below about 0.08, and SRMR below about 0.08 as indicative of acceptable fit, although interpretation depends on model characteristics and should not rely on a single cutoff (Kline, 2023).
These CB-SEM fit criteria should not simply be transferred to standard PLS-SEM. PLS-SEM has a different estimation objective, and measurement quality is primarily evaluated through reliability, convergent validity, discriminant validity, and appropriate assessment of formative measures when present.
Demographic Robustness Without Fishing for Moderators
Social-psychological findings may also be checked across characteristics such as gender, age, education, income, employment status, residence, or prior experience. Such analysis can establish whether the main conclusions remain reasonably stable after accounting for relevant demographic characteristics.
However, robustness analysis is not automatically moderation analysis.
Researchers should avoid adding numerous interaction terms simply because SmartPLS makes moderation technically easy. When theory does not specify demographic moderation, the more defensible approach is to retain the prespecified structural model and use demographics for clearly defined robustness checks. Where theoretically justified group comparisons are required, researchers should consider measurement invariance and appropriate multigroup analysis.
PLS-SEM Does Not Automatically Demonstrate Causality
Finally, arrows in a SmartPLS model do not themselves prove causal effects. This limitation is especially important for cross-sectional observational social-psychological surveys.
A significant coefficient from perceived discrimination to well-being establishes a statistical relationship conditional on the specified model. It does not independently rule out reverse relationships, omitted variables, selection processes, or other explanations.
Researchers should therefore write:
“Perceived discrimination was negatively associated with psychological well-being.”
rather than:
“Perceived discrimination caused lower psychological well-being.”
Similarly, statistically significant mediation in cross-sectional data supports an indirect statistical relationship consistent with the theoretical mechanism, but it should not automatically be presented as evidence of a causal process.
Conclusion
SmartPLS offers social psychologists a flexible environment for studying complex relationships among attitudes, perceptions, identities, experiences, and behavioural outcomes. A rigorous application begins with theory and construct specification, followed by careful measurement assessment and only then structural-model evaluation.
For PLS-SEM, researchers should examine indicator loadings, reliability, AVE and especially HTMT before interpreting structural paths. Bootstrapping with 5,000 resamples provides inference for direct and indirect relationships. Demographic checks can assess robustness without turning the analysis into an exploratory search for moderators. Most importantly, researchers should distinguish CFA from CCA, CB-SEM fit from PLS-SEM assessment, statistical association from causation, and software capability from theoretical justification.
These distinctions make SmartPLS more than a path-diagram tool. They allow researchers to use SEM in a way that remains closely connected to measurement theory, substantive social-psychological questions, and defensible statistical interpretation.
References
Hair, J. F., Babin, B. J., Ringle, C. M., Sarstedt, M., & Becker, J.-M. (2025). Covariance-based structural equation modeling (CB-SEM): A SmartPLS 4 software tutorial. Journal of Marketing Analytics, 13, 709–724.
Hair, J. F., Black, W. C., Babin, B. J., & Anderson, R. E. (2018). Multivariate data analysis (8th ed.). Cengage.
Hair, J. F., Howard, M. C., & Nitzl, C. (2020). Assessing measurement model quality in PLS-SEM using confirmatory composite analysis. Journal of Business Research, 109, 101–110.
Hair, J. F., Hult, G. T. M., Ringle, C. M., & Sarstedt, M. (2022). A primer on partial least squares structural equation modeling (PLS-SEM) (3rd ed.). Sage.
Hair, J. F., Risher, J. J., Sarstedt, M., & Ringle, C. M. (2019). When to use and how to report the results of PLS-SEM. European Business Review, 31(1), 2–24.
Henseler, J., Ringle, C. M., & Sarstedt, M. (2015). A new criterion for assessing discriminant validity in variance-based structural equation modeling. Journal of the Academy of Marketing Science, 43, 115–135.
Kline, R. B. (2023). Principles and practice of structural equation modeling (5th ed.). Guilford Press.
Ringle, C. M., Wende, S., & Becker, J.-M. (2024). SmartPLS 4. SmartPLS.
If you could start a new business right now, what would it be?
View all responses


You must be logged in to post a comment.