
By Dileep Verma (Research Expert, Associate Editor of Track2Training, New Delhi, India)
For many PhD scholars, choosing statistical software becomes one of the first difficult decisions in quantitative research. A researcher may have collected hundreds of questionnaires or downloaded years of economic and institutional data, but the next question is often less clear: Which software should I use for data analysis?
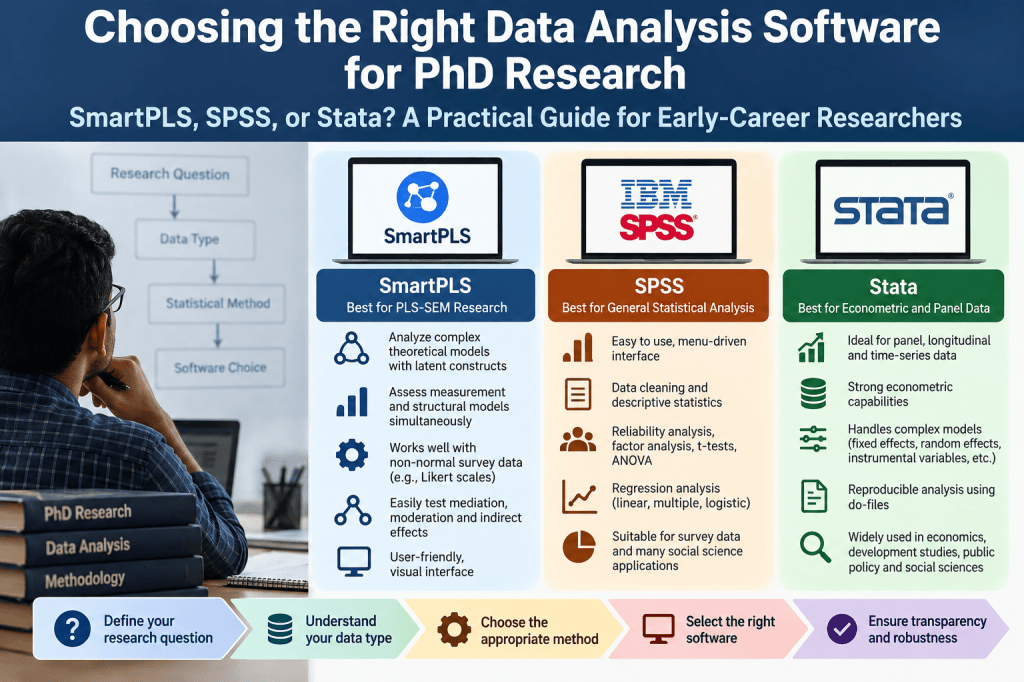
SmartPLS, IBM SPSS Statistics, and Stata are three widely used options. However, there is no single “best” software for every PhD thesis. The right choice depends on the research questions, type of variables, theoretical model, statistical technique, and nature of the data.
A common mistake among early researchers is to choose software simply because their supervisor, friend, or department uses it. A better approach is to first identify what the study needs to estimate and then select the software that can perform that analysis appropriately.
Start with Your Research Design, Not the Software
Before comparing SmartPLS, SPSS, and Stata, researchers should understand the difference between data type and analytical method.
Primary data are collected directly for a particular study. Surveys, questionnaires, interviews, experiments, and observations are common examples. In quantitative social science research, questionnaires often measure concepts that researchers cannot observe directly, such as social inclusion, institutional trust, job satisfaction, perceived discrimination, human dignity, or consumer attitudes.
Researchers commonly call these concepts latent constructs. Multiple questionnaire items may measure each construct.
Secondary data, in contrast, already exist before the researcher begins the study. Government databases, Census records, National Sample Survey data, company financial statements, administrative records, and international development databases are examples.
But this distinction alone should not determine the software. A primary survey can be analysed using SPSS or Stata, while secondary datasets can sometimes form part of structural equation models. The central question is therefore: What statistical model does your research require?
SmartPLS: Useful for PLS-SEM Research
SmartPLS is particularly useful when a researcher wants to estimate Partial Least Squares Structural Equation Modeling (PLS-SEM).
PLS-SEM allows researchers to examine relationships among multiple constructs while also assessing how well observed indicators measure those constructs. Hair et al. (2022) explain that researchers using PLS-SEM need to evaluate both the measurement model and structural model.
This makes SmartPLS attractive for survey-based research in management, marketing, information systems, psychology, education, and other social sciences.
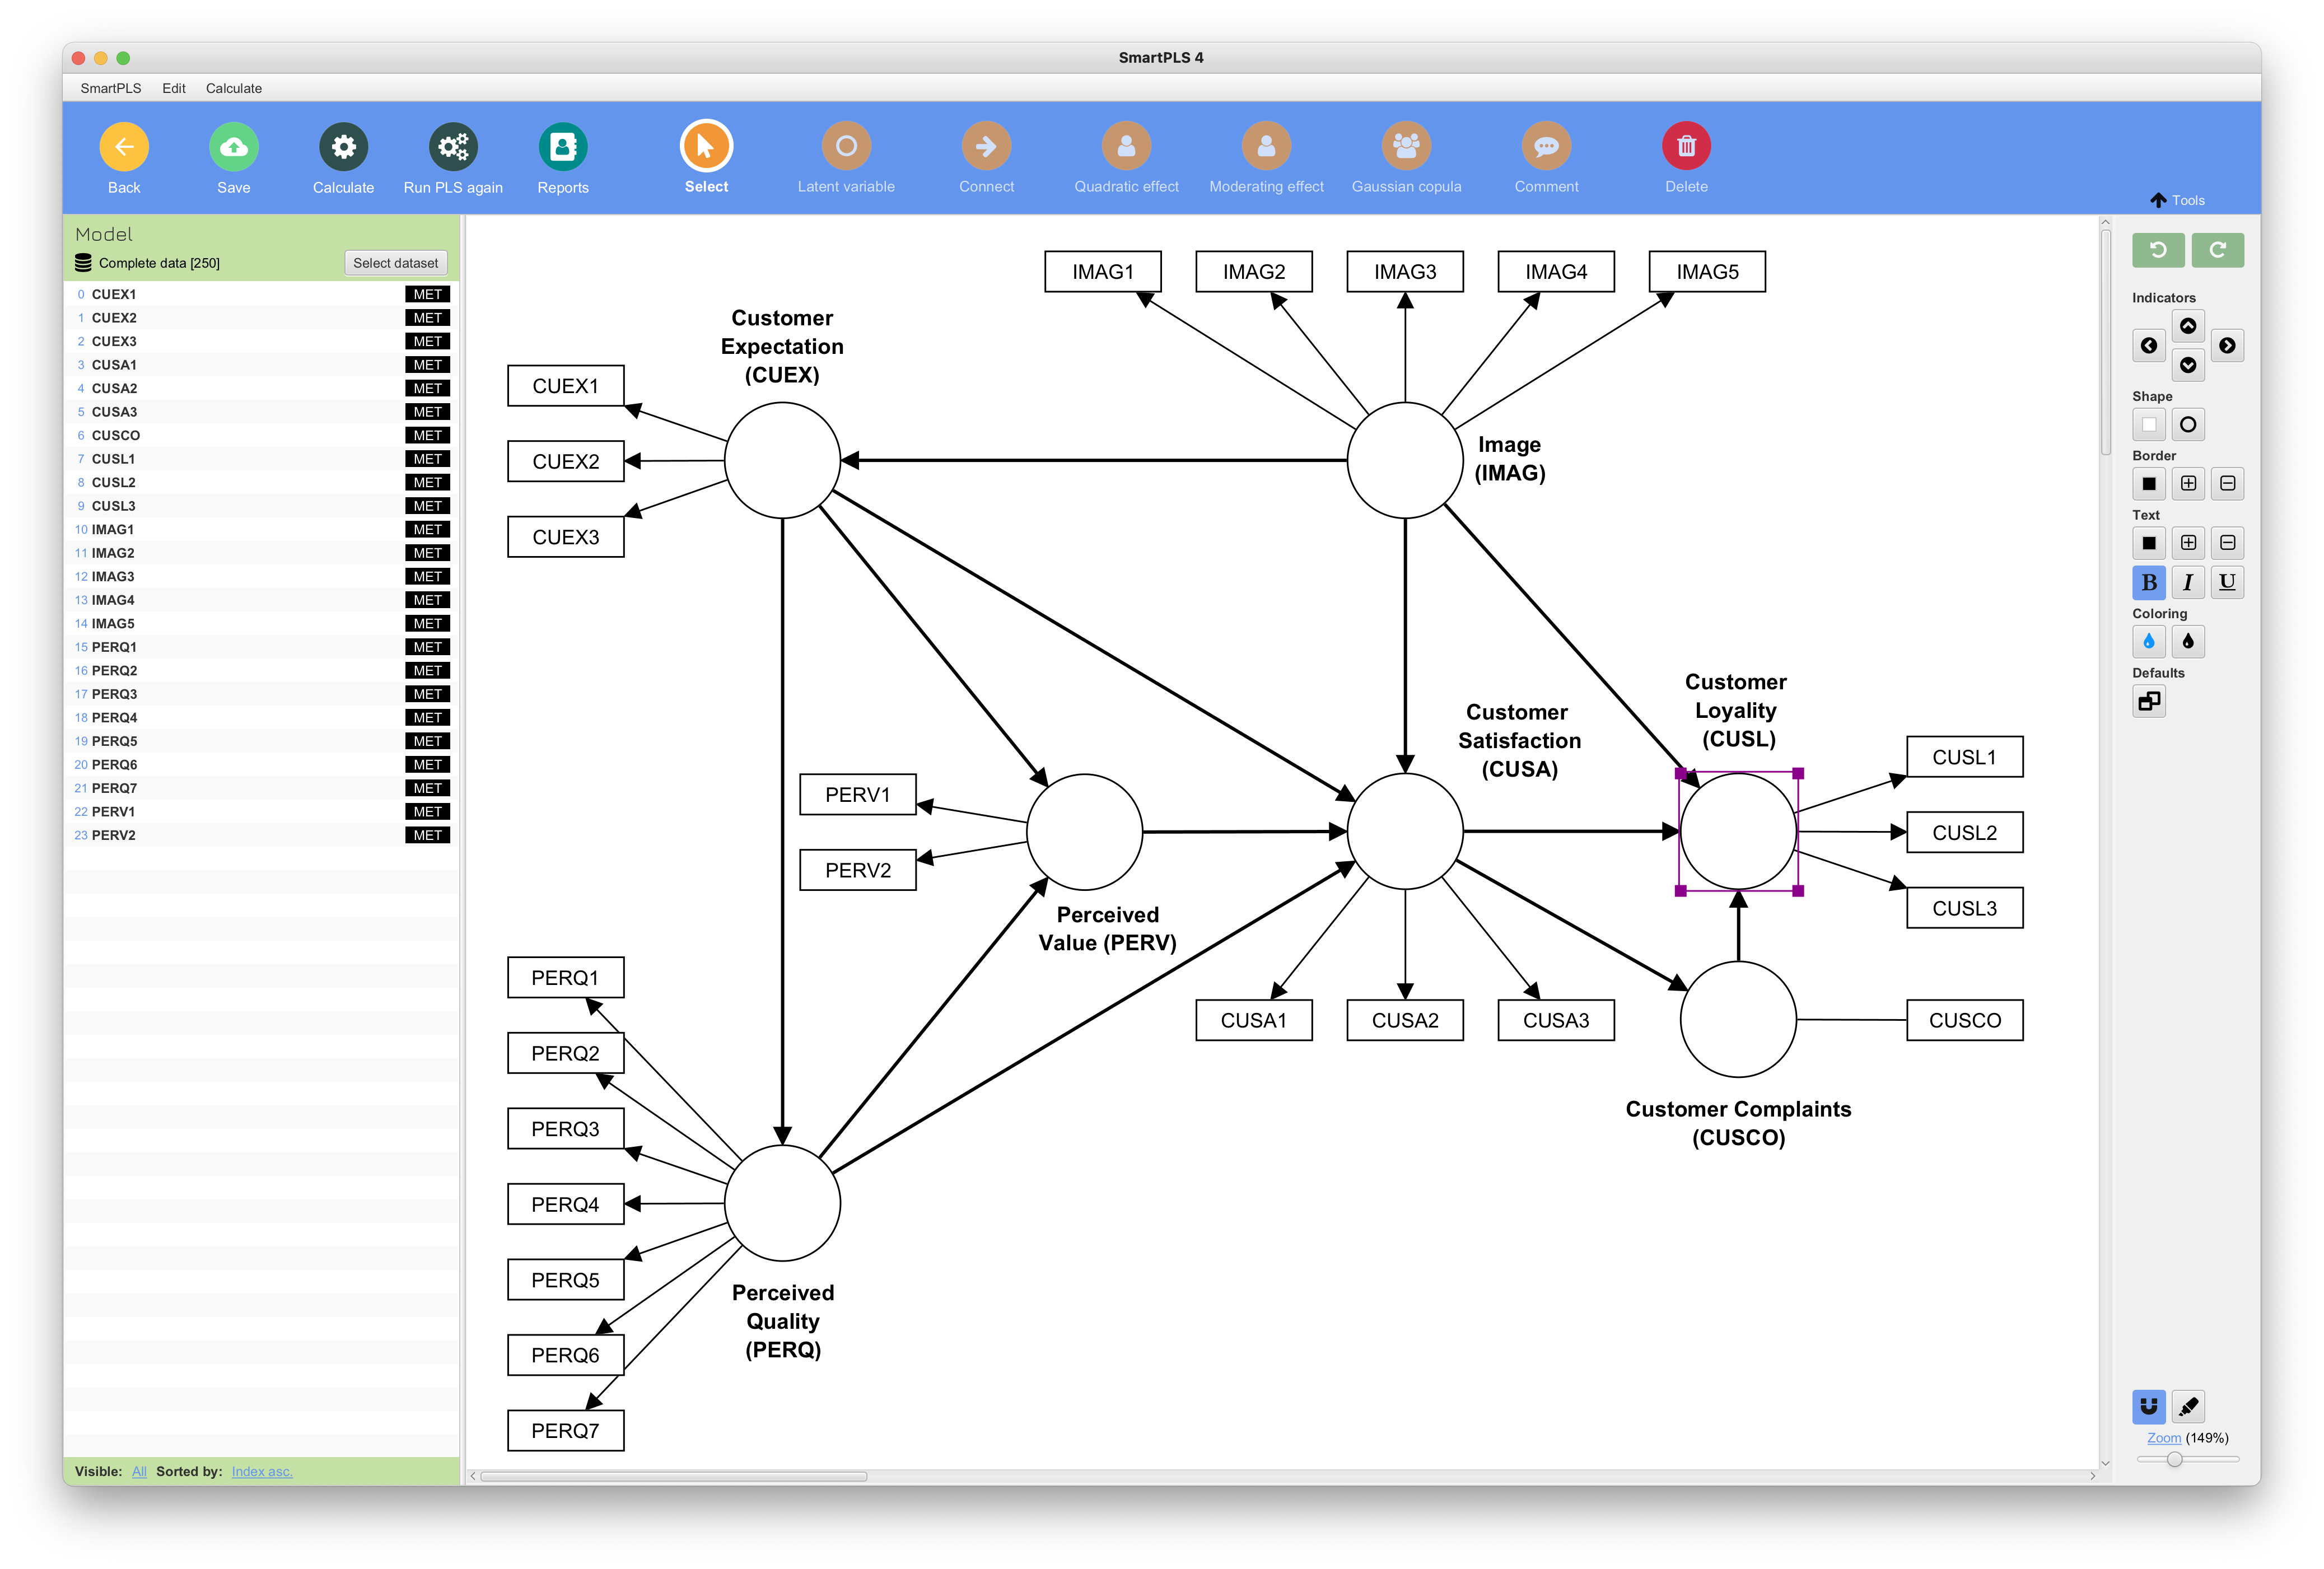
Suppose a researcher wants to examine whether institutional inclusion improves human dignity and whether human dignity subsequently influences perceived well-being. Each concept may have several questionnaire items. A simple regression using an average score cannot provide the same measurement-model assessment that SEM offers.
SmartPLS allows researchers to assess indicator loadings, internal consistency reliability, convergent validity, discriminant validity, structural path coefficients, indirect effects, and explanatory and predictive measures.
Another practical advantage is its graphical interface. Researchers can construct theoretical models visually and estimate relationships using procedures such as bootstrapping.
However, SmartPLS should not be selected simply because the researcher has Likert-scale data. The decision to use PLS-SEM requires a methodological justification based on the research objectives and model characteristics.
SPSS: Strong for General Statistical Analysis
IBM SPSS Statistics remains one of the most accessible statistical packages for students entering quantitative research.
Its main strength is usability. Researchers can conduct many analyses through menus without extensive programming knowledge. This makes SPSS particularly useful for data cleaning, descriptive statistics, reliability analysis, exploratory factor analysis, correlation, t-tests, ANOVA, and regression analysis.
For example, a PhD scholar conducting a questionnaire survey may initially use SPSS to examine missing observations, identify coding errors, calculate descriptive statistics, and understand the demographic characteristics of respondents.
SPSS is also valuable when the research questions do not require a complex structural model. If a study primarily asks whether groups differ or whether several observed predictors explain an outcome, SPSS may be entirely sufficient.
Therefore, researchers should not treat SPSS as merely an elementary package. The appropriateness of a statistical technique matters more than whether the software appears sophisticated.
Stata: Particularly Strong for Econometrics
Stata has a particularly strong position in economics, development studies, epidemiology, political science, sociology, and public policy research.
It becomes especially useful when researchers work with cross-sectional, panel, longitudinal, or time-series datasets and need econometric estimation.
For example, a researcher studying employment across Indian states over 15 years may need to account for differences between states and changes over time. Panel-data approaches such as fixed-effects or random-effects models may therefore be appropriate.
Stata provides strong support for these models and for methods dealing with issues such as heteroskedasticity, clustered observations, instrumental variables, treatment effects, and other econometric problems.
Another major advantage is reproducibility.
Researchers can save their commands in do-files. Instead of manually repeating every analytical step, they can rerun the same commands when data change or when reviewers request additional robustness tests. This creates a transparent record of how the researcher moved from raw data to final results.
For doctoral research and journal publication, such reproducibility is highly valuable.
SmartPLS vs SPSS vs Stata: How Should a PhD Scholar Decide?
The simplest way to choose is to begin with the methodological requirement.
If the study develops a theoretical model containing latent constructs measured by multiple indicators and the chosen methodology is PLS-SEM, SmartPLS is a natural option.
If the research requires descriptive statistics, group comparisons, conventional regression, exploratory factor analysis, or straightforward survey analysis, SPSS provides an accessible environment.
If the study focuses on econometric questions involving panel data, longitudinal observations, causal inference strategies, or advanced regression models, Stata may be more appropriate.
Importantly, these programs are not mutually exclusive.
A researcher may clean and describe survey data in SPSS and estimate a PLS-SEM model in SmartPLS. Another researcher may initially inspect data in SPSS before conducting econometric analysis in Stata.
The software should follow the methodology rather than determine it.
What Do Journals Actually Expect?
PhD scholars sometimes worry that journals prefer one particular software package. This concern can lead researchers to select fashionable software even when it does not match their research design.
In most cases, reviewers are more concerned with whether researchers selected an appropriate method, tested its assumptions, reported the analysis transparently, and interpreted the findings correctly.
A sophisticated software package cannot rescue a poorly specified research model.
Similarly, using a familiar program does not weaken a study when the analytical technique is appropriate.
Researchers should therefore be able to answer three questions clearly: Why was this statistical method selected? Why is it appropriate for the research questions and data? How were the results assessed for reliability and robustness?
These questions matter much more than the software logo appearing in the methodology section.
Final Advice for PhD Scholars
Choosing statistical software should be a methodological decision, not a popularity contest.
Use SmartPLS when PLS-SEM genuinely fits your theoretical model. Use SPSS when your study requires accessible general statistical analysis. Use Stata when econometric modelling, panel structures, longitudinal analysis, or related methods form the core of the research.
Most importantly, learn the statistical reasoning behind the software.
Knowing where to click can generate an output table. Understanding why a model is appropriate, what its assumptions mean, how to evaluate its results, and what conclusions the evidence permits is what turns statistical output into credible research.
For a PhD scholar, that distinction matters. Software is only a tool. The research question, theoretical framework, data structure, and methodological reasoning should always come first.
References
Baum, C. F. (2006). An Introduction to Modern Econometrics Using Stata. Stata Press.
Field, A. (2018). Discovering Statistics Using IBM SPSS Statistics (5th ed.). SAGE.
Hair, J. F., Hult, G. T. M., Ringle, C. M., & Sarstedt, M. (2022). A Primer on Partial Least Squares Structural Equation Modeling (PLS-SEM) (3rd ed.). SAGE.
Hair, J. F., Risher, J. J., Sarstedt, M., & Ringle, C. M. (2019). When to use and how to report the results of PLS-SEM. European Business Review, 31(1), 2–24.
Henseler, J., Ringle, C. M., & Sarstedt, M. (2015). A new criterion for assessing discriminant validity in variance-based structural equation modeling. Journal of the Academy of Marketing Science, 43(1), 115–135.
Wooldridge, J. M. (2020). Introductory Econometrics: A Modern Approach (7th ed.). Cengage Learning.





You must be logged in to post a comment.