This essay examines the profound impact of Mughal and British rule on the urban development, architecture, and socio-cultural identity of Indian cities. The Mughal emperors introduced geometric city planning, monumental architecture, and cosmopolitan marketplaces, creating integrated urban centers defined by gardens, forts, and bustling bazaars. In contrast, British colonialists imposed rational grid layouts, segregated neighborhoods, and modern infrastructure, fundamentally restructuring city landscapes through administrative and sanitary reforms. By comparing planning concepts, architectural styles, social organization, and enduring legacies, this essay highlights how the interplay of these two eras produced India’s unique urban morphology which came out as a blend of symbolic harmony and functional order that continues to shape the physical and cultural character of modern Indian cities.
1. INTRODUCTION
The cities of India are living palimpsests-layers of history, culture, and power inscribed upon their streets, monuments, and patterns of life. Over centuries, various dynasties, empires, and colonial regimes have contributed to their form and identity, but none more profoundly than the Mughals and the British. Each of these powers envisioned the city as a reflection of their ideals: for the
Mughals, it was a symbol of imperial glory, divine harmony, and aesthetic perfection; for the British, it became an instrument of control, order, and modernization. The Mughal period introduced a distinctly Indo-Islamic urban culture that celebrated geometry, balance, and environmental integration, visible in grand cities like Fatehpur Sikri, Agra, and Shahjahanabad. The British, arriving centuries later, reinterpreted urbanism through the lens of Western rationality, introducing wide avenues, civic institutions, and infrastructural systems that marked the onset of modern urban planning in India. Together, these two periods produced a remarkable dual legacy of the coexistence of historical beauty and colonial order-that continues to define the spatial and cultural character of Indian cities today.
2. Discussion
2.1 Mughal Influence [ Integration of power, Aesthetics and Culture]
The Mughal emperors (16th-18th century) were visionary urban planners who infused Indian cities with a blend of Persian, Central Asian, and indigenous Indian elements. They sought to create imperial capitals that were not just centres of governance but also expressions of cosmological order, grandeur, and cultural integration. Cities like Agra, Fatehpur Sikri, Lahore, and Shahjahanabad (Old Delhi) epitomize this vision.
Mughal urbanism prioritized symmetry and geometry like fortified walls and monumental gateways defined city boundaries, while axial avenues aligned palaces, mosques, and bazaars to create a hierarchical spatial order. The Persianinspired Charbagh gardens formed core elements, integrating nature, water, and architecture to symbolize paradise on earth and provide environmental comfort. Waterworks such as canals, tanks, and stepwells further enhanced urban functionality and aesthetics.
Architecturally, Mughal cities were dominated by grand constructions using red sandstone and white marble. Notable features included domes, minarets, arches, jharokhas (projecting balconies), and chhatris (elevated pavilions), manifesting an Indo-Islamic style marked by intricate ornamentation and monumentality. The Red Fort and Jama Masjid in Delhi, the Taj Mahal and Agra Fort in Agra, and the Shalimar Gardens in Lahore remain testaments to this era’s artistic and urban achievements.
Beyond architecture, Mughal cities were vibrant trade and craft centres, attracting artisans, scholars, and merchants from across Asia. Urban life was relatively integrated, with markets and neighbourhoods accommodating diverse religious and ethnic communities, fostering a cosmopolitan culture that underpinned both economic prosperity and social cohesion.
2.2 British Influence [ Rational Planning, Segregation and Modernity]
Contrasting with Mughal organic and symbolic city forms, British colonialism (18th-20th century) introduced rational, functional, and segregated urban models aligned with administrative control, military strategy, and commercial expansion. The British developed key presidency towns, for example, Calcutta (Kolkata), Bombay (Mumbai), and Madras (Chennai) by often expanding preexisting settlements or creating entirely new urban quarters.
British urban planning favoured gridiron layouts with wide, straight roads, clear zoning, and enforced segregation between Europeans and indigenous populations, embodied in the “White Town” and “Black Town” duality. Administrative buildings, cantonments, and civil lines were carefully laid out, with emphasis on sanitation, public health, and civic order. Public parks, railway stations, and colonial civic institutions like town halls and courts became prominent features of the urban landscape.
Architecturally, British cities displayed neo-classical, Gothic Revival, and IndoSaracenic styles that symbolized imperial power while incorporating local motifs. Buildings such as the Victoria Memorial in Kolkata, Gateway of India in Mumbai, and Rashtrapati Bhavan in New Delhi display this hybrid grandeur. The creation of New Delhi as the colonial capital in the early 20th century epitomized British urban ambitions with monumental axes, hexagonal road grids, and imposing government complexes designed by architects like Edwin Lutyens and Herbert Baker.
Railway expansion, port development, and telegraph networks spurred industrial growth and connected colonial cities to global trade circuits. However, British urban policies often neglected Indian quarters, maintaining social segregation and reinforcing racial hierarchies.
2.3 Comparative Insights
The Mughal and British periods reflect divergent urban philosophies. Mughals emphasized symbolic imperialism, integration, and environmental harmony, while the British stressed administrative efficiency, segregation, and modern infrastructure. Mughal cities blended religious, commercial, and residential uses in hierarchical, organic patterns; British cities introduced zoning, gridiron layouts, and clear social separation. Architecturally, the Mughals emphasized Indo-Islamic synthesis; the British created eclectic hybrids with European forms and Indian motifs. Despite differences, both eras profoundly shaped Indian urban identity. Mughal heritage endures in the lively bazaars, gardens, and forts of historical cores, while British legacies structure metropolitan governance, transportation, and commercial activities, visible in central business districts and civic institutions.
Conclusion
The Mughal and British influences form intertwined yet distinct chapters in the urban history of India. Mughal cities reflected the grandeur of imperial power, artistic refinement, and cultural synthesis. Their urban form was characterized by symmetry, geometric planning, and monumental architecture that embodied both aesthetic unity and functional harmony. Features such as fortified walls, axial streets, grand mosques, bustling bazaars, and lush gardens created an environment that celebrated inclusivity and cosmopolitanism. Cities like Agra,
Delhi, and Fatehpur Sikri showcased how Mughal urbanism integrated Islamic, Persian, and Indian traditions, producing a vibrant and human-scaled urban experience.
In contrast, British colonial cities represented an entirely different set of priorities rooted in administration, control, and economic exploitation. The British introduced grid layouts, civil lines, cantonments, and segregated zones that physically and socially divided colonial elites from the indigenous population. Cities such as Bombay (Mumbai), Calcutta (Kolkata), and Madras (Chennai) became symbols of modernization and infrastructural progress, featuring railways, ports, and civic buildings in the neoclassical style. Yet, they also reflected deep spatial and racial hierarchies. Together, Mughal and British influences created a rich, layered urban morphology that continues to shape the cultural, architectural, and social identity of Indian cities today. Understanding this composite legacy is vital for informed urban conservation, sustainable development, and culturally rooted planning in contemporary India.
References
1. Iftikhar, R. (2016). Urban formation and cultural transformation in Mughal India. International Planning History Society Proceedings.
Population studies form a central component of social science research because they deal with the most fundamental unit of society — people. By examining how populations grow, decline, move, and change their internal composition, population studies provide the empirical basis for planning public services, designing economic policies, and understanding social change.
This document presents a comprehensive, plain-language exploration of population studies and human dynamics. It is written to be accessible for students, planners, and professionals who require a thorough overview without dense academic referencing. The chapters that follow cover theoretical foundations, measurement techniques, key demographic indicators, contemporary global and regional trends, migration and urbanization, population composition and pyramids, population policies, interactions with the environment, and challenges for the twenty-first century.
Each section includes clear explanations, real-world illustrations, and practical implications for policy and planning. Readers will leave with a solid grasp of demographic concepts and how those concepts translate into action at the local, national, and international levels.
2. Concept of Population
In demography, the term ‘population’ denotes all individuals living in a defined geographic area at a given point in time. This definition can be adapted to specific analytical needs: a population may be residents of a city, a cohort born in the same year, or a group defined by shared characteristics such as occupation or health status.
Population studies therefore require clarity about the unit of analysis. For instance, a study of ‘urban population’ may focus on city-dwellers’ living conditions, while a study of ‘working-age population’ may examine labor market dynamics. A population is usually described in terms of size (how many), distribution (where they live), and composition (who they are). Size is a raw count; distribution maps where people live; composition breaks the population down by age, sex, education, marital status, and socioeconomic attributes.
These three descriptive pillars make population data actionable for decision-makers. Size alerts planners to the volume of needs; distribution identifies spatial priorities; composition reveals the types of services required. For example, a municipality with a large proportion of elderly residents will prioritize healthcare and accessible infrastructure, while one with a youth bulge may invest more in education and job creation.
3. Scope and Importance of Population Studies
Population studies address multiple interlocking questions about humans and their environments. They are interdisciplinary by necessity, drawing from sociology, economics, geography, public health, and environmental science. Key topics include fertility (how many children are born), mortality (how many people die), and migration (how people move).
Beyond these core processes, demographers study population distribution and density, household structure, population aging, fertility preferences, and the social determinants of health. The importance of population studies cannot be overstated. Governments use population data to allocate budgetary resources, locate hospitals and schools, design pension systems, and formulate immigration rules. Planners use population projections to size water systems, roads, and housing stocks.
Businesses use demographic profiles to select market segments and locate retail outlets. Non-governmental organizations depend on population indicators to target interventions such as vaccination campaigns, maternal health programs, and livelihood projects. Researchers rely on demographic measures to evaluate long-term trends such as urbanization, aging, and the demographic dividend. In short, population studies inform virtually every domain of collective decision-making.
4. Sources of Population Data
Accurate data underpins all credible population analysis. Different sources offer complementary strengths and limitations. Familiarity with these sources allows analysts to choose the most appropriate data for a given task.
National Censuses: Large-scale enumeration typically carried out every ten years. Censuses aim for complete counts and provide detailed demographic, social, and housing information. They are the backbone of national population statistics but are expensive and infrequent.
Vital Registration Systems: Systems that record births, deaths, marriages, and divorces. When complete and timely, vital registration provides continuous tracking of vital events and helps compute indicators like crude birth rate and infant mortality rate. Completeness varies across countries.
Household Surveys: Surveys such as demographic and health surveys, labor force surveys, and household income surveys deliver regular, sample-based estimates of demographic indicators and often include rich socioeconomic data. Their reliability depends on sample design and implementation.
Administrative Data: Records generated by government programs like education enrollment, tax records, and national ID systems. These are useful for near-real-time monitoring but may suffer from coverage gaps and privacy considerations.
Special Studies and Research Projects: Targeted studies — for example, migration mapping, fertility preference studies, or longitudinal cohort studies — provide depth on particular questions that broader sources may not cover.
5. Population Growth and Trends
Population growth is the result of the interaction between fertility, mortality, and migration. Historically, the global population growth rate accelerated in the twentieth century due to dramatic declines in mortality following advances in medicine, sanitation, and food production. This ‘health transition’ meant more children survived into adulthood and life expectancy increased.
However, fertility rates in many parts of the world have since declined, producing a range of outcomes: some countries maintain steady growth, others are rapidly expanding, and some are experiencing stagnation or decline. Trends vary markedly by region: many countries in sub-Saharan Africa continue to see high fertility and young populations; much of Europe, East Asia, and parts of the Americas face aging populations and low birth rates.
Analysts monitor not only absolute population size but also growth momentum, age structure, and spatial patterns. ‘Growth momentum’ refers to continued population growth because of a large cohort of young people, even if fertility falls. Spatially, population growth is often uneven — urban areas tend to grow faster than rural ones due to migration and natural increase, creating pressures on city infrastructure and services.
6. Population Theories
6.1 Malthusian Theory and Its Legacy
Thomas Malthus argued in the late 18th century that population growth, if left unchecked, would outstrip food production and lead to famine, disease, and conflict. Malthusian theory emphasized natural limits and the potential for scarcity.
While critics point out that technological advances in agriculture (the Green Revolution) and industrial organization have historically expanded food supply beyond Malthus’s arithmetic assumptions, the core insight — that resources, environment, and population interact — remains influential. Modern ‘neo-Malthusian’ perspectives focus on environmental carrying capacity, resource depletion, and the ecological consequences of large populations.
6.2 Marxian and Structural Perspectives
Marxian perspectives challenge the idea that population itself is the primary problem. Instead, they emphasize social and economic systems that produce inequality and misallocation of resources. Under this view, poverty and famine often result from structural arrangements, distributional conflicts, and policy failures, not simply from an excess of people. This approach leads to different policy prescriptions: instead of population control alone, advocates call for redistribution, agricultural reform, and social safety nets to ensure equitable access to resources.
6.3 Demographic Transition Model (DTM)
The Demographic Transition Model describes how countries move from high birth and death rates to low birth and death rates as they industrialize and develop. The model typically identifies several stages: a pre-transition stage (high fertility and mortality), a transition stage (mortality declines followed by fertility decline), and a post-transition stage (low fertility and mortality, leading to slower growth or stabilization).
The DTM provides a useful framework for understanding general patterns, but it is not deterministic. Cultural, policy, and economic differences can alter the timing and path of demographic change. For example, some countries experience rapid fertility decline due to targeted family planning and female education, while others maintain high fertility despite economic growth.
7. Fertility and Mortality
Fertility and mortality are fundamental demographic processes. Fertility measures include the Total Fertility Rate (TFR) — the average number of children a woman would have over her lifetime at current age-specific fertility rates — and crude birth rate (CBR), which is births per 1,000 population per year. Mortality measures include crude death rate (CDR) and life expectancy at birth, along with infant and under-five mortality rates which capture child survival conditions.
Factors influencing fertility are diverse: socio-economic status, female education, child mortality rates, cultural norms, contraceptive availability, and government policies all play roles. Mortality is influenced by healthcare access, nutrition, sanitation, disease environment, conflict, and age structure.
Public interventions aimed at reducing mortality — such as immunization programs, basic sanitation, and maternal care — have historically driven large gains in life expectancy. Understanding the interplay between fertility and mortality helps explain the pace and nature of population change. For instance, a rapid fall in mortality accompanied by only a slow decline in fertility can produce a ‘population explosion’ as seen in many countries during the twentieth century.
8. Migration and Urbanization
Migration reshapes population size and composition across places. It is driven by push factors (poverty, conflict, environmental degradation) and pull factors (jobs, education, better services). Migration can be temporary or permanent, internal or international, voluntary or forced.
Urbanization — the rise in the share of people living in cities — is closely linked to migration. Rural-to-urban migration often fuels city growth, while natural increase (births minus deaths) also contributes. Urbanization brings economic opportunities and innovation but also concentrates problems like housing shortages, traffic congestion, pollution, and informal settlements.
8.1 Types of Migration
Internal migration includes movements within national borders, commonly rural-to-urban or between cities for employment. International migration crosses borders and includes labor migrants, refugees, family reunification, and highly skilled professionals.
Circular migration involves repeated movements between origin and destination, often tied to seasonal work. Each type has different implications: internal migrants may influence urban labor markets and housing demand, while international migration raises questions about integration, remittances, and transnational ties.
8.2 Urbanization and Its Impacts
Rapid urban growth transforms economies and landscapes. On the positive side, cities concentrate labor and capital, enabling economies of scale, better access to services, and cultural exchange. Clusters of industries and services foster innovation and higher productivity.
However, when urban growth outpaces planning, it leads to slums, inadequate infrastructure, and environmental degradation. Managing urban growth requires investment in affordable housing, public transport, waste management, and inclusive governance. Moreover, peri-urban expansion changes land use and can produce conflicts over resources and livelihoods.
9. Population Distribution and Density
Population distribution answers the question: where do people live? Patterns are shaped by physical geography (climate, water availability, topography), economic opportunities, historical settlement patterns, and policy decisions. Densely populated areas tend to be river valleys, fertile plains, and coastal zones that historically supported agriculture and trade. Sparse regions include deserts, high mountains, and extreme climates.
Population density — measured as people per square kilometer or mile — is a blunt but useful indicator for planning infrastructure and services. High-density cities demand vertical expansion, multi-modal transport, and carefully managed public spaces, while low-density rural regions present different challenges, such as providing dispersed public services efficiently.
10. Population Composition
Composition refers to the internal structure of a population by age, sex, education, occupation, and other attributes. Age structure is especially informative: it determines dependency ratios (the ratio of non-working age to working-age population) and signals future social service needs. A common visual tool is the population pyramid — a bar chart that displays age groups by sex.
A broad-based pyramid indicates a young population with high fertility; a rectangular shape suggests low fertility and low mortality typical of developed countries; a top-heavy pyramid signals population aging.
Other compositional characteristics — such as educational attainment, urban/rural residence, and employment sectors — influence economic potential and social needs. For example, a population with rising educational attainment can support more complex economic activities, but only if the economy can create matching jobs.
11. Methods of Population Analysis
Demographers use several quantitative and qualitative methods to analyze population dynamics. Key quantitative methods include the cohort-component method for projections, life table analysis for mortality and survival probabilities, and measure construction for fertility and mortality indicators.
The cohort-component method projects future populations by age and sex by applying age-specific fertility, mortality, and migration rates to a base population. This method is flexible and widely used by national statistical offices for medium- and long-term planning.
Life tables convert age-specific mortality rates into survival probabilities and are critical for calculating life expectancy. Qualitative methods — such as focus group discussions, household interviews, and ethnographic fieldwork — provide contextual understanding of fertility decisions, migration motivations, and social norms.
Mixed-methods approaches that combine statistical trends with qualitative insights are particularly valuable for policy-relevant research.
12. Key Demographic Indicators and How to Interpret Them
Understanding a core set of indicators is essential for interpreting population data. Below are commonly used measures and what they reveal:
Total Fertility Rate (TFR): The average number of children a woman would have over her reproductive lifetime given current age-specific fertility rates. A TFR of around 2.1 is often called ‘replacement level’ in many populations.
Crude Birth Rate (CBR): Births per 1,000 population in a year. Useful for quick comparisons but sensitive to population age structure.
Crude Death Rate (CDR): Deaths per 1,000 population in a year. Like CBR, it depends on age structure and may be high in aging populations even with good health services.
Infant Mortality Rate (IMR): Deaths of infants under one year per 1,000 live births. A key indicator of child health and the performance of health systems.
Life Expectancy at Birth: The average number of years a newborn is expected to live under current mortality conditions. It summarizes overall mortality conditions in a single figure.
Dependency Ratio: Ratio of dependents (young and old) to working-age population; high ratios imply greater economic pressure on the productive population.
Population Growth Rate: The annual percentage change in the population resulting from natural increase and net migration.
13. Population Policies and Planning
Governments adopt population policies to influence demographic processes or to respond to demographic trends. Policies may be pronatalist (encouraging higher fertility), antinatalist (encouraging lower fertility), or neutral but adaptive (providing services for current demographic realities).
Examples of pronatalist policies include child allowances, parental leave, and subsidized childcare. Antinatalist measures have included family planning services, education campaigns, and in extreme historic cases, legal restrictions. Adaptive policies focus on infrastructure development, pension reform, and healthcare expansion to accommodate an aging population or rapid urban growth.
Effective policy-making depends on accurate data, transparent institutions, and participatory approaches that respect human rights. Coercive policies undermine trust and can have long-term social costs, so modern population policy emphasizes voluntarism, access to information, and broad-based social development.
14. Population and Environment
Population dynamics have significant environmental consequences. More people generally imply more consumption of land, water, energy, and materials, and greater generation of waste and emissions. However, the relationship between population and environment is mediated by consumption patterns and technology.
High-income populations often have disproportionately large environmental footprints per capita. Environmental challenges linked to population include deforestation for agriculture and housing, loss of biodiversity, urban air and water pollution, and increased greenhouse gas emissions.
Rapid population growth in ecologically fragile areas can exacerbate land degradation and water scarcity. Sustainable development frameworks therefore emphasize not just population numbers, but sustainable consumption, efficient technologies, and equitable resource governance.
Policies that combine family planning, education (especially for women), renewable energy adoption, and sustainable urban design can help reduce the environmental impacts of population change.
15. Case Studies and Illustrations
Concrete examples help translate abstract demographic concepts into real-world insights. The following short case studies illustrate common demographic scenarios and policy responses.
Case Study: The Youth Bulge and Economic Opportunity Many countries in the global South exhibit a ‘youth bulge’ — a disproportionately large cohort of young people. If harnessed through education, skills training, and job creation, a youth bulge can yield a demographic dividend: accelerated economic growth resulting from a high ratio of workers to dependents.
However, if economies fail to provide productive work, high youth unemployment can lead to social unrest and wasted human potential. Policy responses include investing in secondary and tertiary education, vocational training linked to market needs, entrepreneurship support, and macroeconomic policies that stimulate job-rich growth.
Case Study: Population Aging and Welfare Systems Several developed and some middle-income countries face rapid population aging due to sustained low fertility and improved survival. Aging increases demand for healthcare, long-term care, and pensions, while shrinking the share of workers paying taxes.
Responses include raising the retirement age, reforming pension systems to ensure sustainability, investing in ‘aging in place’ infrastructure, and encouraging labor force participation among older adults. Integrating technology into elder care and preventive health measures can also alleviate pressures on healthcare systems.
Case Study: Informal Settlements in Rapidly Growing Cities When urban growth outstrips housing supply and planning capacity, informal settlements expand.
These are characterized by insecure tenure, inadequate sanitation, and overcrowding. Interventions that have shown promise include slum upgrading programs that provide tenure security, incremental housing improvements, community-led sanitation projects, and participatory land-use planning.
Successful approaches work in partnership with local communities, combine physical upgrades with livelihood and social services, and ensure long-term affordability.
16. Challenges and Future Prospects
Looking ahead, demographers and policymakers face multiple intertwined challenges. Climate change will increasingly interact with population dynamics, through climate migration, effects on agricultural productivity, and pressures on coastal cities from sea-level rise.
Advances in healthcare and biotechnology may alter mortality and morbidity patterns in unpredictable ways. Demographic uncertainty complicates long-range planning. Policymakers must prepare flexible systems that can adapt to a range of futures.
Investing in human capital — education and health — remains the most robust strategy for enhancing societal resilience. Equally important are inclusive institutions and policies that reduce inequalities and ensure that demographic change translates into broadly shared development gains.
17. Practical Implications for Urban and Regional Planners
Population studies directly inform planning practice. Planners use demographic projections to estimate future demand for housing, water, transportation, and social services. Some practical recommendations include: • Integrate demographic analysis into all stages of planning: baseline studies, scenario development, and monitoring. • Pay special attention to age structure: a young population needs schools and job programs; an aging population needs accessible infrastructure and healthcare. • Monitor migration flows and their drivers to anticipate housing and labor market shifts. • Design flexible, modular infrastructure that can be scaled up or repurposed as demographic conditions change. • Engage communities in participatory planning to ensure that demographic diversity is reflected in design choices.
18. Research and Data Needs
To improve policy relevance, population research should prioritize the following: • Strengthening civil registration and vital statistics to provide timely data on births, deaths, and causes of death. • Enhancing the frequency and geographic detail of household surveys to capture subnational dynamics. • Investing in longitudinal cohort studies to understand life-course determinants of fertility, health, and migration. • Combining traditional data sources with new data streams (e.g., mobile phone data, satellite imagery) while addressing privacy and ethical concerns. • Promoting capacity-building in statistical offices and universities so that demographic analysis informs policy at all levels.
19. Conclusion
Population studies illuminate the contours of human dynamics and provide essential information for effective governance, development, and environmental stewardship. By tracking how people reproduce, die, and move, demographers offer insights that matter for classrooms and clinics, for city streets and national budgets.
The diverse challenges of the twenty-first century — from climate change to technological disruption — mean that demographic knowledge is more important than ever.
A constructive way forward combines accurate measurement, humane policy design, and investments in education and health. With these foundations, demographic change can be a source of opportunity rather than crisis.
20. Appendix: Glossary of Key Terms
Population Density: Number of people per unit area, an indicator of how crowded a place is.
Cohort: A group of people who experience a particular event in the same time period, often used for birth cohorts.
Demographic Dividend: The economic growth potential that can result from shifts in a population’s age structure, typically when the working-age population grows relative to dependents.
Dependency Ratio: A measure of the proportion of dependents (young and old) relative to the working-age population.
Life Table: A table that shows, for a cohort, the probability of surviving to each age.
Net Migration: The difference between the number of immigrants and emigrants in a population over a period of time.
Replacement Level Fertility: The TFR at which a population exactly replaces itself from one generation to the next, without migration; usually around 2.1 in many settings.
20. Links and References
Duncan, S. R., Duncan, C. J., & Scott, S. (2001). Human population dynamics. Annals of Human Biology, 28(6), 599-615.
Hassan, F. A. (2002). Population dynamics. In Companion Encyclopedia of Archaeology (pp. 672-713). Routledge.
Lee, R. D. (1987). Population dynamics of humans and other animals. Demography, 24(4), 443-465.
Demographic variables are the statistical characteristics that describe human populations in terms of their size, structure, and dynamics. They help in analysing patterns of birth, death, migration, education, income, and social behaviour across different regions and time periods. This essay discusses the major categories of demographic variables—basic, socio-economic, socio-cultural, process, migration, composition, health, environmental, and political—and explains how each contributes to understanding population change and development. By linking these variables to urban and regional planning, the essay highlights their role in shaping sustainable cities, equitable policies, and informed governance. Ultimately, demographic variables serve as essential tools for understanding the human condition and its evolution in response to social, economic, and environmental forces.
Introduction:
Demography, derived from the Greek words demos (people) and graph (to write), is the scientific study of human populations—their size, distribution, structure, and changes over time. It examines how populations evolve through births, deaths, and migration, and how these changes affect societies, economies, and environments. Within this discipline, demographic variables are the measurable attributes used to describe populations and analyse trends. They provide the empirical foundation upon which population projections, planning strategies, and social policies are built.
The study of demographic variables is central to urban and regional planning. Population characteristics influence the demand for housing, transport, education, healthcare, employment, and public infrastructure. For instance, a youthful population requires schools, universities, and job creation, whereas an ageing population demands healthcare services and accessible urban design. Similarly, migration patterns influence city growth, density, and spatial structure. Thus, an understanding of demographic variables enables planners and policymakers to make informed and sustainable decisions that align with societal needs.
This essay aims to examine the key demographic variables in detail, classify them into meaningful categories, and discuss their significance in understanding population dynamics and guiding socioeconomic and spatial development.
Discussion:
1. Basic Demographic Variables
Basic demographic variables form the foundation of population studies. They describe fundamental personal characteristics such as age, sex, marital status, and household type.
Age: Age is one of the most critical demographic variables because it determines the population’s structure and productivity. The distribution of age groups (children, working-age adults, and elderly) affects labour force participation, dependency ratios, and the type of services required. For example, a high proportion of young people indicates future labour potential but also a greater burden on educational and childcare systems.
Sex (Gender): The sex composition of a population is expressed through the sex ratio, usually measured as the number of females per 1,000 males. Gender balance affects marriage patterns, labour markets, and social stability. In many developing countries, skewed sex ratios reflect gender discrimination and selective birth practices.
Marital Status: This variable classifies individuals as single, married, divorced, or widowed. It has implications for fertility levels, household formation, and housing demand.
Household Size and Type: Households can be nuclear, joint, or single-person, and their size influences housing needs, consumption patterns, and community planning.
Together, these variables shape the composition and social organization of populations, providing the basis for more complex demographic analysis.
2. Socio-Economic Variables
Socio-economic variables describe the economic and social dimensions of individuals and groups. They reveal inequalities in access to resources and opportunities, influencing fertility, mortality, and migration behaviours.
Education and Literacy Level: Education enhances skills, productivity, and awareness. Literate populations have lower fertility rates, better health outcomes, and higher income levels. Literacy also empowers women, enabling them to participate in decision-making and formal employment.
Occupation: Occupation reflects the nature of work performed—manual, professional, or managerial—and provides insight into the economic structure of a population. Occupational distribution also indicates the stage of economic development, such as agricultural, industrial, or service-dominated economies.
Income: Income determines the standard of living and access to essential goods and services. Higher income levels often correlate with lower fertility and mortality, as well as improved housing and nutrition.
Employment Status: The employment rate shows the proportion of the working-age population engaged in economic activity. High unemployment can lead to migration and social unrest, while high employment fosters stability and growth.
Housing Conditions: Housing is a key indicator of quality of life. Variables such as tenure (owned or rented), size, and access to amenities reveal disparities in living standards.
Access to Basic Services: Availability of clean water, sanitation, electricity, and internet connectivity reflects the level of infrastructure development and directly influences health and well-being.
Socio-economic variables thus connect demography with development, highlighting the interdependence of population characteristics and economic progress.
3. Socio-Cultural Variables
Culture and social identity strongly shape demographic behaviour. Socio-cultural variables explain how traditions, values, and social structures influence fertility, marriage, and migration.
Religion: Religious beliefs often affect reproductive behaviour, gender roles, and population policies. For instance, some religions encourage large families, while others promote family planning.
Caste and Ethnicity: In countries like India, caste and ethnicity determine access to education, employment, and social mobility. They also affect spatial segregation and policy targeting.
Language: Language defines cultural identity and social integration. Multilingual societies often experience internal migration and cultural diversity, influencing planning decisions for education and communication.
Customs and Traditions: Social customs determine age at marriage, family size, and gender expectations. Traditional norms can either support or hinder modernization and population control measures.
Understanding socio-cultural variables is crucial for designing inclusive policies that respect diversity while promoting equity.
4. Demographic Process Variables
Demographic processes—fertility, mortality, and migration—are the mechanisms through which populations change over time.
Fertility Rate: The total fertility rate (TFR) measures the average number of children a woman would bear during her lifetime. It is influenced by education, income, health, and cultural factors.
Mortality Rate: Mortality measures the frequency of deaths in a population. High mortality rates often indicate poor healthcare and living conditions.
Birth Rate and Death Rate: These annual rates show natural population increase or decrease.
Life Expectancy: Represents the average number of years an individual is expected to live. Higher life expectancy reflects better healthcare, nutrition, and living standards.
Together, these variables explain the natural growth or decline of populations and provide critical input for health and social planning.
5. Migration and Mobility Variables
Migration refers to the movement of people from one place to another, temporarily or permanently. It reshapes the demographic, social, and economic landscape of both origin and destination regions.
Place of Birth and Residence: Distinguishes migrants from natives in population data.
Migration Rate: Measures the volume of migration in or out of an area.
Type of Migration: Classified as rural-to-urban, urban-to-rural, intra-state, inter-state, or international.
Reason for Migration: Includes employment, education, marriage, displacement, or conflict.
Duration of Stay: Determines whether migration is temporary or permanent.
Migration affects urbanization, labour supply, housing demand, and cultural diversity. In developing countries, rapid rural-to-urban migration often leads to informal settlements and planning challenges.
6. Population Composition Variables
These variables describe how a population is structured in terms of its demographic characteristics.
Dependency Ratio: The ratio of dependents (under 15 and over 60) to the working-age population (15–59). A high ratio means a greater economic burden on the workforce.
Sex Ratio: Indicates gender balance in a society and helps identify gender-based inequalities.
Population Density: Refers to the number of people per unit area. High densities indicate urban concentration, while low densities show rural dispersion.
Urban–Rural Distribution: Reflects the level of urbanization and infrastructure concentration.
Population Growth Rate: The percentage increase or decrease in population over a specific period, combining both natural growth and migration.
These indicators help planners assess service needs, design infrastructure, and allocate resources efficiently.
7. Health and Well-being Variables
Health variables describe the physical and mental condition of a population, which directly impacts productivity and quality of life.
Nutritional Status: Evaluated through dietary intake, BMI, and child malnutrition rates.
Disease Prevalence: Identifies the spread of communicable and non-communicable diseases.
Health Insurance Coverage: Determines access to medical care and financial protection.
Disability Status: Highlights the proportion of people with physical or mental disabilities requiring special support.
Health indicators are essential for planning hospitals, healthcare staff, and preventive programs.
8. Environmental and Geographic Variables
Environmental factors influence where and how populations live.
Settlement Type: Urban, suburban, rural, or peri-urban classifications determine density and land use.
Climatic and Environmental Conditions: Affect agriculture, housing design, and migration.
Access to Natural Resources: Availability of water, land, and energy shapes economic activities and settlement patterns.
Understanding the environmental context of demographic variables ensures that development plans are sustainable and resilient to climate change.
9. Political and Legal Variables
These variables capture the political and institutional framework governing populations.
Citizenship or Nationality: Defines an individual’s legal belonging and rights within a country.
Voting Eligibility: Determines participation in democratic processes.
Legal Status of Migrants: Distinguishes between citizens, refugees, asylum seekers, and undocumented persons, affecting access to services and protection.
Political variables influence population inclusion, migration policies, and rights-based planning.
Demographic variables collectively offer a comprehensive picture of human populations — their characteristics, behaviour, and evolution. They are not isolated indicators but interdependent elements shaping the dynamics of growth, distribution, and well-being. In planning and governance, demographic analysis helps determine the need for infrastructure, education, employment, healthcare, and housing. It also assists in anticipating challenges such as ageing populations, youth unemployment, or rapid urbanization.
By studying demographic variables such as age, fertility, migration, education, and income, societies can identify inequalities and design targeted interventions. The integration of demographic data with spatial planning ensures that development is both inclusive and sustainable. In an era of globalization and environmental uncertainty, understanding demographic variables is crucial for building resilient communities and promoting balanced regional development.
References:
United Nations (2022). World Population Prospects.
Weeks, John R. (2015). Population: An Introduction to Concepts and Issues. Cengage Learning.
Government of India (2011 & 2021). Census of India Reports.
National Family Health Survey (NFHS-5), Ministry of Health and Family Welfare (2020).
Todaro, Michael P. & Smith, Stephen C. (2020). Economic Development. Pearson Education.
United Nations Development Programme (UNDP). Human Development Reports.
Chandna, R.C. (2021). Geography of Population: Concepts, Determinants and Patterns. Kalyani Publishers.
Sharma, P.R. (2018). Population and Settlement Geography. Rawat Publications.
Urbanization has blurred the traditional divide between rural and urban areas. This change has created transitional spaces that challenge the old split. This article looks at urban centers, the rural-urban continuum, and their connections. It argues that today’s settlements exist on a spectrum rather than as isolated areas. They have mixed land uses, changes in job types, and shared infrastructure.
Using examples from India, such as Bhopal and Gurugram, the article shows how peri-urban growth reflects this continuum. It stresses the importance of understanding and planning for these mixed areas to achieve balanced and sustainable regional development.
2. Introduction
Urbanization has become one of the most important trends of the 21st century. The spread of cities, changes in villages, and the development of transitional spaces have blurred the traditional lines between rural and urban. In the past, settlements were seen in a straightforward rural-urban dichotomy, with villages representing agriculture and simplicity and cities symbolizing industry and modern life. However, development, migration, and technology have made this binary less useful for describing the complex relationships that exist today.
In the study of human settlements and regional planning, three related concepts stand out: Urban Centers,Rural-Urban Dichotomy, and the Rural-Urban Continuum. Urban centers act as the main areas of economic and administrative activity, while the continuum shows the smooth gradation connecting rural and urban regions. This article will explore these ideas in depth, considering their evolution, connections, and effects on urban and regional planning in India and elsewhere.
3. Understanding Urban Centers
An urban center is a defined area marked by a high population density, a concentration of economic activities, and urban infrastructure like roads, public services, and buildings. Urban centers act as main points for trade, governance, and culture. They are more than just settlements; they drive growth and attract people and investment from surrounding areas.
3.1Types of Urban Centers
Urban centers can be divided into categories based on size, function, and influence:
3.1.1 Metropolitan Cities:
Large cities with populations over one million, such as Delhi, Mumbai, and Bengaluru. These cities serve as economic and cultural hubs on a national or regional level.
3.1.2 Medium and Small Towns:
Places like Bhopal, Indore, or Jabalpur that serve regional roles and provide essential services to nearby rural communities.
3.1.3 Satellite Towns and Suburban Centers:
Smaller towns or urban areas close to big cities (e.g., Gurugram near Delhi, Navi Mumbai near Mumbai), developed to reduce pressure on metropolitan cores.
3.2 Functions of Urban Centers
Urban centers have many roles: administrative (capitals and municipal centers), commercial (markets and trade hubs), industrial (manufacturing areas), cultural (educational and heritage sites), and service-oriented (healthcare, finance, information technology). They function as Central Places, a concept introduced by Walter Christaller in his Central Place Theory (1933), where settlements are arranged in a hierarchy to supply goods and services to surrounding regions.
3.3 Hierarchy and Influence
Urban centers exist in a hierarchical network: small towns serve local populations, while large metropolitan areas impact entire states or even countries. For instance, Bhopal serves as the administrative and service center for central India, providing jobs, education, and healthcare to people beyond its borders.
However, the growth of urban centers also leads to challenges like overcrowding, poor infrastructure, pollution, and inequality. These problems emphasize the need for a broader view, which includes both the city and its surrounding area. This transition is addressed by the rural-urban continuum.
4. The Rural-Urban Dichotomy
The rural-urban dichotomy is a classic approach that separates human settlements into two distinct categories: rural and urban. This classification depends on differences in occupation, lifestyle, population density, and infrastructure.
4.1Basis of Dichotomy
4.1.1 Economic:
Rural areas mainly rely on agriculture and related activities.
Urban areas focus on industry, services, and the tertiary sector.
4.1.2 Social:
Rural societies are usually homogeneous, community-focused, and traditional.
Urban societies are diverse, individualistic, and modern.
4.1.3 Physical:
Rural settlements show scattered patterns and low density.
Urban areas are compact, dense, and well-developed.
4.1.4 Functional:
Villages act as production sites for raw materials.
Cities serve as centers for processing, distribution, and administration.
4.2 Critique of the Dichotomy
While the dichotomy offered clarity in earlier analyses, it has grown increasingly outdated. The rise of technology, transport networks, and communication has connected rural and urban areas like never before. Rural residents often commute to urban centers for jobs, education, and healthcare, while urban residents depend on rural areas for food, land, and leisure.
Moreover, modern development has created hybrid spaces— areas that are neither fully rural nor entirely urban. These transitional spaces challenge the dichotomy and have prompted scholars like Sorokin and Zimmerman (1929) to propose the idea of a Rural-Urban Continuum.
5. The Rural-Urban Continuum
The Rural-Urban Continuum shows a gradual transition from purely rural to purely urban forms rather than a strict separation. It acknowledges that settlements exist on a spectrum, with intermediate stages that merge rural and urban traits.
5.1 Conceptual Background
Put forth by Pitirim Sorokin and Carle Zimmerman, the continuum model highlights that social, economic, and spatial characteristics change progressively. Instead of viewing villages and cities as opposites, they are seen as part of an ongoing urbanization process.
5.2 Indicators of the Continuum
5.2.1 Occupational Transformation:
The movement from agricultural jobs to non-agricultural roles in peri-urban areas.
5.2.2 Infrastructure and Services:
Villages close to cities often have better roads, electricity, and educational facilities similar to urban areas.
5.2.3 Migration and Commuting:
Daily travel for work and education strengthens connections.
5.2.4 Land Use Patterns:
Agricultural land is converted for housing, industries, and institutions on city outskirts.
5.2.5 Cultural and Lifestyle Changes:
Rural populations adopt urban habits, media consumption, and aspirations.
5.3 Spatial and Functional Dynamics
Urban growth creates peri-urban areas—transitional zones between city boundaries and rural regions. These areas show mixed land use, rapid real estate development, and demographic change. They also represent the most dynamic elements of the urban system.
For example, in Bhopal neighborhoods like Kolar, Misrod, and Ayodhya Bypass have changed from agricultural villages to mixed-use residential and commercial suburbs. Similarly, Gurugram near Delhi shows how rural landscapes can develop into modern urban centers in a short time.
Globally, this trend is evident in London’s greenbelt villages, Jakarta’s metropolitan fringe, and Shanghai’s suburban corridors, which all blur the boundaries between rural and urban areas.
5.4 Implications
The continuum approach has significant implications for planning:
It requires integrated rural and urban policies.
Governance must address transitional areas where administrative boundaries are ambiguous.
Infrastructure planning must ensure continuity across the urban-rural gradient.
This perspective focuses on regional systems of settlements, emphasizing connection and mutual dependence rather than isolated urban centers.
6. Relationship Between Urban Centers and the Continuum
Urban centers act as growth poles that drive development in surrounding areas. Through transportation, trade, and information networks, they extend their reach into rural regions, forming a continuous zone of interaction. Meanwhile, rural areas provide labor, raw materials, and land for urban expansion, sustaining city economies.
This mutual dependence creates city regions or metropolitan areas, where various settlements—rural, semi-urban, and urban—operate as an integrated system. For instance, the Delhi Metropolitan Region includes parts of Haryana and Uttar Pradesh, demonstrating how rural areas are drawn into urban spheres of influence.
7. Policy and Planning Implications
In India, understanding the rural-urban continuum is essential for effective regional and urban planning. Government initiatives increasingly recognize this relationship:
Smart Cities Mission (2015): Aims to develop sustainable urban infrastructure while encouraging regional integration.
Shyama Prasad Mukherji Rurban Mission (2016): Focuses on bridging the rural-urban gap by providing urban-level facilities in rural clusters.
AMRUT (Atal Mission for Rejuvenation and Urban Transformation): Aims for infrastructure continuity in medium-sized towns.
Planners must embrace integrated regional planning to ensure balanced growth across rural and urban areas.
This includes:
Creating infrastructure corridors connecting villages and towns.
Managing land use changes sustainably.
Strengthening local governance in peri-urban regions.
Encouraging economic diversity to avoid overreliance on cities.
Such strategies align with the URDPFI Guidelines (2014) in India, which stress a regional approach and functional integration in urban development.
8. Challenges and Future Perspectives
Despite acknowledging the continuum, several challenges remain:
Unplanned Urban Sprawl: Rapid growth without proper infrastructure planning results in congestion and environmental damage.
Service Disparities: Transitional areas often lie outside municipal boundaries, lacking sanitation, waste management, and adequate governance.
Land Conflicts:Converting agricultural land for urban use generates socio-economic tensions.
Future planning must prioritize sustainable urban-rural integration, using technology such as GIS mapping, satellite imagery, and spatial analytics to oversee and manage growth. The concept of Smart Regions—combining rural productivity with urban services—represents the next step in spatial planning.
8. Conclusion
The study of human settlements has shifted from treating villages and cities as separate entities to recognizing the continuous, interconnected spectrum between them. Urban centers serve as growth hubs, but their health relies on resources and labor from surrounding rural areas. The traditional rural-urban dichotomy fails to capture this complexity, while the rural-urban continuum offers a more realistic and dynamic framework.
Understanding this continuum is vital for planners, policymakers, and geographers. It fosters balanced regional development, prevents uncontrolled sprawl, and promotes equitable access to infrastructure and opportunities. Ultimately, the future of human settlement lies not in separating rural and urban spaces but in encouraging their coexistence.
Ministry of Rural Development (MoRD). (2016). Shyama Prasad Mukherji Rurban Mission (SPMRM) Framework for Implementation. Government of India. (https://rurban.gov.in/)
In recent decades, India has witnessed major urban planning initiatives aimed at creating sustainable, livable, and efficient cities. These initiatives often combine modern planning principles, technology, infrastructure development, and environmental considerations. The following case studies highlight contemporary planning approaches and their outcomes.
1. Chandigarh – Planned Modernist City
Background:
Designed by Le Corbusier in the 1950s as the new capital of Punjab and Haryana.
Objective: Provide a modern administrative and residential city post-independence.
Planning Features:
Sectoral Planning: City divided into sectors, each self-sufficient with schools, markets, and parks.
Green Spaces: Extensive use of parks, gardens, and tree-lined avenues.
Zoning: Separation of residential, commercial, and administrative zones.
Wide Roads and Grid System: Facilitates traffic circulation and orderly expansion.
Significance:
Chandigarh remains a model of modernist urban planning, blending functionality, aesthetics, and climate-responsive design.
Inspired subsequent planned cities in India, including Gandhinagar and Navi Mumbai.
2. Navi Mumbai – Satellite Town Planning
Background:
Developed in 1972 by CIDCO to decongest Mumbai and create organized residential and industrial zones.
Planning Features:
Sectoral Planning: Residential, commercial, and industrial sectors with planned civic amenities.
Transport Infrastructure: Wide roads, bridges, and rail connectivity integrated with public transport corridors.
Environmental Planning: Parks, green belts, and sustainable drainage systems.
Significance:
Successfully redirected population growth from Mumbai, providing a model for satellite cities in India.
Demonstrates integration of urban growth with infrastructure planning.
3. Smart Cities Mission – Pan-India Initiative
Background:
Launched by the Government of India in 2015, targeting 100 cities for smart, sustainable development.
Planning Features:
ICT Integration: Smart traffic management, e-governance, and public safety systems.
Infrastructure Upgrades: Water supply, waste management, renewable energy, and road networks.
Citizen-Centric Planning: Focus on livability, mobility, and economic opportunity.
Case Examples:
Pune Smart City: Intelligent traffic signals, GIS-based waste management, and pedestrian-friendly streets.
Ahmedabad Smart City: Integrated public transport system, solar-powered street lighting, and smart governance platforms.
Serves as an example of government-driven, functional city planning.
8. Jamshedpur – Industrial Township Planning
Background:
Developed in the early 20th century by Tata Steel as a model industrial city.
Planning Features:
Zoned Layout: Industrial zones, residential areas for employees, and civic amenities separated.
Green Spaces: Parks, gardens, and tree-lined streets.
Social Infrastructure: Schools, hospitals, and community centers integrated.
Significance:
Early example of planned industrial urban development in India.
Combines industry, residential living, and social infrastructure efficiently.
Key Takeaways from Contemporary Planning Initiatives
Sectoral and Master Planning: Ensures organized land use and infrastructure provision.
Sustainability: Emphasis on green spaces, renewable energy, and eco-friendly design.
Technology Integration: Smart city projects utilize ICT, GIS, and IoT for urban management.
Transit-Oriented Development: Metro and public transport corridors influence urban growth and density.
Public-Private Partnerships: Cities like Lavasa demonstrate private sector involvement in planning.
Conclusion
Contemporary urban planning initiatives in India reflect a blend of historical lessons, modernist principles, and technological innovation. Cities like Chandigarh, Navi Mumbai, New Town Kolkata, Gandhinagar, and Jamshedpur serve as examples of planned development, while Smart Cities and metro-based TOD projects highlight the role of technology, sustainability, and citizen-centric approaches. These initiatives provide a roadmap for the future of Indian urbanism, emphasizing livability, efficiency, and resilience.
The urban form—the physical layout and structure of cities—is directly influenced by technological advancements. Technology affects transportation, communication, construction, utilities, and urban management, reshaping cities over time. From ancient settlements to modern megacities, each technological breakthrough has left a mark on how cities are planned, built, and function.
1. Transportation Technology and Urban Form
Early Transport Innovations
In pre-industrial cities, urban form was compact, walkable, and oriented along rivers or trade routes.
Streets were narrow, and settlements were densely packed around marketplaces and defensive structures.
Railways (19th Century)
Railways enabled suburban expansion, creating railway towns and commuter belts.
Cities developed linear growth patterns along railway lines.
Example: Suburbs around London, Mumbai, and Kolkata expanded due to rail connectivity.
Automobiles (20th Century)
Introduction of cars led to wider streets, arterial roads, and highways.
Encouraged urban sprawl, low-density residential areas, and decentralized city layouts.
Example: Post-WWII American cities (Los Angeles) expanded horizontally due to car dependency.
Public Transit Systems
Metro, bus rapid transit (BRT), and light rail systems reshaped dense urban cores.
Encouraged transit-oriented development (TOD) with mixed-use clusters around stations.
Example: Delhi Metro has influenced high-rise, mixed-use corridors in the National Capital Region.
Impact: Technology in transportation determines city density, shape, and connectivity, influencing both vertical and horizontal urban expansion.
2. Construction Technology and Urban Form
Steel and Reinforced Concrete
Enabled high-rise buildings and skyscrapers, concentrating population and commercial activity vertically.
Cities could grow upwards instead of outwards, changing urban skylines.
Example: Mumbai, New York, and Dubai.
Prefabrication and Modular Construction
Accelerates housing and infrastructure development.
Leads to planned neighborhoods and satellite towns with uniform layouts.
Building Services Technology
Elevators, HVAC systems, and fire safety technology make high-density vertical living feasible.
Urban cores are increasingly mixed-use, with residential, commercial, and office towers.
Impact: Construction technology has allowed cities to accommodate growing populations in limited space, changing the form from low-rise sprawl to vertical density.
3. Communication Technology and Urban Form
Telegraph and Telephone
Early communication technology facilitated administrative and commercial centralization in urban cores.
Internet and Digital Technology
Enabled remote work and e-commerce, reducing the dependency on city centers.
Led to polycentric cities with multiple activity hubs rather than a single central business district (CBD).
Example: IT hubs in Bangalore, Hyderabad, and Pune have developed tech parks and suburban office clusters.
Impact: Communication technology influences location of employment, retail, and services, shaping urban density and functional distribution.
4. Utilities and Infrastructure Technology
Water Supply, Sewage, and Electricity
Advanced utility networks allow high-density residential areas far from natural water sources.
Enable the development of modern planned cities with systematic grids, parks, and open spaces.
Smart City Technologies
Sensors, IoT, and GIS-based urban management optimize traffic flow, waste management, energy use, and public services.
Urban form is increasingly designed around data-driven infrastructure, such as intelligent transport corridors and energy-efficient buildings.
Impact: Utilities and smart infrastructure make cities more efficient, resilient, and sustainable, influencing urban layouts and livability.
5. Industrial Technology and Urban Form
Industrial Revolution
Factories concentrated near transport hubs, shaping urban cores around industrial activity.
Workers’ housing, markets, and civic amenities emerged in proximity to industrial zones.
Example: Manchester (UK), Jamshedpur (India).
Post-Industrial Economy
Shift from manufacturing to service-based and knowledge economies transformed former industrial zones into commercial and residential areas.
Urban form became mixed-use and service-oriented, with adaptive reuse of industrial structures.
Impact: Industrial technology determines zoning, density, and functional distribution in cities.
6. Technology in Urban Planning and Design
GIS, Remote Sensing, and Modeling
Planners use geospatial data to optimize land use, traffic management, and environmental protection.
Influences urban form by identifying growth corridors, flood-prone zones, and optimal residential and commercial layouts.
Computer-Aided Design (CAD) and Simulation
Facilitates efficient urban design, infrastructure planning, and disaster management.
Supports 3D visualization, zoning analysis, and scenario modeling for sustainable city layouts.
Impact: Planning technology allows for scientific and precise urban design, shaping urban form based on data and simulation rather than intuition alone.
7. Summary of Technological Impacts on Urban Form
Technology
Impact on Urban Form
Railways
Linear city expansion, suburban growth
Automobiles
Urban sprawl, arterial roads, decentralized development
Technology has profoundly reshaped urban form, influencing density, layout, functionality, and aesthetics of cities. Transportation and construction technologies determine whether cities grow horizontally or vertically, while communication and planning technologies influence functional distribution and spatial organization. Utilities and smart infrastructure improve livability and sustainability, and industrial technology shapes economic and social zoning. Collectively, these innovations have transformed cities from compact, walkable settlements to complex, multifunctional, and globally connected urban regions.
New towns in India refer to planned urban settlements developed to address issues such as urban congestion, industrial growth, population pressure, and administrative needs. Unlike organically evolved cities, new towns are designed from scratch based on modern planning principles, incorporating zoning, infrastructure, transportation, public amenities, and open spaces.
1. Objectives of Developing New Towns in India
Relieve congestion in existing metropolitan areas (e.g., Mumbai, Kolkata).
Promote industrial and economic growth by creating hubs for manufacturing and services.
Implement modern urban planning principles (grid layouts, sectorization, zoning).
Provide affordable housing and better civic amenities.
Facilitate regional development and balanced population distribution.
2. Planning Principles for New Towns
Zoning: Residential, commercial, industrial, and recreational areas clearly segregated.
Transportation: Wide roads, public transit corridors, and pedestrian-friendly spaces.
Green Spaces: Parks, gardens, and green belts to ensure environmental sustainability.
Utilities and Infrastructure: Provision of water supply, drainage, electricity, and sewage systems.
Self-Containment: New towns often aim to be self-sufficient, providing employment, education, and healthcare locally.
Established: 1972 by CIDCO (City and Industrial Development Corporation)
Purpose: To decongest Mumbai and provide organized residential, commercial, and industrial spaces.
Planning Features:
Sector-based development with wide roads and dedicated residential/commercial zones.
Well-planned public transport, schools, hospitals, and parks.
Industrial zones in Vashi, Panvel, and Turbhe.
Significance: One of India’s largest planned cities, serving as a model for satellite city planning.
B. Chandigarh (Punjab & Haryana)
Established: 1950s, designed by Le Corbusier
Purpose: Capital city for Punjab and Haryana post-independence.
Planning Features:
Sector-based layout, each sector self-sufficient with markets, schools, and parks.
Wide boulevards, green belts, and open spaces integrated with modernist architecture.
Administrative and government sectors distinctly separated from residential zones.
Significance: Iconic example of modernist planning and urban design in India.
C. Durgapur (West Bengal)
Established: 1955, as an industrial town under the Durgapur Development Authority.
Purpose: Promote steel and heavy industries as part of post-independence industrialization.
Planning Features:
Residential, industrial, and civic zones clearly demarcated.
Planned civic amenities, parks, and public utilities.
Significance: Early example of a planned industrial township in eastern India.
D. Bhilai (Chhattisgarh)
Established: 1955, with the Bhilai Steel Plant as the core industrial activity.
Purpose: Industrial hub for steel production and supporting townships.
Planning Features:
Township planned for employees of the steel plant with housing, schools, and recreational facilities.
Separate industrial, residential, and administrative zones.
Significance: One of India’s earliest planned industrial towns integrating industrial growth and urban living.
E. Gandhinagar (Gujarat)
Established: 1960s as the capital of Gujarat.
Purpose: Replace Ahmedabad as the administrative capital with a planned city.
Planning Features:
Sectoral planning with residential, commercial, and administrative areas.
Wide avenues, parks, and water bodies.
Emphasis on green belts and modern civic amenities.
Significance: Example of post-independence administrative planning.
F. Greater Noida (Uttar Pradesh)
Established: 1991 by the Greater Noida Industrial Development Authority.
Purpose: To decongest Delhi and promote industrial and IT development.
Planning Features:
Wide roads, sectoral planning, IT and industrial zones.
Modern infrastructure including universities, sports complexes, and metro connectivity.
Significance: One of India’s fastest developing satellite cities, emphasizing modern urban infrastructure.
G. New Town Kolkata (West Bengal)
Established: 1990s, developed by West Bengal Housing Infrastructure Development Corporation (WBHIDCO).
Purpose: Modern IT, residential, and commercial hub on the outskirts of Kolkata.
Planning Features:
Sector-based planning, with IT parks, residential zones, and civic amenities.
Emphasis on sustainable urban design and public transportation.
Significance: Example of a planned knowledge and business city in India.
4. Characteristics Common to Indian New Towns
Master Planning: Detailed layouts prepared by town planning authorities.
Zoning: Separation of land uses for residential, commercial, industrial, and recreational purposes.
Infrastructure and Utilities: Proper provision of water supply, drainage, electricity, and sewage systems.
Environmental Consideration: Parks, lakes, and green belts integrated for ecological balance.
Transport Connectivity: Roads, railways, and public transport networks incorporated into design.
Self-Containment: Inclusion of schools, hospitals, markets, and recreational facilities within sectors or zones.
5. Significance of New Towns in India
Helped reduce pressure on mega-cities like Mumbai, Delhi, and Kolkata.
Facilitated industrialization and economic growth through planned industrial zones.
Introduced modern urban planning principles in India, serving as models for future cities.
Promoted organized, sustainable, and livable urban environments.
Conclusion
New towns in India represent the country’s commitment to planned urban growth, balancing industrial, residential, and administrative needs. Cities like Navi Mumbai, Chandigarh, Durgapur, Bhilai, Gandhinagar, Greater Noida, and New Town Kolkata showcase the application of modern planning principles, including sectoral layouts, green belts, zoning, and civic amenities. These towns not only alleviate pressures on existing urban centers but also provide a template for sustainable urban development in India.
The Greek civilization stands as one of the most influential in world history. Emerging around 2000 BCE and flourishing between 800 BCE and 146 BCE, ancient Greece laid the intellectual, political, and cultural foundations of what we now call Western civilization. The Greeks made remarkable contributions to philosophy, democracy, art, architecture, literature, and science, shaping the way humanity thinks, governs, and expresses itself. Their legacy continues to inspire modern political systems, education, and cultural ideals.
Ancient Greece was not a single unified empire but a collection of city-states (poleis) scattered across the mountainous Greek mainland, the Aegean islands, and the western coast of Asia Minor (modern-day Turkey). The rugged terrain and numerous islands encouraged the development of independent communities, each with its own government, traditions, and identity. The Aegean Sea served as a natural highway, connecting Greece with Egypt, Mesopotamia, and the wider Mediterranean world, fostering trade and cultural exchange.
The earliest Greek civilizations were the Minoan Civilization (c. 2700–1450 BCE) on the island of Crete and the Mycenaean Civilization (c. 1600–1100 BCE) on the mainland. The Minoans, known for their palace at Knossos, were skilled traders and seafarers. The Mycenaeans, on the other hand, were warriors who built fortified cities like Mycenae and Tiryns. The legendary Trojan War, immortalized by Homer’s epics — The Iliad and The Odyssey — reflects this heroic age.
After the decline of the Mycenaeans, Greece entered a period known as the Dark Age (1100–800 BCE), marked by reduced trade and population decline. However, this period also laid the groundwork for cultural revival and the rise of the Classical Greek civilization.
Rise of the City-States (Polis)
By the 8th century BCE, Greek society was organized into city-states (poleis) such as Athens, Sparta, Corinth, and Thebes. Each polis was politically independent, with its own government, army, and laws, yet shared a common language, religion, and cultural identity. The Greeks referred to themselves as Hellenes and their land as Hellas.
Two of the most famous city-states, Athens and Sparta, represented contrasting political and social systems.
Athens developed the world’s first democracy, where citizens (free men) participated directly in decision-making through assemblies.
Sparta, by contrast, was a military oligarchy, emphasizing discipline, strength, and loyalty to the state.
Despite their differences, both city-states contributed significantly to Greek political and cultural achievements.
Political and Social Organization
Greek civilization experimented with various forms of governance — monarchy, oligarchy, tyranny, and democracy. Athens’ democratic system under leaders like Solon, Cleisthenes, and Pericles became a model for later societies. Citizens debated and voted on laws, emphasizing civic responsibility and public participation — the foundation of modern democratic ideals.
Society in Greece was divided into citizens, metics (foreign residents), and slaves. Women generally had limited rights, though in Sparta they enjoyed more freedom and responsibility compared to other city-states. Education and intellectual growth were highly valued, especially in Athens, where philosophy, science, and the arts flourished.
Religion and Mythology
Religion played a central role in Greek life, shaping their values, festivals, and art. The Greeks were polytheistic, believing in a pantheon of gods and goddesses who lived on Mount Olympus. The most important deities included Zeus (king of the gods), Hera, Poseidon, Athena, Apollo, Artemis, Aphrodite, and Ares. Each city-state often honored a patron deity — for example, Athens was dedicated to Athena, the goddess of wisdom.
Greek mythology explained natural phenomena, human behavior, and the origins of the world through stories filled with gods, heroes, and moral lessons. Myths such as those of Hercules, Perseus, Theseus, and Odysseus continue to captivate audiences today and influenced Western literature and art.
Philosophy and Intellectual Contributions
One of Greece’s greatest achievements was its intellectual revolution. Greek philosophers sought rational explanations for the world, moving away from mythological thinking.
Socrates emphasized ethics and the pursuit of truth through questioning (Socratic method).
Plato, his student, founded the Academy and explored ideas of justice, politics, and metaphysics in works like The Republic.
Aristotle, Plato’s student, founded the Lyceum and made foundational contributions to logic, biology, ethics, and politics.
These thinkers laid the foundations of Western philosophy and science, influencing medieval scholars and the Renaissance.
The Greeks also advanced mathematics (Pythagoras, Euclid), medicine (Hippocrates), and astronomy. They sought to understand the natural world through observation and reasoning — the earliest form of scientific inquiry.
Art, Architecture, and Literature
Greek art and architecture reflected balance, harmony, and proportion — ideals that became central to Western aesthetics.
In architecture, the Doric, Ionic, and Corinthian styles defined temples such as the Parthenon on the Acropolis of Athens.
Sculpture achieved naturalism and beauty, depicting the human body with perfect proportion and movement — as seen in works like Discobolus (the Discus Thrower) and the Venus de Milo.
Greek literature also flourished. The epics of Homer, the tragedies of Aeschylus, Sophocles, and Euripides, and the comedies of Aristophanes explored themes of heroism, fate, morality, and politics. Greek theater, performed in open-air amphitheaters, was both a form of entertainment and a means of public reflection on social and ethical issues.
The Hellenic and Hellenistic Periods
The Classical Period (5th–4th centuries BCE) was Greece’s golden age, marked by the leadership of Pericles in Athens, the construction of the Parthenon, and the flourishing of art, philosophy, and democracy. However, constant warfare, such as the Peloponnesian War (431–404 BCE) between Athens and Sparta, weakened the Greek states.
In the 4th century BCE, Alexander the Great of Macedon united Greece and created one of the largest empires in history, stretching from Greece to Egypt and India. His conquests spread Greek language, art, and ideas across Asia and the Mediterranean, beginning the Hellenistic Period (323–146 BCE). This era blended Greek and Eastern cultures, producing advancements in science, art, and architecture — seen in cities like Alexandria.
Legacy and Influence
The legacy of Greek civilization is profound and enduring. The Greeks introduced ideas that remain central to modern thought and governance:
Democracy and citizenship in political life.
Rational philosophy and scientific inquiry.
Classical art and architecture emphasizing beauty, symmetry, and proportion.
Literary forms such as epic poetry, drama, and comedy.
Olympic Games, celebrating physical excellence and unity.
Greek thought profoundly influenced Roman civilization, which adopted and spread Greek culture throughout Europe. During the Renaissance, Greek ideas about humanism, reason, and beauty were rediscovered and became the foundation of modern Western civilization.
Conclusion
The Greek civilization remains a cornerstone of human achievement — a culture that elevated reason, beauty, and civic responsibility to ideals still admired today. Through their innovations in politics, philosophy, art, and science, the Greeks sought to understand both the world and humanity’s place within it. From the democratic debates of Athens to the philosophical inquiries of Aristotle, their spirit of inquiry and creativity continues to guide the modern world.
In truth, the story of Greece is the story of civilization itself — the birth of freedom, thought, and the enduring pursuit of knowledge and excellence.
The development of civilization marks one of the most significant transformations in human history. From small groups of hunter-gatherers to large, organized societies with cities, writing systems, and complex governance, the journey of civilization is a story of adaptation, innovation, and cultural evolution. The earliest civilizations emerged around fertile river valleys, where favorable geographical and climatic conditions supported agriculture, trade, and social organization. Understanding these early civilizations from a global perspective reveals not only the shared features of human progress but also the regional diversity that shaped the world’s cultural heritage.
A civilization is generally defined as an advanced stage of human social and cultural development characterized by urbanization, surplus food production, organized governance, social hierarchy, technological advancement, and the development of writing and art. The word “civilization” originates from the Latin term civitas, meaning “city,” reflecting the central role of urban settlements in civilizational growth. The emergence of civilization was made possible through the Neolithic Revolution (around 10,000 BCE), when humans shifted from nomadic lifestyles to settled agricultural communities. This transformation laid the foundation for surplus production, population growth, and specialized labor.
Global Development of Early Civilizations
Civilizations arose independently in various parts of the world between 3500 BCE and 1500 BCE. Despite being separated by vast distances, these early centers shared similar developmental patterns — dependence on agriculture, trade networks, and centralized governance. The four major ancient river valley civilizations are:
Mesopotamian Civilization (Tigris and Euphrates Rivers, Iraq)
Egyptian Civilization (Nile River, Egypt)
Indus Valley Civilization (Indus River, India–Pakistan region)
Chinese Civilization (Yellow River or Huang He, China)
Each of these civilizations developed unique political, social, and technological systems but also exhibited interconnections through trade and cultural diffusion.
Mesopotamian Civilization
Mesopotamia, often called the “Cradle of Civilization,” emerged between the Tigris and Euphrates Rivers around 3500 BCE. The fertile plains of this region (modern-day Iraq) allowed for surplus agricultural production, which supported the growth of cities like Uruk, Ur, and Babylon. Mesopotamians invented the world’s first writing system — cuneiform — used for record-keeping and administration. They also made advances in mathematics, astronomy, and architecture, building monumental ziggurats and developing early forms of law, such as the Code of Hammurabi. Mesopotamia’s city-states laid the foundation for governance, religion, and trade in the ancient world.
Egyptian Civilization
Developing along the Nile River around 3100 BCE, the Egyptian civilization thrived due to the river’s predictable flooding, which enriched the soil and supported stable agriculture. The Nile served as a natural highway for communication and trade, uniting Upper and Lower Egypt under the first pharaoh, Narmer (Menes). Egyptian society was highly organized, with a powerful centralized government led by divine kings. The Egyptians made remarkable achievements in engineering, medicine, art, and writing, particularly through the construction of the pyramids and the development of hieroglyphic script. Their religious beliefs in the afterlife shaped monumental architecture and artistic expression.
Indus Valley Civilization
The Indus Valley Civilization (c. 2600–1900 BCE), also known as the Harappan Civilization, developed along the Indus River and its tributaries in modern-day India and Pakistan. It was among the most advanced urban cultures of its time, with well-planned cities like Harappa and Mohenjo-Daro featuring grid layouts, drainage systems, and standardized bricks. The Harappans engaged in extensive trade with Mesopotamia and produced high-quality crafts, pottery, and jewelry. Although their script remains undeciphered, archaeological evidence suggests a society with social equality, organized governance, and emphasis on sanitation and urban planning — an early model of sustainable development.
Chinese Civilization
In East Asia, the Yellow River (Huang He) Valley saw the rise of Chinese civilization around 2000 BCE. The fertile loess plains supported agriculture, primarily millet and later rice cultivation. Early Chinese dynasties such as the Xia, Shang, and Zhou laid the groundwork for China’s cultural and political traditions. The Chinese developed oracle bone script, the earliest known form of Chinese writing, and made advancements in bronze casting, silk production, and military organization. The philosophical systems of Confucianism and Daoism, which evolved later, were deeply influenced by the early societal and natural relationships established in this riverine culture.
Other River-Based and Parallel Civilizations
Beyond these four, other civilizations developed independently around the world, often along rivers or fertile regions. The Mesoamerican civilizations (Olmec, Maya, Aztec) flourished in Central America, while the Andean civilizations (Inca) developed in South America. In Africa, the Nok and Kushite cultures rose, and in Europe, the Minoans and Mycenaeans established early complex societies. These regions, though geographically distant, demonstrate that human societies universally sought fertile land, stable food sources, and trade routes as foundations for cultural growth.
Significance and Legacy
River valley civilizations not only shaped their immediate regions but also influenced global human development. They introduced systems of governance, law, trade, writing, and art that became the bedrock of later empires and modern societies. Their innovations in irrigation, urban planning, and metallurgy transformed human capacity to manipulate the environment. Moreover, the cultural and technological exchanges among these civilizations laid the groundwork for globalization in the ancient world.
Conclusion
The development of civilization from a global perspective highlights humanity’s shared journey toward progress, adaptation, and cultural expression. River valley civilizations represent the earliest experiments in organized human life, where environmental advantages nurtured complex societies. Though they eventually declined due to natural and social factors, their legacies endure — in language, architecture, governance, and philosophy. The story of these civilizations reminds us that human advancement is deeply rooted in our relationship with nature, cooperation, and the quest for knowledge — a foundation upon which modern civilization continues to build.
Human civilization has always been closely associated with cities. Cities are not just physical spaces; they are reflections of culture, economy, technology, governance, and values of the societies that created them. The study of historical cities is essential in understanding how urban forms evolved, what principles guided their planning, and how those principles can still inform modern planning practice.
Historical cities are settlements that emerged in ancient or medieval times, often as centers of administration, trade, culture, or religion. Their planning reflects both functional needs (defense, commerce, water supply) and symbolic meanings (religion, cosmology, social hierarchy). From the Indus Valley cities of Harappa and Mohenjo-Daro to medieval European towns, Islamic cities, and ancient Chinese capitals, each provides insights into planning traditions.
2. Key Historical Examples and Principles
a) Indus Valley Civilization (Harappa and Mohenjo-Daro, c. 2500 BCE)
Grid Iron Pattern: Streets were laid out in a north-south, east-west orientation.
Standardized Housing: Uniformity in residential blocks, with variation only in size.
Water Management: Advanced drainage systems, wells, and bathing areas.
Public Spaces: Granaries, citadels, and assembly halls served as community hubs.
Principle:Order, hygiene, and functionality.
b) Ancient Egyptian Cities
Oriented along the Nile River, which provided water and transport.
Temples and pyramids dominated the urban landscape, symbolizing religion and power.
Settlements developed near fertile floodplains, with planned layouts for workers’ villages (e.g., Deir el-Medina).
Principle:Religious centrality and alignment with natural geography.
c) Greek Cities (Athens, Miletus, c. 5th century BCE)
Hippodamian Plan: Introduced by Hippodamus of Miletus, featuring a rectangular grid.
Agora: Central public square for markets, politics, and social life.
Acropolis: Elevated sacred area with temples.
Emphasis on civic life, philosophy, and democracy.
Principle:Balance of civic, sacred, and residential functions.
d) Roman Cities
Expanded grid plan with Cardo (north-south) and Decumanus (east-west) as main streets.
Forum: Administrative and commercial hub.
Infrastructure: Aqueducts, amphitheaters, baths, roads, and fortifications.
New towns were often established as military colonies.
Principle:Utility, connectivity, and grandeur.
e) Medieval European Cities
Organic Growth: Streets were often winding, adapted to terrain and defense.
Central Cathedral and Market Square: Spiritual and economic life revolved around them.
Fortifications: City walls and gates provided protection.
Guild-based neighborhoods: Craftsmen and traders settled in clusters.
Principle:Defense, community identity, and centrality of religion.
f) Islamic Cities (Baghdad, Cairo, Delhi, c. 8th–16th centuries)
Central Mosque and Bazaar (Suq): Spiritual and commercial focus.
Citadel or Palace: Political authority emphasized.
Narrow, Shaded Streets: Adapted to hot climates.
Residential Privacy: Houses oriented inward with courtyards.
Principle:Integration of religion, commerce, and environment.
g) Chinese Cities (Chang’an, Beijing)
Based on geomancy (Feng Shui) and cardinal orientation.
Central Axis: Palaces, administrative centers, and ceremonial spaces aligned on it.
Walled cities with gates at cardinal points.
Hierarchical zoning: Emperor’s palace at center, then officials, merchants, and workers.
Principle:Cosmic order, hierarchy, and symbolism.
h) Indian Medieval Cities (Varanasi, Jaipur, Shahjahanabad)
Varanasi: Organic growth along the Ganges, religious ghats dominating spatial form.
Jaipur (1727): Planned on gridiron pattern with wide streets, bazaars, and public squares, influenced by Vastu Shastra.
Shahjahanabad (Old Delhi, 17th century): Red Fort, Jama Masjid, Chandni Chowk bazaar at the heart; enclosed by walls and gates.
Principle:Blend of cosmology, commerce, and defense.
3. General Planning Principles of Historical Cities
Across civilizations, certain common principles emerge:
Centrality of Power and Religion – Palaces, temples, mosques, or cathedrals were focal points.
Geometry and Order – Grid patterns in Indus Valley, Greek, Roman, and Jaipur cities.
Defense and Security – Walls, citadels, moats in medieval Europe and Islamic cities.
Adaptation to Climate and Geography – Courtyards in hot climates, shaded narrow lanes, riverside settlements.
Integration of Public Spaces – Agoras, forums, bazaars, ghats as centers of community life.
Hierarchy and Zoning – Clear division of spaces for rulers, priests, merchants, workers.
Infrastructure Focus – Drainage, water supply, roads, markets, storage facilities.
Symbolism and Identity – Cities often reflected cosmology, religion, or imperial power.
4. Lessons for Modern Planning
Historical cities remind us that planning must go beyond physical design. They show the importance of:
Human-scale design (walkability, community interaction).
Integration of culture and identity into urban spaces.
Environmental adaptation (use of natural resources sustainably).
Resilient infrastructure (water systems, defenses, transport networks).
Inclusive public spaces where social, cultural, and economic life thrives.
Conclusion
Historical cities are living archives of human ingenuity, resilience, and cultural expression. Their planning was guided by principles of functionality, symbolism, and adaptability. By studying Harappa’s drainage, Athens’ civic spaces, Rome’s infrastructure, Baghdad’s bazaars, or Jaipur’s grids, modern planners can learn how to design cities that are sustainable, inclusive, and culturally rooted. While times have changed, the underlying planning principles of historical cities remain deeply relevant to the challenges of today’s urbanization.
Academic life is not merely about memorizing textbooks, attending lectures, or submitting assignments. It is a journey of self-discovery, critical thinking, creativity, and joy in learning. Shashikant Nishant Sharma has beautifully articulated this philosophy through what he calls the “Think, Write, and Dance Principles.” These principles are not rigid rules but flexible guiding ideas that can transform the way scholars, students, and researchers approach their studies and intellectual growth.
1. The Principle of Thinking
At the heart of every academic pursuit lies thinking. Thinking is the raw material of knowledge. It is what turns information into understanding and data into wisdom.
Critical Thinking: Scholars must learn not to accept everything at face value. Questioning assumptions, testing evidence, and looking for alternative perspectives are essential habits.
Creative Thinking: Academic life is not only about analysis but also about imagination. Creativity allows us to connect different fields, generate new ideas, and propose innovative solutions.
Reflective Thinking: Reflection enables students to learn from past mistakes, understand their learning style, and set goals for improvement.
“Thinking is like planting seeds. The more carefully you nurture them, the richer will be the harvest of your academic journey.”
Practical ways to adopt this principle:
Start a “thinking journal” where you write down questions that come to mind during lectures.
Dedicate 15–20 minutes daily to silent reflection on what you studied.
Discuss ideas with peers to expand your intellectual horizons.
2. The Principle of Writing
Writing is the bridge between thought and communication. Without writing, even the best ideas may remain buried in the mind. Shashikant Nishant Sharma emphasizes writing as an essential discipline for academic success.
Clarity of Expression: Writing forces you to organize your ideas logically. It sharpens your understanding.
Habit Formation: Regular writing—whether essays, research papers, or even short reflections—trains your mind to think systematically.
Knowledge Sharing: Writing is not just personal; it is also a contribution to the wider academic community. When you write, you leave behind knowledge for others to build upon.
Practical ways to adopt this principle:
Keep a daily or weekly academic diary summarizing what you learned.
Practice writing small essays on topics beyond the syllabus.
Publish or share your work (blogs, class magazines, research forums).
“What is not written is often forgotten. Writing makes your thoughts immortal.”
3. The Principle of Dancing
The most unique and refreshing part of Sharma’s framework is the idea of dancing. At first, it may seem symbolic, but it carries profound meaning. “Dance” here refers to the joy of learning, the rhythm of effort, and the celebration of creativity.
Balance and Flow: Just as dance requires balance and rhythm, so does academic life. There must be a harmony between study, rest, and reflection.
Joyful Engagement: Scholars should not treat studies as a burden. Learning should feel like dancing—an act of joy, expression, and freedom.
Celebrating Progress: Every small achievement—completing a project, mastering a concept, presenting in class—should be celebrated like a dancer celebrating a graceful performance.
Practical ways to adopt this principle:
Take breaks to recharge and enjoy activities beyond academics (music, sports, art).
Celebrate small victories with friends or mentors.
Approach assignments with creativity—add visuals, stories, or metaphors to make them lively.
“Dance reminds us that academic life is not just about reaching goals but enjoying every step of the journey.”
Integrating the Principles: A Scholar’s Lifestyle
The real power of the Think, Write, and Dance Principles lies in their integration. Imagine a daily routine like this:
Morning: Spend time thinking deeply about a problem or concept.
Afternoon: Convert those reflections into written notes, essays, or research drafts.
Evening: Engage in a joyful, creative activity—whether literal dance, music, or a celebration of what you achieved.
This cycle ensures that learning is holistic, sustainable, and fulfilling. It prevents burnout, keeps the mind active, and nurtures the soul.
Why Scholars Should Adopt These Principles
They promote balance between intellectual rigor and personal well-being.
They encourage creativity in academic work, moving beyond rote learning.
They transform study from a duty into a joyful journey.
They align with the modern need for interdisciplinary and innovative approaches.
They build habits that last a lifetime, beyond the classroom and into professional and personal life.
Conclusion
Shashikant Nishant Sharma’s Think, Write, and Dance Principles are more than academic strategies—they are a philosophy of life. They remind scholars that learning is not confined to exams or degrees but is a lifelong rhythm of reflection, expression, and celebration. By thinking deeply, writing clearly, and dancing joyfully, every student can make their academic journey both productive and fulfilling.
“To think is to discover, to write is to preserve, and to dance is to celebrate the beauty of learning.”
Distribute text and visuals evenly across the page.
Example: On one page, write text on the left and place a map/sketch on the right.
(ii) Alignment
Keep text aligned properly (left, center, or justified).
Example: Use left-aligned paragraphs with right-aligned image captions.
(iii) Hierarchy
Use clear headings, subheadings, and bullet points.
Example: Headings in bold/large size, sub-points in smaller font.
(iv) Contrast
Highlight key facts or quotes using boxes, bold text, or different colors.
Example: A quote like “Cities are the engines of growth” inside a colored box.
(v) Repetition
Maintain a consistent style across pages (same font for headings, same bullet style).
Example: Use the same border design or title placement on each page.
(vi) Proximity
Group related content together.
Example: Keep history paragraphs together and tourist attractions in one section instead of scattering.
(vii) White Space
Do not fill the page fully with text—leave margins, gaps, or empty areas.
Example: Write a paragraph in the center with wide borders on all sides.
(viii) Simplicity
Avoid over-decoration. Use neat boxes, underlines, or bullet points.
Example: Draw a simple city skyline outline at the bottom of the page.
(ix) Movement/Flow
Arrange text and visuals so that the reader’s eyes naturally flow across the page.
Example: Write in a “Z-pattern” where the eye moves left to right, then diagonally down.
(x) Unity
All elements should look connected. Use same color pencils for diagrams, same heading style.
Example: If you choose blue for location maps, use the same shade for other illustrations.
4. Page-by-Page Composition Plan
Here’s how you can structure the 5 content pages using the design principles:
Page 2: Location
Heading at top (Hierarchy).
Map of your city (Balance with text).
Box with quick facts (Contrast).
Clean alignment left for text.
Page 3: History
Timeline diagram with arrows (Movement).
Small illustrations (fort, temple, etc.).
Group events into 3 sections (Proximity).
White space around the diagram.
Page 4: Importance of the City
Use two columns (Alignment & Balance).
Left: Economic role (bullets).
Right: Cultural/educational role (short paras).
Repeat icon style for industries, schools, etc. (Repetition).
Page 5: Tourist Attractions
Large heading in creative style (Hierarchy).
Pictures or hand-drawn sketches of attractions.
Use boxes for each place with captions.
Contrast important site names with bold/highlight.
Page 6: Likes & Dislikes (Planner’s Perspective)
Use two boxes side by side: “What I Like” and “What I Dislike.”
Add a quote about sustainable cities.
Suggest improvements in bullet points.
Leave some empty margin (White Space).
5. Cover Letter (Page 1)
Your cover letter should look professional. It must contain:
Title of Assignment (My City from a Planner’s Perspective).
Your Name, Roll Number, Subject/Department.
Date of submission.
A short statement like: “This assignment is submitted as part of the Mini Test Cum Assignment to explore my city from the lens of planning, highlighting its location, history, importance, tourism, and challenges.”
Keep it center-aligned, simple, and neat.
6. Tips for Illustrations & Diagrams
You don’t need to paste printed pictures—simple line diagrams drawn with pencil and colored lightly will be better.
Examples:
Sketch a city map with rivers, roads, and main landmarks.
Draw monuments as outline sketches.
Show traffic problems with arrows and vehicles.
Use bar graphs (population growth, tourists per year).
7. Writing Style
Use clear and simple English (avoid long complicated sentences).
Write in paragraphs and bullet points.
Add quotes or proverbs about cities (e.g., “A developed city is not one where the poor own cars, but one where the rich use public transport.”).
Keep grammar and spelling correct.
8. Evaluation Basis
Your teacher will likely evaluate based on:
Content Quality (coverage of all sections).
Composition Skills (use of layout principles).
Creativity (drawings, diagrams, color use).
Neatness & Presentation (no overwriting, proper alignment).
Personal Reflection (your likes/dislikes with planner’s vision).
9. Word Count & Time Management
Each page should have 300–400 words approx., so overall 1500–1800 words.
Keep time for drawing maps/diagrams (don’t leave it for last minute).
10. Conclusion
This assignment is not only about describing your city but also about experimenting with design and composition. The 10 layout principles will help you learn how to present content in a visually appealing and structured way. If followed properly, your work will look professional, planner-oriented, and creative.
The census is one of the most vital tools in understanding the demographic, social, and economic profile of a country. Conducted periodically, usually every ten years, the census is a complete enumeration of the population, households, and their characteristics. For planners, it provides an indispensable database that informs decision-making across urban, regional, social, economic, and environmental planning. The classification systems, standardized definitions, and structured datasets of a census ensure that the information collected can be used for long-term development strategies, policy formulation, and spatial planning.
Census Classification
Census classification refers to the way population and related attributes are grouped, segmented, and organized to ensure accurate analysis. Some of the major classifications include:
Population Classification
Rural vs. Urban: Based on criteria like population size, density, and occupational structure. In India, for example, a settlement is considered urban if it has at least 5,000 inhabitants, a density of 400 persons per sq. km, and 75% of the male workforce engaged in non-agricultural activities.
Household vs. Institutional Population: Census classifies individuals living in normal households separately from those living in institutions such as hostels, prisons, or ashrams.
Resident Status: Usual residents vs. migrants, classified by place of birth or last residence.
Social Classification
By age, sex, marital status, literacy, education, religion, caste, and language. These classifications highlight the social structure and diversity of a population.
Economic Classification
Work participation, occupation, industry, and employment status. Populations are divided into main workers, marginal workers, and non-workers.
Housing and Amenities Classification
Type of housing (kutcha, pucca, semi-pucca), ownership status, availability of basic amenities like drinking water, electricity, toilets, and access to communication facilities.
Geographical Classification
Data is categorized into various spatial levels such as state, district, sub-district (tehsil/taluka), town, ward, and village. This hierarchical spatial classification ensures planners can use data at different scales.
Key Definitions in Census
Household: A group of persons who normally live together and take their meals from a common kitchen.
Census House: A building or part of a building with a separate main entrance, used for living, shop, or office purposes.
Usual Resident: A person who has stayed in a place for at least six months or intends to stay there for six months or more.
Urban Area: Defined by population size, density, and proportion of non-agricultural workers, or statutory notification (municipality, corporation, cantonment board).
Rural Area: All areas not classified as urban.
Main Worker: A person who works for six months or more in the reference year.
Marginal Worker: A person who works for less than six months in the reference year.
Literacy: A person aged seven years or above who can read and write with understanding in any language.
Such standardized definitions ensure comparability of data across regions and over time.
Use of Census Data for Planners
Census data plays a pivotal role in planning processes at all levels—national, regional, and local. The following are key areas where planners make extensive use of census information:
Urban and Regional Planning
Census data helps in identifying the size, growth rate, and distribution of population in urban and rural areas. This allows planners to prepare master plans, regional plans, and city development plans.
It aids in the classification of settlements, identification of urban sprawl, and the planning of new towns and satellite towns.
Housing and Infrastructure Development
Data on housing stock, household size, and availability of amenities helps in forecasting housing demand. Planners can prioritize provision of water supply, sanitation, electricity, and transport.
Information about slum populations helps in designing urban renewal and slum improvement projects.
Transport and Mobility Planning
Data on workforce participation and place of work-residence helps in transport planning, route optimization, and forecasting traffic demand.
Social Planning
Census data on literacy, education, caste, and religion enables planners to design programs for education, health, and social equity.
Data on age structure helps in planning for schools, universities, and facilities for the elderly population.
Economic and Employment Planning
Workforce participation data allows planners to assess the labor supply for industries, services, and agriculture.
Migration data helps in understanding labor mobility and designing employment programs.
Environmental and Resource Planning
Population density and growth trends help in identifying pressure on land and natural resources. This informs sustainable development policies and conservation efforts.
Policy Formulation and Governance
Census provides a factual basis for resource allocation, political representation, and welfare schemes. For instance, delimitation of constituencies, distribution of funds, and targeted poverty alleviation programs are based on census counts.
Conclusion
The census is not merely a headcount of people; it is a comprehensive socio-economic survey that provides the bedrock for planning. The classifications and definitions embedded in census methodology ensure consistency and reliability of data. For planners, it is both a diagnostic tool and a forecasting instrument—helping to understand past trends, current realities, and future needs. In an era of rapid urbanization, growing inequality, and environmental challenges, census data remains indispensable for evidence-based, sustainable, and inclusive planning.
A life table is a demographic tool that provides a systematic description of mortality, survival, and expectation of life at different ages in a population. It is constructed using age-specific mortality rates and helps to estimate measures like life expectancy, survival probabilities, and death probabilities at each age or age interval. There are two main types: Complete Life Table and Abridged Life Table.
1. Complete Life Table
Definition: A complete life table shows mortality and survival data for every single year of age, starting from birth (age 0) up to the maximum attainable age (often 100+).
Structure: It has entries for each exact age (0, 1, 2, 3 … up to the last age group).
Detail level: Provides fine-grained detail about the probability of death (qₓ), number surviving (lₓ), and life expectancy (eₓ) at each exact age.
Advantage: Useful for very precise demographic and actuarial calculations such as insurance premiums, pension schemes, and health risk assessments.
Limitation: Requires detailed and reliable age-specific mortality data, which may not always be available, especially in developing countries.
Example: If we construct a complete life table for India and at age 25, the table shows:
Out of 100,000 live births (l₀ = 100,000), about l₂₅ = 95,200 survive to exact age 25.
The probability of death between ages 25 and 26 (q₂₅) might be 0.0021 (i.e., 2.1 deaths per 1000).
Life expectancy at age 25 (e₂₅) could be 47.8 years.
2. Abridged Life Table
Definition: An abridged life table groups ages into wider intervals (commonly 5-year intervals such as 0–4, 5–9, 10–14, etc.) instead of providing values for each single year.
Structure: Usually constructed with 5-year or 10-year age intervals, though the first age interval (0–1, 1–4) is often broken into smaller parts due to higher infant mortality.
Detail level: Less detailed than a complete life table but easier to construct and interpret.
Advantage: Requires less detailed data, can be built with smaller population samples or incomplete mortality data. Suitable for census-based or survey-based population studies.
Limitation: Less precise because it averages mortality experience over age intervals.
Example: In an abridged life table for India:
Age group 20–24 may show probability of dying (q₂₀–₂₄) as 0.008 (i.e., 8 deaths per 1000 over 5 years).
Life expectancy at exact age 20 (e₂₀) may be estimated as 51.5 years.
The table skips intermediate ages (21, 22, 23, 24), treating them as part of the group.
3. Key Differences at a Glance
Aspect
Complete Life Table
Abridged Life Table
Age intervals
Single year (0, 1, 2, …)
Multi-year (often 5-year groups)
Detail
Very detailed, precise
Less detailed, approximate
Data requirement
Needs full age-specific mortality data
Can be constructed from limited data
Use
Actuarial science, insurance, medical research
Census analysis, demographic surveys, broad planning
Example output
Probability of death at exact age 25
Probability of death for 20–24 as a group
Conclusion
A complete life table is more precise but data-intensive, best suited for actuarial and insurance purposes.
An abridged life table is more practical for countries or studies with limited demographic data, commonly used in population censuses and health surveys.
Both are crucial tools in demography, each serving different analytical and policy needs.
The conservation of wildlife and biodiversity has become a matter of global concern due to the rapid increase in illegal wildlife trade and species extinction. To address this, the international community established CITES – the Convention on International Trade in Endangered Species of Wild Fauna and Flora. CITES is a legally binding international agreement that aims to ensure that international trade in specimens of wild animals and plants does not threaten their survival.
CITES was adopted on 3 March 1973 in Washington, D.C., and it came into force on 1 July 1975. Today, it has more than 180 member countries (called Parties), including India, which became a Party in 1976. Although CITES is legally binding, it does not replace national laws. Instead, it provides a framework for countries to regulate and monitor international wildlife trade.
Important Aspects of CITES
Objectives The primary objective of CITES is to prevent overexploitation of species through international trade. It ensures that trade in plants and animals is legal, sustainable, and traceable. By regulating trade, CITES protects endangered species from extinction while allowing controlled trade in species that are not under severe threat.
Appendices of CITES CITES classifies species into three appendices based on the degree of protection they need:
Appendix I: Includes species threatened with extinction. International trade in these species is strictly prohibited except for non-commercial purposes such as scientific research. Examples: Tigers, Asiatic lions, elephants, giant pandas, and gorillas.
Appendix II: Includes species not necessarily threatened with extinction but which may become so if trade is not regulated. Trade is allowed but requires export permits and monitoring. Examples: Indian star tortoise, certain orchids, and some reptile species.
Appendix III: Includes species that are protected in at least one country, which has requested other CITES Parties for assistance in controlling trade. Examples: Certain species of turtles and birds listed by specific countries.
Regulation of Trade CITES establishes a system of permits and certificates to regulate trade. Export, import, and re-export of species listed in the appendices are allowed only when accompanied by valid permits issued by the designated national authorities.
National Authorities Each Party designates two key authorities:
Management Authority: Issues permits and ensures implementation.
Scientific Authority: Provides advice on whether trade in a particular species is sustainable. In India, the Directorate of Wildlife Preservation serves as the CITES Management Authority.
Impact on Wildlife Protection CITES has played a crucial role in reducing illegal trade of species such as ivory, rhino horn, and exotic birds. It has also promoted international cooperation in conservation efforts. India, for instance, has banned trade in tiger parts and ivory under CITES obligations.
Challenges Despite its success, CITES faces challenges such as wildlife smuggling, weak enforcement in some countries, lack of awareness, and the growing demand for exotic pets and medicinal plants. Ensuring compliance and strengthening capacity in developing countries remain ongoing tasks.
Conclusion
CITES is a landmark international agreement that plays a pivotal role in conserving biodiversity by regulating the global wildlife trade. Its key aspects—classification of species into appendices, regulation through permits, and cooperation among member countries—make it an essential tool in protecting endangered flora and fauna. However, its success depends on strong national enforcement, global cooperation, and public awareness. In today’s context of rising illegal trade and biodiversity loss, CITES remains one of the most important international frameworks for wildlife conservation.
Conservation of biodiversity requires not only protecting core natural habitats but also creating transitional areas where human activities can coexist with ecological balance. One of the most effective tools for this purpose is the establishment of buffer zones. These zones play a crucial role in minimizing human pressures on sensitive ecosystems and ensuring long-term biodiversity conservation.
Definition of Buffer Zones
A buffer zone is a region that surrounds or lies adjacent to a protected area, such as a national park, wildlife sanctuary, or biosphere reserve. It serves as a transitional area between strictly protected core zones and regions of human settlement or intensive land use. Buffer zones allow limited, regulated human activities while simultaneously protecting the integrity of the core habitat.
According to UNESCO’s Man and the Biosphere (MAB) Programme, biosphere reserves consist of three zones:
Core Zone – Strictly protected natural ecosystem.
Buffer Zone – Surrounds the core zone, permitting research, education, and limited sustainable use.
Transition Zone – Outermost area where communities practice sustainable livelihoods.
Thus, the buffer zone acts as a protective shield for the core biodiversity-rich area.
Importance of Buffer Zones in Protecting Biodiversity
Protection Against Human Pressure Buffer zones reduce the direct impact of human activities such as agriculture, grazing, logging, or settlement on sensitive ecosystems. By serving as a barrier, they minimize disturbances like noise, pollution, and encroachment into core conservation areas.
Habitat Connectivity and Wildlife Corridors Many species require large areas for survival and migration. Buffer zones act as corridors linking fragmented habitats, enabling safe movement of species like elephants, tigers, and migratory birds. This connectivity prevents genetic isolation and supports healthy populations.
Support for Research and Education Scientific research, environmental education, and eco-tourism are permitted in buffer zones. This not only enhances public awareness about conservation but also reduces pressures on the strictly protected core zones. For instance, eco-tourism in buffer areas of Kaziranga National Park in Assam helps in both awareness generation and revenue creation.
Sustainable Livelihoods for Communities Buffer zones allow local communities to carry out regulated activities such as collection of non-timber forest produce, handicraft-making, organic farming, and eco-tourism. This reduces conflict between conservation authorities and local populations, fostering community participation in biodiversity protection.
Mitigation of Human–Wildlife Conflicts Buffer zones act as “safety nets” that prevent direct encounters between wildlife and human settlements. By providing regulated grazing lands, water sources, and fodder, they reduce crop raiding and livestock predation by wild animals.
Pollution Control and Environmental Services Buffer zones often consist of vegetation that absorbs pollutants, prevents soil erosion, and reduces runoff into rivers and lakes. Wetlands and forested buffer areas play an important role in filtering water and maintaining ecological balance.
Climate Change Adaptation Buffer zones enhance ecosystem resilience by allowing species to shift their ranges in response to climate change. They provide additional habitats for species under stress from rising temperatures or changing rainfall patterns.
Examples in India
The Nilgiri Biosphere Reserve has buffer zones where sustainable agriculture and eco-tourism are promoted, reducing pressures on core forests.
The Sundarbans Biosphere Reserve uses buffer zones to regulate fishing and forest produce collection, thereby protecting mangroves and tigers.
Conclusion
Buffer zones are essential components of modern conservation strategies. They act as protective shields for core biodiversity areas, enable habitat connectivity, provide livelihood opportunities, and reduce human–wildlife conflicts. By balancing conservation with sustainable development, buffer zones foster harmony between people and nature. In the long run, strengthening buffer zones is vital to ensure the protection of biodiversity, ecological processes, and the well-being of human communities dependent on natural resources.
Biodiversity, the variety of life on Earth, is fundamental for maintaining ecological balance and providing essential resources for human survival. However, increasing habitat loss, pollution, climate change, and overexploitation have led to alarming rates of biodiversity decline. Conservation efforts are therefore not limited to ecological measures but also require social and economic strategies to ensure community participation, sustainable livelihoods, and long-term success.
Social Strategies for Conserving Biodiversity
Community Participation Active involvement of local communities is crucial for biodiversity conservation. Indigenous people often possess traditional ecological knowledge about sustainable resource use. Initiatives like Joint Forest Management (JFM) in India empower local communities to protect forests while deriving benefits such as fuelwood and non-timber forest produce.
Environmental Education and Awareness Education creates awareness about the importance of biodiversity and the threats it faces. Schools, NGOs, and government campaigns promote conservation values through eco-clubs, biodiversity parks, and awareness drives. Festivals and traditions linked to sacred plants and animals also reinforce conservation ethics.
Traditional Knowledge and Practices Indigenous practices, such as maintaining sacred groves in Meghalaya or protecting sacred species like the Tulsi plant, contribute significantly to conservation. Documenting and integrating this traditional knowledge into modern conservation strategies ensures sustainability.
Legislation and Policy Support Strong legal frameworks support biodiversity conservation. In India, the Wildlife Protection Act (1972), Biological Diversity Act (2002), and establishment of protected areas (national parks, sanctuaries, biosphere reserves) reflect the social commitment to biodiversity.
Social Incentives and Recognition Recognizing and rewarding communities for their conservation efforts builds social responsibility. The Bishnoi community in Rajasthan is an example where religious and social values have led to strong protection of flora and fauna.
Economic Strategies for Conserving Biodiversity
Sustainable Use of Resources Conservation must go hand in hand with livelihoods. Promoting sustainable forestry, fisheries, and agriculture ensures that natural resources are used without exhausting them. For instance, organic farming reduces chemical use and protects soil biodiversity.
Eco-Tourism Eco-tourism generates income while promoting conservation. Tourists visiting national parks, wildlife sanctuaries, or biosphere reserves provide revenue that supports local communities and park management. The Kaziranga National Park in Assam is a successful example where eco-tourism supports both conservation and local economies.
Payment for Ecosystem Services (PES) Communities protecting forests and watersheds can be compensated for the ecological benefits they provide, such as carbon sequestration, clean water, and soil conservation. This economic incentive motivates conservation at the grassroots level.
Alternative Livelihoods To reduce pressure on forests and wildlife, alternative income sources such as handicrafts, bee-keeping, and medicinal plant cultivation are encouraged. This reduces dependence on unsustainable hunting, logging, or grazing.
Conservation Funding and International Support Financial mechanisms such as the Global Environment Facility (GEF), biodiversity funds, and carbon credits provide monetary support for conservation projects. Corporate Social Responsibility (CSR) initiatives also channel funds for biodiversity-friendly projects.
Market-Based Approaches Promoting biodiversity-friendly products through certification schemes such as organic labels or Fair-Trade certification encourages consumers to support conservation with their purchasing power.
Conclusion
The conservation of biodiversity cannot succeed through ecological measures alone—it requires strong social strategies such as community participation, education, and traditional practices, as well as economic strategies like sustainable resource use, eco-tourism, alternative livelihoods, and conservation funding. Together, these approaches align human welfare with environmental protection, ensuring that biodiversity conservation becomes both a social responsibility and an economic opportunity. By combining cultural values with economic incentives, societies can protect biodiversity while fostering sustainable development.
The term biosphere reserve refers to a protected area recognized under UNESCO’s Man and the Biosphere (MAB) Programme, which began in 1971. Biosphere reserves aim to conserve biodiversity, promote sustainable development, and support scientific research and education. They are special regions that represent unique ecosystems of global significance, where human activity and nature coexist in balance. India has established several biosphere reserves such as Nilgiri, Sundarbans, Nanda Devi, and Gulf of Mannar, many of which are also part of the UNESCO World Network of Biosphere Reserves.
The main characteristics of biosphere reserves can be understood under the following headings:
1. Conservation of Biodiversity
The foremost characteristic of biosphere reserves is the protection of biological diversity. They are designed to conserve:
Genetic diversity: safeguarding varieties of crops, medicinal plants, and animal breeds.
Species diversity: protecting endangered, endemic, and keystone species.
Ecosystem diversity: conserving forests, wetlands, mountains, coastal areas, and grasslands. For example, the Sundarbans Biosphere Reserve conserves the unique mangrove ecosystem and species like the Royal Bengal Tiger.
2. Zonation System
A distinctive feature of biosphere reserves is their division into three zones for different levels of protection and use:
Core Zone: A strictly protected area where human activity is not allowed. It conserves ecosystems and species in their natural state.
Buffer Zone: Surrounds the core zone. Limited human activities like research, education, and sustainable resource use are permitted.
Transition Zone: The outermost zone where communities live and practice sustainable agriculture, forestry, and eco-friendly development. This zonation system balances conservation with human needs, making biosphere reserves unique.
3. Sustainable Development
Unlike national parks and sanctuaries, biosphere reserves are not only about protection but also about promoting sustainable livelihoods for local people. Activities such as organic farming, eco-tourism, and traditional resource use are encouraged in the transition zones. This ensures that conservation efforts benefit both nature and communities.
4. Research and Monitoring
Biosphere reserves serve as “living laboratories” for ecological and social research. Scientists study ecosystem functions, climate change impacts, sustainable practices, and human–nature interactions in these areas. Regular monitoring of biodiversity helps in developing better conservation strategies.
5. Education and Awareness
Another characteristic of biosphere reserves is their role in spreading environmental education and awareness. They encourage local participation, community training, and student exposure to biodiversity. This helps people understand the value of conservation and adopt eco-friendly lifestyles.
6. Integration of Culture and Nature
Biosphere reserves acknowledge the close link between cultural traditions and biodiversity. Many reserves protect sacred groves, indigenous practices, and traditional knowledge. For example, the Nanda Devi Biosphere Reserve in Uttarakhand not only conserves Himalayan biodiversity but also protects the cultural heritage of local communities.
7. International Recognition
Many biosphere reserves are part of the UNESCO World Network of Biosphere Reserves, which promotes global cooperation in conservation and sustainable development. This gives international recognition to local conservation efforts and allows sharing of knowledge across countries.
Conclusion
Biosphere reserves are unique protected areas that combine conservation, sustainable development, and scientific research. Their key characteristics include biodiversity protection, zonation into core–buffer–transition areas, promotion of sustainable livelihoods, integration of cultural values, and international cooperation. Unlike conventional protected areas, they aim to strike a balance between nature conservation and human needs. In the context of increasing biodiversity loss and climate change, biosphere reserves play a crucial role in maintaining ecological balance while ensuring that human societies continue to thrive in harmony with nature.
Biodiversity conservation can be carried out through different strategies, broadly categorized into species-based and ecosystem-based approaches. The species-based approach focuses on protecting and managing individual species that are threatened, endangered, or of special ecological, cultural, or economic importance. It emphasizes direct action to prevent the extinction of specific species and to restore their populations to sustainable levels.
Key Features of the Species-Based Approach
Identification of Target Species The first step is to identify species that are endangered, threatened, or vulnerable. For example, the tiger, Asiatic lion, snow leopard, and gharial in India have been recognized as priority species for conservation.
Legal Protection Laws and regulations are framed to protect these species from hunting, poaching, and trade. In India, the Wildlife Protection Act of 1972 provides legal safeguards to species listed under its schedules.
Captive Breeding and Reintroduction Many species are bred in captivity under controlled conditions and later reintroduced into the wild. For instance, the captive breeding program for the gharial has helped revive its population in Indian rivers.
Recovery Programs Special recovery programs are launched to monitor and improve the population status of threatened species. The Project Tiger (1973) and Project Elephant (1992) are examples of species-based initiatives in India.
Awareness and Community Involvement Education and awareness campaigns encourage communities to participate in species conservation. Sacred species like the cow or peepal tree are often protected due to cultural values, reflecting traditional species-based conservation practices.
Advantages of the Species-Based Approach
Focused Protection: Provides targeted conservation measures to prevent extinction of critically endangered species.
Flagship and Keystone Species: Protecting iconic species like tigers or elephants indirectly conserves their habitats and many associated species.
Public Support: Charismatic species attract public attention and funding, making conservation campaigns more effective.
Scientific Knowledge: Provides detailed information about the biology, ecology, and behavior of species, useful for long-term management.
Disadvantages of the Species-Based Approach
Narrow Focus This approach emphasizes a few selected species, often charismatic or economically valuable, while ignoring less attractive but ecologically vital species such as amphibians, reptiles, or insects.
Neglect of Ecosystems Focusing only on individual species may overlook the broader ecosystem and habitat that sustain them. Without habitat protection, long-term conservation is unsustainable.
High Cost and Resource Demand Species-based conservation requires intensive monitoring, breeding, and management, which is expensive and resource-intensive. Limited funds may restrict efforts to a few species, leaving many others unprotected.
Risk of Failure in Captive Breeding Captive breeding programs may face challenges such as inbreeding, loss of natural behavior, and failure of reintroduced species to survive in the wild.
Human–Wildlife Conflicts Focusing on large species like elephants or tigers sometimes leads to conflicts with local communities, as these animals may damage crops, livestock, or even cause human casualties.
Short-Term Approach Species-based measures may temporarily improve numbers, but without addressing underlying causes like habitat destruction, climate change, or pollution, extinction risks remain.
Conclusion
The species-based approach of conserving biodiversity plays an important role in preventing the extinction of threatened species and in raising awareness about conservation. Programs like Project Tiger and captive breeding initiatives have achieved notable successes. However, this approach has limitations because it often neglects ecosystems as a whole and may be expensive and selective. For sustainable biodiversity conservation, species-based strategies must be integrated with ecosystem-based approaches that protect habitats and ecological processes, ensuring the survival of all life forms, not just a few iconic species.
Extinction is the permanent disappearance of a species from Earth. It is a natural process that has occurred throughout geological history, as seen in the extinction of dinosaurs about 65 million years ago. However, in the present age, human activities have accelerated extinction rates to alarming levels, far exceeding the natural background rate. The loss of species threatens not only biodiversity but also the ecological balance and resources essential for human survival. The major causes of extinction can be grouped into natural and anthropogenic factors.
1. Habitat Loss and Fragmentation
The most significant cause of species extinction is the destruction of natural habitats. Expanding agriculture, deforestation, mining, urbanization, and infrastructure projects reduce the living space for wildlife. Habitat fragmentation isolates populations, making them more vulnerable to genetic decline and inbreeding. For instance, the fragmentation of tiger habitats in India has led to declining populations and increased human–wildlife conflicts.
2. Overexploitation
Overhunting, overfishing, and overharvesting of plants and animals for food, medicine, timber, and trade have driven many species to extinction. The dodo bird of Mauritius was hunted to extinction in the 17th century. Similarly, excessive hunting of passenger pigeons in North America wiped out the species. In India, species like the Indian bustard and pangolin are critically endangered due to hunting and trade.
3. Pollution
Pollution of air, water, and soil has severely impacted species survival.
Industrial effluents and sewage degrade aquatic habitats, leading to fish kills and loss of aquatic biodiversity.
Pesticides and chemicals poison ecosystems, affecting birds and insects (e.g., the decline of vultures in India due to diclofenac poisoning).
Plastic pollution in oceans entangles marine species like turtles, dolphins, and seabirds. Pollution not only kills directly but also reduces reproduction and weakens species over time.
4. Climate Change
Global warming and climate change are altering habitats and species distribution. Rising temperatures, melting ice caps, sea-level rise, and shifting rainfall patterns force species to adapt, migrate, or perish. Polar bears are threatened as Arctic ice melts, while coral reefs are bleaching due to ocean warming and acidification. Species with narrow ecological ranges, such as alpine plants, face higher extinction risks as their habitats shrink.
5. Invasive Species
The introduction of non-native species often threatens local biodiversity by outcompeting, preying upon, or spreading diseases among native species. For example, the brown tree snake introduced to Guam caused the extinction of several bird species. In India, invasive weeds like Lantana camara and Eichhornia (water hyacinth) have degraded habitats, pushing native species towards decline.
6. Diseases
Emerging infectious diseases, often linked to human activities and climate change, pose new threats to wildlife. For example, the chytrid fungus has caused the extinction of several amphibian species worldwide. Similarly, rinderpest outbreaks historically wiped out populations of wild ungulates in Africa.
7. Small Population Size and Genetic Factors
Species with small populations face extinction risks due to inbreeding, reduced genetic diversity, and inability to adapt to environmental changes. Such populations are also vulnerable to random events such as natural disasters. The cheetah, for example, has very low genetic diversity, making it highly susceptible to diseases and habitat changes.
Conclusion
The extinction of species is driven by a combination of human-induced and natural factors. Habitat destruction, overexploitation, pollution, climate change, invasive species, diseases, and genetic problems all contribute to biodiversity loss. The rapid rate of extinction in the modern era is largely due to human pressures on ecosystems. Preventing extinction requires global cooperation in habitat conservation, pollution control, sustainable use of resources, and protection of endangered species. Conserving species is not only an ethical responsibility but also essential for maintaining ecological balance and ensuring the survival of humankind.
Habitat is the natural environment where a species lives, finds food, reproduces, and interacts with other organisms. The survival of all species depends on the availability and stability of their habitats. However, rapid human activities and environmental changes have led to widespread habitat loss, which is considered the most significant threat to global biodiversity. When natural habitats are destroyed, fragmented, or degraded, species face declining populations, loss of genetic diversity, and even extinction. Below are the major factors causing habitat loss.
1. Deforestation
One of the leading causes of habitat loss is large-scale deforestation. Forests are cleared for timber, fuelwood, agriculture, and urban expansion. This drastically reduces the living space for countless species. For example, the destruction of tropical rainforests in the Amazon and Southeast Asia has endangered species such as orangutans, jaguars, and countless insects. In India, forest clearance in the Western Ghats and Northeast threatens elephants, tigers, and endemic plants.
2. Agricultural Expansion
The growing demand for food has led to the conversion of natural habitats into farmland. Intensive monoculture farming, shifting cultivation, and slash-and-burn practices degrade habitats. Use of chemical fertilizers and pesticides further contaminates ecosystems, reducing biodiversity. Wetlands and grasslands have particularly suffered as they are drained or ploughed for crop cultivation.
3. Urbanization and Infrastructure Development
Rapid urban growth and industrialization result in the destruction of habitats. Expansion of cities, construction of roads, railways, dams, and mining activities fragment natural landscapes. This isolates animal populations, restricts migration routes, and disrupts ecological processes. For instance, highways in forested areas often cut off elephant corridors in central and southern India, leading to human–wildlife conflicts.
4. Overexploitation of Resources
Unsustainable exploitation of forests, fisheries, and minerals depletes natural habitats. Excessive hunting, logging, and overfishing not only remove species but also alter the ecological balance of habitats. Coral reefs, for example, are being degraded by destructive fishing practices and coral mining. Similarly, mangroves are cleared for aquaculture and firewood, destroying habitats for fish, crabs, and migratory birds.
5. Pollution
Pollution is a major factor contributing to habitat degradation and loss.
Air pollution damages forests and freshwater systems through acid rain.
Water pollution from industrial effluents, sewage, and agricultural runoff leads to eutrophication and dead zones in lakes, rivers, and seas.
Soil pollution caused by pesticides and heavy metals reduces soil fertility and affects microorganisms. Plastic pollution in oceans has destroyed habitats of marine species like turtles and seabirds.
6. Climate Change
Global warming and climate change are altering habitats at an unprecedented rate. Rising temperatures, melting glaciers, sea-level rise, and changing rainfall patterns are shifting species ranges and shrinking habitats. Coral reefs are bleaching due to higher sea temperatures. Polar bears are losing their Arctic ice habitats, while Himalayan species are forced to move to higher altitudes.
7. Invasive Species
The introduction of non-native species into ecosystems often threatens native biodiversity. Invasive plants and animals compete for resources, alter habitat conditions, and sometimes prey on native species. For example, the introduction of water hyacinth in Indian lakes has choked freshwater habitats, while invasive predators like cats and rats have devastated island bird populations worldwide.
Conclusion
Habitat loss is primarily driven by human activities such as deforestation, agriculture, urbanization, and pollution, compounded by global challenges like climate change and invasive species. It disrupts ecological processes, reduces biodiversity, and threatens ecosystem services vital to human well-being. Protecting habitats through afforestation, sustainable land use, pollution control, and wildlife corridors is essential to prevent further biodiversity decline. Safeguarding habitats is not only about conserving species but also about ensuring the stability of life-support systems on Earth.
Biodiversity is not only the foundation of ecosystems but also the basis of environmental stability. It plays a critical role in regulating and maintaining the quality of essential natural resources—soil, air, and water. Healthy ecosystems depend on the presence of diverse plants, animals, and microorganisms that interact to perform ecological functions. These processes sustain life on Earth and ensure human well-being.
1. Biodiversity and Soil Quality
Soil is the lifeline of agriculture and terrestrial ecosystems. Its fertility and structure depend heavily on biodiversity.
Decomposition and Nutrient Cycling: Microorganisms such as bacteria, fungi, and actinomycetes decompose organic matter, converting dead plants and animals into humus. This process releases essential nutrients like nitrogen, phosphorus, and potassium back into the soil, making them available for plant growth.
Soil Formation: Lichens and mosses colonize bare rocks and break them down into soil particles, initiating soil formation. Burrowing animals like earthworms and ants further enhance soil aeration and mixing.
Soil Fertility: Nitrogen-fixing bacteria (e.g., Rhizobium in legume roots, Azotobacter in the soil) enrich the soil with nitrogen. Mycorrhizal fungi form associations with plant roots, improving nutrient uptake.
Erosion Control: Plant roots bind soil particles and reduce erosion by water and wind. Vegetative cover in forests and grasslands prevents land degradation.
Thus, biodiversity sustains soil fertility, structure, and productivity.
2. Biodiversity and Air Quality
Air quality is maintained by the balance of gases in the atmosphere, a process strongly influenced by biodiversity.
Photosynthesis and Oxygen Supply: Green plants, algae, and phytoplankton absorb carbon dioxide during photosynthesis and release oxygen, maintaining the oxygen–carbon dioxide balance necessary for life. Forests, often called the “lungs of the Earth,” play a crucial role in regulating air composition.
Carbon Sequestration: Forests, grasslands, and marine ecosystems store large amounts of carbon in biomass and soils, reducing greenhouse gases and mitigating climate change.
Pollutant Absorption: Plants act as natural filters by trapping dust, smoke, and other airborne particles. Certain species also absorb harmful gases like sulfur dioxide and nitrogen oxides.
Odor and Toxin Control: Wetland vegetation and microorganisms can absorb foul-smelling gases and neutralize toxins, improving local air quality.
Without biodiversity, the natural regulation of atmospheric gases and pollutants would collapse, leading to poor air quality and climate imbalance.
3. Biodiversity and Water Quality
Water quality is closely linked to biological processes in aquatic and terrestrial ecosystems.
Filtration and Purification: Wetlands, mangroves, and riparian vegetation act as natural water filters. They trap sediments, absorb nutrients, and filter pollutants before they reach rivers, lakes, or groundwater.
Decomposition of Organic Waste: Aquatic microorganisms and invertebrates break down organic matter, preventing water bodies from becoming polluted and oxygen-depleted.
Nutrient Cycling in Aquatic Systems: Algae, aquatic plants, and microbes recycle nutrients in lakes, rivers, and oceans, maintaining water productivity without excessive nutrient buildup.
Flood Regulation: Forests and wetlands absorb rainwater, recharge groundwater, and reduce runoff, preventing siltation and maintaining water clarity.
Buffer Against Pollution: Mangroves and estuaries act as buffers by absorbing heavy metals and toxic compounds, thereby protecting coastal water quality.
Through these functions, biodiversity ensures safe and clean water for human use and aquatic life.
Conclusion
Biodiversity is central to the maintenance of soil, air, and water quality. Microorganisms enrich soil and recycle nutrients; plants and forests regulate air composition and absorb pollutants; wetlands, aquatic species, and vegetation purify water and prevent pollution. In short, biodiversity acts as nature’s life-support system, maintaining the very resources essential for survival. Protecting biodiversity is therefore not just about saving species—it is about safeguarding the ecological processes that keep soil fertile, air breathable, and water pure for present and future generations.
Biodiversity, or the variety of life on Earth, plays a central role in sustaining human societies. One of its most direct contributions is the provision of food resources, which form the basis of nutrition, health, and livelihoods. From staple crops to fruits, vegetables, livestock, fish, and wild foods, biodiversity ensures both the quantity and quality of human diets. The diversity of plants and animals used for food also provides resilience against environmental stresses, pests, and diseases, making biodiversity indispensable for food security.
1. Plant Biodiversity as a Food Source
Plants form the primary source of human nutrition by supplying carbohydrates, proteins, fats, vitamins, and minerals. Agricultural biodiversity, which includes cultivated crops and their wild relatives, has developed over centuries through domestication and selective breeding.
Staple Crops: Cereals like rice, wheat, maize, millet, and barley form the foundation of global food supplies. India, for example, relies heavily on rice and wheat as staples. The genetic diversity within these crops allows for the development of varieties suited to different climates, soils, and resistance to pests.
Fruits and Vegetables: A wide variety of fruits such as mango, banana, apple, and citrus, along with vegetables like tomato, brinjal, spinach, and okra, provide essential micronutrients that prevent malnutrition and deficiency diseases.
Legumes and Oilseeds: Pulses like lentils, chickpeas, and beans are rich in protein, while oilseeds such as mustard, groundnut, and sunflower provide edible oils.
Wild Plants: Many communities, especially indigenous groups, depend on wild edible plants, tubers, and herbs as supplementary food sources. These not only diversify diets but also serve as survival foods during famine or drought.
Thus, plant biodiversity contributes directly to both staple food production and nutritional diversity.
2. Animal Biodiversity as a Food Source
Animals provide protein-rich foods that are critical for human health. Animal biodiversity encompasses domesticated livestock, poultry, aquaculture species, and wild animals that contribute to diets.
Livestock and Poultry: Domesticated animals such as cattle, buffalo, goats, sheep, pigs, and poultry supply meat, milk, eggs, and dairy products. India, being one of the largest milk producers, owes this to its rich diversity of cattle and buffalo breeds.
Fisheries: Oceans, rivers, and lakes provide fish, which are vital sources of protein and omega-3 fatty acids. In India, fish such as rohu, hilsa, and catla are important components of diets in coastal and riverine communities.
Wild Animals and Insects: In many tribal and rural societies, hunting of small wild animals, collection of honey, and even consumption of edible insects form part of traditional diets. This reflects the cultural significance of animal biodiversity in food systems.
3. Biodiversity and Food Security
Biodiversity enhances food security by ensuring a range of options and reducing dependence on a few species. Genetic diversity within crops and livestock allows adaptation to changing climatic conditions, diseases, and pests. For example, drought-resistant rice or pest-resistant maize varieties are developed by utilizing genetic diversity. Similarly, traditional breeds of livestock are often more resilient to local conditions compared to exotic breeds.
4. Cultural and Nutritional Importance
Different communities and regions have food traditions deeply rooted in biodiversity. Traditional diets based on local crops, spices, and livestock not only reflect cultural heritage but also ensure balanced nutrition. For instance, the Mediterranean diet with olives and seafood or Indian cuisine with pulses and spices highlights the role of biodiversity in enriching diets.
Conclusion
Biodiversity is the foundation of the world’s food systems, providing both plant-based and animal-based nutrition. It ensures food availability, dietary diversity, and resilience against environmental stresses. By conserving crop varieties, livestock breeds, fisheries, and wild species, humanity safeguards its food security and cultural heritage. Protecting biodiversity, therefore, is not only an ecological necessity but also a critical step in ensuring that present and future generations have access to safe, nutritious, and diverse food.
Biodiversity is not only the foundation of ecological balance and human survival but also a vital part of cultural, spiritual, and religious life. For centuries, societies across the world, especially in India, have revered nature in their traditions, rituals, and belief systems. Plants, animals, rivers, mountains, and forests are seen as sacred symbols, reflecting the deep connection between biodiversity and human culture. These values play a crucial role in conserving species and ecosystems while shaping human attitudes towards the natural world.
1. Sacred Plants and Trees
Many plant species hold immense cultural and religious importance. In India, trees such as the Peepal (Ficus religiosa), Banyan (Ficus benghalensis), and Tulsi (Ocimum sanctum) are considered sacred. The Peepal tree is associated with Lord Vishnu and Buddha, who attained enlightenment under it. The Banyan tree symbolizes immortality and is worshipped during festivals like Vat Savitri. Tulsi, revered in Hindu households, is not only a medicinal plant but also part of daily worship rituals. Such practices encourage the conservation of these species across generations.
2. Sacred Animals
Various animals are regarded as sacred or symbolic in cultural and religious traditions. The cow, considered a symbol of motherhood and non-violence in Hinduism, is protected and worshipped in many parts of India. The elephant, associated with Lord Ganesha, represents wisdom and strength. Snakes, particularly cobras, are worshipped during Nag Panchami. In Buddhism, the deer is a symbol of compassion, while in Jainism, non-violence toward all living beings (ahimsa) is a guiding principle that promotes biodiversity protection. These religious beliefs indirectly safeguard species and discourage their exploitation.
3. Rivers, Mountains, and Landscapes
Biodiversity is also revered through sacred rivers, mountains, and landscapes. The Ganga River is worshipped as Goddess Ganga and considered purifying and life-giving. Similarly, the Yamuna and Godavari rivers are important in Hindu rituals. The Himalayas, referred to as the abode of gods, hold immense spiritual significance in Hinduism and Buddhism. Sacred groves—patches of forests dedicated to local deities—are found across India, particularly in states like Meghalaya, Himachal Pradesh, and Kerala. These groves serve as biodiversity reservoirs, protecting endemic plants and animals.
4. Festivals and Rituals Linked to Biodiversity
Many cultural festivals are directly linked to the use and celebration of biodiversity. For example, during Onam in Kerala, floral decorations (Pookalam) are made using diverse flowers. The Makar Sankranti festival in several states marks the harvest season, celebrating the role of crops and agricultural biodiversity. Rituals involving offerings of fruits, flowers, and leaves highlight the dependence of culture on plant diversity.
5. Traditional Knowledge and Folklore
Indigenous communities and local traditions often incorporate biodiversity into their folklore, songs, and medicinal practices. For instance, the Bishnoi community of Rajasthan has long protected trees and wildlife as part of their religious ethos. Their sacrifice to protect Khejri trees in the 18th century is an example of biodiversity conservation rooted in cultural values.
Conclusion
The cultural and religious values of biodiversity demonstrate the deep spiritual bond between humans and nature. Sacred trees, animals, rivers, and groves embody ecological wisdom, guiding communities to live in harmony with the environment. Festivals, rituals, and traditional practices ensure the protection of species and ecosystems. In an era of biodiversity loss and ecological crisis, these cultural values are not merely symbolic but serve as powerful tools for conservation, reminding humanity of its duty to respect and protect the natural world.
Lakes are important freshwater ecosystems that provide habitats for diverse species of plants, animals, and microorganisms. They also supply water for drinking, irrigation, industry, and recreation. The ecological structure of a lake is divided into distinct zones based on depth, light penetration, and proximity to the shore. Each zone supports unique biological communities and ecological processes. The four primary zones of a lake biome are the littoral zone, limnetic zone, profundal zone, and benthic zone.
1. Littoral Zone
The littoral zone is the shallow area near the shore where sunlight penetrates to the bottom, allowing the growth of rooted aquatic plants. It extends from the shoreline to the depth where light can still support plant photosynthesis.
Characteristics: Warm, well-lit, and nutrient-rich. The water is usually shallow, well-oxygenated, and supports high biodiversity.
Flora: Emergent plants (e.g., cattails, reeds, lotus), floating plants (e.g., water lilies), and submerged plants (e.g., hydrilla).
Fauna: This zone supports snails, insects, amphibians, small fish, and breeding grounds for many larger fish and birds. It is the most productive zone of the lake due to abundant light and nutrients.
2. Limnetic Zone
The limnetic zone is the open surface water area of the lake away from the shore, where sunlight penetrates but the bottom is too deep for rooted plants to grow. This zone extends to the depth of effective light penetration, also known as the compensation depth.
Characteristics: Well-lit, dominated by plankton, and oxygen-rich. It is important for primary productivity.
Flora: Floating phytoplankton such as algae and cyanobacteria form the main producers.
Fauna: Zooplankton, which feed on phytoplankton, and various fish species such as bass and trout dominate. Birds often feed on fish in this zone.
Ecological Role: This zone is the primary photosynthetic region of the lake, forming the base of the aquatic food chain.
3. Profundal Zone
The profundal zone lies below the depth of light penetration, making it a dark, cold, and relatively unproductive region. It is found only in deep lakes.
Characteristics: No photosynthesis due to lack of sunlight; low oxygen levels, especially in summer when the lake is stratified.
Flora: Virtually absent since no light reaches this zone.
Fauna: Populated by heterotrophic organisms such as bacteria, fungi, and bottom-dwelling invertebrates (e.g., worms and some insect larvae) that feed on organic matter sinking from upper zones. Some cold-water fish adapted to low oxygen may also be present.
Ecological Role: It plays an important role in nutrient recycling through the decomposition of dead plants and animals.
4. Benthic Zone
The benthic zone refers to the bottom surface of the lake, including the sediment and sub-surface layers. It overlaps with littoral and profundal zones depending on depth.
Characteristics: Dark, nutrient-rich, and often oxygen-poor in deeper parts. It is a site of decomposition and nutrient regeneration.
Flora: In shallow benthic areas, rooted plants and algae may grow.
Fauna: Decomposers such as bacteria and detritivores like mollusks, crustaceans, and benthic worms dominate.
Ecological Role: Acts as a recycling system, breaking down organic matter and releasing nutrients back into the water column.
Conclusion
The lake biome is a complex and dynamic system divided into zones with distinct physical, chemical, and biological characteristics. The littoral zone is highly productive and diverse, the limnetic zone supports plankton and fish, the profundal zone sustains decomposers in dark, low-oxygen conditions, and the benthic zone functions as the nutrient recycling base of the lake. Together, these zones create a balanced ecosystem that supports aquatic life and provides vital ecological services. Understanding these zones is crucial for managing freshwater resources and conserving biodiversity.
The Tundra biome is one of the harshest and most unique ecosystems on Earth, characterized by extreme cold, short growing seasons, and limited biodiversity. The word “tundra” originates from the Finnish word tunturi, meaning “treeless plain.” It is primarily found in the Arctic regions of the Northern Hemisphere, though alpine tundra occurs on high mountain tops across the world. Despite its challenging conditions, the tundra plays a vital role in regulating global climate and supporting specially adapted forms of life.
1. Geographic Distribution
The tundra biome is mainly divided into two types:
Arctic Tundra: Found across Alaska, Canada, Greenland, Iceland, Scandinavia, and Russia, encircling the North Pole.
Alpine Tundra: Found at high altitudes on mountain ranges above the tree line, such as the Himalayas, Andes, and Rockies.
Together, tundra regions cover about one-fifth of the Earth’s land surface.
2. Climate
The tundra is known for its extreme climate. Winters are long, dark, and severely cold, with temperatures often dropping below –30°C. Summers are short and cool, with average temperatures ranging between 3°C and 12°C. Precipitation is very low (about 150–250 mm annually), making it almost a “cold desert.” Strong winds and permafrost conditions further add to the biome’s harshness.
3. Permafrost
One of the most distinctive features of the tundra biome is permafrost, a thick layer of soil that remains frozen throughout the year. In summer, only the top layer thaws, creating waterlogged conditions as the underlying soil prevents drainage. This limits plant growth and makes the landscape marshy, dotted with ponds and bogs.
4. Vegetation
Due to the cold climate and frozen soil, tundra vegetation is sparse and stunted. Trees are almost absent. Instead, vegetation includes mosses, lichens, grasses, sedges, dwarf shrubs, and hardy flowering plants that complete their life cycle quickly during the short summer. These plants are specially adapted to withstand cold, conserve moisture, and photosynthesize under low light.
5. Animal Life
Despite low biodiversity, several animals are uniquely adapted to the tundra. Common species include the Arctic fox, polar bear, caribou (reindeer), musk ox, lemming, and snowy owl. Many animals have thick fur, layers of fat, and hibernation or migration strategies to survive extreme conditions. During summer, migratory birds like geese and terns arrive in large numbers to breed. Insects, particularly mosquitoes, also thrive in the short summer season.
6. Human Presence and Activities
Human presence is sparse due to harsh conditions. Indigenous communities, such as the Inuit in Canada and Eskimos in Alaska, traditionally depend on hunting, fishing, and herding reindeer. In modern times, the tundra has attracted attention for its vast reserves of oil, gas, and minerals. However, industrial activities and infrastructure development are causing environmental challenges.
7. Ecological Importance
The tundra biome acts as a global carbon sink because its frozen soils store large amounts of organic carbon. However, climate change and rising temperatures are thawing permafrost, releasing greenhouse gases like methane and carbon dioxide, which further accelerate global warming. Thus, the tundra plays a critical role in regulating the Earth’s climate balance.
Conclusion
The tundra biome, with its treeless landscapes, extreme cold, and permafrost, represents one of the most challenging environments on Earth. Despite its harshness, it sustains unique vegetation and animal life specially adapted to survive in such conditions. It is also ecologically significant for its role in climate regulation. However, climate change and human exploitation pose serious threats to this fragile biome. Conserving the tundra is vital not only for biodiversity but also for maintaining global ecological stability.
Biodiversity refers to the variety of life forms found on Earth, encompassing genetic, species, and ecosystem diversity. Among these, species richness is one of the most fundamental measures of biodiversity. It denotes the number of different species present in a particular area or ecosystem, regardless of their abundance. In simple terms, species richness answers the question: “How many different species are there in a given habitat?”
For example, a forest containing 200 species of trees, birds, insects, and mammals is said to have higher species richness than a grassland with 50 species. While species richness alone does not consider the population size of each species, it serves as an essential baseline for understanding ecosystem health, ecological balance, and conservation priorities.
Species richness varies greatly across regions, influenced by factors such as climate, habitat heterogeneity, evolutionary history, and human activities. Tropical rainforests and coral reefs, for instance, are among the most species-rich ecosystems on Earth. In India, the Western Ghats and the Himalayan regions are recognized biodiversity hotspots due to their high species richness.
Types of Species Richness
Ecologists have developed various ways to measure species richness depending on the scale and focus of study. The three commonly recognized types are alpha diversity, beta diversity, and gamma diversity, originally proposed by R.H. Whittaker.
1. Alpha Diversity (Within-Habitat Richness)
Alpha diversity refers to the species richness within a particular habitat, community, or ecosystem. It measures the number of species found in a specific, relatively homogeneous area. For example, counting the number of plant species in a patch of tropical forest or the number of fish species in a pond gives alpha diversity.
Importance: It reflects local biodiversity and helps understand how productive or resilient a single ecosystem is.
Example: A grassland patch with 25 species of grasses, herbs, and shrubs has higher alpha diversity than another patch with only 10 species.
2. Beta Diversity (Between-Habitat Richness)
Beta diversity refers to the change in species composition between two different habitats or ecosystems. It measures the turnover of species along environmental gradients or spatial scales. High beta diversity means that two areas have very different sets of species, while low beta diversity means that they share most species.
Importance: It highlights the role of habitat heterogeneity in maintaining biodiversity.
Example: The difference in species composition between a riverine forest and a nearby dry deciduous forest indicates beta diversity. If one has entirely different species of birds and plants compared to the other, the beta diversity is high.
3. Gamma Diversity (Regional Richness)
Gamma diversity refers to the overall species richness within a large geographic region or landscape that includes multiple habitats or ecosystems. It provides a broader view of biodiversity at a regional or biogeographical scale.
Importance: It helps in identifying biodiversity hotspots and guiding conservation planning at larger scales.
Example: The total number of species found in the entire Western Ghats region, covering forests, rivers, and grasslands, represents gamma diversity.
Conclusion
Species richness is a fundamental measure of biodiversity that reflects the variety of species in an area. It can be studied at different scales: alpha diversity highlights local habitat richness, beta diversity emphasizes species turnover between habitats, and gamma diversity captures regional biodiversity. Understanding these types of species richness is crucial for conservation biology, ecological research, and sustainable management of ecosystems. By protecting habitats with high species richness, such as tropical forests and coral reefs, we not only conserve biodiversity but also safeguard ecological balance and human well-being.
Water is the foundation of life and a vital natural resource for agriculture, industry, domestic use, and maintaining ecosystems. Despite having a vast network of rivers and an average annual rainfall of about 1,170 mm, India faces severe water scarcity due to uneven distribution, overexploitation, and pollution. With rising population, urbanization, and climate change, conserving water has become a pressing necessity. Effective strategies for water conservation can ensure sustainable use of this precious resource. The following are some of the key measures:
1. Rainwater Harvesting
Rainwater harvesting is one of the most effective methods of conserving water. It involves collecting and storing rainwater from rooftops, courtyards, or catchment areas for later use. Rooftop harvesting structures can supply water for domestic use, while check dams and percolation pits help recharge groundwater. Cities like Chennai have made rooftop harvesting mandatory, setting a strong example.
2. Efficient Irrigation Practices
Agriculture consumes nearly 80% of India’s freshwater resources, making irrigation efficiency crucial. Traditional flood irrigation leads to waterlogging and wastage. Alternatives such as drip irrigation and sprinkler systems supply water directly to plant roots, reducing loss through evaporation and runoff. Crop diversification toward less water-intensive crops and scheduling irrigation based on soil moisture levels are also important strategies.
3. Watershed Management
Watershed management focuses on conserving water resources through soil and water conservation practices within a defined catchment area. Measures such as contour bunding, terracing, check dams, and vegetative cover reduce runoff, enhance groundwater recharge, and maintain soil fertility. This integrated approach improves both water availability and agricultural productivity.
4. Groundwater Recharge
Overextraction of groundwater has caused alarming declines in the water table in many parts of India. Artificial recharge techniques, such as constructing recharge wells, percolation tanks, and recharge trenches, can help restore aquifers. Protecting wetlands and traditional ponds also supports natural recharge processes.
5. Wastewater Treatment and Reuse
Urban and industrial wastewater can be treated and reused for non-potable purposes such as gardening, flushing, cooling in industries, and irrigation. Decentralized wastewater treatment systems at community and institutional levels reduce pressure on freshwater sources and improve sanitation.
6. Reducing Water Pollution
Conservation also means protecting water quality. Strict enforcement of laws to prevent discharge of untreated sewage and industrial effluents into rivers and lakes is essential. Community awareness about reducing use of harmful chemicals and promoting eco-friendly practices in agriculture and industry also plays a major role.
7. Water-Smart Urban Planning
In urban areas, water conservation can be promoted through smart planning. This includes water-efficient plumbing fixtures, recycling greywater, adopting green building standards, and integrating urban lakes and wetlands into city planning. Sustainable drainage systems help recharge groundwater while reducing flooding risks.
8. Community Participation and Awareness
Water conservation cannot succeed without public involvement. Awareness campaigns, school education, and local community initiatives encourage people to adopt simple practices such as fixing leaks, using buckets instead of showers, and avoiding wastage. Traditional systems like stepwells, tanks, and baolis can also be revived with community support.
Conclusion
Water conservation is no longer an option but a necessity for ensuring food security, sustainable development, and ecological balance. Strategies like rainwater harvesting, efficient irrigation, watershed management, groundwater recharge, wastewater reuse, and pollution control offer practical solutions. Combining modern technology with traditional practices and encouraging community participation can create a sustainable water future for India. Effective policies and people’s cooperation together will ensure that this life-sustaining resource is preserved for generations to come.
The Earth’s crust is made up of different kinds of rocks, which serve as the foundation of continents, mountains, and valleys. Rocks are not static; they are continuously formed, broken down, transformed, and reformed through natural processes that occur both on the surface and deep inside the Earth. This continuous transformation of rocks is known as the rock cycle. It demonstrates the dynamic nature of Earth’s geology and the interconnectedness of processes such as cooling, weathering, erosion, compaction, heat, pressure, and melting.
The rock cycle begins with molten magma beneath the Earth’s surface. When magma cools and solidifies, it forms igneous rocks. These igneous rocks, when exposed to weathering and erosion, break into small particles or sediments. Over time, these sediments are transported by water, wind, or ice, and deposited in layers. Through compaction and cementation, these sediments harden into sedimentary rocks. If these sedimentary rocks are subjected to high temperature and pressure within the Earth’s crust, they transform into metamorphic rocks. Metamorphic rocks, in turn, may undergo further changes—if they melt back into magma, the cycle begins again. This continuous process shows that rocks are never destroyed but keep changing form in an endless cycle.
1. Igneous Rocks
Igneous rocks are known as the “primary rocks” because they are formed directly from molten material. When magma cools and solidifies deep inside the Earth, the process is slow, resulting in coarse-grained intrusive igneous rocks like granite. When lava erupts from volcanoes and cools quickly on the surface, fine-grained extrusive igneous rocks like basalt are formed. Igneous rocks are generally hard, dense, and crystalline in structure. They are rich in minerals such as feldspar, mica, and quartz. These rocks form the basis of most mountain ranges and the ocean floor. In India, the Deccan Plateau is largely composed of basalt, while granite is found in the Chotanagpur Plateau.
2. Sedimentary Rocks
Sedimentary rocks are formed by the deposition and hardening of sediments derived from the breakdown of pre-existing rocks. These sediments are transported by rivers, winds, glaciers, or seas, and deposited in layers over time. With pressure and natural cementing agents, they become solid rock. Sedimentary rocks are usually stratified, softer than igneous rocks, and may contain fossils of plants and animals. Examples include sandstone, limestone, shale, and coal. These rocks cover nearly 75% of the Earth’s land surface and are important sources of minerals, building materials, and fossil fuels. In India, sandstone is common in Madhya Pradesh and Rajasthan, while limestone is abundant in Gujarat and Andhra Pradesh.
3. Metamorphic Rocks
Metamorphic rocks are formed when existing igneous or sedimentary rocks undergo transformation due to intense heat, pressure, or chemical processes, without melting. This process, known as metamorphism, alters the mineral composition and texture of the parent rock, making it harder and more compact. For example, limestone changes into marble, shale into slate, and granite into gneiss. Metamorphic rocks are often foliated (layered) or banded, giving them a distinct appearance. They are widely used in construction, sculpture, and as decorative stones. In India, marble is famously found in Rajasthan (Makrana), while slate is common in Himachal Pradesh.
Conclusion
The rock cycle highlights the dynamic and ever-changing nature of the Earth’s crust, where rocks of one type are constantly being transformed into another. Igneous rocks provide the primary base, sedimentary rocks record Earth’s history through fossils, and metamorphic rocks show the effects of pressure and heat deep within the Earth. Together, these three rock types and their transformations reveal the complexity and balance of geological processes that shape our planet.
Energy is the driving force of economic growth and human development. In the face of rising energy demands, limited fossil fuel reserves, and growing environmental concerns, renewable sources of energy have become crucial. Among them, solar energy occupies a central place because of its abundance, sustainability, and versatility. India, being a tropical country, is especially well-positioned to harness solar power, receiving nearly 300 sunny days annually and an average solar insolation of 4–7 kWh per square meter per day.
Importance of Solar Energy
Abundant and Renewable Source Solar energy is one of the most abundant resources available to humankind. Unlike fossil fuels, which are finite and concentrated in specific regions, sunlight is universally available and inexhaustible. This makes solar energy a sustainable option for meeting long-term energy needs.
Energy Security for India India imports a significant portion of its crude oil and natural gas, which creates energy dependency and economic vulnerability. By investing in solar power, India can reduce its reliance on imports, strengthen energy security, and achieve self-sufficiency in clean energy production.
Climate Change Mitigation Traditional energy generation from coal and oil is a major contributor to greenhouse gas emissions. Solar energy, being clean and emission-free, plays a vital role in reducing carbon footprints, combating global warming, and meeting international commitments such as the Paris Agreement.
Rural Electrification and Development Many rural areas in India still face power shortages or lack grid connectivity. Solar panels provide a decentralized and cost-effective solution for rural electrification. This improves education, healthcare, communication, and overall socio-economic development in remote regions.
Support for Sustainable Development Goals (SDGs) Solar energy directly contributes to several UN Sustainable Development Goals, including affordable and clean energy (SDG 7), climate action (SDG 13), and sustainable cities (SDG 11). It supports inclusive and sustainable growth.
Advantages of Solar Energy
Eco-Friendly and Pollution-Free Solar energy generation does not emit greenhouse gases, air pollutants, or noise. Unlike coal-based plants, it does not harm the environment through mining, ash generation, or air pollution.
Low Operating Costs Once solar panels and systems are installed, the maintenance and operational costs are minimal. Solar energy systems can function effectively for 20–25 years, making them a cost-effective long-term investment.
Scalability and Versatility Solar technology can be used at multiple scales—from rooftop panels for individual homes to large solar farms generating megawatts of electricity. It can also be applied for heating, cooking, and water purification.
Job Creation and Economic Growth The solar energy sector creates employment in manufacturing, installation, maintenance, and research. India’s solar mission has already generated thousands of jobs, contributing to skill development and industrial growth.
Energy Access in Remote Areas Standalone solar systems, such as solar lanterns, pumps, and mini-grids, provide reliable power in regions where grid extension is difficult or uneconomical. This bridges the energy divide between urban and rural areas.
Reduction in Energy Bills Solar rooftop systems enable households and businesses to generate their own electricity, reducing dependency on grid supply and lowering energy costs. Net metering policies further allow surplus energy to be sold back to the grid.
Conclusion
Solar energy is not only an answer to India’s growing energy needs but also a pathway to sustainable development. Its abundance, eco-friendliness, and versatility make it a critical component of the renewable energy mix. By reducing carbon emissions, enhancing energy security, promoting rural electrification, and creating jobs, solar energy offers multifaceted benefits. With advancements in technology and supportive government policies, India has the potential to emerge as a global leader in solar power, making the transition toward a greener and more sustainable future.
Water is one of the most critical natural resources, essential for life, agriculture, industry, energy, and ecosystem balance. India, with its diverse geography and climate, possesses significant water resources in the form of rivers, lakes, groundwater, glaciers, and rainfall. However, despite being endowed with a vast network of rivers and an average annual rainfall of about 1,170 mm, the country faces acute challenges in managing its water resources. Unequal distribution, overexploitation, and pollution have made water scarcity a pressing issue.
Water Resources in India
India’s water resources can be categorized into surface water and groundwater:
Surface Water India has 12 major river basins, including the Ganga, Brahmaputra, Indus, Godavari, Krishna, Narmada, Mahanadi, and Kaveri. Together, these account for most of the country’s surface water availability. Lakes, reservoirs, and canals also play vital roles in irrigation, hydropower, and drinking water supply. The total utilizable surface water is estimated at about 690 billion cubic meters (BCM).
Groundwater Groundwater is the backbone of India’s agriculture, providing nearly 60% of irrigation and over 80% of rural drinking water supply. States like Punjab, Haryana, and Uttar Pradesh heavily depend on groundwater for high-yield agriculture. The utilizable groundwater resources are estimated at about 433 BCM annually.
Rainfall and Glaciers Rainfall is the primary source of water, concentrated in the monsoon season (June–September). However, its distribution is highly uneven across regions. The Himalayan glaciers also feed perennial rivers like the Ganga, Yamuna, and Brahmaputra, which are crucial for northern India’s water security.
Problems Associated with Water Resources in India
Uneven Distribution Water resources are highly uneven across time and space. The north and northeast regions are water-rich, while the western and southern regions often face scarcity. Seasonal dependence on monsoons makes water availability uncertain and unreliable.
Overexploitation of Groundwater Unsustainable extraction of groundwater for irrigation, especially in Punjab, Haryana, Rajasthan, and parts of Gujarat, has led to alarming declines in the water table. In some areas, aquifers are near exhaustion, threatening long-term agricultural sustainability.
Water Pollution Industrial effluents, untreated sewage, agricultural runoff containing fertilizers and pesticides, and solid waste contaminate rivers, lakes, and groundwater. The Ganga, Yamuna, and Sabarmati are among the most polluted rivers. Contaminated water affects health, causing diseases like diarrhea, cholera, and fluorosis.
Inefficient Irrigation Practices Agriculture consumes nearly 80% of India’s freshwater, yet irrigation efficiency remains low due to over-reliance on flood irrigation. This leads to waterlogging, salinization of soils, and wastage of precious resources.
Inter-State Water Disputes Competition among states over river waters, such as the Cauvery dispute between Karnataka and Tamil Nadu or the Satluj-Yamuna Link conflict between Punjab and Haryana, highlights the political and social challenges in water-sharing.
Climate Change Impact Erratic rainfall, frequent droughts, floods, and glacial retreat due to global warming are exacerbating water stress. Himalayan rivers face long-term risks from shrinking glaciers, while coastal regions face saline water intrusion.
Population Growth and Urbanization Rising population and rapid urbanization increase the demand for drinking water, sanitation, and industrial use. Cities like Chennai, Bengaluru, and Delhi frequently face severe water shortages. The mismatch between demand and supply is widening every year.
Decline in Traditional Water Systems Traditional water conservation systems like tanks, ponds, step-wells, and baolis have been neglected, reducing community-based resilience to water stress.
Conclusion
India’s water resources are vast but under severe stress due to overexploitation, pollution, uneven distribution, and the growing pressures of population and climate change. Effective solutions lie in sustainable water management—improving irrigation efficiency, rainwater harvesting, watershed management, pollution control, and interstate cooperation. Reviving traditional practices alongside modern technology can help ensure water security for future generations.
Soil is the foundation of agriculture, but its productivity can be severely hampered by salinity and alkalinity. Both conditions are major land degradation problems in arid and semi-arid regions of India and the world. Soil salinity refers to the excessive accumulation of soluble salts such as sodium chloride, calcium chloride, and magnesium sulfate in the soil profile. Soil alkalinity (sodicity), on the other hand, is caused by high levels of sodium carbonate and bicarbonate, which lead to an elevated pH (usually above 8.5) and poor soil structure. These conditions reduce soil fertility, hinder crop growth, and pose long-term environmental challenges. The major adverse effects are discussed below.
1. Reduction in Soil Fertility
Saline and alkaline soils adversely affect soil fertility. In saline soils, the presence of high concentrations of salts disrupts nutrient balance, often leading to deficiencies of essential elements like nitrogen, phosphorus, and potassium. In alkaline soils, high sodium levels cause the dispersion of soil particles, reducing the availability of micronutrients such as zinc, iron, manganese, and copper. This imbalance lowers the soil’s capacity to support healthy plant growth.
2. Poor Soil Structure
Excessive sodium in alkaline soils causes the breakdown of soil aggregates, leading to poor soil structure and compaction. This reduces soil porosity and aeration, making root penetration difficult. In saline soils, crust formation occurs on the surface, which further restricts seed germination and seedling emergence. Over time, these structural problems decrease soil productivity.
3. Water Infiltration and Drainage Issues
High salt concentration increases the osmotic pressure of soil water, making it harder for plants to absorb moisture. In alkaline soils, sodium-induced dispersion leads to reduced water infiltration and poor drainage. This results in water stagnation on the soil surface, increasing the risk of secondary salinization and waterlogging. Consequently, crop roots may suffer from oxygen deficiency and reduced growth.
4. Toxic Effects on Plants
Both salinity and alkalinity can have direct toxic effects on plants. In saline soils, excess chloride, sodium, and sulfate ions accumulate in plant tissues, leading to leaf burn, stunted growth, and premature leaf drop. In alkaline soils, sodium carbonate toxicity can damage root tissues and interfere with normal physiological functions. These conditions reduce crop yields drastically.
5. Reduced Crop Variety and Yield
Saline and alkaline soils restrict the types of crops that can be grown. Sensitive crops like pulses, oilseeds, fruits, and vegetables are particularly affected. Only salt-tolerant varieties, such as barley, cotton, and some millets, can withstand such soils, but even these crops yield poorly compared to normal conditions. In the long run, this reduces cropping diversity and farm profitability.
6. Environmental and Ecological Impacts
Salinity and alkalinity also degrade the environment. Salt accumulation in soils can lead to contamination of groundwater through leaching. In irrigation command areas, salinization reduces the overall agricultural potential of land, causing farmers to abandon fields. Large tracts of degraded saline or alkaline lands also contribute to desertification, biodiversity loss, and reduced ecosystem services.
7. Socio-Economic Consequences
The decline in soil productivity directly impacts farmers’ livelihoods, especially in regions heavily dependent on agriculture. Reduced yields lead to food insecurity, income loss, and increased migration. The cost of soil reclamation and irrigation management further burdens rural communities, making it a significant socio-economic issue.
Conclusion
Soil salinity and alkalinity pose serious challenges to sustainable agriculture. They reduce soil fertility, impair structure, hinder water absorption, and cause toxic effects on plants, leading to reduced yields and limited crop choices. Beyond agriculture, these problems contribute to environmental degradation and socio-economic distress. Effective management, such as proper drainage, use of gypsum and organic amendments, adoption of salt-tolerant crops, and efficient irrigation practices, is essential to reclaim and preserve such soils for future generations.
Rivers are the lifelines of India, shaping its geography, culture, and economy. They provide water for agriculture, drinking, hydroelectricity, and industry, while also serving as a basis for ancient civilizations and modern settlements. The river systems of India can be broadly divided into the Himalayan rivers, which are perennial and snow-fed, and the Peninsular rivers, which are mostly rain-fed and seasonal. Below is a brief account of the major rivers of India.
1. The Ganga River
The Ganga is India’s most sacred and important river. Originating from the Gangotri Glacier in Uttarakhand as the Bhagirathi, it is joined by the Alaknanda at Devprayag to form the Ganga. Flowing southeast across the plains of Uttar Pradesh, Bihar, and West Bengal, it empties into the Bay of Bengal, forming the world’s largest delta, the Sundarbans. Its major tributaries include the Yamuna, Ghaghara, Gandak, Kosi, and Son. The Ganga basin is one of the most fertile regions in the world, supporting dense population and agriculture, especially rice, wheat, and sugarcane.
2. The Yamuna River
The Yamuna, a major tributary of the Ganga, originates from the Yamunotri Glacier in Uttarakhand. Flowing through Himachal Pradesh, Haryana, and Delhi, it merges with the Ganga at Prayagraj (Allahabad). The cities of Delhi, Agra, and Mathura lie on its banks. Despite pollution challenges, the Yamuna is vital for irrigation and drinking water supply in northern India.
3. The Brahmaputra River
The Brahmaputra originates as the Yarlung Tsangpo in Tibet, enters India through Arunachal Pradesh, and flows across Assam before entering Bangladesh, where it merges with the Ganga. It is known for its vast width, frequent floods, and huge water discharge. Its fertile floodplains support rice, tea, and jute cultivation. The river is also rich in hydropower potential and is central to the culture and economy of Northeast India.
4. The Indus River
The Indus, originating in Tibet near Lake Mansarovar, flows through Ladakh, Gilgit-Baltistan, and into Pakistan, where it empties into the Arabian Sea. Historically significant as the cradle of the Indus Valley Civilization, it is a transboundary river governed by the Indus Water Treaty between India and Pakistan. Major tributaries within India include the Jhelum, Chenab, Ravi, Beas, and Sutlej, which sustain agriculture in Punjab and Haryana.
5. The Godavari River
The Godavari, often called the “Dakshina Ganga” or Ganga of the South, is the longest river of Peninsular India. Originating in Maharashtra, it flows eastward across Telangana and Andhra Pradesh before draining into the Bay of Bengal. Its fertile basin supports crops like rice, pulses, and cotton. Important tributaries include the Manjira, Penganga, and Indravati.
6. The Krishna River
The Krishna originates in the Western Ghats of Maharashtra and flows through Karnataka and Andhra Pradesh into the Bay of Bengal. Major tributaries include the Bhima, Tungabhadra, and Ghataprabha. It is crucial for irrigation projects like Nagarjuna Sagar and Krishna Delta irrigation systems.
7. The Narmada and Tapti Rivers
The Narmada and Tapti are west-flowing rivers that drain into the Arabian Sea. The Narmada originates from Amarkantak Plateau in Madhya Pradesh, while the Tapti rises in Satpura ranges. Their valleys separate the Vindhya and Satpura ranges. The Narmada is especially famous for projects like the Sardar Sarovar Dam and fertile black soil tracts.
8. The Mahanadi River
Originating in Chhattisgarh, the Mahanadi flows through Odisha into the Bay of Bengal. Known for Hirakud Dam, one of the longest dams in the world, it irrigates vast rice-growing regions.
9. The Kaveri River
The Kaveri originates in Karnataka’s Western Ghats and flows through Tamil Nadu before draining into the Bay of Bengal. Known as the “Ganga of the South,” it supports agriculture, especially paddy and sugarcane, and is central to interstate water disputes.
Conclusion
India’s major rivers are not just geographical features but cultural and economic lifelines. The Himalayan rivers like the Ganga, Yamuna, Indus, and Brahmaputra provide perennial water supply, while the Peninsular rivers like Godavari, Krishna, Narmada, and Kaveri sustain agriculture and power generation. Together, they form the backbone of India’s civilization, economy, and ecology. Sustainable management of these rivers is vital for ensuring water security, environmental balance, and continued prosperity.
Soil is one of the most vital natural resources that sustains agriculture, which forms the backbone of the Indian economy. India, due to its diverse physiographic, climatic, and geological conditions, possesses a wide range of soil types. Among them, several soils are fertile and highly suitable for agricultural activities. These fertile soils not only support the cultivation of food grains but also cash crops that contribute to the country’s economic growth. The following are the major fertile soils found in India:
1. Alluvial Soil
Alluvial soil is the most extensive and agriculturally important soil in India. It covers nearly 40% of the total land area, especially in the Indo-Gangetic plains and river basins. Formed by the deposition of silt, sand, and clay carried by rivers like the Ganga, Brahmaputra, and Indus, this soil is very fertile. It is rich in potash, phosphoric acid, and lime but deficient in nitrogen and humus. Alluvial soil is suitable for crops such as wheat, rice, sugarcane, pulses, oilseeds, and jute. Its loamy texture, good water retention, and easy tillage make it a farmer-friendly soil.
2. Black Soil (Regur Soil)
Black soil, also known as Regur soil, is another fertile type found predominantly in the Deccan Plateau region, including Maharashtra, Madhya Pradesh, Gujarat, and parts of Andhra Pradesh and Tamil Nadu. This soil is formed from the weathering of volcanic basalt rocks. It is rich in lime, iron, magnesium, and alumina, though deficient in nitrogen and phosphorus. Black soil is characterized by its high moisture retention capacity and self-ploughing nature due to deep cracks that appear in summer. It is most suitable for cotton cultivation, earning it the name “black cotton soil,” but also supports crops like soybeans, groundnuts, maize, and pulses.
3. Red Soil
Red soil, derived from crystalline rocks, is found in Tamil Nadu, Karnataka, Andhra Pradesh, and parts of Odisha and Chhattisgarh. Its red color is due to the presence of iron oxides. While red soil is not as inherently fertile as alluvial or black soils, it becomes agriculturally productive with proper irrigation and fertilization. It is moderately rich in potash but poor in nitrogen, phosphorus, and organic matter. Red soils are suitable for cultivating millets, pulses, groundnut, cotton, and fruits like citrus and pomegranate.
4. Laterite Soil
Laterite soil, formed under high rainfall and temperature conditions, is found in Kerala, Karnataka, Maharashtra, Odisha, and the northeastern states. It is rich in iron and aluminum but poor in organic matter, nitrogen, and phosphate. While not naturally fertile, with adequate manuring and irrigation, laterite soil supports crops like tea, coffee, cashew, and coconut. Its ability to retain moisture in wet climates makes it agriculturally significant in plantation regions.
5. Mountain Soil
Mountain or forest soils are found in the Himalayan region, northeastern states, and the Western Ghats. They are fertile in valleys and lower slopes, where they receive humus from decayed vegetation. Rich in organic matter, these soils are suitable for crops like tea, coffee, spices, fruits, and medicinal plants. In terraced farming areas, mountain soils support rice and maize cultivation.
Conclusion
India’s fertile soils form the foundation of its agricultural prosperity. Alluvial soils dominate the northern plains with their richness and versatility, while black soils sustain cotton cultivation in the Deccan. Red and laterite soils, though less fertile, become productive with proper management. Mountain soils, enriched by organic content, support plantation crops and horticulture. The diversity of fertile soils across regions reflects India’s geographical variations and underlines the country’s potential for varied agricultural practices. Sustainable management of these soils is essential for ensuring food security and rural livelihoods in the long term.
There has long been an ongoing debate about the role of objectivity in qualitative research. Unlike quantitative traditions that emphasize neutrality and detachment, qualitative inquiry recognizes that the researcher is not an “outsider” who can simply collect and report data without influence. Rather, we bring our own perspectives, identities, and lived experiences into the field. These inevitably shape how we design our studies, ask questions, engage with participants, interpret findings, and ultimately construct narratives.
For some, this appears to undermine the credibility of qualitative work. If researchers cannot be fully “objective,” how can their findings be trusted? But I believe the answer lies not in denying subjectivity, but in acknowledging and critically engaging with it. The goal is not to erase who we are, but to practice what many scholars call reflexive objectivity—a way of producing knowledge that is honest about the influence of positionality while still striving for rigor and transparency.
Making Positionality Explicit
As a qualitative researcher, I begin by situating myself in relation to the topic. I reflect on my background, training, social identity, values, and even the institutional setting that shapes my perspective. For instance, my understanding of mobility, safety, or community participation may differ based on my own cultural and professional experiences. This positionality does not invalidate the research—it provides context for how I see and interpret the world.
Acknowledging positionality means that instead of claiming to be a neutral observer, I recognize the role of my standpoint in shaping interactions with participants and in framing the data. This act of disclosure not only strengthens trustworthiness but also helps readers evaluate how my lens influences the findings.
Reflexivity as a Continuous Practice
Reflexivity is not a one-time exercise; it is an ongoing practice woven throughout the entire research process. To me, reflexivity means asking: Why am I drawn to this topic? How do my assumptions guide the kinds of questions I ask? In what ways do I interpret a participant’s words through my own framework?
I employ several strategies to remain reflexive and accountable:
Reflexive journaling – Keeping a research diary allows me to capture my evolving thoughts, doubts, and emotional reactions during fieldwork and analysis. By revisiting these notes, I can identify moments when my assumptions may have influenced interpretation and work to balance them with participants’ voices.
Member checking – I often share preliminary interpretations with participants themselves, asking whether my analysis resonates with their experiences. This feedback helps me avoid misrepresentations and ensures that the narrative is not solely my construction, but co-shaped with those whose lives the research reflects.
Peer debriefing – Engaging in conversations with colleagues or mentors acts as a form of intellectual accountability. By exposing my interpretations to critique, I become more aware of blind spots and can strengthen the analysis through dialogue.
Thick description – When writing, I strive to provide rich contextual details about settings, interactions, and participants’ perspectives. This not only captures the complexity of lived experiences but also allows readers to assess how my interpretations were constructed and to draw their own conclusions.
Audit trail – I maintain systematic records of data collection, coding, and analytical decisions. Documenting these steps makes the process transparent and demonstrates that findings are not arbitrary but grounded in systematic engagement with the data.
Transparency and Accountable Subjectivity
In qualitative research, transparency is central to credibility. By documenting and openly communicating how decisions were made, which voices were prioritized, and how interpretations evolved, I make it possible for others to understand the logic of my narrative.
This does not mean I eliminate bias completely—bias is inherent in being human. Instead, I aim for what scholars describe as accountable subjectivity: the practice of recognizing one’s perspective, being explicit about it, and showing how it shapes the research process. In doing so, I move away from the illusion of “pure objectivity” and towards a more honest, situated, and ethically responsible approach to knowledge creation.
Reframing the Debate
Thus, the debate about objectivity in qualitative research is not about whether we can achieve absolute neutrality (we cannot). Rather, it is about how we, as researchers, negotiate our positionality in a way that enhances the rigor and credibility of our work. For me, reflexivity and transparency are not optional—they are integral to ethical qualitative practice.
By embracing reflexivity, I am not weakening the scientific value of my research; I am strengthening it. By disclosing my positionality, I am not inserting “bias” into the findings; I am showing readers the lens through which meaning was constructed. By creating space for participants’ validation and peer critique, I am not undermining my authority as a researcher; I am ensuring that the narrative is both authentic and trustworthy.
In the end, qualitative research is less about claiming universal truths and more about providing deep, situated insights into human experiences. The role of the researcher is to co-construct these narratives responsibly—acknowledging subjectivity, engaging critically with it, and ensuring that knowledge is produced with rigor, integrity, and respect.
References
Dehalwar, K. S. S. N., & Sharma, S. N. (2024). Exploring the distinctions between quantitative and qualitative research methods. Think India Journal, 27(1), 7-15.
Fossey, E., Harvey, C., McDermott, F., & Davidson, L. (2002). Understanding and evaluating qualitative research. Australian and New Zealand journal of psychiatry, 36(6), 717-732.
Dehalwar, K., & Sharma, S. N. (2024). Social Injustice Inflicted by Spatial Changes in Vernacular Settings: An Analysis of Published Literature.
Grossoehme, D. H. (2014). Overview of qualitative research. Journal of health care chaplaincy, 20(3), 109-122.
Lodhi, A. S., Jaiswal, A., & Sharma, S. N. (2024). Assessing bus users satisfaction using discrete choice models: a case of Bhopal. Innovative Infrastructure Solutions, 9(11), 437.
Sharma, S. N., Dehalwar, K., Singh, J., & Kumar, G. (2024, February). Prefabrication Building Construction: A Thematic Analysis Approach. In International Conference on Advances in Concrete, Structural, & Geotechnical Engineering (pp. 405-428). Singapore: Springer Nature Singapore.
Sharma, S. N., & Dehalwar, K. Examining the Inclusivity of India’s National Urban Transport Policy for Senior Citizens. In Transforming Healthcare Infrastructure (pp. 115-134). CRC Press.
📘 Understanding the Dissertation: A Scholar’s Journey
For many doctoral students, the dissertation is the most significant milestone of their academic journey. Yet, there is often confusion about what a dissertation truly is—and what it is not. Let’s break it down.
🔹 Not Just a Term Paper or Personal Reflection A dissertation is not a longer version of a term paper, nor is it an anecdotal record of professional achievements or a personal statement of beliefs. It is, instead, an objective, evidence-based, and detailed research document prepared for a scholarly audience. Its purpose is to demonstrate original thinking, methodological rigor, and a solid grounding in existing literature.
🔹 Length and Disciplinary Variations On average, dissertations are about 200 pages long, though they typically range from 125 to 225 pages. Differences arise based on field and research methodology:
Dissertations in natural sciences are usually shorter, with a stronger emphasis on experimental results.
Dissertations in social sciences or ethnographic studies are often longer due to the need for contextual detail, participant narratives, and interpretive analysis.
The practical advice remains constant: write your dissertation so that it is long enough to tell your research story clearly, but not so long that it loses your reader’s interest.
🔹 Looking and Sounding Scholarly A dissertation must not only present new research but also engage with existing scholarship. This means:
Citations & Literature Review: Your work must show that you understand the field, can cite relevant studies, and position your research in the broader academic conversation.
Tone & Style: The writing should be formal, precise, and objective. While recent years have seen a move away from overly complex and turgid prose, the expectation remains that dissertations must maintain a scholarly voice, avoiding colloquial or editorial-style writing.
🔹 Organisation and Structure Although formats may vary, most dissertations continue to follow a well-established structure:
Introduction – stating the problem and research objectives.
Literature Review – situating the study within the existing body of knowledge.
Methodology – explaining how the research was conducted.
Results – presenting the findings systematically.
Summary and Discussion – interpreting results, highlighting contributions, and suggesting future directions.
Even when deviations occur, dissertations generally follow a predictable order that ensures clarity and logical progression.
🔹 Adhering to Style Guides and Academic Rigor Dissertations must comply with specific style manuals such as APA, MLA, Chicago, or university-specific guidelines. Unlike term papers where some flexibility may be allowed, dissertations demand strict consistency in formatting citations, references, tables, figures, and headings. This attention to detail not only reflects professionalism but also ensures that the work aligns with academic publishing standards.
✨ Why It Matters A dissertation is more than just a degree requirement—it is a scholarly contribution that adds to the pool of academic knowledge. It reflects years of study, months of data collection and analysis, and countless hours of writing, editing, and refining. Most importantly, it showcases a researcher’s ability to think critically, engage with theory and evidence, and communicate ideas in a scholarly manner.
👉 In conclusion, think of your dissertation as your first book-length research project. It is not about filling pages but about building arguments, documenting evidence, and making a meaningful academic contribution.
Openings (windows, doors) for light & ventilation.
🔹 d) Orientation and Climate Response
Sunlight, ventilation, shading.
Relation to site (street edge, garden, setback).
2️⃣ Understanding Clusters of Buildings
A cluster is a group of buildings arranged together, forming a spatial unit within a settlement. They may be planned (designed layouts) or organic (grown over time).
🔹 a) Types of Clusters
Linear clusters → along a street, river, or transit corridor.
Courtyard clusters → buildings arranged around an open space.
Radial clusters → arranged around a central node (plaza, temple, monument).
Organic clusters → irregular, often in old villages or historic towns.
Grid-based clusters → modern planned layouts, like residential colonies.
🔹 b) Spatial Relationships
Proximity → distance between buildings defines density and privacy.
Orientation → facing toward common courtyards, streets, or views.
Scale → clusters can be human-scaled (villages) or monumental (institutional campuses).
🔹 c) Shared Spaces
Courtyards, streets, plazas → act as social spaces.
Pathways and connections → ensure circulation.
Public vs private domain → front yards, verandahs, and transition zones.
3️⃣ Comparison: Building vs Cluster
Aspect
Single Building
Cluster of Buildings
Focus
Internal space, functionality, comfort
External space, relationships, community
Scale
Human, family, or organizational unit
Neighborhood, institutional, or urban scale
Design
Form, structure, climate response
Arrangement, density, circulation
Outcome
Shelter, identity, usability
Social interaction, community life, urban form
4️⃣ Examples
Single building: A house designed with verandah, courtyard, and pitched roof (responding to climate).
Cluster: Houses arranged around a shared courtyard in Rajasthan havelis, or along narrow streets in European medieval towns.
Modern examples:
Single: High-rise office tower.
Cluster: IT campuses, university complexes, housing colonies.
5️⃣ Why This Matters for Planners and Architects
Helps balance individual needs (privacy, comfort) with community needs (interaction, accessibility).
Influences density, livability, and sustainability of urban spaces.
Shapes the identity of towns and cities through built form and open spaces.
✅ In summary:
A building is understood by its form, function, structure, and climate response.
A cluster is understood by arrangement, spatial relationships, and shared spaces.
Together, they define how people live, work, interact, and build communities.
One-point perspective is a method of graphical projection that creates the illusion of depth by making parallel lines converge toward a single vanishing point on the horizon line. It mimics how the human eye perceives objects that are directly in front of us.
1️⃣ Key Principles
Horizon Line (HL)
Represents the viewer’s eye level.
All vanishing points lie on this line.
Vanishing Point (VP)
A single point on the horizon line where all parallel lines (receding in depth) appear to converge.
In one-point perspective, only one vanishing point is used.
Parallel vs. Perpendicular Lines
Lines parallel to the picture plane (front faces) are drawn in their true shape and size.
Lines perpendicular to the picture plane recede toward the one vanishing point.
Foreshortening
Objects appear smaller as they recede into the distance.
Equal distances in reality look progressively shorter in the drawing.
Station Point (SP)
The eye position of the observer.
Determines how close or far objects appear.
2️⃣ Steps to Construct a One-Point Perspective
Draw a horizon line at eye level.
Mark a single vanishing point (VP) on the horizon line.
Draw the front face of the object (true shape).
From each corner of the object, draw lines receding to the vanishing point.
Add the back edges by cutting off receding lines at desired depth.
Darken the visible outlines → realistic perspective view.
3️⃣ Examples
Corridor or Railway Tracks → parallel sides converge at one point on the horizon.
Buildings Viewed Front-On → front façade true shape; sides recede to vanishing point.
Roads, Tunnels, Bridges → straight paths narrow into the distance.
4️⃣ Applications
Architectural drawings (interiors, streetscapes).
Urban design visualizations.
Fine arts and photography (framing depth).
Teaching perspective basics.
✅ In summary: One-point perspective is based on the principle that all receding lines converge at a single vanishing point on the horizon line, making it the simplest and most widely used perspective technique for depicting depth and distance.
Projection is a method of representing a three-dimensional object on a two-dimensional drawing surface (paper, screen) using straight lines drawn from the object to an imaginary plane.
The three main types of projections used in architecture, planning, and engineering are:
Orthographic Projection
Isometric Projection
Perspective Projection
1️⃣ Orthographic Projection
Definition: A method of representing objects by projecting perpendicular lines (orthogonal) from the object to the projection plane.
Characteristics:
Shows exact shape and size.
No distortion.
Multiple views (front, top, side) needed to fully describe object.
Applications: Engineering drawings, building plans, technical blueprints.
Orthographic views of different dimensions:
1D object (a line) → Appears as a line or point depending on orientation.
2D object (a square, triangle, circle) → Shows true shape (e.g., square as square, circle as circle) when parallel to projection plane.
3D object (cube, cylinder, cone) → Represented using multiple views:
Front view
Top view
Side view
📌 Example: A cube in orthographic projection is shown as three separate 2D views (square front, square top, square side).
2️⃣ Isometric Projection
Definition: A type of axonometric projection where the object is tilted so its three principal axes make equal angles (120°) with each other.
Characteristics:
Provides a pictorial 3D view.
Scale along each axis is equal, so proportions are preserved.
Parallel lines remain parallel (no vanishing point).
Anthropometry is the science of measuring the human body to understand dimensions, proportions, and functional requirements. For planners, architects, and designers, anthropometric data helps determine the minimum and optimum space needed for various activities such as sitting, walking, sleeping, cooking, or working.
Based on taller and bulkier populations (average male height ≈ 1.75–1.80 m, female ≈ 1.65–1.70 m).
Furniture dimensions, circulation space, and clearances are more generous.
Emphasis on privacy and personal space (higher per capita area in housing and offices).
Indian Standards
Based on shorter average height and leaner build (average male height ≈ 1.68 m, female ≈ 1.55 m).
Furniture and space requirements are slightly smaller in scale.
Greater space efficiency due to cultural habits (floor sitting, compact kitchens, shared bedrooms).
2️⃣ Space Requirements for Activities (Comparison)
Activity / Furniture
European & American Standard
Indian Standard (IS codes, CPWD norms, NBC)
Remarks
Sleeping (Bed)
Single bed: 2.0 × 1.0 m Double bed: 2.0 × 1.5 m
Single bed: 1.85 × 0.9 m Double bed: 1.85 × 1.35 m
Indian sizes smaller due to average body height
Chair Seating
Seat height: 0.45–0.48 m Seat depth: 0.45–0.50 m
Seat height: 0.40–0.43 m Seat depth: 0.40–0.45 m
Indian chairs slightly lower and shallower
Table / Desk
Height: 0.75–0.78 m
Height: 0.72–0.75 m
Adjusted to Indian anthropometry
Kitchen Worktop
Height: 0.90 m
Height: 0.82–0.85 m
Indian kitchens lower due to shorter average height
Toilet Seat
Height: 0.40–0.43 m
Height: 0.38–0.40 m
Western style seats slightly taller
Passage Width (one person)
0.90–1.0 m
0.75–0.9 m
Narrower passages common in Indian homes
Stair Dimensions
Riser: 150–170 mm Tread: 280–300 mm
Riser: 150–180 mm Tread: 250–300 mm
Indian standards allow slightly steeper stairs
Work Space per Office Desk
4.5–6 m²
3.5–4.5 m²
Indians adapt to smaller workspaces
Personal Space (social distance)
1.2–3.6 m (average American/European)
0.6–1.2 m (average Indian)
Reflects cultural acceptance of closeness
3️⃣ Cultural Influence on Space Use
Europe/USA
Beds and seating furniture are dominant.
Greater emphasis on private rooms.
Minimal floor seating.
India
Flexible use of furniture → beds may double as seating.
Floor seating and sleeping in many households.
Compact kitchens and multi-functional rooms are common.
4️⃣ Implications for Planners & Designers
Importing Western standards directly into Indian context often wastes space and resources.
Design must be localized → kitchens, toilets, furniture, and circulation areas need adjustments.
With globalization and lifestyle changes, Indian urban elites are shifting toward Western dimensions, but large segments of population still follow traditional compact patterns.
✅ In summary:
European & American standards assume taller, bulkier body sizes and emphasize more personal space.
Indian requirements are scaled down, reflecting smaller average body size, space efficiency, and cultural patterns like floor activities.
Planners and architects must balance ergonomics + cultural appropriateness while adapting standards.
In technical drawing and planning, a scale is used to represent large or small objects accurately on paper. Since it is not possible to draw everything in actual size, scales help convert real dimensions into manageable drawing sizes while preserving accuracy.
1️⃣ Plain Scale
Definition: A plain scale can represent only two units of measurement (for example: meters and decimeters, or kilometers and hectometers).
Construction: It consists of a straight line divided into main units and further subdivided into smaller parts.
Use: Suitable for readings up to one decimal place.
📌 Example: A plain scale might show meters on the main divisions and decimeters on the subdivisions.
2️⃣ Diagonal Scale
Definition: A diagonal scale can represent three units of measurement (for example: meters, decimeters, and centimeters).
Construction: A rectangle is drawn, divided horizontally into main units, and vertically into subdivisions. Diagonals are drawn across the small divisions, allowing very fine readings.
Use: Suitable for readings up to two decimal places, hence more precise than a plain scale.
📌 Example: A diagonal scale might show meters, decimeters, and centimeters all together, allowing accurate measurements.
3️⃣ Comparative Scale
Definition: Used to compare measurements in different systems of units (e.g., kilometers vs. miles, meters vs. yards).
Use: Helpful in international or interdisciplinary projects where unit systems differ.
📌 Example: A comparative scale could show kilometers and nautical miles side by side for transport planning.
4️⃣ Vernier Scale
Definition: A precise scale that uses a vernier device for measuring up to very fine accuracy.
Use: Allows readings much smaller than what a plain or diagonal scale can provide (used in instruments like vernier calipers, theodolites, etc.).
📌 Example: In surveying or detailed engineering drawings, a vernier scale helps achieve millimeter-level precision.
5️⃣ Scale of Chords
Definition: Used to measure and construct angles in drawings.
Use: Mostly in geometry and navigation-related drafting.
📌 Example: In absence of a protractor, a scale of chords can construct angles like 30°, 45°, 60°, etc.
🔑 Key Difference Between Plain & Diagonal Scales
Feature
Plain Scale
Diagonal Scale
Units represented
2 (main unit + subdivision)
3 (main unit + two subdivisions)
Accuracy
Up to 1 decimal place
Up to 2 decimal places
Construction
Simple divisions on a line
Rectangle with diagonals
Use
Quick, less detailed measurements
Precise measurements
✅ In summary:
Plain scales → simple, show two units.
Diagonal scales → more precise, show three units.
Comparative, vernier, and chord scales → used for specialized needs.
Sketching is a fundamental tool for planners, architects, and designers to visualize spaces and communicate ideas. Two key principles govern effective sketching: scale and proportion. Without them, drawings lose their accuracy, realism, and communicative power.
1️⃣ Concept of Scale
Scale is the mathematical relationship between the real-world size of an object and its representation on paper or digital media.
Architectural/Planning Scale:
Large-scale (e.g., 1:100) → Detailed sketches of buildings, streetscapes.
Human Scale: Relates built environments to human dimensions, ensuring comfort and usability.
📌 Example: A park sketch at 1:500 scale shows benches, pathways, and trees, while a city master plan uses 1:50,000 to highlight land-use zones.
2️⃣ Concept of Proportion
Proportion is the relative size of elements within a drawing or composition. Unlike scale (which is fixed), proportion ensures harmony and realism in how objects relate to one another.
Human Proportion:
Classical rule → An average adult is about 7–8 heads tall.
Body parts have ratios (arm span ≈ height, hand ≈ face length, etc.).
Object Proportion:
Buildings, trees, and vehicles should be sized relative to human figures for accuracy.
Contextual Proportion:
A lamppost must look taller than a person, but smaller than a building.
A bicycle should not appear larger than a car in the same sketch.
📌 Tip: Use reference grids or modules to maintain proportions consistently in quick sketches.
3️⃣ Sketching Human Figures & Activities
Planners often include people in sketches to show scale, liveliness, and usability of a space.
Standing Figures: Used as a height reference (average 1.6–1.8 m).
Sitting Figures: Depict benches, bus stops, outdoor seating.
Activity Sketches: Walking, cycling, children playing, vendors working—help illustrate how spaces function.
Silhouettes & Stick Figures: Quick, simplified human sketches are enough to convey movement and proportion.
4️⃣ Sketching Natural Elements
Trees: Represent scale of open spaces (small shrubs, medium trees, large canopy trees).
Water Bodies: Ripples, reflective shading, proportionate to surrounding context.
Topography: Hills, slopes, or natural barriers drawn in proportion to buildings and human figures.
5️⃣ Sketching Man-Made Elements
Street Furniture: Benches, lights, dustbins—scaled in relation to human use.
Vehicles: Cars, buses, bicycles—drawn in proportion to road width and pedestrian figures.
Buildings:
Door height (≈ 2 m) matches average human scale.
Windows, floors, and facades proportionally aligned with human activities.
6️⃣ Why Scale & Proportion Matter for Planners
✅ Ensures realism in communication.
✅ Helps stakeholders imagine the usability of proposed designs.
✅ Provides a relatable human connection to space.
✅ Avoids distortions that mislead design decisions.
🔑 In summary:
Scale = fixed ratio between real and drawing.
Proportion = harmonious relationship among parts. Together, they allow planners to sketch human figures, activities, and natural/man-made elements in a way that is accurate, relatable, and visually convincing.
🎨 Graphics Applications for Planners: The Power of Visual Communication
Urban and regional planning is as much about communicating ideas as it is about designing policies, strategies, and projects. Planners rely heavily on graphics, maps, and diagrams to make complex data understandable, and to influence decision-making. The thoughtful use of lines, colours, textures, and symbols transforms raw information into a narrative that is both engaging and precise.
1️⃣ Role of Lines
Lines are the most basic graphic element but carry strong meaning in planning illustrations:
Boundary Lines → Define jurisdictional areas (wards, zones, districts, states).
Connectivity Lines → Represent roads, railways, metro corridors, or pedestrian pathways.
Flow Lines → Show movement of people, goods, or traffic.
Thickness & Style: A thick solid line emphasizes importance (national highways), while dashed or dotted lines indicate proposed features, planning boundaries, or constraints.
📌 Example: In a transportation plan, thicker bold lines can highlight major highways, while thin dotted lines can denote proposed bus routes.
2️⃣ Role of Colours
Colour is a universal language that enhances readability and conveys emotions or priorities. In planning graphics:
Land-use Maps → Different colours symbolize land categories (green = open spaces, yellow = residential, purple = industrial, blue = water bodies).
Heat Maps → Gradient colours communicate density (light = low, dark = high).
Policy/Action Plans → Warm colours (red, orange) highlight urgency or danger, while cool colours (blue, green) denote calmness or sustainability.
📌 Tip: Maintain consistency—a park should always appear green, water blue, and industrial zones a contrasting tone. This helps non-expert stakeholders instantly grasp the message.
3️⃣ Supporting Graphic Elements
Textures & Patterns: Hatch marks or dotted fills distinguish overlapping land uses when colour is insufficient.
Symbols & Icons: Universally understood icons (tree = green space, hospital cross = healthcare, bus icon = transit) make maps intuitive.
Typography: Font size and weight signal hierarchy—city names bold, street names smaller, proposed projects italicized.
4️⃣ Why it Matters for Planners
Clarity → Visuals simplify complex data for decision-makers and the public.
Engagement → Colours and symbols draw attention and keep audiences interested.
Transparency → Well-designed graphics foster trust by making plans understandable.
Advocacy → Strong visuals strengthen a planner’s ability to persuade communities and policymakers.
✅ In essence: For planners, graphics are not just “decorations”—they are a planning tool in themselves. With careful use of lines, colours, and symbols, maps and diagrams can tell stories, reveal problems, and propose solutions in ways that words alone cannot.
In the Indian Council of Social Science Research (ICSSR) methodology, a field visit serves to provide scholars with practical experience in empirical research, exposing them to the realities of data collection, analysis, and report writing for studies on disadvantaged groups. Field visits help scholars understand the ontology and epistemology of social science research, develop skills in using quantitative and qualitative data, and gain insight into various social concepts like caste, tribe, and gender.
Key Purposes of Field Visits in ICSSR Research
Empirical Research Exposure: Field visits allow scholars to engage directly with the social realities they are studying, making the research process tangible.
Methodological Training: Scholars gain practical experience in data collection and analysis by interacting with the “field” and applying various research techniques.
Conceptual Understanding: Visits facilitate a deeper understanding of how concepts like caste, gender, religious minorities, and persons with disability are studied in their actual context.
Data Analysis Skills: Scholars learn to effectively use and analyze both quantitative and qualitative information obtained from the field.
Report Writing Skills: The practical experience gained during field visits aids scholars in their ability to review and write comprehensive research findings and analysis.
Addressing Societal Challenges: By promoting evidence-based research through such initiatives, ICSSR aims to help find solutions to contemporary social challenges in India.
Field visits in the ICSSR-sponsored Research Methodology courses are designed to provide practical exposure to scholars in applying research techniques beyond classroom learning. The objectives include:
Exposure to empirical settings: Understanding the social, cultural, and institutional realities of research subjects.
Application of research tools: Practicing data collection methods such as surveys, interviews, focus groups, and observations.
Understanding context: Linking theoretical methods to ground realities of communities, organizations, or projects.
Skill-building: Training participants in field note-taking, rapport building, ethical considerations, and real-time problem-solving.
Demonstration: Showing how sampling, questionnaires, or qualitative methods can be applied in real field settings.
2. Activities during a Field Visit
Depending on the theme of the Research Methodology course, field visits may include:
(a) Orientation and Briefing
Introduction about the field site (village, urban community, NGO, government department, research institution, etc.).
Explaining objectives, protocols, and ethical considerations.
(b) Data Collection Demonstration
Administering structured or semi-structured questionnaires.
Conducting in-depth interviews with key stakeholders.
Organizing focus group discussions (FGDs).
Demonstrating participant and non-participant observation techniques.
(c) Exposure to Institutions and Practices
Visits to government offices, archives, libraries, panchayats, or NGOs to understand record-keeping and governance processes.
Demonstration of participatory rural appraisal (PRA) or mapping techniques in community settings.
(d) Interaction with Respondents/Stakeholders
Engaging with villagers, workers, students, or officials.
Learning methods of rapport building and managing biases.
(e) Documentation and Reflection
Writing field notes.
Preparing reflective reports and discussions in the classroom after returning.
Linking field experiences with methodological concepts (sampling errors, reliability, validity, etc.).
3. Expenses That Can Be Shown
ICSSR provides financial assistance under its research methodology courses, including support for field visits. The following expenses can typically be shown:
(a) Travel Expenses
Bus/Train fare (second-class or sleeper class for participants, economy for faculty as per ICSSR norms).
Hired vehicle/tempo traveller/bus for collective field visit.
Local conveyance (auto, taxi, or shared transport to field site).
(b) Boarding and Lodging
If the field site is outside the host city, reasonable accommodation expenses for participants and faculty.
Meals/refreshments during the field visit.
(c) Stationery and Documentation
Photocopying questionnaires, interview schedules, or PRA sheets.
Notebooks, pens, or recording material used during fieldwork.
Printing ID cards or badges (if required).
(d) Honorarium / Token Payments
Honorarium to local resource persons (such as NGO representatives, local leaders, or government officials) for their time and guidance.
Token of appreciation for community members (sometimes given in the form of refreshments or small support items).
(e) Miscellaneous / Contingency
Refreshments/tea/snacks for respondents during focus groups or community meetings.
Photography or audio recording expenses (if needed for documentation and allowed under ethical guidelines).
Field assistance wages for local guides, translators, or helpers.
4. Documentation for Transparency
When reporting expenses to ICSSR, the following records should be maintained:
Travel bills (tickets, receipts, fuel bills if vehicle hired).
Accommodation bills (hotel/guest house receipts).
Honorarium receipts signed by recipients.
Stationery/printing bills with vendor details.
Signed attendance sheet of participants for the field visit.
✅ In summary: Field visits under ICSSR methodology courses focus on applying research tools in real-world contexts, including data collection, observation, and stakeholder interaction. Expenses that can be shown include travel, accommodation, meals, stationery, honorarium for resource persons, and minor contingencies — provided they are documented with receipts and follow ICSSR’s financial norms.
Writing an article for journal publication is a highly structured process that requires clarity, originality, and adherence to academic standards. A well-written article not only shares research findings but also contributes to the wider body of knowledge in a discipline. Below is a detailed discussion:
1. Purpose of Journal Articles
To communicate new research findings to the academic community.
To review existing literature and highlight gaps.
To propose new theories, models, or methods.
To inform policy makers, practitioners, and industries with evidence-based conclusions.
2. Steps in Writing an Article for Journal Publication
a. Choosing a Topic
Select a research area relevant to the journal’s scope.
Ensure the topic is original, timely, and significant.
b. Conducting Literature Review
Use libraries, indexing databases (Scopus, Web of Science, Google Scholar).
Summarize what is known, unknown, and needs exploration.
c. Structuring the Article
Most journals follow the IMRaD structure:
Title – Concise, informative, includes keywords.
Abstract – A summary (150–300 words) covering purpose, methods, results, and conclusions.
Introduction – Provides context, problem statement, objectives, and significance.
Methodology – Explains research design, data collection, sampling, tools, and analysis methods.
Results – Presents findings using tables, graphs, charts (objective presentation).
Discussion – Interprets findings, compares with existing studies, highlights implications.
Conclusion – Summarizes key results, limitations, and future research directions.
References – Cited according to the journal’s style (APA, MLA, Chicago, IEEE, etc.).
d. Following Journal Guidelines
Each journal has author guidelines (word count, format, referencing style, figure/table style).
Submissions outside the guidelines are often rejected outright.
e. Ethical Considerations
Avoid plagiarism (check similarity index).
Disclose conflicts of interest.
Follow proper citation and acknowledgment practices.
f. Proofreading and Editing
Revise for clarity, grammar, and flow.
Use peer review (ask colleagues to provide feedback).
Ensure figures and tables are properly labeled.
g. Submission and Peer Review
Submit via the journal’s online portal.
Respond to reviewer comments carefully and professionally.
3. Key Features of a Publishable Journal Article
Novelty: Adds new insights.
Relevance: Fits the journal’s readership.
Clarity: Written in precise and accessible language.
Evidence-based: Supported by data and credible references.
Objectivity: Free from personal bias.
4. Common Mistakes to Avoid
Submitting without aligning to the journal’s scope.
Weak literature review.
Overly descriptive results without analysis.
Poor English or formatting issues.
Ignoring reviewer feedback.
✅ In summary: Writing for journals requires discipline, strong research methodology, adherence to format, and careful revision. The goal is not just to write but to communicate research clearly, ethically, and effectively so it contributes meaningfully to the academic community.
An agenda is a written outline of topics to be discussed in a meeting. It helps participants prepare in advance and ensures that the meeting is conducted in an organized and time-bound manner.
Purpose of an Agenda
To provide a clear roadmap for the meeting.
To allocate time to each topic.
To keep discussions focused and avoid digressions.
To inform participants of their expected contributions.
Format of an Agenda
Heading
Name of the organization/institution.
Type of meeting (e.g., Annual General Meeting, Departmental Meeting).
Date, time, and venue of the meeting.
Title – “Agenda”
List of Items (in order of discussion)
Confirmation of the previous meeting’s minutes.
Matters arising out of previous minutes.
New issues or proposals.
Reports (financial, technical, progress updates).
Miscellaneous items.
Closing/adjournment.
Signature of the person issuing the agenda (e.g., Secretary/Chairperson).
Sample Agenda
ABC Engineering Ltd. Agenda for the Project Review Meeting Date: 5th September 2025 Time: 11:00 AM Venue: Conference Hall, Head Office
Welcome and introduction by the Chairperson
Review and approval of minutes from the last meeting
Progress report on ongoing projects
Discussion on new project proposals
Budget allocation for the next quarter
Any other business with the permission of the Chair
Vote of thanks and closure
Sd/- Secretary
2. Minutes of a Meeting
Minutes are the official written records of the proceedings of a meeting. They provide a summary of discussions, decisions, and actions taken.
Purpose of Minutes
To serve as a legal and official record.
To remind participants of decisions taken.
To provide accountability for follow-up actions.
To maintain organizational transparency.
Format of Minutes
Heading – Name of the organization and meeting type.
Date, time, and venue of the meeting.
List of participants (present/absent).
Agenda items discussed with summaries of decisions.
Resolutions passed (with voting results, if applicable).
Action items (who is responsible for what and deadlines).
Closing remarks and time of adjournment.
Signature of Chairperson/Secretary.
Sample Minutes
ABC Engineering Ltd. Minutes of the Project Review Meeting Date: 5th September 2025 Time: 11:00 AM Venue: Conference Hall, Head Office
Members Present: Mr. Rakesh Sharma (Chairperson), Ms. Kavita Rao (Secretary), Mr. Amit Kumar, Mr. John Smith
Members Absent: Mr. S. Gupta
Proceedings:
The meeting was called to order by the Chairperson at 11:05 AM.
Minutes of the previous meeting held on 10th August 2025 were confirmed.
Progress reports on ongoing projects were presented. The Chairperson appreciated the timely completion of Phase I.
New project proposals were discussed. It was resolved that a feasibility study would be conducted by the Technical Team by 30th September 2025.
Budget allocation of ₹50 lakhs for the next quarter was approved unanimously.
No other matters were raised.
The meeting concluded at 1:00 PM with a vote of thanks to the Chair.
Sd/- Ms. Kavita Rao (Secretary)
✅ Key Differences between Agenda and Minutes
Agenda = Before the meeting (plan of discussion).
Minutes = After the meeting (record of discussion and decisions).
1. Requests for Specifications and Business Enquiries
A business enquiry is a formal request for information about products, services, or processes. It is often the first step in establishing business relations.
Key Features of an Enquiry Letter
Clear subject line (e.g., Request for Technical Specifications of XYZ Equipment)
Subject: Request for Technical Specifications of Solar Panels

Dear Sir/Madam,

We are planning to install solar energy solutions in our upcoming housing project. Kindly provide us with the detailed technical specifications, warranty details, and pricing structure of your solar panels (Model: SPX-200).

We would also appreciate receiving information regarding bulk order discounts and delivery timelines.

Looking forward to your prompt response.

Yours faithfully,
[Name]
[Designation]
[Company Name]
2. Replies to Business Enquiries
A reply to an enquiry should be:
Prompt and professional
Clear in answering all requested details
Courteous, even if the request cannot be fulfilled
Example (Reply to Enquiry):
Subject: Specifications of Solar Panels (Model: SPX-200)

Dear Mr. Sharma,

Thank you for your enquiry regarding our Solar Panels, Model SPX-200. Please find attached the detailed technical specifications and price list.

We are pleased to inform you that bulk orders above 100 units are eligible for a 10% discount. Delivery can be made within 30 days of confirmation.

We look forward to serving your requirements and building a long-term business relationship.

Yours sincerely,
[Name]
Sales Manager
[Company Name]
3. Replies to Bidding for Tenders
Tenders are formal offers to supply goods or services under specified conditions. Replying to tenders involves submission of quotations, compliance with terms, and confirmation of eligibility.
Subject: Submission of Tender for Supply of Office Furniture

Dear Tender Committee,

With reference to your Tender No. OF-2025 dated 25 August 2025, we are pleased to submit our bid for the supply of office furniture.

Enclosed are:
1. Technical specifications of proposed furniture
2. Quotation with detailed pricing
3. Compliance certificate with eligibility criteria

We assure you of timely delivery and adherence to quality standards. Kindly consider our bid favorably.

Yours faithfully,
[Name]
Authorized Signatory
[Company Name]
4. Conduct of Meetings (Business/Official)
Meetings are an important part of formal communication in organizations, especially for decision-making, tender evaluation, or business negotiations.
Steps in Conducting a Meeting:
Notice of Meeting – sent in advance with agenda, date, time, and venue.
Agenda Preparation – list of topics/issues to be discussed.
Minutes of Meeting (MoM) – official written record of discussions and decisions.
Follow-up Actions – assigning responsibilities and ensuring implementation.
Example (Notice of Meeting):
Notice of Meeting

Date: 02 September 2025
To: All Department Heads

A meeting of the Tender Evaluation Committee will be held on 05 September 2025 at 11:00 AM in the Conference Hall.

Agenda:
1. Opening of tender bids
2. Review of technical specifications
3. Shortlisting of eligible suppliers
4. Any other matter

All concerned are requested to attend.

By Order,
[Name]
Secretary, Tender Committee
✅ In summary:
Enquiries = Requests for info/specifications
Replies to Enquiries = Providing clear, prompt responses
Tender Replies = Formal bids with compliance & quotations
Meetings = Conducted with notices, agendas, and minutes
Industrial waste management refers to the systematic handling, treatment, and disposal of waste generated by industries to minimize environmental and health hazards. Industrial waste can be solid, liquid, or gaseous, and may include hazardous chemicals, heavy metals, and toxic by-products. Effective management involves reduction at source, reuse, recycling, treatment, and safe disposal. Technologies such as effluent treatment plants (ETPs), incineration, and waste-to-energy conversion are widely used. Regulatory frameworks, like India’s Hazardous Waste Management Rules, mandate industries to adopt eco-friendly practices. The principles of 3Rs (Reduce, Reuse, Recycle), along with cleaner production methods, help minimize waste. Improper management leads to soil, air, and water pollution, endangering ecosystems and public health. Thus, sustainable industrial waste management is critical for balancing economic growth with environmental protection.
(b) Environmental Carrying Capacity
Environmental carrying capacity refers to the maximum population size or level of human activity that an environment can sustain without degrading its natural resources and ecological balance. It is determined by the availability of resources like water, land, air, and biodiversity, as well as the ability of ecosystems to absorb wastes and regenerate. When carrying capacity is exceeded, problems such as deforestation, pollution, biodiversity loss, and climate change occur. In urban planning, carrying capacity assessments guide policies on population density, infrastructure, and land use to prevent overexploitation. It is a key concept in sustainable development, emphasizing that economic and social progress must remain within ecological limits.
(c) Feminism and Feminist Movements
Feminism is a social and political ideology advocating for gender equality and the rights of women in all spheres of life. It challenges patriarchal structures, discrimination, and cultural norms that subordinate women. Feminist movements, which emerged strongly in the 19th and 20th centuries, can be categorized into waves: the first wave focused on suffrage and legal rights; the second wave on workplace equality, reproductive rights, and social reforms; the third wave emphasized diversity and intersectionality, and the fourth wave addresses digital activism and gender-based violence. In the environmental context, eco-feminism links the exploitation of nature with the oppression of women, advocating for both gender justice and ecological sustainability. Feminist movements continue to push for inclusive development, equal opportunity, and human rights.
(d) Biocentrism and Ecocentrism
Biocentrism is an ethical perspective that assigns intrinsic value to all living beings, regardless of their utility to humans. It promotes respect for individual organisms—plants, animals, and humans alike—and argues against practices that harm life unnecessarily. Ecocentrism, on the other hand, places value on ecosystems and the ecological whole rather than individual species. It emphasizes maintaining ecosystem balance, biodiversity, and the integrity of natural processes. While biocentrism is life-centered, ecocentrism is earth-centered. Both philosophies challenge anthropocentrism (human-centered thinking) and provide ethical bases for conservation, environmental laws, and sustainable policies. Together, they underline the need for a holistic relationship between humans and nature.
(e) Environmental Equity
Environmental equity refers to the fair distribution of environmental benefits and burdens among all people, irrespective of race, class, gender, or geography. It ensures that no community disproportionately suffers from pollution, resource depletion, or environmental hazards. The concept emerged strongly from environmental justice movements, especially in the U.S., where marginalized communities faced greater exposure to toxic industries and waste dumps. Environmental equity demands access to clean air, safe drinking water, healthy ecosystems, and participation in decision-making for all. In developing countries, it highlights disparities between urban and rural populations, or rich and poor, in access to natural resources. Achieving equity is vital for social justice and sustainable development.
(f) Role of Civil Society in Environmental Management
Civil society, including NGOs, community groups, academia, and media, plays a pivotal role in environmental management. It acts as a watchdog, ensuring accountability of governments and industries, and raises awareness about environmental issues. NGOs like Greenpeace and WWF mobilize campaigns against deforestation, pollution, and climate change. Local communities engage in conservation through initiatives like joint forest management and watershed development. Civil society also contributes by conducting research, providing policy recommendations, and promoting sustainable lifestyles. Movements such as the Chipko Movement in India demonstrate grassroots environmental activism. Moreover, civil society strengthens participatory governance, ensuring that marginalized voices are heard in environmental decision-making. Its role is crucial for bridging gaps between policy, implementation, and people.
Public policy making is the process through which governments design, implement, and evaluate decisions intended to address societal needs. Ideally, policies should be rational, evidence-based, and oriented toward the long-term welfare of citizens. However, in practice, policy formulation is constrained by political realities and economic limitations. Governments operate in complex environments shaped by competing interests, limited resources, ideological divides, and structural pressures.
Political and economic constraints influence not only the content of policies but also the pace of decision-making, the scope of implementation, and the effectiveness of outcomes. Understanding these constraints is essential for assessing why policies often deviate from their intended goals or fail to deliver expected results. This essay discusses in detail the political and economic constraints on policy making, their implications, and possible ways to address them.
Political Constraints on Policy Making
1. Electoral Pressures and Populism
Elected governments are heavily influenced by electoral cycles. Politicians often prioritize short-term, populist measures to secure votes rather than long-term structural reforms. For example, subsidies, loan waivers, or tax cuts may win immediate popularity but undermine fiscal stability and sustainable development. This short-termism hinders comprehensive and rational policy making.
2. Interest Groups and Lobbying
Powerful interest groups, such as industry associations, trade unions, or advocacy organizations, exert pressure on policymakers. Policies may reflect the demands of influential lobbies rather than the broader public interest. For instance, environmental regulations may be weakened due to pressure from industrial lobbies, even if stricter laws are necessary for ecological sustainability.
3. Bureaucratic Politics
The bureaucracy plays a central role in drafting and implementing policies. However, bureaucratic inertia, red tape, and turf wars between departments can delay or distort policy outcomes. Often, bureaucratic interests diverge from public needs, leading to incremental rather than transformative changes.
4. Coalition Governments and Political Fragmentation
In multiparty democracies, coalition governments are common. Policy decisions must accommodate diverse party agendas, which often results in compromise and diluted policies. Political fragmentation can slow down reforms and create policy paralysis, as seen in debates over land acquisition or labor reforms in India.
5. Ideological and Partisan Divides
Policies are shaped by ideological orientations of ruling parties. Left-leaning governments may emphasize welfare programs, while right-leaning ones focus on market liberalization. This ideological divide can lead to policy reversals whenever a new party comes to power, undermining policy continuity and stability.
6. Public Opinion and Media Influence
Public opinion, amplified by media and social networks, shapes the political feasibility of policies. Even well-designed but unpopular policies—such as fuel price hikes or pension reforms—may be abandoned due to public backlash. Politicians often prioritize policies that resonate with mass sentiment, even at the cost of economic rationality.
7. Corruption and Clientelism
Corruption diverts resources from intended beneficiaries and weakens public trust. Clientelism—where political support is exchanged for material benefits—distorts policy priorities, leading to inefficient allocation of resources. For instance, public funds may be diverted to projects that benefit select constituencies rather than society as a whole.
8. International Political Pressures
In a globalized world, national policies are influenced by international politics. Commitments under treaties (such as climate agreements) or pressures from global institutions (like the WTO or IMF) constrain domestic policy choices. Developing countries, in particular, may face limited autonomy in designing trade, fiscal, or environmental policies.
Economic Constraints on Policy Making
1. Scarcity of Resources
Governments face the fundamental constraint of limited resources. Financial, natural, and human resources are finite, and competing demands must be prioritized. Scarcity forces difficult trade-offs: more spending on defense may mean less for health or education.
2. Fiscal Deficits and Debt Burden
High fiscal deficits limit a government’s ability to launch new programs or expand existing ones. Similarly, a heavy debt burden constrains policy choices because significant revenues go toward debt servicing. This leaves limited fiscal space for welfare or developmental policies.
3. Inflation and Price Stability
Economic policies must consider inflationary pressures. Excessive government spending or subsidies can fuel inflation, reducing the purchasing power of citizens. Policymakers must balance growth-promoting expenditure with the need to maintain price stability.
4. Dependence on Foreign Aid and Investment
Developing countries often depend on external aid, loans, or foreign direct investment (FDI). Such dependence limits policy autonomy because donors and investors may attach conditions. For example, structural adjustment programs by the IMF in the 1980s required recipient countries to implement austerity and liberalization measures.
5. Global Economic Pressures
Globalization ties national economies to global markets. Economic crises, fluctuating oil prices, or recessions in major economies influence domestic policy space. For instance, during global recessions, governments may be forced to adopt austerity measures despite local needs for expansionary policies.
6. Regional Inequalities and Poverty
Persistent economic inequalities across regions and social groups constrain policy making. Governments must balance demands for equitable development with pressures for efficiency. Policies that benefit one group may be seen as discriminatory by others, complicating the design of inclusive programs.
7. Unemployment and Labor Market Constraints
High unemployment creates pressure for job-creation policies, often through public works or subsidies. However, these may not be sustainable in the long term. Similarly, rigid labor markets or resistance to reforms from trade unions constrain structural changes in labor policies.
8. Technological and Infrastructure Gaps
Economic constraints also arise from underdeveloped infrastructure, low productivity, and limited technological innovation. Policies promoting industrialization or digitalization may face hurdles if the economy lacks necessary foundations such as reliable power supply, skilled workforce, or digital access.
Interplay Between Political and Economic Constraints
Political and economic constraints are deeply interconnected:
Populist Policies vs. Fiscal Prudence: Electoral pressures often push governments to introduce subsidies or loan waivers, even when the fiscal situation is unsustainable.
Lobbying and Resource Allocation: Economic elites may influence political leaders to direct resources toward their interests, sidelining public welfare.
Globalization and Sovereignty: International economic integration reduces national policy autonomy, but political leaders must still justify such constraints to their domestic constituencies.
Reforms and Public Resistance: Economically necessary reforms (like labor or pension reforms) may be politically unpopular, leading to delays or dilution.
Thus, effective policy making requires balancing political feasibility with economic rationality.
Addressing Political and Economic Constraints
Institutional Strengthening Independent institutions such as election commissions, anti-corruption bodies, and public audit agencies can reduce political manipulation and enhance accountability.
Evidence-Based Policy Making Using scientific research, data analytics, and expert advice can counter populism and lobby-driven policies. Transparent communication of evidence helps gain public trust.
Inclusive Governance Ensuring participation of marginalized groups, civil society, and local communities in policy processes enhances legitimacy and reduces inequality.
Fiscal Discipline with Innovation Adopting sound fiscal policies while exploring innovative financing (public-private partnerships, green bonds) can ease resource constraints.
Policy Continuity Bipartisan consensus on critical reforms (such as health, education, or climate policies) reduces policy reversals across electoral cycles.
Global Cooperation Active participation in international organizations and multilateral forums ensures that external pressures are negotiated collectively rather than imposed unilaterally.
Conclusion
Policy making is inherently a complex process shaped by political dynamics and economic realities. Political constraints—such as electoral pressures, lobbying, and ideological divides—limit rational, long-term decision-making. Economic constraints—such as resource scarcity, fiscal deficits, and global market pressures—restrict what is practically feasible.
Yet, these constraints need not paralyze governance. With institutional reforms, transparent communication, fiscal innovation, and inclusive approaches, governments can design policies that balance political feasibility with economic rationality. Ultimately, the art of policy making lies in navigating these constraints to achieve sustainable and equitable development.
Non-Governmental Organizations (NGOs) play a vital role in addressing environmental challenges at local, national, and global levels. Unlike governments, NGOs operate independently, often bridging the gap between scientific research, policy-making, and grassroots activism. They raise awareness, mobilize communities, advocate for environmental justice, and provide innovative solutions to ecological problems. Among the countless environmental NGOs worldwide, two stand out for their international reputation and impact: Greenpeace International and the World Wide Fund for Nature (WWF).
Both organizations emerged in the second half of the twentieth century, a period when the world began to witness unprecedented environmental degradation, biodiversity loss, and threats of nuclear pollution. Over time, these NGOs became global leaders in campaigns to safeguard ecosystems, combat climate change, and promote sustainable development. This essay explores the origins, objectives, and principal activities of Greenpeace and WWF, while highlighting their contributions to environmental protection.
Greenpeace International
Background and Origins
Greenpeace International was founded in 1971 in Vancouver, Canada, by a small group of activists protesting against U.S. nuclear weapons testing near Alaska. They chartered a boat named “Phyllis Cormack” to sail into the test zone, aiming to draw global attention to the environmental and human dangers of nuclear testing. Their nonviolent but confrontational strategy attracted massive media coverage and public support. Over time, Greenpeace expanded its focus from nuclear issues to a wide range of environmental concerns such as climate change, deforestation, overfishing, and toxic pollution.
Today, Greenpeace operates as a global network with national and regional offices in more than 55 countries, coordinated by Greenpeace International based in Amsterdam, Netherlands.
Mission and Philosophy
Greenpeace’s mission is to “ensure the ability of the Earth to nurture life in all its diversity.” Its philosophy is built on nonviolent direct action, scientific research, and advocacy. By exposing environmental abuses and proposing solutions, Greenpeace aims to influence governments, corporations, and public opinion.
Principal Activities
Climate and Energy Campaigns Greenpeace strongly advocates for reducing greenhouse gas emissions, phasing out fossil fuels, and transitioning to renewable energy. It has campaigned against coal power plants, oil drilling in the Arctic, and nuclear power. Simultaneously, it promotes solar, wind, and decentralized renewable systems as sustainable alternatives.
Forests Protection Greenpeace campaigns against deforestation in critical ecosystems such as the Amazon, Congo Basin, and Southeast Asia. It pressures corporations to adopt deforestation-free supply chains, particularly in palm oil, soy, beef, and timber industries. It also works with indigenous communities to defend forest rights.
Oceans Conservation Overfishing and destructive fishing practices are central concerns for Greenpeace. The organization campaigns for the creation of marine protected areas, fights illegal fishing, and calls for global treaties to safeguard high seas biodiversity.
Food and Agriculture Greenpeace opposes genetically modified organisms (GMOs) and the overuse of chemical pesticides and fertilizers. It promotes ecological farming practices that protect soil, water, and biodiversity while ensuring food security.
Detoxing the Planet Greenpeace has exposed toxic pollution from industries such as electronics, fashion, and chemicals. Campaigns like “Detox My Fashion” pushed major clothing brands to eliminate hazardous chemicals from their supply chains.
Peace and Disarmament Staying true to its origins, Greenpeace continues to campaign against nuclear weapons and nuclear power, emphasizing the environmental and human risks of radioactive contamination.
Achievements
Played a key role in the adoption of a moratorium on commercial whaling by the International Whaling Commission in 1982.
Contributed to international agreements against dumping toxic waste at sea.
Pressured global corporations like Nestlé, Unilever, and Kimberly-Clark to commit to sustainable sourcing of palm oil and paper.
Advocated for a global ocean treaty under negotiation at the United Nations.
World Wide Fund for Nature (WWF)
Background and Origins
The World Wide Fund for Nature (WWF) was founded in 1961 in Morges, Switzerland, by a group of scientists, naturalists, and conservationists, including Sir Julian Huxley and Sir Peter Scott. Originally known as the World Wildlife Fund, its initial focus was wildlife conservation, particularly protecting endangered species such as the giant panda, which became its iconic logo.
Over the decades, WWF expanded its scope beyond species conservation to broader environmental issues, including climate change, sustainable development, and environmental education. Today, WWF operates in over 100 countries with more than 5 million supporters worldwide.
Mission and Philosophy
WWF’s mission is “to stop the degradation of the planet’s natural environment and to build a future in which humans live in harmony with nature.” Unlike Greenpeace, WWF adopts a less confrontational, more collaborative approach, working with governments, corporations, and local communities. It focuses on science-based conservation and long-term partnerships.
Principal Activities
Biodiversity Conservation WWF works to protect endangered species like tigers, elephants, rhinos, whales, and pandas. It establishes wildlife sanctuaries, anti-poaching patrols, and community-based conservation programs. It also campaigns against illegal wildlife trade.
Forest Conservation WWF runs programs to conserve tropical rainforests, boreal forests, and mangroves. It promotes sustainable forestry through initiatives like the Forest Stewardship Council (FSC), which certifies responsibly sourced timber and paper products.
Marine and Freshwater Conservation WWF works to protect coral reefs, wetlands, and river basins. It collaborates with local communities to manage freshwater resources sustainably and campaigns against plastic pollution in oceans.
Climate and Energy WWF is a leading advocate for global climate action. It promotes renewable energy, energy efficiency, and policies to reduce carbon emissions. The Earth Hour campaign, launched in 2007, encourages individuals and communities worldwide to switch off lights for one hour as a symbolic act of environmental awareness.
Sustainable Development WWF promotes sustainable agriculture, fisheries, and urban development. It works with businesses to reduce their ecological footprint and integrates conservation into economic planning.
Policy and Advocacy WWF engages in international negotiations on biodiversity, climate change, and sustainable development. It works closely with the United Nations, World Bank, and governments to shape environmental policies.
Achievements
Played a major role in the creation of the Convention on International Trade in Endangered Species of Wild Fauna and Flora (CITES, 1973).
Contributed to the establishment of protected areas in biodiversity hotspots such as the Amazon, Himalayas, and Coral Triangle.
Its Earth Hour campaign has grown into one of the world’s largest grassroots environmental movements.
Helped promote sustainable certification systems for forestry, fisheries (Marine Stewardship Council), and palm oil (Roundtable on Sustainable Palm Oil).
Comparative Perspective
While both Greenpeace and WWF are internationally renowned, they differ in their methods:
Greenpeace relies on nonviolent direct action, confrontation, and media attention to highlight environmental abuses and pressure governments or corporations.
WWF uses collaboration, partnerships, and long-term conservation programs grounded in scientific research.
Despite these differences, both have significantly influenced global environmental policy, raised public awareness, and contributed to protecting biodiversity and ecosystems. Together, they demonstrate the complementary roles NGOs can play—activism and advocacy on one hand, collaboration and conservation on the other.
Conclusion
The environmental challenges of the twenty-first century—climate change, deforestation, biodiversity loss, pollution—are too vast for governments alone to tackle. International NGOs like Greenpeace and WWF have emerged as indispensable actors in this global struggle. Through their campaigns, research, advocacy, and partnerships, they mobilize millions of people and resources to safeguard the planet.
While Greenpeace brings urgency through activism and confrontation, WWF builds enduring solutions through collaboration and conservation. Both approaches are essential in moving humanity toward a sustainable future. By continuing their work and adapting to new challenges, these NGOs will remain at the forefront of global environmental protection for generations to come.
Decision-making in development and environmental policy often involves trade-offs between economic growth, ecological preservation, and social welfare. To systematically evaluate these trade-offs, economists and planners use Cost-Benefit Analysis (CBA). CBA is a decision-support tool that compares the expected costs of a project or policy with its anticipated benefits, expressed in monetary terms, to determine whether it yields a net gain for society.
In environmental management, CBA helps policymakers evaluate whether activities such as dam construction, forest conservation, pollution control, or renewable energy projects create more benefits than costs when environmental and social impacts are considered.
Concept of Cost-Benefit Analysis
Cost-Benefit Analysis (CBA) is a systematic approach to evaluating the economic efficiency of projects or policies. It measures all the costs (expenditures, damages, or losses) and benefits (gains, savings, or avoided damages) associated with an action, discounted over time to reflect present value.
The general principle is:
If Benefits > Costs, the project is considered economically viable.
If Costs > Benefits, the project may be reconsidered, redesigned, or rejected.
Key Features of CBA
Monetization of Impacts: Both tangible and intangible impacts are expressed in monetary terms to enable comparison.
Time Dimension: Costs and benefits occurring in the future are discounted to present values using a discount rate.
Social Perspective: Unlike financial analysis (focused on profit for investors), CBA evaluates the broader impact on society, including externalities.
Decision Rule: A project is accepted if the Net Present Value (NPV = Benefits – Costs) is positive or if the Benefit-Cost Ratio (BCR) exceeds 1.
Steps in Conducting Cost-Benefit Analysis
Identification of the Project or Policy: Define the activity being evaluated (e.g., building a dam, creating a national park, introducing pollution control).
Listing of Costs and Benefits: Identify direct, indirect, and external costs/benefits.
Quantification: Estimate the magnitude of these impacts (e.g., hectares of forest lost, tons of CO₂ avoided).
Monetization: Assign monetary values using market prices or economic valuation techniques.
Discounting: Convert future costs and benefits into present values using an appropriate discount rate.
Comparison: Calculate Net Present Value (NPV), Internal Rate of Return (IRR), or Benefit-Cost Ratio (BCR).
Decision-making: Decide whether to proceed, modify, or reject the project.
Costs and Benefits in Environmental Context
Costs
Direct Costs: Construction expenses, operation, and maintenance costs.
Environmental Costs: Loss of biodiversity, deforestation, pollution, soil degradation.
Social Costs: Displacement of people, health hazards, loss of livelihoods.
Opportunity Costs: Alternative uses of land, water, or resources forgone.
Benefits
Direct Benefits: Agricultural productivity, energy generation, water supply.
Social Benefits: Employment generation, poverty alleviation, better health outcomes.
Avoided Costs: Damage avoided by preventing floods, soil erosion, or climate-related disasters.
Techniques of Environmental Valuation for CBA
A major challenge in environmental CBA is monetizing non-market goods (like clean air, biodiversity, or scenic beauty). Economists use specific techniques:
Market-Based Valuation: For goods traded in markets (timber, fish).
Replacement Cost Method: Cost of replacing lost ecosystem services (e.g., water treatment plants to replace natural wetlands).
Hedonic Pricing: Valuing environmental quality through differences in property prices (e.g., houses near green spaces).
Travel Cost Method: Estimating recreational value of forests, lakes, or parks by travel expenses incurred by visitors.
Contingent Valuation: Using surveys to ask people their willingness to pay (WTP) for preserving an environmental asset or willingness to accept (WTA) compensation for its loss.
Application of CBA in Environmental Management
1. Project Appraisal for Infrastructure Development
When evaluating large projects such as dams, highways, or industrial zones, CBA considers environmental impacts:
Example: A dam project may generate electricity (benefit) but submerge forests and displace communities (cost). CBA helps weigh whether benefits exceed costs when social and ecological values are included.
2. Pollution Control Policies
Governments use CBA to decide the stringency of pollution regulations. For instance, installing scrubbers in factories has costs, but the benefits include reduced health costs, fewer sick days, and improved ecosystem services.
3. Conservation Programs
CBA evaluates whether setting aside land for national parks, wildlife sanctuaries, or afforestation provides greater long-term benefits (tourism, carbon sequestration, biodiversity) compared to alternative land uses (mining or agriculture).
4. Climate Change Mitigation
Investments in renewable energy, energy efficiency, or carbon capture are evaluated through CBA by comparing upfront costs with benefits of reduced greenhouse gas emissions, avoided climate damage, and health improvements.
5. Urban Environmental Management
Policies like waste recycling programs, green transport systems, or rainwater harvesting can be analyzed using CBA to justify investments based on long-term savings and environmental gains.
Advantages of Using CBA in Environmental Management
Rational Decision-making: Provides a systematic framework for comparing alternatives.
Captures Externalities: Incorporates environmental and social costs often ignored in traditional economic analysis.
Resource Allocation: Helps prioritize projects with the greatest net social benefit.
Transparency: Makes trade-offs explicit, enabling public debate.
Policy Justification: Provides evidence-based support for environmental regulations and conservation initiatives.
Limitations and Challenges
Valuation Difficulties: Many environmental goods (biodiversity, cultural values) are hard to quantify in monetary terms.
Uncertainty and Risk: Long-term ecological impacts (like climate change) are uncertain, making projections difficult.
Choice of Discount Rate: High discount rates undervalue future environmental benefits, biasing decisions against conservation.
Distributional Issues: CBA focuses on aggregate net benefits but may ignore how costs and benefits are distributed across different social groups (e.g., displacement of indigenous people).
Ethical Concerns: Monetizing life, species, or ecosystems raises moral questions.
Conclusion
Cost-Benefit Analysis is a powerful tool for evaluating projects and policies, ensuring that economic development does not come at the expense of environmental sustainability. By monetizing environmental benefits and costs, it allows decision-makers to weigh trade-offs, allocate resources efficiently, and promote sustainable development.
However, CBA is not without limitations. Valuation challenges, uncertainty, discounting, and ethical concerns must be addressed carefully. In practice, CBA should be complemented with other approaches such as multi-criteria analysis, participatory decision-making, and precautionary principles to capture the broader social and ecological dimensions.
Applied judiciously, CBA can serve as a bridge between economics and ecology, helping society choose pathways that maximize human welfare while conserving the environment for future generations.
Forests are one of the most vital ecosystems that sustain human life, biodiversity, and the climate balance. They provide timber, fuelwood, fodder, non-timber forest produce (NTFP), water regulation, soil conservation, and a host of ecological services. For centuries, rural communities in India have been dependent on forests for their daily needs, making them critical stakeholders in conservation. Yet, forest management in India has historically been dominated by state control, leaving local communities excluded from decision-making. This led to widespread forest degradation, conflicts between state and people, and ecological crises.
In response to these issues, the concept of Joint Forest Management (JFM) emerged. JFM involves a partnership between local communities and the Forest Department to protect and manage forests on the basis of shared responsibilities and benefits. It aims to harmonize conservation with livelihood needs by recognizing the role of communities as co-managers of forest resources. This essay describes the concept of JFM, its background and emergence, and the challenges it faces in India today.
Concept of Joint Forest Management
Joint Forest Management is a participatory forest management system in which both the Forest Department and local village communities work together for the protection, regeneration, and sustainable use of forests. In return for their contribution, communities are granted usufruct rights such as fuelwood, fodder, and non-timber forest produce. In some states, they are also entitled to a share in timber revenue from mature harvests.
The core principles of JFM include:
Partnership: Collaboration between state and people for shared decision-making and responsibilities.
Benefit Sharing: Communities gain access to certain forest produce and a portion of profits from timber.
Sustainability: Forests are managed in a way that ensures ecological regeneration while fulfilling local needs.
Institutional Mechanism: Local-level bodies such as Forest Protection Committees (FPCs), Village Forest Committees (VFCs), or Van Samrakshan Samitis are established to coordinate activities.
Through JFM, forest management shifts from a purely state-controlled, top-down model to a participatory and decentralized approach.
Background for the Emergence of JFM
The idea of JFM did not emerge overnight. It evolved through historical, ecological, and socio-political developments in India:
1. Colonial Forest Policies
During British rule, forests were primarily managed for commercial exploitation. The Indian Forest Acts of 1865, 1878, and 1927 centralized authority with the state, treating local communities as intruders rather than partners. Customary rights were replaced by limited concessions, creating deep resentment and conflicts.
2. Post-Independence Forest Management
After 1947, the state retained central control. The National Forest Policy of 1952 emphasized industrial and commercial use of forests, again sidelining local needs. By the 1970s, large-scale deforestation and ecological imbalance became evident.
3. Environmental Movements
People’s movements like the Chipko Movement (1973, Uttarakhand) highlighted the ecological and social importance of forests. Local communities, especially women, resisted commercial felling and demanded participatory rights in forest governance. Such movements made policymakers realize that without community participation, conservation efforts would fail.
4. Degradation of Forest Resources
By the 1980s, forest degradation had become severe due to overexploitation, encroachments, and industrial demand. State-led afforestation projects failed because local communities did not feel ownership. A new approach was needed.
5. Arabari Experiment in West Bengal
The most significant milestone was the Arabari experiment (1972) led by forest officer A.K. Banerjee in the Arabari Forest Range of West Bengal. He involved local villagers in protecting degraded sal forests, offering them usufruct rights and 25% of timber profits. The experiment was highly successful, demonstrating that people would protect forests if they received tangible benefits.
6. National Guidelines for JFM (1990)
Inspired by Arabari’s success, the Government of India issued guidelines in 1990 directing states to involve communities in forest protection and management. States framed resolutions to implement JFM, establishing committees at the village level. This marked the formal institutionalization of JFM across the country.
Challenges Faced by JFM in India
Despite its promise, JFM faces multiple challenges that hinder its effectiveness:
1. Ambiguity of Rights and Benefits
The usufruct rights granted to communities are often unclear or inconsistent across states.
In many areas, communities are denied a fair share of timber revenue despite their efforts.
Delays and lack of transparency in benefit distribution create mistrust between villagers and forest departments.
2. Bureaucratic Control
Although JFM is meant to be participatory, forest departments retain dominant authority.
Village committees often function under the supervision of forest officials rather than as independent decision-making bodies.
This reduces genuine community empowerment and ownership.
3. Exclusion of Marginal Groups
Women, landless laborers, and marginalized castes—who depend most heavily on forests—are often excluded from committees or decision-making.
Elite capture by wealthier or dominant caste members leads to inequitable outcomes, undermining the inclusive spirit of JFM.
4. Sustainability of Participation
Initial enthusiasm wanes when benefits are delayed or meager.
Short-term livelihood needs (fuelwood, grazing) often clash with long-term conservation goals.
Migration of rural youth to cities also weakens community participation over time.
5. Weak Legal and Institutional Framework
JFM is based on government resolutions and executive orders, not strong legal mandates.
This makes it vulnerable to policy changes and inconsistent implementation across states.
Lack of institutional clarity over roles and responsibilities causes confusion.
6. Conflicts Over Benefit Sharing
Revenue sharing from timber harvests is often contested, with communities accusing departments of withholding or misusing funds.
Internal disputes within communities further weaken collective action.
7. External Pressures on Forests
Rising demand for timber, mining projects, infrastructure expansion, and population growth exert pressure on forests.
Climate change adds new threats such as forest fires, pests, and erratic rainfall, which local committees are ill-equipped to handle.
8. Monitoring and Accountability Issues
Weak monitoring systems lead to corruption, poor record-keeping, and mismanagement of funds.
Without accountability mechanisms, committees sometimes fail to deliver tangible benefits to all members.
Way Forward
To address these challenges and strengthen JFM, the following measures are crucial:
Legal Backing: JFM should be supported by strong legislation rather than temporary resolutions to provide communities with secure rights.
Empowerment of Communities: Forest committees must have genuine decision-making authority, with reduced bureaucratic dominance.
Inclusiveness: Special provisions should ensure active participation of women, landless households, and marginalized groups.
Transparency in Benefit Sharing: Clear rules and digital record systems should be introduced to ensure fair and timely distribution of revenue.
Capacity Building: Training in sustainable forest management, financial literacy, and conflict resolution can strengthen committees.
Integration with Livelihood Programs: JFM should be linked with eco-tourism, non-timber forest produce enterprises, and skill development to increase community incentives.
Climate Resilience: Incorporating climate-smart practices like agroforestry, fire management, and watershed protection can enhance the sustainability of JFM.
Conclusion
Joint Forest Management represents a paradigm shift in India’s forestry—from exclusionary, state-centric models to participatory approaches that recognize the role of local communities. Emerging out of ecological crises, people’s movements, and pioneering experiments like Arabari, JFM has been institutionalized as a national program since the 1990s. It has contributed to forest regeneration, improved people-forest relations, and provided livelihoods in many regions.
However, the potential of JFM has not been fully realized due to challenges such as unclear rights, bureaucratic dominance, elite capture, and weak institutional frameworks. For JFM to succeed in the long term, it must evolve into a truly participatory and equitable system, where communities are empowered as genuine partners in conservation. Strengthening legal frameworks, ensuring inclusiveness, and linking forest management with sustainable livelihoods are essential steps.
Ultimately, JFM is not just about managing forests but about building a new social contract between people and nature, where conservation and livelihoods reinforce each other. In a country like India, where millions depend on forests, the success of JFM is critical for both ecological sustainability and social justice.
Urban environments are under increasing pressure due to population growth, rapid industrialization, rising vehicular traffic, and unsustainable consumption patterns. This has resulted in challenges such as air and water pollution, inadequate waste management, shrinking green spaces, and deteriorating quality of life. While government policies and large-scale urban planning interventions play an essential role, individuals and communities also hold significant responsibility in shaping sustainable cities. Small but consistent efforts at the household and neighborhood level can collectively make a major difference in improving the urban environment.
This essay analyzes five key individual and community initiatives that contribute to healthier, cleaner, and more sustainable urban environments. It also reflects on initiatives that can be taken in my own area to address environmental challenges.
1. Waste Management and Recycling
Individual Initiatives
Households can adopt practices such as segregation of waste at the source into biodegradable, recyclable, and non-recyclable categories. Composting kitchen waste through simple home composting units reduces the burden on municipal waste systems and provides nutrient-rich manure for plants. Avoiding single-use plastics, reusing containers, and donating unused items are other individual actions that minimize waste generation.
Community Initiatives
Communities can organize collective waste management programs, such as neighborhood composting pits, e-waste collection drives, and partnerships with recycling firms. Resident Welfare Associations (RWAs) or community groups can enforce rules for segregation, promote awareness, and set up local recycling centers. Examples include community composting projects in cities like Bengaluru, where citizen-led initiatives process tons of organic waste daily.
Impact
Effective waste management reduces landfill pressure, curbs pollution, lowers greenhouse gas emissions, and creates a cleaner urban landscape. It also fosters a culture of responsibility and resource efficiency.
2. Promoting Sustainable Mobility
Individual Initiatives
Individuals can reduce their carbon footprint by opting for walking, cycling, carpooling, or using public transport instead of private vehicles. For short distances, cycling or walking not only saves fuel but also promotes health. Choosing fuel-efficient or electric vehicles is another significant step.
Community Initiatives
Communities can advocate for improved public transportation facilities, bicycle lanes, and pedestrian-friendly infrastructure. Carpool networks within neighborhoods, company employee groups, or schools can reduce traffic congestion and pollution. Initiatives such as “no-car days” or community bicycle-sharing schemes encourage collective action.
Impact
Sustainable mobility improves air quality, reduces noise pollution, lowers traffic congestion, and enhances the liveability of cities. It also encourages healthier lifestyles through active transport modes like cycling and walking.
3. Greening and Biodiversity Enhancement
Individual Initiatives
Individuals can contribute to greening efforts by planting trees in home gardens, balconies, or rooftops. Rooftop and vertical gardens also help mitigate the urban heat island effect, improve air quality, and conserve energy by reducing cooling needs.
Community Initiatives
Community-level initiatives include organizing tree-planting drives, maintaining local parks, and creating urban biodiversity zones. Schools, RWAs, and NGOs can collaborate with municipal authorities to plant native species, maintain community gardens, and protect urban wetlands. Initiatives like “Adopt a Park” programs encourage residents to take ownership of public green spaces.
Impact
Green cover in urban areas reduces air pollution, enhances biodiversity, provides recreational spaces, and contributes to physical and mental well-being. Communities benefit from improved aesthetics and stronger social cohesion through shared green projects.
4. Water Conservation and Management
Individual Initiatives
Water conservation starts at home through practices like fixing leakages, using water-efficient fixtures, reusing greywater, and harvesting rainwater. Individuals can also practice mindful consumption—turning off taps when not in use and avoiding water wastage.
Community Initiatives
Communities can establish rainwater harvesting structures in apartments, schools, and community buildings. Collective efforts such as watershed management, revival of urban lakes, and groundwater recharge pits are highly effective in cities facing water scarcity. Community campaigns can also raise awareness about water pollution and promote sustainable water use.
Impact
Water conservation ensures long-term availability of freshwater, reduces dependence on depleting groundwater reserves, and enhances resilience against droughts. Community management of local water bodies helps prevent encroachment and pollution.
5. Energy Conservation and Renewable Energy Adoption
Individual Initiatives
Households can conserve energy by switching to energy-efficient appliances (LED lights, star-rated devices), using solar water heaters, and reducing unnecessary electricity consumption. Rooftop solar panels allow individuals to generate their own renewable energy, reducing dependence on fossil fuels.
Community Initiatives
Communities can implement energy audits for residential complexes, install solar panels in common areas, and adopt energy-efficient lighting for streets and public spaces. Collective bulk purchasing of solar panels or efficient appliances can reduce costs. Local campaigns on energy awareness can further spread the culture of conservation.
Impact
Energy conservation reduces greenhouse gas emissions, lowers electricity bills, and promotes sustainable urban growth. Renewable energy adoption helps cities transition toward carbon neutrality and combats climate change.
Initiatives I Can Take in My Area
In my own area, urban challenges such as improper waste disposal, traffic congestion, and reduced greenery are evident. As an individual and part of a community, I can contribute in the following ways:
Household Waste Segregation and Composting: I can begin segregating waste at home into dry and wet categories, composting organic waste, and encouraging my neighbors to do the same. I can also participate in organizing community recycling campaigns.
Promoting Sustainable Transport: For short distances, I can walk or cycle instead of using a vehicle. I can also initiate discussions in my community to start a carpooling system, particularly for children going to schools and for office commuters.
Tree Plantation and Green Spaces: I can plant native trees around my house and encourage rooftop gardening. With local residents, I can participate in “adopt a park” schemes to maintain nearby public parks and plant more trees.
Rainwater Harvesting: At the household level, I can install a simple rainwater harvesting system to collect roof runoff for garden use. At the community level, I can advocate for larger systems in apartment complexes.
Energy Conservation: I can reduce energy consumption by using LED lighting, turning off devices when not in use, and promoting rooftop solar energy adoption in my housing society.
Through consistent individual action and collaboration with neighbors, these initiatives can lead to cleaner surroundings, reduced pollution, improved green spaces, and a healthier urban ecosystem.
Conclusion
Urban environmental challenges cannot be solved by governments alone; they require active participation of individuals and communities. The five initiatives—waste management, sustainable mobility, greening, water conservation, and energy conservation—demonstrate how local actions can create significant positive impacts. By adopting eco-friendly lifestyles, encouraging collective efforts, and fostering a sense of responsibility, individuals and communities can transform urban areas into sustainable, resilient, and liveable spaces.
Ultimately, the future of cities depends not only on policy and planning but also on the everyday choices and initiatives of their residents. By taking responsibility in our own areas, we contribute to the global movement for sustainable urban development.
Poverty remains one of the most pressing challenges for sustainable development, particularly in rural areas where agriculture is the primary source of livelihood. According to the World Bank, nearly 80% of the world’s poor live in rural regions, where limited access to education, health care, markets, and infrastructure perpetuates cycles of deprivation. Rural poverty is multidimensional—it is not only about low income but also about inadequate access to basic services, social exclusion, and vulnerability to shocks such as droughts, floods, and market fluctuations.
Over the years, governments, international organizations, and civil society have adopted a variety of measures to alleviate rural poverty. These measures can be broadly classified into agricultural development, rural infrastructure, social protection, employment generation, microfinance and credit, education and skill development, and institutional reforms. This essay provides a detailed analysis of these measures, their effectiveness, and the challenges in their implementation.
1. Agricultural Development
(a) Increasing Productivity
Agriculture is the backbone of rural economies. Enhancing agricultural productivity through improved seeds, irrigation, fertilizers, and mechanization directly increases farmers’ income. Programs such as the Green Revolution in India demonstrated how technological innovation could transform food security and reduce poverty, although with mixed environmental consequences.
(b) Diversification of Agriculture
Moving beyond subsistence farming to high-value crops such as fruits, vegetables, dairy, and poultry helps increase rural incomes. Diversification reduces risks from crop failure and creates new market opportunities.
(c) Access to Inputs and Extension Services
Providing farmers with affordable credit, subsidies, and training through agricultural extension services ensures that they adopt modern techniques effectively. For example, digital platforms now play a role in disseminating market and weather information to rural farmers.
2. Rural Infrastructure Development
(a) Roads and Transport
Improved rural roads enhance connectivity, reduce transaction costs, and increase farmers’ access to markets, schools, and health services. The Pradhan Mantri Gram Sadak Yojana (India) is a classic example of rural road connectivity reducing poverty levels by integrating isolated villages with broader markets.
(b) Electrification
Access to electricity enables irrigation, cold storage, food processing, and small-scale industries. Electrification also improves education and health outcomes, contributing indirectly to poverty alleviation.
(c) Water Supply and Sanitation
Safe drinking water and sanitation facilities reduce health-related expenses and improve productivity. Rural water supply schemes and the Swachh Bharat Mission (India) highlight how infrastructure improves both quality of life and economic potential.
3. Social Protection and Welfare Measures
(a) Direct Income Support
Cash transfers, subsidies, and pensions provide immediate relief to vulnerable households. Conditional cash transfers, used in Latin America (e.g., Bolsa Família in Brazil), tie benefits to education and health, creating long-term human capital gains.
(b) Food Security Programs
Subsidized food distribution through mechanisms like India’s Public Distribution System (PDS) ensures that basic nutritional needs are met, protecting households from extreme deprivation.
(c) Insurance Schemes
Rural households are vulnerable to risks such as crop failure, illness, and natural disasters. Crop insurance, health insurance, and weather-based insurance schemes reduce vulnerability and prevent households from falling deeper into poverty.
4. Employment Generation Programs
(a) Public Works Programs
Rural employment schemes provide jobs during agricultural off-seasons. The Mahatma Gandhi National Rural Employment Guarantee Act (MGNREGA) in India guarantees 100 days of employment to rural households, enhancing income security while also creating rural assets like ponds, roads, and irrigation channels.
(b) Promotion of Rural Non-Farm Employment
Developing small-scale industries, handicrafts, and service activities diversifies rural livelihoods. Cottage industries, food processing, and eco-tourism are avenues that create employment outside agriculture.
5. Microfinance and Access to Credit
(a) Microfinance Institutions (MFIs)
Access to small loans enables rural households to invest in income-generating activities, education, and health. The Grameen Bank in Bangladesh, pioneered by Muhammad Yunus, demonstrated how microcredit could empower poor women and lift families out of poverty.
(b) Self-Help Groups (SHGs)
SHGs, particularly in South Asia, promote collective savings and access to loans. They also foster women’s empowerment, social solidarity, and community-based development.
(c) Financial Inclusion
Programs like Jan Dhan Yojana in India promote banking access for the poor, enabling them to receive direct benefits, save securely, and access credit facilities.
6. Education and Skill Development
(a) Basic Education
Education reduces poverty by equipping individuals with skills for better jobs and higher productivity. Expanding rural schools and mid-day meal programs improves attendance and literacy rates.
(b) Vocational Training
Skill development programs aligned with rural industries (carpentry, tailoring, food processing, ICT skills) prepare youth for diversified livelihoods. Initiatives like India’s Skill India Mission aim to train millions in employable skills.
(c) Adult Literacy and Lifelong Learning
Programs for adult education ensure that even older populations benefit from literacy, financial literacy, and digital literacy, helping them make informed decisions.
7. Land and Institutional Reforms
(a) Land Redistribution
Equitable access to land ensures that marginalized groups have productive assets. Land reforms in countries like South Korea and Taiwan historically reduced rural poverty by empowering smallholders.
(b) Tenancy Reforms and Security of Tenure
Providing secure land tenure encourages farmers to invest in their land, improving productivity and income.
(c) Strengthening Local Institutions
Decentralization and empowering rural local governments (such as Panchayati Raj Institutions in India) ensures that poverty alleviation measures are tailored to local needs.
8. Role of Technology and Innovation
(a) Digital Inclusion
Mobile banking, e-governance, and digital marketplaces (like e-NAM in India) reduce information asymmetry and provide rural producers with better access to markets.
(b) Renewable Energy Solutions
Solar-powered irrigation pumps, biogas plants, and decentralized renewable energy reduce dependence on costly fossil fuels and create new income opportunities.
(c) ICT for Development
Telemedicine, online education, and agricultural advisory apps bring essential services to remote areas, reducing the rural-urban divide.
Challenges in Alleviating Rural Poverty
Despite multiple measures, rural poverty remains stubbornly high in many parts of the world. The key challenges include:
Inequality of Access: Benefits of programs often bypass marginalized groups due to corruption, lack of awareness, or bureaucratic hurdles.
Environmental Stress: Climate change, land degradation, and water scarcity undermine rural livelihoods.
Migration Pressures: Outmigration of youth reduces the agricultural labor force, while remittances are often not invested productively.
Gender Disparities: Women face limited access to land, credit, and decision-making roles despite being central to rural economies.
Implementation Gaps: Poor monitoring, leakages, and lack of accountability dilute the impact of well-designed schemes.
Way Forward
To make poverty alleviation in rural areas more effective, the following steps are crucial:
Integrated Rural Development: Programs must combine agriculture, infrastructure, education, and health in a holistic way rather than in silos.
Climate-Resilient Agriculture: Promoting sustainable practices like organic farming, agroforestry, and water harvesting to address environmental challenges.
Inclusive Growth: Ensuring that women, marginalized castes, indigenous groups, and landless laborers are prioritized in program design.
Strengthening Governance: Transparent, accountable institutions with community participation are necessary to reduce leakages.
Leveraging Technology: Scaling up digital inclusion, renewable energy, and ICT innovations can revolutionize rural livelihoods.
Conclusion
Alleviating poverty in rural areas is both a developmental necessity and a moral obligation. The persistence of rural poverty undermines national growth, perpetuates inequality, and poses social and political risks. Over decades, measures such as agricultural development, rural infrastructure, employment schemes, microfinance, education, and institutional reforms have made significant strides in reducing poverty.
However, rural poverty is a multidimensional challenge that demands integrated, inclusive, and sustainable solutions. Future efforts must combine traditional strategies with innovative approaches that address climate change, digital inclusion, and social equity. With coordinated action, rural areas can be transformed into hubs of opportunity, resilience, and prosperity, thereby fulfilling the larger goal of sustainable and inclusive development.
Sustainable development has become one of the most significant concepts in the global policy discourse since the 1980s. Defined famously by the Brundtland Commission Report (1987) as “development that meets the needs of the present without compromising the ability of future generations to meet their own needs,” it highlights the interconnectedness of economic growth, social progress, and environmental protection. This recognition of interconnectedness paved the way for a more holistic approach in managing environmental resources, later formalized as Integrated Environment Management (IEM).
IEM reflects the understanding that environmental issues cannot be addressed in isolation; they are linked with economic development, governance, cultural values, and social equity. The emergence of IEM is thus deeply rooted in the principles of sustainable development, which emphasize long-term ecological balance, intergenerational equity, and integrated planning.
This essay examines how sustainable development led to the idea of integrated environment management, tracing the historical context, theoretical underpinnings, and practical applications of the concept.
The Evolution of Sustainable Development
The journey towards sustainable development can be divided into key milestones:
Early Concerns (1960s–1970s): Environmental concerns gained prominence after the publication of Rachel Carson’s “Silent Spring” (1962) and the Club of Rome’s “Limits to Growth” (1972). These works highlighted the ecological damage caused by unregulated industrial growth, pollution, and population pressures.
Global Recognition (1980s): The World Conservation Strategy (1980) by the International Union for Conservation of Nature (IUCN) was one of the earliest global attempts to link conservation with development. The Brundtland Commission’s Report (1987) brought sustainable development into mainstream discourse, emphasizing the integration of environment and development.
Institutionalization (1992 onwards): The Rio Earth Summit (1992) formalized the concept, leading to Agenda 21, the UN Framework Convention on Climate Change, and the Convention on Biological Diversity. These initiatives emphasized the need for integrated approaches to development planning and environmental protection.
Sustainable Development Goals (2015): The adoption of the UN Sustainable Development Goals (SDGs) further reinforced integration, calling for coordinated action across sectors such as climate change, water, energy, urbanization, and biodiversity.
These developments underscored that development cannot be sustainable if environmental degradation continues unchecked. The realization that ecological health, economic prosperity, and social well-being are inseparable gave rise to the idea of integrated management.
The Link Between Sustainable Development and Integrated Management
Sustainable development demands balance across three pillars—economic, social, and environmental. This balance cannot be achieved through fragmented policies or sectoral approaches, which often lead to trade-offs and unintended consequences. For example, promoting industrial growth without considering pollution impacts undermines environmental sustainability. Similarly, focusing on conservation without addressing livelihood needs creates social inequality.
Thus, the sustainable development paradigm naturally leads to the idea of integration—a management approach that ensures harmony across sectors and interests. Integrated Environment Management (IEM) embodies this logic by emphasizing:
Holistic Planning: Recognizing the interlinkages between land, water, air, and biodiversity.
Stakeholder Participation: Involving governments, communities, industries, and civil society in decision-making.
Long-term Perspective: Incorporating intergenerational equity and precautionary principles.
Cross-sectoral Coordination: Aligning policies of environment, health, agriculture, transport, and industry.
Sustainable development is thus not merely about conserving resources but about rethinking governance structures to manage the environment as a shared and interconnected system.
Integrated Environment Management (IEM): Definition and Principles
Integrated Environment Management (IEM) refers to a framework that coordinates policies, plans, and practices across different sectors and levels of governance to ensure sustainable use of natural resources while supporting human development.
Its key principles include:
Integration: Policies for environment, economy, and society must be interlinked.
Participation: Decisions should involve all stakeholders, including local communities.
Equity: Both intra-generational and inter-generational equity must be considered.
Precaution: Uncertainty should not delay action to prevent environmental harm.
Sustainability: Natural systems must be maintained to support long-term development.
The concept was influenced by sustainable development discourses, especially after the Brundtland Report and the Earth Summit, which highlighted the failures of sectoral management approaches.
From Sustainable Development to IEM: The Logical Progression
Recognition of Interdependence: Sustainable development highlighted that environmental degradation undermines economic growth and social progress. For instance, deforestation leads to loss of livelihoods, biodiversity, and climate stability. IEM emerged as a way to operationalize this recognition through coordinated management.
Shift from Reactive to Proactive Approaches: Early environmental policies were reactive—focused on controlling pollution after it occurred. Sustainable development encouraged proactive measures such as planning, prevention, and conservation. IEM institutionalized this shift by promoting strategic environmental assessments, integrated planning, and adaptive management.
Need for Institutional Coordination: Traditional governance structures managed sectors—water, forestry, agriculture—independently, leading to conflicts and inefficiencies. Sustainable development’s call for integration required a management system that breaks silos. IEM provides that mechanism.
Inclusion of Stakeholders: Sustainable development stressed participation and equity, particularly the involvement of local communities and marginalized groups. IEM operationalizes this principle by emphasizing participatory decision-making, community-based resource management, and transparency.
Global to Local Linkages: Sustainable development connected global challenges such as climate change with local actions. IEM reflects this by aligning international commitments (like the Paris Agreement) with local environmental management practices.
Examples of IEM in Practice
Integrated Water Resource Management (IWRM): Inspired by sustainable development principles, IWRM treats water as a finite resource linked with agriculture, industry, health, and ecosystems. It integrates demand management, conservation, and stakeholder participation.
Coastal Zone Management: Sustainable development’s call to balance ecological protection with economic use (fisheries, tourism, ports) has led to integrated coastal zone management programs worldwide.
Urban Planning and SDGs: Integrated urban environment management incorporates waste management, public transport, green spaces, and energy efficiency to create sustainable cities. The Delhi Metro, for example, is not just a transport system but a tool for reducing pollution and promoting sustainable urban growth.
National Environmental Policy (India, 2006): Influenced by sustainable development, it emphasizes integration of environmental concerns into all developmental policies, reflecting IEM principles.
Challenges in Implementing IEM
While the connection between sustainable development and IEM is strong, implementation faces obstacles:
Institutional Fragmentation: Ministries and agencies often operate in silos.
Lack of Political Will: Short-term economic gains overshadow long-term sustainability.
Resource Constraints: Developing countries face financial and technical limitations.
Data and Knowledge Gaps: Integrated decisions require reliable data across sectors.
Stakeholder Conflicts: Balancing interests of industries, communities, and conservation groups is complex.
Despite these challenges, the growing emphasis on climate action, biodiversity conservation, and the SDGs strengthens the case for IEM.
Conclusion
Sustainable development fundamentally altered the way humanity perceives the relationship between development and environment. By stressing integration, equity, and long-term ecological balance, it revealed the inadequacy of fragmented approaches to environmental management. Out of this realization emerged Integrated Environment Management (IEM), a practical framework for harmonizing economic, social, and ecological objectives.
IEM operationalizes the ideals of sustainable development by promoting holistic planning, cross-sectoral coordination, stakeholder participation, and proactive management. While implementation challenges remain, the concept has become central to global and national environmental governance.
Thus, sustainable development not only provided the philosophical foundation but also the practical necessity for integrated environment management. In an era of climate change, biodiversity loss, and rapid urbanization, the success of global sustainability efforts will depend on how effectively societies embrace and implement IEM.
Cooperatives are member-owned organisations based on principles of collective ownership, democratic control, and equitable distribution of benefits. They play a significant role in promoting sustainable development by integrating economic growth, social equity, and environmental protection.
Economically, cooperatives empower local communities by providing access to credit, markets, and resources. For example, the Amul Dairy Cooperative in Gujarat transformed rural livelihoods by ensuring fair prices for farmers while reducing middlemen exploitation. Similarly, cooperatives in microfinance enable inclusive growth by supporting small entrepreneurs and women-led enterprises.
Socially, cooperatives promote community participation and reduce inequalities. They create employment, enhance skill development, and empower marginalised groups, aligning with SDGs related to poverty eradication (SDG 1), gender equality (SDG 5), and decent work (SDG 8).
Environmentally, cooperatives contribute to sustainability through initiatives like community forestry cooperatives in Nepal, which balance conservation with livelihood needs, and renewable energy cooperatives in Europe that encourage local adoption of solar and wind energy.
By combining democratic governance with sustainable business practices, cooperatives represent an alternative development model that is inclusive, equitable, and environmentally conscious, making them a vital instrument in achieving the goals of sustainable development.
(b) Concept of Harnessing Technology in Sustainable Development
Harnessing technology for sustainable development refers to using scientific and technological innovations to balance economic growth with environmental protection and social equity. Technology acts as both a driver of unsustainable practices and a solution to overcome them.
In the energy sector, renewable technologies such as solar, wind, and hydropower reduce dependence on fossil fuels, cutting greenhouse gas emissions and mitigating climate change. In agriculture, precision farming, drip irrigation, and biotechnology enhance productivity while conserving water and soil fertility.
Information and communication technologies (ICTs) promote sustainable development by enabling e-governance, telemedicine, digital education, and early-warning systems for disasters. Smart cities use technology for efficient transport, waste management, and energy use, improving urban sustainability.
However, technology must be applied responsibly. Overreliance on resource-intensive technologies can lead to new environmental problems, such as e-waste. Bridging the digital divide is essential to ensure that technological benefits are equitably shared, especially in developing countries.
Ultimately, harnessing technology for sustainability requires innovation, inclusivity, and regulation. When guided by ecological limits and ethical principles, technology becomes a transformative force that accelerates progress toward the United Nations’ Sustainable Development Goals (SDGs).
(c) Initiatives of the South Asian Countries towards the Betterment of the Environment
South Asia faces severe environmental challenges—air and water pollution, deforestation, biodiversity loss, and climate vulnerability. In response, countries in the region have launched several initiatives to protect the environment and promote sustainability.
India: Enacted the National Action Plan on Climate Change (NAPCC) with missions on solar energy, energy efficiency, and sustainable habitat. Large-scale afforestation projects like the Green India Mission aim to restore ecosystems. The Swachh Bharat Mission promotes sanitation and waste management.
Bangladesh: Implemented the Climate Change Strategy and Action Plan, focusing on adaptation measures such as cyclone shelters and coastal embankments. Bangladesh is also a leader in solar home systems for rural electrification.
Nepal: Promotes community forestry programs, empowering local groups to manage forests sustainably while improving rural livelihoods.
Bhutan: Pursues a unique model of development based on Gross National Happiness, maintaining carbon neutrality through hydropower and forest conservation.
Sri Lanka: Introduced policies for renewable energy development and biodiversity conservation, especially in coastal ecosystems.
Pakistan: Launched the “Ten Billion Tree Tsunami” program to combat deforestation and climate change impacts.
Collectively, these initiatives highlight the region’s efforts to balance development with ecological sustainability. Regional cooperation under SAARC also promotes shared strategies for climate adaptation and environmental management.
(d) Integration of Scientific and Traditional Knowledge for Sustainable Development
Sustainable development requires an integration of scientific advancements with traditional knowledge systems, ensuring solutions that are innovative yet rooted in local contexts.
Traditional knowledge (TK), passed through generations, encompasses practices in agriculture, medicine, architecture, and natural resource management. For example, traditional water harvesting systems like Johads in Rajasthan and Apatani rice-fish farming in Arunachal Pradesh demonstrate local wisdom in resource conservation. Indigenous medicinal practices provide affordable healthcare solutions while maintaining biodiversity.
Scientific knowledge, on the other hand, offers advanced methods in renewable energy, biotechnology, climate modelling, and modern healthcare. While it provides precision and scalability, it may sometimes overlook local cultural and ecological sensitivities.
Integration of both enhances sustainability:
In agriculture, combining organic farming traditions with modern soil testing and crop modelling increases yields while conserving ecosystems.
In health, integrating Ayurveda and herbal medicine with modern pharmaceuticals creates holistic healthcare systems.
In disaster management, indigenous coping strategies, such as stilt houses in flood-prone regions, complement modern early-warning systems.
Such integration fosters context-specific, cost-effective, and culturally acceptable solutions. It empowers local communities while leveraging scientific innovation to address contemporary challenges.
Hence, bridging the two knowledge systems is essential for resilient, inclusive, and sustainable development.






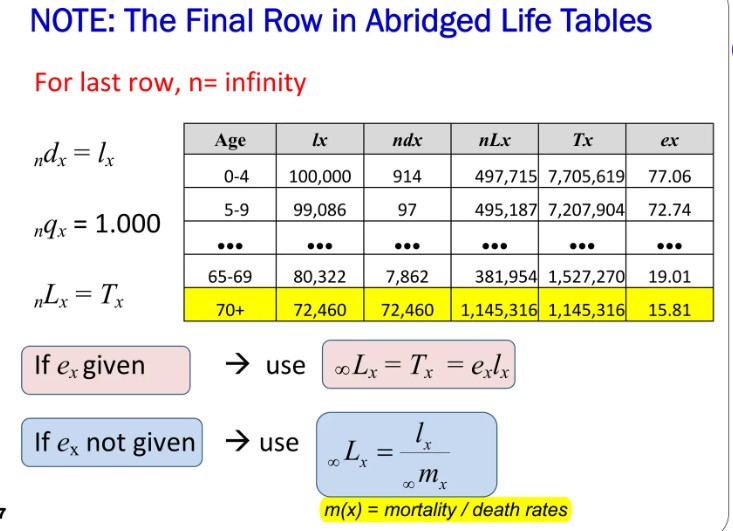





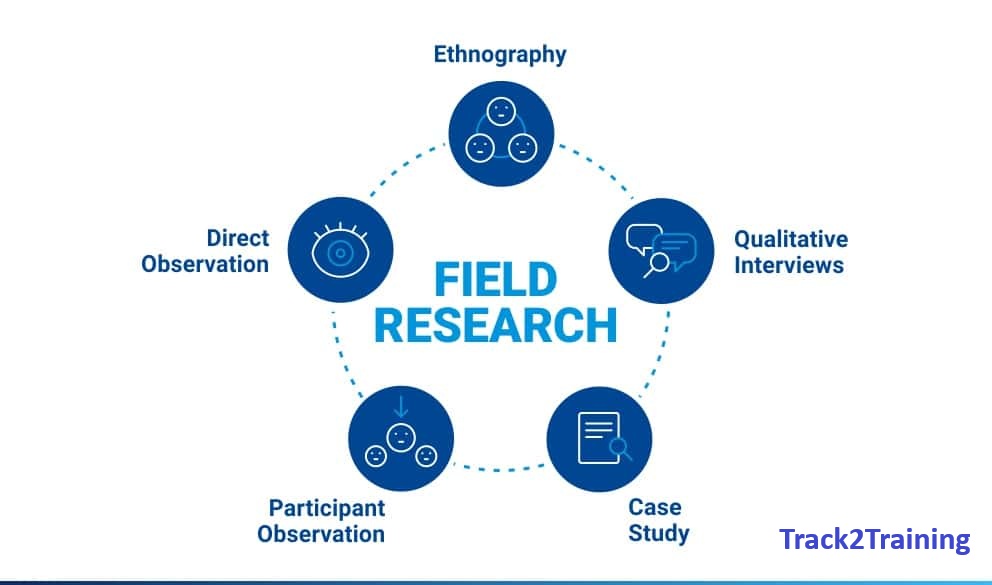


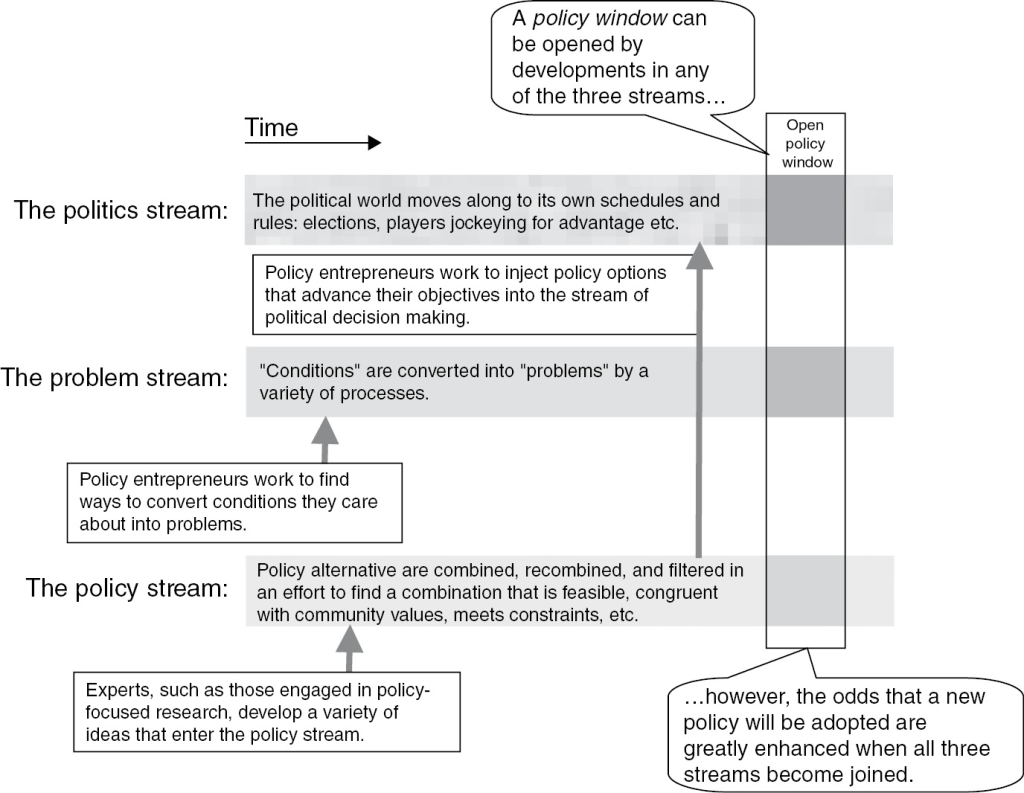
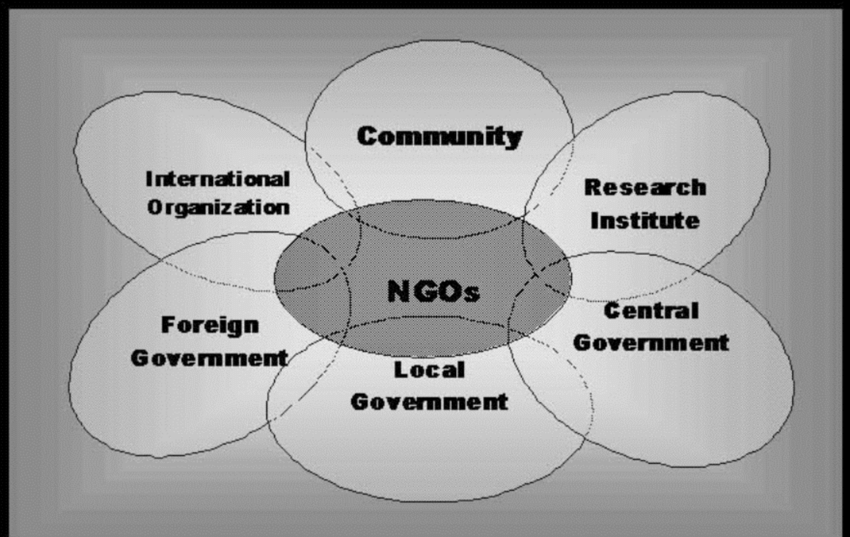
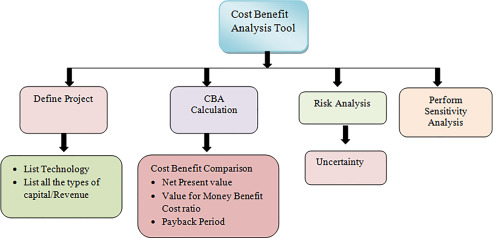


You must be logged in to post a comment.