Managing cities and towns, Urban governance, local government, differentย  planning and development agencies/organisations

๐Ÿ™๏ธ Managing Cities and Towns in India

Effective management of urban areas requires coordinated governance, planning, and development initiatives to ensure sustainable growth, efficient services, and improved quality of life for citizens.


1๏ธโƒฃ Urban Governance

Urban governance refers to the systems, policies, and institutions that regulate and manage cities and towns, including service delivery, development planning, and citizen engagement.

Key Features of Urban Governance

  • Decentralization: Delegating powers to municipal authorities for better local decision-making.
  • Transparency & Accountability: Policies and processes should be transparent, with mechanisms to hold officials accountable.
  • Citizen Participation: Involving communities in planning and decision-making.
  • Coordination Across Departments: Ensures infrastructure, social services, and economic development are integrated.

Challenges in Urban Governance

  • Rapid urbanization and population growth.
  • Infrastructure gaps (water, sanitation, transport, housing).
  • Resource limitations and revenue constraints.
  • Informal settlements and unplanned growth.

2๏ธโƒฃ Local Government in India

Local government institutions are responsible for urban administration and governance under the 73rd and 74th Constitutional Amendments.

Types of Local Government Bodies

LevelTypeKey Functions
Urban Local Bodies (ULBs)Municipal CorporationsManage large cities; infrastructure, health, education, taxation, urban services
Municipal Councils / Nagar PalikasManage medium-sized towns; local planning, utilities, social services
Nagar PanchayatsManage transitional areas (rural to urban); basic services and development
Rural Local BodiesGram PanchayatsVillage administration, rural development, water supply, sanitation, local roads

Roles and Responsibilities

  • Planning and implementing urban development projects.
  • Providing civic amenities (water supply, drainage, sanitation, waste management).
  • Regulating land use and building construction.
  • Mobilizing local resources through taxes, fees, and grants.
  • Promoting social welfare programs.

3๏ธโƒฃ Planning and Development Agencies / Organizations

Urban planning and development in India involve multiple agencies working at national, state, and local levels:

A. National Level

AgencyRole
Ministry of Housing and Urban Affairs (MoHUA)Formulates urban policies, programs, and guidelines; oversees schemes like Smart Cities, AMRUT, Swachh Bharat Mission
Central Public Works Department (CPWD)Designs and implements government buildings and infrastructure projects
National Institute of Urban Affairs (NIUA)Research, capacity building, and technical support for urban planning

B. State Level

AgencyRole
State Urban Development DepartmentsFormulate state policies and development plans, regulate local bodies
State Town & Country Planning DepartmentsPrepare master plans, regional plans, zoning regulations
State Housing BoardsDevelop housing schemes, manage land and real estate development

C. Local Level / City Development Authorities

AgencyRole
Municipal Corporations / CouncilsImplement local projects, manage civic services, enforce building regulations
Development Authorities (e.g., Delhi Development Authority, Bangalore Development Authority)Prepare master plans, acquire land, develop infrastructure, regulate urban growth
Urban Local Bodies (ULBs)Manage local amenities, property tax collection, waste management, and citizen services

D. Specialized Agencies / Programs

  • Smart Cities Mission: Technology-enabled infrastructure and governance.
  • AMRUT (Atal Mission for Rejuvenation and Urban Transformation): Water supply, sewerage, urban transport.
  • Pradhan Mantri Awas Yojana (PMAY): Affordable housing development.
  • Metro Rail Corporations: Mass transit planning and implementation.

4๏ธโƒฃ Key Principles for Managing Cities and Towns

  1. Integrated Urban Planning: Link land use, transport, housing, and environment.
  2. Decentralization: Empower local bodies for decision-making.
  3. Participatory Governance: Engage citizens in planning and monitoring.
  4. Sustainable Development: Promote green spaces, renewable energy, and pollution control.
  5. Financial Management: Efficient resource mobilization through taxes, fees, and grants.
  6. Regulation and Enforcement: Building codes, zoning laws, and land-use regulations.

5๏ธโƒฃ Summary

  • Managing cities and towns in India requires coordination between central, state, and local agencies.
  • Urban governance ensures efficient service delivery, infrastructure provision, and participatory decision-making.
  • Local governments (Municipal Corporations, Councils, Nagar Panchayats) play a critical role in civic management.
  • Development authorities and planning agencies prepare master plans, regional plans, and sectoral programs to guide sustainable growth.

Development of Civilization: A Global Perspective with Focus on River Valley Civilizations

The development of civilization marks one of the most significant transformations in human history. From small groups of hunter-gatherers to large, organized societies with cities, writing systems, and complex governance, the journey of civilization is a story of adaptation, innovation, and cultural evolution. The earliest civilizations emerged around fertile river valleys, where favorable geographical and climatic conditions supported agriculture, trade, and social organization. Understanding these early civilizations from a global perspective reveals not only the shared features of human progress but also the regional diversity that shaped the worldโ€™s cultural heritage.

Photo by Rachel Claire on Pexels.com

The Concept of Civilization

A civilization is generally defined as an advanced stage of human social and cultural development characterized by urbanization, surplus food production, organized governance, social hierarchy, technological advancement, and the development of writing and art. The word โ€œcivilizationโ€ originates from the Latin term civitas, meaning โ€œcity,โ€ reflecting the central role of urban settlements in civilizational growth. The emergence of civilization was made possible through the Neolithic Revolution (around 10,000 BCE), when humans shifted from nomadic lifestyles to settled agricultural communities. This transformation laid the foundation for surplus production, population growth, and specialized labor.

Global Development of Early Civilizations

Civilizations arose independently in various parts of the world between 3500 BCE and 1500 BCE. Despite being separated by vast distances, these early centers shared similar developmental patterns โ€” dependence on agriculture, trade networks, and centralized governance. The four major ancient river valley civilizations are:

  1. Mesopotamian Civilization (Tigris and Euphrates Rivers, Iraq)
  2. Egyptian Civilization (Nile River, Egypt)
  3. Indus Valley Civilization (Indus River, Indiaโ€“Pakistan region)
  4. Chinese Civilization (Yellow River or Huang He, China)

Each of these civilizations developed unique political, social, and technological systems but also exhibited interconnections through trade and cultural diffusion.

Mesopotamian Civilization

Mesopotamia, often called the โ€œCradle of Civilization,โ€ emerged between the Tigris and Euphrates Rivers around 3500 BCE. The fertile plains of this region (modern-day Iraq) allowed for surplus agricultural production, which supported the growth of cities like Uruk, Ur, and Babylon. Mesopotamians invented the worldโ€™s first writing system โ€” cuneiform โ€” used for record-keeping and administration. They also made advances in mathematics, astronomy, and architecture, building monumental ziggurats and developing early forms of law, such as the Code of Hammurabi. Mesopotamiaโ€™s city-states laid the foundation for governance, religion, and trade in the ancient world.

Egyptian Civilization

Developing along the Nile River around 3100 BCE, the Egyptian civilization thrived due to the riverโ€™s predictable flooding, which enriched the soil and supported stable agriculture. The Nile served as a natural highway for communication and trade, uniting Upper and Lower Egypt under the first pharaoh, Narmer (Menes). Egyptian society was highly organized, with a powerful centralized government led by divine kings. The Egyptians made remarkable achievements in engineering, medicine, art, and writing, particularly through the construction of the pyramids and the development of hieroglyphic script. Their religious beliefs in the afterlife shaped monumental architecture and artistic expression.

Indus Valley Civilization

The Indus Valley Civilization (c. 2600โ€“1900 BCE), also known as the Harappan Civilization, developed along the Indus River and its tributaries in modern-day India and Pakistan. It was among the most advanced urban cultures of its time, with well-planned cities like Harappa and Mohenjo-Daro featuring grid layouts, drainage systems, and standardized bricks. The Harappans engaged in extensive trade with Mesopotamia and produced high-quality crafts, pottery, and jewelry. Although their script remains undeciphered, archaeological evidence suggests a society with social equality, organized governance, and emphasis on sanitation and urban planning โ€” an early model of sustainable development.

Chinese Civilization

In East Asia, the Yellow River (Huang He) Valley saw the rise of Chinese civilization around 2000 BCE. The fertile loess plains supported agriculture, primarily millet and later rice cultivation. Early Chinese dynasties such as the Xia, Shang, and Zhou laid the groundwork for Chinaโ€™s cultural and political traditions. The Chinese developed oracle bone script, the earliest known form of Chinese writing, and made advancements in bronze casting, silk production, and military organization. The philosophical systems of Confucianism and Daoism, which evolved later, were deeply influenced by the early societal and natural relationships established in this riverine culture.

Other River-Based and Parallel Civilizations

Beyond these four, other civilizations developed independently around the world, often along rivers or fertile regions. The Mesoamerican civilizations (Olmec, Maya, Aztec) flourished in Central America, while the Andean civilizations (Inca) developed in South America. In Africa, the Nok and Kushite cultures rose, and in Europe, the Minoans and Mycenaeans established early complex societies. These regions, though geographically distant, demonstrate that human societies universally sought fertile land, stable food sources, and trade routes as foundations for cultural growth.

Significance and Legacy

River valley civilizations not only shaped their immediate regions but also influenced global human development. They introduced systems of governance, law, trade, writing, and art that became the bedrock of later empires and modern societies. Their innovations in irrigation, urban planning, and metallurgy transformed human capacity to manipulate the environment. Moreover, the cultural and technological exchanges among these civilizations laid the groundwork for globalization in the ancient world.

Conclusion

The development of civilization from a global perspective highlights humanityโ€™s shared journey toward progress, adaptation, and cultural expression. River valley civilizations represent the earliest experiments in organized human life, where environmental advantages nurtured complex societies. Though they eventually declined due to natural and social factors, their legacies endure โ€” in language, architecture, governance, and philosophy. The story of these civilizations reminds us that human advancement is deeply rooted in our relationship with nature, cooperation, and the quest for knowledge โ€” a foundation upon which modern civilization continues to build.

Top Down and Bottom up approach

๐Ÿ”น Top-Down and Bottom-Up Approaches in Planning

Planning approaches determine how decisions are made, implemented, and integrated in development projects, whether urban, regional, or rural.


1๏ธโƒฃ Top-Down Approach

Definition:

A Top-Down approach is a centralized planning method where decisions and policies are made by higher authorities (national or state governments) and implemented downwards at local levels.

Key Features:

FeatureDescription
Decision-makingMade by central/state authorities or experts.
ImplementationLocal authorities or communities follow instructions.
FocusLarge-scale, strategic, and macro-level objectives.
ParticipationMinimal local participation; community often informed rather than consulted.
Planning HorizonLong-term and often formalized.

Advantages:

  • Clear vision and centralized control.
  • Efficient resource allocation for large projects.
  • Easier coordination across regions.

Disadvantages:

  • May not reflect local needs and priorities.
  • Risk of public resistance if local conditions are ignored.
  • Can lead to inequality or inefficient use of resources.

Examples:

  • National Five-Year Plans in India.
  • Large infrastructure projects like dams, highways, or metro systems planned centrally.

2๏ธโƒฃ Bottom-Up Approach

Definition:

A Bottom-Up approach is a decentralized planning method where local communities and stakeholders actively participate in decision-making. Plans emerge from the needs, priorities, and insights of the people directly affected.

Key Features:

FeatureDescription
Decision-makingInitiated at local/community level; integrated upwards.
ImplementationLocal people are directly involved in execution.
FocusMicro-level, site-specific, and context-sensitive projects.
ParticipationHigh; encourages community ownership and engagement.
Planning HorizonShort- to medium-term, flexible.

Advantages:

  • Reflects local needs, culture, and priorities.
  • Encourages community ownership and sustainability.
  • Flexible and adaptive to local conditions.

Disadvantages:

  • May lack broader strategic coordination.
  • Resource limitations at local level.
  • Risk of fragmentation if not aligned with regional/national policies.

Examples:

  • Participatory rural development programs (e.g., MGNREGA projects).
  • Village-level planning under Gram Panchayats.
  • Local urban neighborhood development initiatives.

3๏ธโƒฃ Comparison of Top-Down and Bottom-Up Approaches

AspectTop-DownBottom-Up
Decision-makingCentralizedDecentralized
ParticipationLowHigh
ScaleMacro-levelMicro-level
FlexibilityRigidFlexible
Community OwnershipLowHigh
ExampleNational infrastructure projectsVillage development plans

4๏ธโƒฃ Integrated Approach

In practice, effective planning often combines both approaches:

  • Top-Down: Provides vision, resources, and regulatory framework.
  • Bottom-Up: Ensures local relevance, participation, and sustainability.

Example:

  • Urban master plans developed centrally but incorporating ward-level participatory planning.
  • National rural employment schemes designed centrally but executed through Gram Panchayat participation.

โœ… Key Takeaways:

  • Top-Down: Efficient for large-scale, strategic planning but may ignore local needs.
  • Bottom-Up: Responsive to local needs and participatory but may lack macro coordination.
  • Best Practice: Integrate both approaches to combine vision, resources, and local relevance.

Town and country planning, goals and objectives of planning, Definitions

๐Ÿ™๏ธ Town and Country Planning

Town and Country Planning (TCP) is a branch of planning concerned with the systematic arrangement of land, infrastructure, and services in urban and rural areas to ensure orderly growth, efficient use of resources, and improved quality of life.

It integrates social, economic, and physical planning principles to achieve sustainable development at local, regional, and national levels.


1๏ธโƒฃ Definitions of Town and Country Planning

  1. Royal Town Planning Institute (RTPI), UK:

โ€œTown planning is the art and science of ordering the use of land and the design of the urban environment, including the network of streets, the arrangement and design of buildings, and the provision of open spaces and public amenities.โ€

  1. Indian Context:

โ€œTown and country planning is the process of preparing, implementing, and controlling plans for the physical development of towns, cities, and rural areas, integrating social, economic, and environmental considerations.โ€

  1. Key Points in Definitions:
  • TCP is systematic and future-oriented.
  • Concerned with land-use regulation, infrastructure provision, and urban-rural integration.
  • Seeks efficient, equitable, and sustainable development.

2๏ธโƒฃ Goals of Town and Country Planning

The overarching goals of TCP focus on creating livable, functional, and sustainable communities:

GoalDescription
Orderly DevelopmentPrevents haphazard growth and unplanned urban sprawl.
Efficient Land UseOptimizes use of land for residential, commercial, industrial, and recreational purposes.
Economic GrowthPromotes industrial, commercial, and agricultural development.
Social EquityEnsures equitable access to housing, health, education, and amenities.
Environmental SustainabilityConserves natural resources, reduces pollution, and maintains green spaces.
Disaster ResiliencePlans for flood, earthquake, and other hazards in settlement layouts.
Integration of Urban & Rural AreasBalances development between towns, cities, and rural settlements.

3๏ธโƒฃ Objectives of Town and Country Planning

  1. Land-Use Regulation
    • Zoning residential, commercial, industrial, and recreational areas.
    • Protecting agricultural and ecologically sensitive lands.
  2. Infrastructure Development
    • Ensuring adequate water supply, drainage, electricity, transport, and communication networks.
  3. Housing and Community Facilities
    • Provision of affordable housing, schools, hospitals, parks, and social amenities.
  4. Urban-Rural Integration
    • Promote balanced development of cities, towns, and villages.
    • Reduce migration pressure on cities by improving rural livelihoods.
  5. Environmental Protection
    • Promote green belts, open spaces, and sustainable resource management.
  6. Economic and Industrial Development
    • Allocate land for industries, commercial zones, and marketplaces.
    • Support employment and economic opportunities.
  7. Traffic and Transportation Planning
    • Organize roads, highways, public transport, and pedestrian systems.
  8. Future-Oriented Growth
    • Anticipate population growth and urban expansion.
    • Prepare master plans and development frameworks for long-term planning.

4๏ธโƒฃ Summary

  • Town and Country Planning is a multidisciplinary, systematic process to manage physical, social, and economic development of settlements.
  • Goals: Ensure orderly growth, social equity, economic development, and environmental sustainability.
  • Objectives: Include land-use regulation, infrastructure provision, housing, industrial development, and urban-rural integration.

โœ… Key Point: TCP is both preventive (avoids chaos and congestion) and promotive (enables efficient and sustainable development).

Urban problems and rural development issues

๐Ÿ™๏ธ Urban Problems and Rural Development Issues

Indiaโ€™s rapid population growth, urbanization, and socio-economic disparities have created distinct challenges in urban and rural areas. Planners need to address these problems for sustainable development.


1๏ธโƒฃ Urban Problems

Urban areas, especially megacities and rapidly growing towns, face multiple issues due to overpopulation, unplanned growth, and resource pressure.

๐Ÿ”น Key Problems

ProblemDescriptionPlanning Concern
Overcrowding & High Population DensityCities are overpopulated, leading to congestion and pressure on services.Efficient land-use planning, high-density housing design
Housing Shortage & SlumsInadequate affordable housing โ†’ proliferation of informal settlements.Slum redevelopment, affordable housing programs
Traffic Congestion & Mobility IssuesNarrow roads, rising vehicle ownership, poor public transport.Integrated transport planning, public transit, pedestrian-friendly spaces
Pollution & Environmental DegradationAir, water, noise pollution; loss of green spaces.Environmental planning, waste management, green infrastructure
Water Supply & SanitationShortage of potable water, inadequate drainage and sewage systems.Water resource management, sewage treatment, stormwater planning
Infrastructure StrainOverloaded electricity, health, and education services.Upgrading utilities, decentralized infrastructure
Social InequalityUnequal access to education, healthcare, and services.Inclusive urban development, social housing, public facilities

๐Ÿ”น Planning Approaches

  • Master plans with zoning regulations.
  • Public transport networks and non-motorized transport corridors.
  • Affordable housing schemes and slum rehabilitation.
  • Pollution control, green spaces, and sustainable resource management.

2๏ธโƒฃ Rural Development Issues

Rural areas face challenges related to poverty, resource dependence, and lack of basic infrastructure, which affect livelihoods and quality of life.

๐Ÿ”น Key Issues

IssueDescriptionPlanning Concern
Agricultural ChallengesFragmented landholdings, low productivity, irrigation problems.Land reforms, irrigation infrastructure, sustainable agriculture
Poverty & UnemploymentDependence on agriculture; limited non-farm employment.Rural industrialization, skill development programs
Housing & Basic AmenitiesInadequate housing, lack of water supply, sanitation, electricity.Rural housing schemes, electrification, water & sanitation projects
Education & HealthPoor school and healthcare access.Schools, primary health centers, skill training
Infrastructure & ConnectivityPoor roads, limited transport, weak communication networks.Rural road development, public transport, telecom connectivity
Resource DegradationSoil erosion, deforestation, water scarcity.Natural resource management, afforestation, watershed development
Social Inequality & MigrationGender disparities, marginalized communities, seasonal migration to cities.Inclusive development, women’s empowerment, local employment generation

๐Ÿ”น Planning Approaches

  • Integrated rural development programs (e.g., MGNREGA, PMGSY).
  • Community-based natural resource management.
  • Promotion of small-scale industries and rural entrepreneurship.
  • Improvement of rural infrastructure: roads, schools, healthcare centers.

3๏ธโƒฃ Comparative Overview

AspectUrban ProblemsRural Issues
PopulationHigh density, overcrowdingLow density, dispersed settlements
HousingShortage, slumsBasic, often substandard housing
EmploymentIndustrial & service sector pressureAgriculture-dependent, limited non-farm jobs
InfrastructureWater, sanitation, electricity overloadLack of basic amenities and connectivity
EnvironmentPollution, green space lossResource degradation, soil erosion
SocialInequality, informal settlementsPoverty, illiteracy, gender disparity

โœ… Key Takeaways:

  • Urban areas face problems of overcrowding, pollution, infrastructure strain, and social inequality.
  • Rural areas struggle with poverty, lack of basic services, agricultural challenges, and resource management.
  • Integrated planning is essential to balance urban growth and rural development, promote migration management, and ensure sustainable livelihoods.

Urban and rural India-Planning concerns of cities, towns and villages

๐Ÿ™๏ธ Urban and Rural India: Planning Concerns

Indiaโ€™s planning challenges are diverse, reflecting the contrast between urban growth pressures and rural development needs. Effective planning requires context-specific strategies for cities, towns, and villages.


1๏ธโƒฃ Urban India: Cities and Towns

Urban areas include metropolitan cities, medium-sized towns, and emerging settlements. Rapid urbanization has created several planning challenges:

๐Ÿ”น Key Planning Concerns

AspectPlanning Concerns
Population Growth & DensityOvercrowding, pressure on housing and public services.
Housing & SlumsShortage of affordable housing; rise of informal settlements.
Infrastructure & UtilitiesWater supply, sewage, electricity, waste management often insufficient.
Transportation & MobilityTraffic congestion, lack of public transport, parking issues.
Environmental ConcernsAir and water pollution, urban heat islands, loss of green spaces.
Economic & Social ServicesUnequal access to healthcare, education, employment opportunities.
Land Use & ZoningUnplanned urban sprawl, encroachment on open spaces and agricultural land.

๐Ÿ”น Planning Strategies for Urban Areas

  • Prepare master plans and city development plans.
  • Develop affordable housing schemes and slum redevelopment projects.
  • Expand public transport networks and pedestrian-friendly spaces.
  • Create green belts, parks, and sustainable drainage systems.
  • Promote mixed-use development to reduce commute and improve livability.

2๏ธโƒฃ Rural India: Villages and Countryside

Rural areas form the backbone of India, with agriculture, small-scale industries, and local markets. Planning concerns differ from urban areas:

๐Ÿ”น Key Planning Concerns

AspectPlanning Concerns
Agriculture & Land UseLand fragmentation, soil degradation, irrigation needs.
Housing & Settlement PatternsQuality of housing, access to safe water and sanitation.
Basic InfrastructureRoads, electricity, healthcare, schools, and communication facilities.
Livelihood & EmploymentDependence on agriculture; need for rural industries and skill development.
Social DevelopmentEducation, health awareness, gender equity, and social inclusion.
Environmental SustainabilityWater conservation, forestry, soil management, disaster resilience.

๐Ÿ”น Planning Strategies for Rural Areas

  • Develop village master plans and Gram Panchayat development plans.
  • Promote rural roads, electrification, water supply, and sanitation.
  • Support agriculture modernization and non-farm employment.
  • Encourage community-based natural resource management.
  • Enhance access to healthcare, education, and skill development programs.

3๏ธโƒฃ Comparative Planning Concerns: Urban vs Rural

AspectUrban AreasRural Areas
Population DensityHigh, concentratedLow, dispersed
HousingShortage of affordable housing; slumsBasic housing quality; scattered settlements
InfrastructureComplex, multi-layeredBasic amenities, accessibility
TransportCongestion, multi-modal planningConnectivity to towns, rural roads
Economic ActivityIndustrial, service-basedAgriculture, cottage industries
Environmental ConcernsPollution, heat islandsSoil, water, forest conservation
Social ServicesSchools, hospitals, community centersAccess to primary education, healthcare, sanitation

4๏ธโƒฃ Integrated Planning Approach

  • Urban and rural planning must be interlinked to balance migration, employment, and resource management.
  • Regional planning integrates villages, towns, and cities into a sustainable development framework.
  • Policies like smart cities, AMRUT, Pradhan Mantri Awas Yojana, and rural infrastructure schemes aim to address both urban and rural concerns.

โœ… Key Takeaways:

  • Urban areas face challenges of density, infrastructure, housing, and pollution.
  • Rural areas require focus on livelihood, basic amenities, and sustainable resource use.
  • Integrated, multi-level planning ensures balanced development, connectivity, and improved quality of life.

Urbanisation in India

๐Ÿ™๏ธ Urbanization in India

Urbanization refers to the increase in the proportion of population living in urban areas and the expansion of towns and cities in terms of population and built-up area. India has witnessed rapid urban growth over the last few decades due to economic, social, and demographic changes.


1๏ธโƒฃ Trends and Patterns of Urbanization

  • Population Shift:
    • In 1951, only ~17% of Indiaโ€™s population lived in urban areas.
    • By 2021, the urban population increased to ~35% and continues to rise.
  • City Size Distribution:
    • Mega cities: Population > 10 million (e.g., Mumbai, Delhi).
    • Metropolitan cities: Population 1โ€“10 million.
    • Medium and small towns: Population <1 millionโ€”rapid growth in Tier-II and Tier-III cities.
  • Regional Patterns:
    • Highly urbanized states: Maharashtra, Tamil Nadu, Gujarat, Kerala.
    • Low urbanization: Bihar, Odisha, Uttar Pradesh.
    • Urban growth is often concentrated in coastal areas and industrial belts.

2๏ธโƒฃ Causes of Urbanization in India

CauseDescription
Economic OpportunitiesIndustrialization, service sector growth, IT hubs attract migrants.
Rural-Urban MigrationSearch for employment, education, healthcare, and better living standards.
Population GrowthNatural increase contributes to expanding urban population.
Infrastructure & ConnectivityBetter transport, roads, and communication promote urban growth.
Government PoliciesIndustrial estates, SEZs, and urban development projects encourage migration to cities.

3๏ธโƒฃ Impacts of Urbanization

๐Ÿ”น Positive Impacts

  • Economic growth: Concentration of labor, industries, and services.
  • Improved access to education, healthcare, and amenities.
  • Cultural and social interaction; cosmopolitan urban culture.

๐Ÿ”น Negative Impacts / Challenges

  • Urban Sprawl: Unplanned expansion of cities into surrounding rural areas.
  • Housing Shortage & Slums: High-density informal settlements due to demand-supply gap.
  • Traffic Congestion & Pollution: Air, water, and noise pollution due to vehicles and industries.
  • Infrastructure Strain: Inadequate water supply, sanitation, electricity, and waste management.
  • Social Inequality: Gaps between rich and poor, informal economy, and marginalization.

4๏ธโƒฃ Planning Implications of Urbanization

Urbanization requires effective urban planning to ensure sustainable, equitable, and efficient cities:

  • Land Use Planning: Zoning for residential, commercial, industrial, and recreational areas.
  • Transport & Connectivity: Roads, public transit, and non-motorized transport networks.
  • Housing & Slum Redevelopment: Affordable housing schemes and inclusive urban design.
  • Environmental Planning: Green spaces, pollution control, flood management, and water conservation.
  • Social Infrastructure: Schools, hospitals, community centers, and recreation areas.
  • Smart Cities & Technology Integration: GIS, data-driven planning, and smart utilities management.

5๏ธโƒฃ Key Takeaways

  • Urbanization in India is rapid and uneven, concentrated in specific states and metropolitan regions.
  • It is driven by economic migration, industrialization, and demographic changes.
  • While urbanization fuels economic growth and modernization, it also poses challenges of infrastructure, housing, environment, and social equity.
  • Sustainable urban planning is essential to manage growth, improve quality of life, and reduce negative impacts.

Historical Cities and Their Planning and Principles

Human civilization has always been closely associated with cities. Cities are not just physical spaces; they are reflections of culture, economy, technology, governance, and values of the societies that created them. The study of historical cities is essential in understanding how urban forms evolved, what principles guided their planning, and how those principles can still inform modern planning practice.

Photo by H. Emre on Pexels.com

1. Introduction to Historical Cities

Historical cities are settlements that emerged in ancient or medieval times, often as centers of administration, trade, culture, or religion. Their planning reflects both functional needs (defense, commerce, water supply) and symbolic meanings (religion, cosmology, social hierarchy). From the Indus Valley cities of Harappa and Mohenjo-Daro to medieval European towns, Islamic cities, and ancient Chinese capitals, each provides insights into planning traditions.


2. Key Historical Examples and Principles

a) Indus Valley Civilization (Harappa and Mohenjo-Daro, c. 2500 BCE)

  • Grid Iron Pattern: Streets were laid out in a north-south, east-west orientation.
  • Standardized Housing: Uniformity in residential blocks, with variation only in size.
  • Water Management: Advanced drainage systems, wells, and bathing areas.
  • Public Spaces: Granaries, citadels, and assembly halls served as community hubs.

Principle: Order, hygiene, and functionality.


b) Ancient Egyptian Cities

  • Oriented along the Nile River, which provided water and transport.
  • Temples and pyramids dominated the urban landscape, symbolizing religion and power.
  • Settlements developed near fertile floodplains, with planned layouts for workersโ€™ villages (e.g., Deir el-Medina).

Principle: Religious centrality and alignment with natural geography.


c) Greek Cities (Athens, Miletus, c. 5th century BCE)

  • Hippodamian Plan: Introduced by Hippodamus of Miletus, featuring a rectangular grid.
  • Agora: Central public square for markets, politics, and social life.
  • Acropolis: Elevated sacred area with temples.
  • Emphasis on civic life, philosophy, and democracy.

Principle: Balance of civic, sacred, and residential functions.


d) Roman Cities

  • Expanded grid plan with Cardo (north-south) and Decumanus (east-west) as main streets.
  • Forum: Administrative and commercial hub.
  • Infrastructure: Aqueducts, amphitheaters, baths, roads, and fortifications.
  • New towns were often established as military colonies.

Principle: Utility, connectivity, and grandeur.


e) Medieval European Cities

  • Organic Growth: Streets were often winding, adapted to terrain and defense.
  • Central Cathedral and Market Square: Spiritual and economic life revolved around them.
  • Fortifications: City walls and gates provided protection.
  • Guild-based neighborhoods: Craftsmen and traders settled in clusters.

Principle: Defense, community identity, and centrality of religion.


f) Islamic Cities (Baghdad, Cairo, Delhi, c. 8thโ€“16th centuries)

  • Central Mosque and Bazaar (Suq): Spiritual and commercial focus.
  • Citadel or Palace: Political authority emphasized.
  • Narrow, Shaded Streets: Adapted to hot climates.
  • Residential Privacy: Houses oriented inward with courtyards.

Principle: Integration of religion, commerce, and environment.


g) Chinese Cities (Changโ€™an, Beijing)

  • Based on geomancy (Feng Shui) and cardinal orientation.
  • Central Axis: Palaces, administrative centers, and ceremonial spaces aligned on it.
  • Walled cities with gates at cardinal points.
  • Hierarchical zoning: Emperorโ€™s palace at center, then officials, merchants, and workers.

Principle: Cosmic order, hierarchy, and symbolism.


h) Indian Medieval Cities (Varanasi, Jaipur, Shahjahanabad)

  • Varanasi: Organic growth along the Ganges, religious ghats dominating spatial form.
  • Jaipur (1727): Planned on gridiron pattern with wide streets, bazaars, and public squares, influenced by Vastu Shastra.
  • Shahjahanabad (Old Delhi, 17th century): Red Fort, Jama Masjid, Chandni Chowk bazaar at the heart; enclosed by walls and gates.

Principle: Blend of cosmology, commerce, and defense.


3. General Planning Principles of Historical Cities

Across civilizations, certain common principles emerge:

  1. Centrality of Power and Religion โ€“ Palaces, temples, mosques, or cathedrals were focal points.
  2. Geometry and Order โ€“ Grid patterns in Indus Valley, Greek, Roman, and Jaipur cities.
  3. Defense and Security โ€“ Walls, citadels, moats in medieval Europe and Islamic cities.
  4. Adaptation to Climate and Geography โ€“ Courtyards in hot climates, shaded narrow lanes, riverside settlements.
  5. Integration of Public Spaces โ€“ Agoras, forums, bazaars, ghats as centers of community life.
  6. Hierarchy and Zoning โ€“ Clear division of spaces for rulers, priests, merchants, workers.
  7. Infrastructure Focus โ€“ Drainage, water supply, roads, markets, storage facilities.
  8. Symbolism and Identity โ€“ Cities often reflected cosmology, religion, or imperial power.

4. Lessons for Modern Planning

Historical cities remind us that planning must go beyond physical design. They show the importance of:

  • Human-scale design (walkability, community interaction).
  • Integration of culture and identity into urban spaces.
  • Environmental adaptation (use of natural resources sustainably).
  • Resilient infrastructure (water systems, defenses, transport networks).
  • Inclusive public spaces where social, cultural, and economic life thrives.

Conclusion

Historical cities are living archives of human ingenuity, resilience, and cultural expression. Their planning was guided by principles of functionality, symbolism, and adaptability. By studying Harappaโ€™s drainage, Athensโ€™ civic spaces, Romeโ€™s infrastructure, Baghdadโ€™s bazaars, or Jaipurโ€™s grids, modern planners can learn how to design cities that are sustainable, inclusive, and culturally rooted. While times have changed, the underlying planning principles of historical cities remain deeply relevant to the challenges of todayโ€™s urbanization.

Guidelines for Mid-Term Cum Assignment Submission

Assignment Components

  1. 10-Slide Presentation (to be presented in class).
  2. 20-Page Written Report (+1 Cover Page).

Both the presentation and write-up should be on the same theme, directly connected to your dissertation topic, with a focus on policy review.


1. Objectives of the Assignment

  • To critically analyze existing policies and frameworks related to your dissertation research topic.
  • To examine how policies have evolved over the years in the chosen field.
  • To evaluate the effectiveness and shortcomings of these policies.
  • To propose future modifications or alternatives for improved policy implementation.
  • To strengthen academic skills in research, writing, and presentation.

2. Structure of the Assignment

(A) Presentation (10 Slides)

Your PowerPoint/Canva/Google Slides presentation should cover:

  1. Title Slide โ€“ Topic, Name, Roll Number, Course, Department.
  2. Introduction to the Research Topic (brief context).
  3. Policy Background โ€“ When it was introduced, by whom, key objectives.
  4. Evolution of the Policy โ€“ Historical changes, reforms, updates.
  5. Key Provisions of the Current Policy.
  6. Relevance to Your Research Topic โ€“ How it supports or influences your dissertation theme.
  7. Achievements and Positive Impacts.
  8. Shortcomings / Gaps Identified.
  9. Proposed Modifications / Future Directions.
  10. Conclusion & Key Takeaways.

๐Ÿ‘‰ Each slide should use bullet points, charts, or diagrams (not long paragraphs).
๐Ÿ‘‰ Presentation time per student: 7โ€“10 minutes.


(B) Written Report (20 Pages + 1 Cover Page)

The written submission should be comprehensive and structured as follows:

Cover Page (1 Page)

  • Title of Assignment
  • Studentโ€™s Name, Roll Number
  • Course, Department
  • Date of Submission
  • Institution Logo (if required)

Main Content (20 Pages)

  1. Introduction (2โ€“3 pages)
    • Introduce your dissertation topic.
    • State why policy review is important for your research theme.
    • Define scope and objectives of your review.
  2. Policy Background (2โ€“3 pages)
    • Describe the selected policy.
    • Discuss its legal framework, stakeholders, and target groups.
  3. Historical Evolution of Policy (3โ€“4 pages)
    • Trace development over decades.
    • Highlight amendments, reforms, and shifts in focus.
    • Include a timeline diagram if possible.
  4. Policy Provisions (2โ€“3 pages)
    • Outline major provisions relevant to your dissertation.
    • Present tables/flowcharts for clarity.
  5. Relevance to Research Topic (2โ€“3 pages)
    • Discuss how this policy affects your area of study.
    • Case examples or statistical evidence can be added.
  6. Strengths and Achievements (2 pages)
    • Show measurable outcomes or successes.
    • Use graphs/charts to highlight impact.
  7. Shortcomings and Gaps (2โ€“3 pages)
    • Critically analyze weaknesses, gaps in implementation, or challenges faced.
    • Support with secondary data or literature.
  8. Future Directions & Recommendations (2โ€“3 pages)
    • Suggest modifications, new approaches, or complementary measures.
    • Connect your suggestions to your research problem.
  9. Conclusion (1 page)
    • Summarize findings.
    • Re-emphasize relevance of policy for your dissertation.
  10. References / Bibliography (APA/MLA/Chicago format).

๐Ÿ‘‰ Total length: 20 pages content (excluding cover and references).
๐Ÿ‘‰ Use headings, subheadings, bullet points, and diagrams for clarity.


3. Formatting Guidelines for Written Submission

  • Font: Times New Roman or Calibri.
  • Font Size: 12 pt (Text), 14 pt Bold (Headings).
  • Line Spacing: 1.5.
  • Margins: 1 inch on all sides.
  • Page Numbers: Bottom center or bottom right.
  • Referencing Style: APA (preferred) or as per department guidelines.

4. Evaluation Criteria

Your assignment will be graded on:

  1. Content Quality (30%)
    • Depth of policy review.
    • Connection to dissertation topic.
  2. Critical Analysis (20%)
    • Identification of gaps/shortcomings.
    • Originality of suggestions.
  3. Presentation Skills (20%)
    • Clarity, confidence, time management.
    • Visual appeal of slides.
  4. Report Writing (20%)
    • Structure, language, formatting.
    • Use of references and citations.
  5. Creativity & Effort (10%)
    • Use of visuals, charts, diagrams.
    • Original contribution beyond just copying policy text.

5. Submission Details

  • Presentation in Class: On scheduled date.
  • Written Report Submission: Hard copy (back2back print, stapled) (b/w print) + Soft copy (PDF) by email or MS Teams portal.
  • Deadline: 14 Oct 2025.
  • Late Submission: Will invite penalty as per departmental rules.

6. Additional Tips

  • Choose a policy directly connected to your dissertation for maximum relevance.
  • Use government documents, academic articles, and policy papers as sources.
  • Keep presentation visual and conciseโ€”do not simply copy report text onto slides.
  • In the report, include tables, diagrams, or infographics to make content engaging.
  • Be analytical, not just descriptiveโ€”always ask: What worked? What failed? What can be improved?

The Think, Write, and Dance Principles for Academic Life

By Shashikant Nishant Sharma

Think, Write and Dance ๐Ÿค”โœ๐Ÿป๐Ÿ•บ๐ŸปPrinciples

Academic life is not merely about memorizing textbooks, attending lectures, or submitting assignments. It is a journey of self-discovery, critical thinking, creativity, and joy in learning. Shashikant Nishant Sharma has beautifully articulated this philosophy through what he calls the โ€œThink, Write, and Dance Principles.โ€ These principles are not rigid rules but flexible guiding ideas that can transform the way scholars, students, and researchers approach their studies and intellectual growth.


1. The Principle of Thinking

At the heart of every academic pursuit lies thinking. Thinking is the raw material of knowledge. It is what turns information into understanding and data into wisdom.

  • Critical Thinking: Scholars must learn not to accept everything at face value. Questioning assumptions, testing evidence, and looking for alternative perspectives are essential habits.
  • Creative Thinking: Academic life is not only about analysis but also about imagination. Creativity allows us to connect different fields, generate new ideas, and propose innovative solutions.
  • Reflective Thinking: Reflection enables students to learn from past mistakes, understand their learning style, and set goals for improvement.

โ€œThinking is like planting seeds. The more carefully you nurture them, the richer will be the harvest of your academic journey.โ€

Practical ways to adopt this principle:

  • Start a โ€œthinking journalโ€ where you write down questions that come to mind during lectures.
  • Dedicate 15โ€“20 minutes daily to silent reflection on what you studied.
  • Discuss ideas with peers to expand your intellectual horizons.

2. The Principle of Writing

Writing is the bridge between thought and communication. Without writing, even the best ideas may remain buried in the mind. Shashikant Nishant Sharma emphasizes writing as an essential discipline for academic success.

  • Clarity of Expression: Writing forces you to organize your ideas logically. It sharpens your understanding.
  • Habit Formation: Regular writingโ€”whether essays, research papers, or even short reflectionsโ€”trains your mind to think systematically.
  • Knowledge Sharing: Writing is not just personal; it is also a contribution to the wider academic community. When you write, you leave behind knowledge for others to build upon.

Practical ways to adopt this principle:

  • Keep a daily or weekly academic diary summarizing what you learned.
  • Practice writing small essays on topics beyond the syllabus.
  • Publish or share your work (blogs, class magazines, research forums).

โ€œWhat is not written is often forgotten. Writing makes your thoughts immortal.โ€


3. The Principle of Dancing

The most unique and refreshing part of Sharmaโ€™s framework is the idea of dancing. At first, it may seem symbolic, but it carries profound meaning. โ€œDanceโ€ here refers to the joy of learning, the rhythm of effort, and the celebration of creativity.

  • Balance and Flow: Just as dance requires balance and rhythm, so does academic life. There must be a harmony between study, rest, and reflection.
  • Joyful Engagement: Scholars should not treat studies as a burden. Learning should feel like dancingโ€”an act of joy, expression, and freedom.
  • Celebrating Progress: Every small achievementโ€”completing a project, mastering a concept, presenting in classโ€”should be celebrated like a dancer celebrating a graceful performance.

Practical ways to adopt this principle:

  • Take breaks to recharge and enjoy activities beyond academics (music, sports, art).
  • Celebrate small victories with friends or mentors.
  • Approach assignments with creativityโ€”add visuals, stories, or metaphors to make them lively.

โ€œDance reminds us that academic life is not just about reaching goals but enjoying every step of the journey.โ€


Integrating the Principles: A Scholarโ€™s Lifestyle

The real power of the Think, Write, and Dance Principles lies in their integration. Imagine a daily routine like this:

  • Morning: Spend time thinking deeply about a problem or concept.
  • Afternoon: Convert those reflections into written notes, essays, or research drafts.
  • Evening: Engage in a joyful, creative activityโ€”whether literal dance, music, or a celebration of what you achieved.

This cycle ensures that learning is holistic, sustainable, and fulfilling. It prevents burnout, keeps the mind active, and nurtures the soul.


Why Scholars Should Adopt These Principles

  1. They promote balance between intellectual rigor and personal well-being.
  2. They encourage creativity in academic work, moving beyond rote learning.
  3. They transform study from a duty into a joyful journey.
  4. They align with the modern need for interdisciplinary and innovative approaches.
  5. They build habits that last a lifetime, beyond the classroom and into professional and personal life.

Conclusion

Shashikant Nishant Sharmaโ€™s Think, Write, and Dance Principles are more than academic strategiesโ€”they are a philosophy of life. They remind scholars that learning is not confined to exams or degrees but is a lifelong rhythm of reflection, expression, and celebration. By thinking deeply, writing clearly, and dancing joyfully, every student can make their academic journey both productive and fulfilling.

โ€œTo think is to discover, to write is to preserve, and to dance is to celebrate the beauty of learning.โ€

Guidelines for Mini Test Cum Assignment

Assignment Title: My City from a Plannerโ€™s Perspective


1. Structure of the Assignment

Your assignment should be 6 pages total:

  • Page 1: Cover Letter (your name, roll number, assignment title, date, etc.)
  • Pages 2โ€“6: Main Content (5 pages) โ€“ each page must be written in a different composition style, using the 10 principles of layout design.

2. Content Requirements

Your write-up should cover the following themes:

  1. Location of the City
    • Geographical location (latitude/longitude if possible).
    • Administrative details (state, district, region).
    • Climate and natural features.
  2. Brief History
    • Origin and foundation.
    • Key historical events.
    • Influence of rulers, trade, culture, or industries.
  3. Importance of the City
    • Economic significance (industries, markets, IT, agriculture, etc.).
    • Political or administrative role (capital, district HQ).
    • Educational and cultural institutions.
  4. Tourist Attractions
    • Major monuments, temples, parks, or museums.
    • Heritage sites, festivals, fairs.
    • New-age attractions like malls, gardens, riverfronts.
  5. Your Likes and Dislikes
    • As a planner, highlight what you like (parks, heritage, infrastructure, transport).
    • Mention problems/dislikes (pollution, traffic, slums, overcrowding).
    • Suggest improvements with plannerโ€™s perspective.

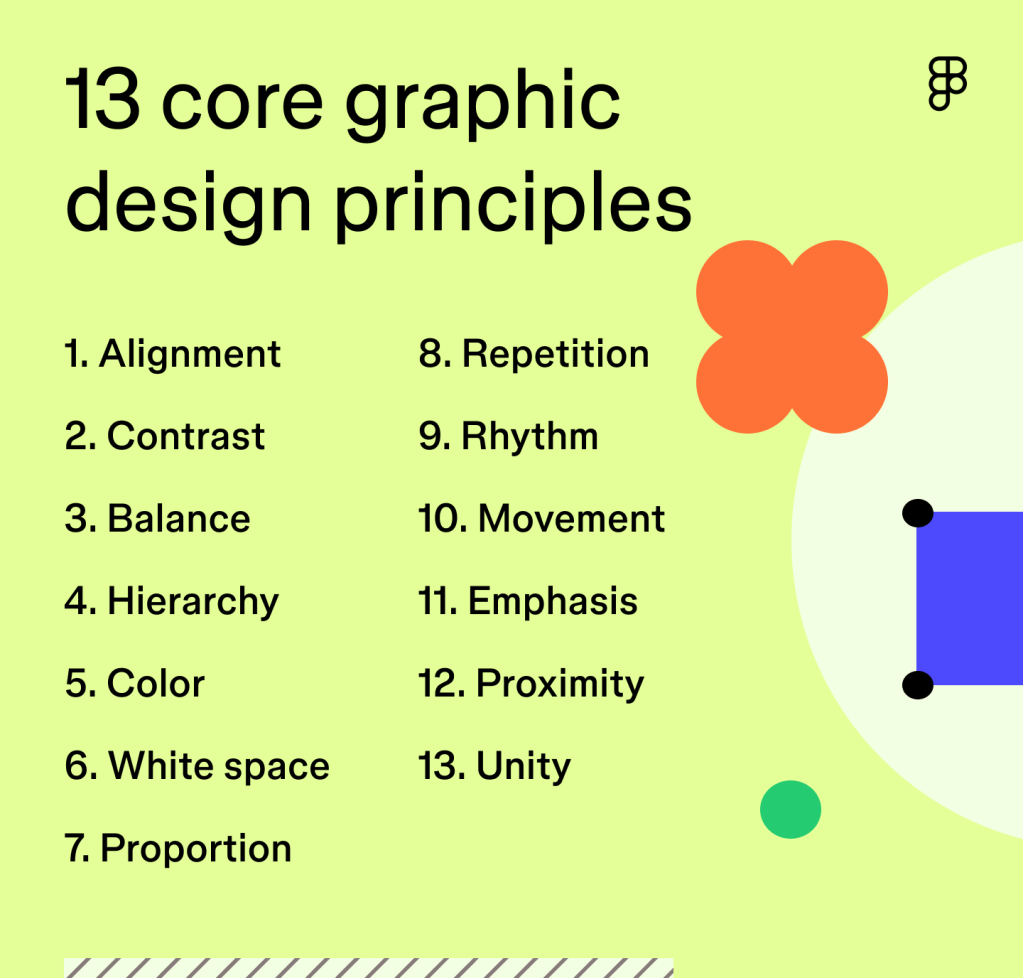
3. The 10 Principles of Layout Design and Their Use

For this assignment, each of the five content pages should experiment with different combinations of design principles. Hereโ€™s how you can apply them: (You can read in detail at https://track2training.com/2025/09/12/10-principles-of-design-for-microsoft-word-documents/

(i) Balance

  • Distribute text and visuals evenly across the page.
  • Example: On one page, write text on the left and place a map/sketch on the right.

(ii) Alignment

  • Keep text aligned properly (left, center, or justified).
  • Example: Use left-aligned paragraphs with right-aligned image captions.

(iii) Hierarchy

  • Use clear headings, subheadings, and bullet points.
  • Example: Headings in bold/large size, sub-points in smaller font.

(iv) Contrast

  • Highlight key facts or quotes using boxes, bold text, or different colors.
  • Example: A quote like โ€œCities are the engines of growthโ€ inside a colored box.

(v) Repetition

  • Maintain a consistent style across pages (same font for headings, same bullet style).
  • Example: Use the same border design or title placement on each page.

(vi) Proximity

  • Group related content together.
  • Example: Keep history paragraphs together and tourist attractions in one section instead of scattering.

(vii) White Space

  • Do not fill the page fully with textโ€”leave margins, gaps, or empty areas.
  • Example: Write a paragraph in the center with wide borders on all sides.

(viii) Simplicity

  • Avoid over-decoration. Use neat boxes, underlines, or bullet points.
  • Example: Draw a simple city skyline outline at the bottom of the page.

(ix) Movement/Flow

  • Arrange text and visuals so that the readerโ€™s eyes naturally flow across the page.
  • Example: Write in a โ€œZ-patternโ€ where the eye moves left to right, then diagonally down.

(x) Unity

  • All elements should look connected. Use same color pencils for diagrams, same heading style.
  • Example: If you choose blue for location maps, use the same shade for other illustrations.

4. Page-by-Page Composition Plan

Hereโ€™s how you can structure the 5 content pages using the design principles:

Page 2: Location

  • Heading at top (Hierarchy).
  • Map of your city (Balance with text).
  • Box with quick facts (Contrast).
  • Clean alignment left for text.

Page 3: History

  • Timeline diagram with arrows (Movement).
  • Small illustrations (fort, temple, etc.).
  • Group events into 3 sections (Proximity).
  • White space around the diagram.

Page 4: Importance of the City

  • Use two columns (Alignment & Balance).
  • Left: Economic role (bullets).
  • Right: Cultural/educational role (short paras).
  • Repeat icon style for industries, schools, etc. (Repetition).

Page 5: Tourist Attractions

  • Large heading in creative style (Hierarchy).
  • Pictures or hand-drawn sketches of attractions.
  • Use boxes for each place with captions.
  • Contrast important site names with bold/highlight.

Page 6: Likes & Dislikes (Plannerโ€™s Perspective)

  • Use two boxes side by side: โ€œWhat I Likeโ€ and โ€œWhat I Dislike.โ€
  • Add a quote about sustainable cities.
  • Suggest improvements in bullet points.
  • Leave some empty margin (White Space).

5. Cover Letter (Page 1)

Your cover letter should look professional. It must contain:

  • Title of Assignment (My City from a Plannerโ€™s Perspective).
  • Your Name, Roll Number, Subject/Department.
  • Date of submission.
  • A short statement like:
    โ€œThis assignment is submitted as part of the Mini Test Cum Assignment to explore my city from the lens of planning, highlighting its location, history, importance, tourism, and challenges.โ€

Keep it center-aligned, simple, and neat.


6. Tips for Illustrations & Diagrams

  • You donโ€™t need to paste printed picturesโ€”simple line diagrams drawn with pencil and colored lightly will be better.
  • Examples:
    • Sketch a city map with rivers, roads, and main landmarks.
    • Draw monuments as outline sketches.
    • Show traffic problems with arrows and vehicles.
    • Use bar graphs (population growth, tourists per year).

7. Writing Style

  • Use clear and simple English (avoid long complicated sentences).
  • Write in paragraphs and bullet points.
  • Add quotes or proverbs about cities (e.g., โ€œA developed city is not one where the poor own cars, but one where the rich use public transport.โ€).
  • Keep grammar and spelling correct.

8. Evaluation Basis

Your teacher will likely evaluate based on:

  • Content Quality (coverage of all sections).
  • Composition Skills (use of layout principles).
  • Creativity (drawings, diagrams, color use).
  • Neatness & Presentation (no overwriting, proper alignment).
  • Personal Reflection (your likes/dislikes with plannerโ€™s vision).

9. Word Count & Time Management

  • Each page should have 300โ€“400 words approx., so overall 1500โ€“1800 words.
  • Keep time for drawing maps/diagrams (donโ€™t leave it for last minute).

10. Conclusion

This assignment is not only about describing your city but also about experimenting with design and composition. The 10 layout principles will help you learn how to present content in a visually appealing and structured way. If followed properly, your work will look professional, planner-oriented, and creative.

Census Classification, Definitions, and Use of Census Data for Planners

The census is one of the most vital tools in understanding the demographic, social, and economic profile of a country. Conducted periodically, usually every ten years, the census is a complete enumeration of the population, households, and their characteristics. For planners, it provides an indispensable database that informs decision-making across urban, regional, social, economic, and environmental planning. The classification systems, standardized definitions, and structured datasets of a census ensure that the information collected can be used for long-term development strategies, policy formulation, and spatial planning.


Census Classification

Census classification refers to the way population and related attributes are grouped, segmented, and organized to ensure accurate analysis. Some of the major classifications include:

  1. Population Classification
    • Rural vs. Urban: Based on criteria like population size, density, and occupational structure. In India, for example, a settlement is considered urban if it has at least 5,000 inhabitants, a density of 400 persons per sq. km, and 75% of the male workforce engaged in non-agricultural activities.
    • Household vs. Institutional Population: Census classifies individuals living in normal households separately from those living in institutions such as hostels, prisons, or ashrams.
    • Resident Status: Usual residents vs. migrants, classified by place of birth or last residence.
  2. Social Classification
    • By age, sex, marital status, literacy, education, religion, caste, and language. These classifications highlight the social structure and diversity of a population.
  3. Economic Classification
    • Work participation, occupation, industry, and employment status. Populations are divided into main workers, marginal workers, and non-workers.
  4. Housing and Amenities Classification
    • Type of housing (kutcha, pucca, semi-pucca), ownership status, availability of basic amenities like drinking water, electricity, toilets, and access to communication facilities.
  5. Geographical Classification
    • Data is categorized into various spatial levels such as state, district, sub-district (tehsil/taluka), town, ward, and village. This hierarchical spatial classification ensures planners can use data at different scales.

Key Definitions in Census

  1. Household: A group of persons who normally live together and take their meals from a common kitchen.
  2. Census House: A building or part of a building with a separate main entrance, used for living, shop, or office purposes.
  3. Usual Resident: A person who has stayed in a place for at least six months or intends to stay there for six months or more.
  4. Urban Area: Defined by population size, density, and proportion of non-agricultural workers, or statutory notification (municipality, corporation, cantonment board).
  5. Rural Area: All areas not classified as urban.
  6. Main Worker: A person who works for six months or more in the reference year.
  7. Marginal Worker: A person who works for less than six months in the reference year.
  8. Literacy: A person aged seven years or above who can read and write with understanding in any language.

Such standardized definitions ensure comparability of data across regions and over time.


Use of Census Data for Planners

Census data plays a pivotal role in planning processes at all levelsโ€”national, regional, and local. The following are key areas where planners make extensive use of census information:

  1. Urban and Regional Planning
    • Census data helps in identifying the size, growth rate, and distribution of population in urban and rural areas. This allows planners to prepare master plans, regional plans, and city development plans.
    • It aids in the classification of settlements, identification of urban sprawl, and the planning of new towns and satellite towns.
  2. Housing and Infrastructure Development
    • Data on housing stock, household size, and availability of amenities helps in forecasting housing demand. Planners can prioritize provision of water supply, sanitation, electricity, and transport.
    • Information about slum populations helps in designing urban renewal and slum improvement projects.
  3. Transport and Mobility Planning
    • Data on workforce participation and place of work-residence helps in transport planning, route optimization, and forecasting traffic demand.
  4. Social Planning
    • Census data on literacy, education, caste, and religion enables planners to design programs for education, health, and social equity.
    • Data on age structure helps in planning for schools, universities, and facilities for the elderly population.
  5. Economic and Employment Planning
    • Workforce participation data allows planners to assess the labor supply for industries, services, and agriculture.
    • Migration data helps in understanding labor mobility and designing employment programs.
  6. Environmental and Resource Planning
    • Population density and growth trends help in identifying pressure on land and natural resources. This informs sustainable development policies and conservation efforts.
  7. Policy Formulation and Governance
    • Census provides a factual basis for resource allocation, political representation, and welfare schemes. For instance, delimitation of constituencies, distribution of funds, and targeted poverty alleviation programs are based on census counts.

Conclusion

The census is not merely a headcount of people; it is a comprehensive socio-economic survey that provides the bedrock for planning. The classifications and definitions embedded in census methodology ensure consistency and reliability of data. For planners, it is both a diagnostic tool and a forecasting instrumentโ€”helping to understand past trends, current realities, and future needs. In an era of rapid urbanization, growing inequality, and environmental challenges, census data remains indispensable for evidence-based, sustainable, and inclusive planning.

Planning process and levels of planning in India

๐Ÿ™๏ธ Planning Process and Levels of Planning in India

Planning in India is a systematic approach to achieve balanced development across economic, social, and physical dimensions. It involves a sequence of steps and operates at multiple administrative levels.


1๏ธโƒฃ Planning Process in India

The planning process is cyclical and iterative, involving analysis, formulation, implementation, and evaluation.

๐Ÿ”น Steps in the Planning Process

  1. Goal Setting
    • Identify national or regional objectives: economic growth, employment, housing, infrastructure, social equity.
    • Example: Eliminate rural-urban disparities, provide affordable housing.
  2. Data Collection and Analysis
    • Collect demographic, economic, environmental, and spatial data.
    • Use tools like Census, GIS, remote sensing, and surveys.
  3. Forecasting and Projection
    • Predict population growth, urban expansion, resource needs, and economic trends.
    • Helps in anticipating future demands for housing, transport, energy, and public services.
  4. Plan Formulation
    • Prepare plans based on analysis and projections.
    • Decide policies, strategies, and programs for development.
    • Example: Master plans for cities, industrial development plans.
  5. Approval and Resource Allocation
    • Plans are approved by relevant authorities (central, state, local).
    • Allocate financial, human, and material resources for implementation.
  6. Implementation
    • Execute projects, policies, and programs.
    • Involves coordination between government departments, private sector, and communities.
  7. Monitoring and Evaluation
    • Check progress against targets.
    • Evaluate impact on economy, society, and environment.
    • Adjust plans as necessary (feedback mechanism).

2๏ธโƒฃ Levels of Planning in India

Planning in India operates at three main levels:

๐Ÿ”น a) National Level

  • Focus: Overall development strategy for the country.
  • Responsible Body: Planning Commission (historically), now NITI Aayog.
  • Key Plans:
    • Five-Year Plans (historically, till 2017)
    • National Development Agenda, Sustainable Development Goals (SDGs)
  • Example: Policies on industrialization, infrastructure, energy, health, and education.

๐Ÿ”น b) State Level

  • Focus: Regional development within a state.
  • Responsible Body: State Planning Departments / State Development Authorities.
  • Key Plans:
    • State Five-Year Plans (aligned with national plan)
    • Regional plans for urban and rural areas
  • Example: Industrial corridors, state highways, irrigation projects.

๐Ÿ”น c) Local / Urban Level

  • Focus: City, town, or village-specific planning.
  • Responsible Body: Municipal Corporations, Panchayati Raj Institutions, Development Authorities.
  • Key Plans:
    • Master plans / city development plans
    • Local area plans, slum redevelopment, housing schemes
  • Example: Master Plan of Delhi, Smart City Projects, local parks, and streetscapes.

3๏ธโƒฃ Integration Across Levels

  • National policies guide state and local plans.
  • State plans adapt national goals to regional realities.
  • Local plans implement policies in a practical and site-specific manner.
  • Feedback from local implementation informs state and national revisions.

4๏ธโƒฃ Summary Table

LevelFocusResponsible BodyExample
NationalCountry-wide strategyNITI Aayog / Former Planning CommissionNational Infrastructure Plan
StateRegional developmentState Planning DepartmentsIndustrial corridors, state highways
LocalCity/town/village plansMunicipalities, PanchayatsMaster plans, housing schemes, smart city projects

โœ… Key Points:

  • Planning in India is systematic, hierarchical, and iterative.
  • Three levels ensure plans are strategic (national), regional (state), and site-specific (local).
  • Successful planning requires integration, coordination, and continuous monitoring.

Natural resources and planning

๐ŸŒฟ Natural Resources and Planning

Natural resources are elements of the natural environment that are utilized to meet human needsโ€”such as water, land, forests, minerals, soil, and energy sources. Proper planning ensures efficient use, conservation, and sustainability of these resources in settlements and urban development.


1๏ธโƒฃ Types of Natural Resources in Planning Context

Resource TypeExamplesPlanning Considerations
LandAgricultural land, urban land, wetlandsLand-use planning, zoning, soil conservation, preventing urban sprawl
WaterRivers, lakes, groundwater, rainwaterWater supply, drainage, flood control, rainwater harvesting
Forests & VegetationTrees, green belts, parksUrban greening, climate moderation, biodiversity, recreation
Minerals & EnergyCoal, oil, solar, windLocation of industries, renewable energy planning, sustainability
Air & ClimateWind, solar radiation, temperatureOrientation of buildings, ventilation, renewable energy potential

2๏ธโƒฃ Role of Natural Resources in Planning

  1. Land Planning
    • Identify suitable areas for development vs. conservation.
    • Preserve fertile agricultural land and forest cover.
    • Avoid construction in floodplains, wetlands, or ecologically sensitive areas.
  2. Water Resource Management
    • Ensure adequate water supply for residential, industrial, and recreational use.
    • Integrate stormwater drainage and flood mitigation.
    • Promote rainwater harvesting and groundwater recharge.
  3. Energy Planning
    • Identify potential for renewable energy sources like solar, wind, and hydro.
    • Plan for energy-efficient buildings and infrastructure.
  4. Environmental Sustainability
    • Maintain green spaces for urban cooling, recreation, and air purification.
    • Plan for waste management and pollution control to protect soil, water, and air.
  5. Disaster Risk Management
    • Analyze resource vulnerability: rivers prone to flooding, landslide-prone areas, drought-prone zones.
    • Plan settlements away from high-risk areas and integrate mitigation measures.

3๏ธโƒฃ Integration with Urban and Regional Planning

Planning ComponentIntegration with Natural Resources
Land-use planningAvoid ecologically sensitive zones, preserve agricultural land
Housing & settlementsWater and energy-efficient design, orientation for sunlight and wind
Transport networksMinimize land degradation, preserve wetlands/forests
Industry & economyLocate resource-intensive industries near raw materials sustainably
Recreation & open spacesUrban forests, parks, riverside promenades for ecological and social benefits

4๏ธโƒฃ Key Principles for Resource-Based Planning

  1. Sustainable Use โ€“ Ensure resources meet current needs without compromising future availability.
  2. Conservation โ€“ Protect forests, water bodies, soil, and biodiversity.
  3. Integration โ€“ Incorporate resource management into land-use, infrastructure, and urban design.
  4. Equity โ€“ Provide fair access to natural resources for all communities.
  5. Risk Assessment โ€“ Consider natural hazards (floods, droughts) in development plans.

โœ… In summary:

  • Natural resources form the foundation for all planning activities.
  • Planning must balance development with conservation.
  • Sustainable, resource-conscious planning ensures environmental protection, social welfare, and long-term economic viability.

Economics, social and physical planning

๐ŸŒ Economics, Social, and Physical Planning

Planning is multidimensional. To create sustainable and equitable settlements, planners focus on economic viability, social needs, and physical infrastructure.


1๏ธโƒฃ Economic Planning

Definition: Economic planning in the urban context refers to the allocation and management of financial and material resources to promote balanced growth and development.

๐Ÿ”น Objectives

  • Ensure efficient use of resources (land, labor, capital).
  • Promote industrial and commercial development.
  • Reduce regional disparities.
  • Support employment generation and income equality.

๐Ÿ”น Key Elements

AspectFocus
Land useCommercial, industrial, agricultural zoning
InvestmentInfrastructure, housing, utilities
Revenue generationProperty taxes, service charges
Resource managementWater, energy, materials

๐Ÿ”น Example

  • Establishing an industrial estate in a city outskirts: provides jobs, attracts investment, and stimulates local economy.

2๏ธโƒฃ Social Planning

Definition: Social planning ensures that human and community needs are met in the planning process. It focuses on equity, accessibility, and quality of life.

๐Ÿ”น Objectives

  • Address housing, health, education, and welfare.
  • Promote social integration and reduce inequality.
  • Support cultural and recreational activities.

๐Ÿ”น Key Elements

AspectFocus
HousingAffordable and adequate accommodation
Health & sanitationClinics, hospitals, clean water
EducationSchools, libraries, skill centers
RecreationParks, playgrounds, community centers
SafetyPolice stations, fire services, disaster preparedness

๐Ÿ”น Example

  • Planning a residential neighborhood with schools, parks, and community centers to meet social needs of residents.

3๏ธโƒฃ Physical Planning

Definition: Physical planning deals with the spatial organization of land, infrastructure, and built environment. It translates social and economic objectives into tangible, spatial layouts.

๐Ÿ”น Objectives

  • Ensure efficient land use and circulation.
  • Provide adequate infrastructure and utilities.
  • Maintain environmental sustainability.
  • Enhance urban form, aesthetics, and safety.

๐Ÿ”น Key Elements

AspectFocus
Land-use planningResidential, commercial, industrial zones
TransportRoads, railways, footpaths, parking
Utilities & servicesWater supply, sewage, electricity, drainage
Open spacesParks, plazas, green belts
Urban formBuilding height, density, skyline, street pattern

๐Ÿ”น Example

  • Designing a mixed-use urban sector: residential blocks, commercial spaces, roads, and parks integrated into a cohesive plan.

4๏ธโƒฃ Integration of Economics, Social, and Physical Planning

ComponentRole in PlanningInterrelationship
EconomicProvides resources, investment, and employmentInfluences affordability of housing and services
SocialEnsures welfare, equity, and cultural needsGuides spatial allocation of schools, hospitals, parks
PhysicalOrganizes land, infrastructure, and buildingsImplements social and economic objectives in physical form

โœ… Key point: Effective planning requires simultaneous consideration of economic viability, social well-being, and physical layout to create functional, equitable, and sustainable environments.

Planning in India (Post independent and colonial impact)

๐Ÿ™๏ธ Planning in India: Colonial Legacy and Post-Independence Developments

Urban and regional planning in India has evolved through historical, political, and social contexts. Its current framework is influenced both by colonial interventions and post-independence nation-building efforts.


1๏ธโƒฃ Colonial Impact on Planning (Pre-1947)

During the British period, planning in India was mainly functional, defensive, and administrative, rather than citizen-focused.

๐Ÿ”น Key Features

FeatureDescription
Administrative ControlCities planned to serve British administration, military cantonments, and trade.
Segregation of Land UsesClear division between European quarters, native settlements, and industrial areas.
Infrastructure FocusRoads, railways, ports, and water supply primarily to serve colonial trade and governance.
Sanitation & Public HealthIntroduction of sewage systems, water supply, and planned drainage in select areas, mainly in European areas.
Planning ExamplesCities like Chennai (Madras), Mumbai (Bombay), and Kolkata (Calcutta) saw gridiron layouts and cantonment planning.

๐Ÿ”น Limitations

  • Neglected local needs and cultural context.
  • Indigenous settlements were often ignored or demolished.
  • Focused on order and control, rather than equitable urban development.

2๏ธโƒฃ Post-Independence Planning (Post-1947)

After independence, India adopted planned development as a national strategy to address population growth, industrialization, and urbanization.

๐Ÿ”น Key Features

AspectDescription
Five-Year PlansPlanning became centralized under the Planning Commission (1950), emphasizing economic growth and infrastructure development.
New Towns & CapitalsExamples: Chandigarh (modernist city by Le Corbusier), Bhopal, Bhubaneswar, Gandhinagarโ€”planned for administrative efficiency and regional development.
Urban Planning Acts & RegulationsTown and Country Planning Acts (various states, 1949 onwards) mandated zoning, land use, and building regulations.
Focus AreasHousing, sanitation, transportation, industrial estates, and slum rehabilitation.
Regional PlanningIntegration of urban and rural areas to balance development.
Modern Planning ToolsGIS, remote sensing, and master planning adopted in later decades.

๐Ÿ”น Achievements

  • Creation of new administrative and industrial towns.
  • Introduction of zoning, land-use regulation, and master plans.
  • Emphasis on public housing, transportation networks, and civic amenities.

๐Ÿ”น Challenges

  • Rapid urbanization led to informal settlements and slums.
  • Implementation gaps due to bureaucracy and funding constraints.
  • Colonial legacies of segregation and centralized planning persisted in some cities.

3๏ธโƒฃ Influence of Colonial Legacy on Post-Independence Planning

  • Gridiron layouts and administrative zones in old cities influenced new master plans.
  • Civic infrastructure models (water supply, drainage) from British era were expanded.
  • Segregation patterns sometimes persisted in residential and industrial zones.
  • Modernist planning ideals (from Chandigarh) combined colonial order with post-independence democratic principles.

4๏ธโƒฃ Key Takeaways

  • Colonial planning focused on control, administration, and trade, largely neglecting Indian social and cultural needs.
  • Post-independence planning aimed at nation-building, equitable urban development, and modernization.
  • Indiaโ€™s contemporary planning is a blend of historical legacy, modernist design, and regional/local adaptations.

Five year Plans in India (Development approaches)

๐Ÿ“ˆ Five-Year Plans in India: Development Approaches

Five-Year Plans were the main instruments of planned economic development in India from 1951 to 2017. They aimed to allocate resources efficiently, promote growth, reduce inequalities, and improve social welfare.


1๏ธโƒฃ Introduction to Five-Year Plans

  • Initiated: 1951, after independence, inspired by the Soviet-style planned economy.
  • Purpose: Achieve balanced development across sectors and regions.
  • Planning Body: Planning Commission of India (replaced by NITI Aayog in 2015).
  • Scope: National, sectoral, and regional planning including agriculture, industry, infrastructure, social services, and environment.

2๏ธโƒฃ Development Approaches in Different Phases

๐Ÿ”น a) First Plan (1951โ€“1956): Agricultural and Infrastructure Focus

  • Focus: Agriculture, irrigation, energy, and transport.
  • Approach: Growth with stability โ†’ emphasize food production and basic infrastructure.

๐Ÿ”น b) Second Plan (1956โ€“1961): Industrialization

  • Focus: Heavy industry, steel plants, and industrial base.
  • Approach: Mahalanobis model โ†’ investment in capital goods sector for long-term growth.

๐Ÿ”น c) Third Plan (1961โ€“1966): Self-reliance and Stability

  • Focus: Balanced growth between agriculture and industry.
  • Approach: Mixed strategy; affected by Indo-China war (1962) โ†’ curtailed resources.

๐Ÿ”น d) Fourth Plan (1969โ€“1974): Growth with Stability

  • Focus: Increase agricultural production (Green Revolution) and industrial growth.
  • Approach: Address food security and employment.

๐Ÿ”น e) Fifth Plan (1974โ€“1979): Poverty Alleviation

  • Focus: Garibi Hatao (Remove Poverty) โ†’ rural development, employment programs.
  • Approach: Social justice and inclusive growth; strengthened planning for poor.

๐Ÿ”น f) Sixth Plan (1980โ€“1985): Technological and Industrial Development

  • Focus: Infrastructure modernization, technology, energy, and transport.
  • Approach: Balanced regional growth, reduce inequalities, modernize industries.

๐Ÿ”น g) Seventh Plan (1985โ€“1990): Social Justice and Human Development

  • Focus: Employment, education, health, social welfare.
  • Approach: People-centric planning, focus on rural areas and backward regions.

๐Ÿ”น h) Eighth Plan (1992โ€“1997): Post-Liberalization Growth

  • Focus: Economic liberalization, industry, IT, exports.
  • Approach: Market-oriented reforms, encourage private sector investment, infrastructure growth.

๐Ÿ”น i) Ninth Plan (1997โ€“2002): Social Development

  • Focus: Poverty reduction, employment, education, and health.
  • Approach: Pro-poor growth, balanced regional development.

๐Ÿ”น j) Tenth Plan (2002โ€“2007): Faster and More Inclusive Growth

  • Focus: Economic growth + social justice.
  • Approach: Inclusive development, targeted programs for marginalized communities.

๐Ÿ”น k) Eleventh Plan (2007โ€“2012): Inclusive Growth

  • Focus: Reduce poverty, regional disparities, environmental sustainability.
  • Approach: Strengthen rural livelihoods, infrastructure, and social services.

๐Ÿ”น l) Twelfth Plan (2012โ€“2017): Faster, Sustainable, and More Inclusive Growth

  • Focus: Infrastructure, human development, employment, sustainable growth.
  • Approach: Integrate economic efficiency, social justice, and environmental sustainability.

3๏ธโƒฃ Key Development Approaches Across Plans

ApproachFeaturesExample
Agricultural DevelopmentGreen Revolution, irrigation, food securityFirst and Fourth Plans
Industrialization & Capital GoodsHeavy industry, infrastructureSecond & Sixth Plans
Poverty AlleviationRural employment, social programsFifth & Ninth Plans
Inclusive & Human DevelopmentHealth, education, gender equalitySeventh, Tenth, Eleventh Plans
Liberalization & Market-Oriented GrowthPrivate sector investment, exportsEighth Plan onwards
Sustainable DevelopmentEnvironmental concerns, renewable energyTwelfth Plan

4๏ธโƒฃ Key Takeaways

  • Five-Year Plans were Indiaโ€™s primary tool for resource allocation, sectoral focus, and socio-economic development.
  • Approaches evolved from agriculture and industrialization โ†’ poverty alleviation and social justice โ†’ liberalization and inclusive growth โ†’ sustainable development.
  • Planning emphasized balanced regional growth, human development, and reducing inequalities.

Defining planning as a discipline, itโ€™s multidisciplinary nature, role of a planner

๐Ÿ™๏ธ Planning as a Discipline

Planning is the process of organizing, designing, and regulating the use of land, resources, and infrastructure to achieve socially, economically, and environmentally sustainable development. It is concerned with shaping human settlementsโ€”from small neighborhoods to entire regionsโ€”by integrating policy, design, and management.


1๏ธโƒฃ Planning as a Discipline

  • Definition: Planning is a professional and academic discipline that combines science, art, and policy-making to organize space, resources, and activities in a systematic and future-oriented way.
  • Purpose:
    • Ensure efficient land use and resource allocation.
    • Promote economic development, social welfare, and environmental protection.
    • Anticipate and manage urban growth and change.
  • Scope: Planning covers urban, regional, environmental, transportation, economic, and community planning, among others.

2๏ธโƒฃ Multidisciplinary Nature of Planning

Planning draws knowledge from multiple disciplines, making it inherently integrative:

DisciplineContribution to Planning
Architecture & DesignBuilding forms, spatial layouts, aesthetics
Civil & Structural EngineeringRoads, water systems, drainage, structural stability
Environmental ScienceClimate, ecology, resource management, sustainable practices
EconomicsFeasibility studies, cost-benefit analysis, infrastructure funding
Sociology & AnthropologyUnderstanding community needs, social behavior, cultural context
Geography & GISSite analysis, land-use mapping, urban growth modeling
Political Science & PolicyGovernance, regulations, public participation
Statistics & Data ScienceDemographics, traffic modeling, forecasting trends

Key point: Planners synthesize these diverse inputs to create coherent, sustainable, and human-centric solutions.


3๏ธโƒฃ Role of a Planner

A planner is a professional trained to analyze, design, and implement plans for settlements, cities, regions, and communities. Their role includes:

  1. Research & Analysis
    • Collect and analyze data on population, land use, environment, transport, and economy.
    • Identify problems, needs, and growth trends.
  2. Design & Planning
    • Prepare master plans, zoning maps, and development layouts.
    • Integrate infrastructure, public spaces, and services.
  3. Policy & Regulation
    • Formulate policies for sustainable urban growth, housing, and land use.
    • Ensure compliance with local, regional, and national regulations.
  4. Coordination & Stakeholder Engagement
    • Work with architects, engineers, environmentalists, economists, and government authorities.
    • Conduct public consultations to understand community needs.
  5. Implementation & Monitoring
    • Oversee project execution.
    • Monitor impacts and update plans based on evolving conditions.
  6. Vision & Strategy
    • Anticipate future growth, demographic changes, and technological developments.
    • Ensure plans are flexible and adaptive.

4๏ธโƒฃ Summary

  • Planning as a discipline: Organized effort to manage land, resources, and human settlements for sustainable development.
  • Multidisciplinary nature: Integrates architecture, engineering, economics, sociology, environmental science, geography, and policy-making.
  • Role of a planner: Analyst, designer, policy advisor, coordinator, and visionaryโ€”ensuring spaces are functional, equitable, and sustainable.

Understanding buildings andย  cluster of buildings.

๐Ÿ  Understanding Buildings and Clusters of Buildings

1๏ธโƒฃ Understanding a Single Building

A building is more than a structureโ€”it is a functional, spatial, and cultural response to human needs. To study a building, we analyze it in terms of:

๐Ÿ”น a) Form and Massing

  • Shape (cube, rectangle, L-shaped, circular, organic).
  • Scale (human scale vs monumental scale).
  • Proportion and rhythm in faรงade.

๐Ÿ”น b) Function and Space Use

  • Public vs private areas.
  • Circulation (vertical & horizontal movement: stairs, corridors, lifts).
  • Spatial hierarchy (entrance โ†’ lobby โ†’ rooms).

๐Ÿ”น c) Structure and Materials

  • Load-bearing vs framed structures.
  • Traditional vs modern materials.
  • Openings (windows, doors) for light & ventilation.

๐Ÿ”น d) Orientation and Climate Response

  • Sunlight, ventilation, shading.
  • Relation to site (street edge, garden, setback).

2๏ธโƒฃ Understanding Clusters of Buildings

A cluster is a group of buildings arranged together, forming a spatial unit within a settlement. They may be planned (designed layouts) or organic (grown over time).

๐Ÿ”น a) Types of Clusters

  • Linear clusters โ†’ along a street, river, or transit corridor.
  • Courtyard clusters โ†’ buildings arranged around an open space.
  • Radial clusters โ†’ arranged around a central node (plaza, temple, monument).
  • Organic clusters โ†’ irregular, often in old villages or historic towns.
  • Grid-based clusters โ†’ modern planned layouts, like residential colonies.

๐Ÿ”น b) Spatial Relationships

  • Proximity โ†’ distance between buildings defines density and privacy.
  • Orientation โ†’ facing toward common courtyards, streets, or views.
  • Scale โ†’ clusters can be human-scaled (villages) or monumental (institutional campuses).

๐Ÿ”น c) Shared Spaces

  • Courtyards, streets, plazas โ†’ act as social spaces.
  • Pathways and connections โ†’ ensure circulation.
  • Public vs private domain โ†’ front yards, verandahs, and transition zones.

3๏ธโƒฃ Comparison: Building vs Cluster

AspectSingle BuildingCluster of Buildings
FocusInternal space, functionality, comfortExternal space, relationships, community
ScaleHuman, family, or organizational unitNeighborhood, institutional, or urban scale
DesignForm, structure, climate responseArrangement, density, circulation
OutcomeShelter, identity, usabilitySocial interaction, community life, urban form

4๏ธโƒฃ Examples

  • Single building: A house designed with verandah, courtyard, and pitched roof (responding to climate).
  • Cluster: Houses arranged around a shared courtyard in Rajasthan havelis, or along narrow streets in European medieval towns.
  • Modern examples:
    • Single: High-rise office tower.
    • Cluster: IT campuses, university complexes, housing colonies.

5๏ธโƒฃ Why This Matters for Planners and Architects

  • Helps balance individual needs (privacy, comfort) with community needs (interaction, accessibility).
  • Influences density, livability, and sustainability of urban spaces.
  • Shapes the identity of towns and cities through built form and open spaces.

โœ… In summary:

  • A building is understood by its form, function, structure, and climate response.
  • A cluster is understood by arrangement, spatial relationships, and shared spaces.
  • Together, they define how people live, work, interact, and build communities.

Three point perspective of a tall building.

๐Ÿ™๏ธ Three-Point Perspective of a Tall Building

โœจ Concept

  • Three vanishing points (VPs):
    • VP1 and VP2 โ†’ on the horizon line (left & right).
    • VP3 โ†’ above or below horizon line (for height).
  • Unlike one- and two-point perspectives, vertical lines also converge (instead of staying upright).
  • This gives a dramatic, realistic effect โ†’ like looking up at a skyscraper or down from the sky.

1๏ธโƒฃ Steps to Draw a Tall Building

  1. Horizon line
    • Draw HL and place two vanishing points (VP1 & VP2) far apart.
  2. Third vanishing point (VP3)
    • If you are looking up at the building โ†’ place VP3 above horizon line.
    • If you are looking down (birdโ€™s-eye view) โ†’ place VP3 below horizon line.
  3. Front vertical edge
    • Instead of a vertical line, draw a line that leans toward VP3 (because verticals now converge).
  4. Receding sides
    • From the top and bottom of this edge, draw lines converging to VP1 and VP2.
    • Repeat for the other side โ†’ forms two walls tapering upward/downward.
  5. Height convergence
    • Extend top and bottom edges toward VP3.
    • All vertical edges of the building should taper toward VP3.
  6. Details
    • Windows, floors, balconies:
      • Horizontal edges โ†’ converge to VP1 & VP2.
      • Vertical edges โ†’ converge to VP3.
    • Add shading to emphasize depth and height.

2๏ธโƒฃ Visual Effect

  • Wormโ€™s-eye view (looking up): Building towers above you, tapering toward sky.
  • Birdโ€™s-eye view (looking down): Tall structure appears from above, tapering toward ground.

3๏ธโƒฃ Applications

  • Architectural visualizations of skyscrapers.
  • Urban design perspectives (skyline views).
  • Comic books and animation (dramatic views).
  • Concept art for cities and futuristic landscapes.

โœ… In summary:

  • Three-point perspective adds realism by converging all three sets of lines (width โ†’ VP1, depth โ†’ VP2, height โ†’ VP3).
  • Best suited for tall buildings where viewer looks up or down dramatically.

Two-point perspective of simple objects, Table and chair, different structures, rooms.

๐ŸŽฏ Tutorial: Two-Point Perspective Drawing

โœจ Basic Idea

  • Horizon line (HL): Eye level of the viewer.
  • Two vanishing points (VP1, VP2): Both located on the horizon line, left and right.
  • Front edges (vertical lines): Drawn true to size.
  • Depth: All receding edges converge toward either VP1 or VP2.

๐Ÿ‘‰ Unlike one-point perspective (good for frontal views), two-point perspective is best for corner views (when you see two sides of an object).


1๏ธโƒฃ Step 1: Cube / Simple Block

  1. Draw horizon line and place two vanishing points (VP1 & VP2) far apart.
  2. Draw a vertical front edge (the nearest corner of the cube).
  3. From top and bottom of this edge, draw receding lines to VP1 and VP2.
  4. Decide depth โ†’ close with vertical edges between the receding lines.
  5. Darken visible edges.

๐Ÿ‘‰ Now you have a cube seen in corner view.


2๏ธโƒฃ Step 2: Table in Two-Point Perspective

  1. Start with front vertical edge (table corner).
  2. Draw receding edges of the tabletop toward VP1 & VP2.
  3. Add back edges โ†’ parallel to front edge but converging to VP1 & VP2.
  4. Draw legs as vertical lines at four corners of tabletop.
  5. Project bottoms of legs toward vanishing points.

๐Ÿ‘‰ You now have a realistic table.


3๏ธโƒฃ Step 3: Chair in Two-Point Perspective

  1. Begin with the front vertical edge of the seat (corner of chair).
  2. Extend seat depth toward VP1 & VP2.
  3. Add legs โ†’ verticals dropping from corners, converging to VPs at the base.
  4. Draw backrest: extend vertical lines from rear seat edge upward, connect to VP1 & VP2.
  5. Add thickness/details.

๐Ÿ‘‰ Chair looks 3D, showing both sides.


4๏ธโƒฃ Step 4: Structures / Buildings

  1. Start with front corner vertical of building.
  2. Extend sides to VP1 & VP2 for walls.
  3. Add windows and doors โ†’
    • Vertical edges true.
    • Tops and bottoms converge to respective VP.
  4. Roofs:
    • Midpoint of top edge โ†’ sloping lines toward VP1 & VP2.

๐Ÿ‘‰ Shows realistic architecture in street view.


5๏ธโƒฃ Step 5: Interior Space (Room)

  1. Draw horizon line and place VP1 & VP2 on it.
  2. Begin with a vertical edge (front corner of the room).
  3. Draw receding lines from top and bottom to VP1 & VP2 โ†’ forms floor, ceiling, and walls.
  4. Add furniture:
    • Front vertical edges true.
    • Depth recedes to VP1 & VP2.
    • Windows, doors, and cupboards follow same rule.

๐Ÿ‘‰ Room appears as if viewed from a corner, both walls visible.


6๏ธโƒฃ Tips for Success

  • Keep vanishing points wide apart โ†’ avoids distortion.
  • Vertical lines stay upright; only horizontal lines converge.
  • Use light construction lines first.
  • Apply shading to enhance depth.

โœ… In summary:

  • Two-point perspective is best for showing objects or spaces seen from a corner.
  • Method: Start with vertical corner โ†’ recede edges to VP1 & VP2 โ†’ add verticals โ†’ close forms โ†’ add details.
  • Works for cubes, tables, chairs, buildings, and room interiors.

Tutorial on One-point perspective of simple objects, Table andย  chair, different structures, rooms.

๐ŸŽฏ Tutorial: One-Point Perspective Drawing

โœจ Basic Idea

  • Horizon line (HL): Eye level of the viewer.
  • Vanishing point (VP): A single point on the horizon line where all receding lines converge.
  • Front face: Drawn in true shape.
  • Depth: Achieved by receding lines going to the VP.

1๏ธโƒฃ Step 1: Cube / Simple Object

  1. Draw the horizon line and mark the vanishing point (VP).
  2. Sketch a front square/rectangle below or above the horizon line.
  3. From each corner, draw light receding lines to the VP.
  4. Decide the depth โ†’ cut off with a vertical/horizontal line.
  5. Darken visible edges.

๐Ÿ‘‰ Now you have a cube in one-point perspective.


2๏ธโƒฃ Step 2: Table in One-Point Perspective

  1. Start with a rectangle (top face) for the tabletop.
  2. Draw receding lines from its corners to the VP.
  3. Add back edges by closing off at desired depth.
  4. Draw the legs:
    • Vertical lines at corners of the tabletop.
    • Project the bottoms backward to VP.
  5. Erase construction lines and highlight edges.

๐Ÿ‘‰ Table appears realistic with depth.


3๏ธโƒฃ Step 3: Chair in One-Point Perspective

  1. Begin with the seat (rectangle) as the front face.
  2. Recede the back edge toward the VP โ†’ complete the seat plane.
  3. Add legs (verticals at corners) โ†’ project depth via VP.
  4. Draw the backrest:
    • Vertical rectangle rising from rear seat edge.
    • Top receding edges go to VP.
  5. Add thickness (front & side supports).

๐Ÿ‘‰ Chair looks solid and proportionate.


4๏ธโƒฃ Step 4: Simple Structures (House / Building)

  1. Draw a rectangle/square front face (the buildingโ€™s faรงade).
  2. Extend sides to VP for walls.
  3. Add roof:
    • Mark mid-point of top edge.
    • Project to VP for depth.
    • Add sloping lines for pitched roof.
  4. Doors and windows:
    • Draw front rectangles.
    • Recede tops/bottoms to VP.

๐Ÿ‘‰ Creates a realistic building in perspective.


5๏ธโƒฃ Step 5: Interior Space (Room)

  1. Draw a rectangle (back wall) inside your paper.
  2. Mark VP at the center of horizon line.
  3. Extend diagonals from corners of rectangle to VP โ†’ creates walls, ceiling, and floor.
  4. Add objects (tables, beds, windows):
    • Front face in correct proportion.
    • Depth lines recede to VP.
    • Vertical/horizontal edges stay straight.

๐Ÿ‘‰ Room appears 3D, with all furniture aligned to perspective.


6๏ธโƒฃ Tips for Accuracy

  • Always keep verticals upright and horizontals straight (except depth lines โ†’ they must go to VP).
  • Start with light construction lines.
  • Use proportional scaling (objects shrink as they approach VP).
  • Practice with grids โ†’ helps maintain proportions of interiors.

โœ… In summary:

  • Cube โ†’ Table โ†’ Chair โ†’ Building โ†’ Room.
  • Same method: front face true โ†’ receding lines to VP โ†’ depth cut-off โ†’ details added.
  • One-point perspective is best for frontal views like corridors, streets, rooms, and furniture seen head-on.

One-point perspective: principles.

๐ŸŽฏ One-Point Perspective: Principles

One-point perspective is a method of graphical projection that creates the illusion of depth by making parallel lines converge toward a single vanishing point on the horizon line. It mimics how the human eye perceives objects that are directly in front of us.


1๏ธโƒฃ Key Principles

  1. Horizon Line (HL)
    • Represents the viewerโ€™s eye level.
    • All vanishing points lie on this line.
  2. Vanishing Point (VP)
    • A single point on the horizon line where all parallel lines (receding in depth) appear to converge.
    • In one-point perspective, only one vanishing point is used.
  3. Parallel vs. Perpendicular Lines
    • Lines parallel to the picture plane (front faces) are drawn in their true shape and size.
    • Lines perpendicular to the picture plane recede toward the one vanishing point.
  4. Foreshortening
    • Objects appear smaller as they recede into the distance.
    • Equal distances in reality look progressively shorter in the drawing.
  5. Station Point (SP)
    • The eye position of the observer.
    • Determines how close or far objects appear.

2๏ธโƒฃ Steps to Construct a One-Point Perspective

  1. Draw a horizon line at eye level.
  2. Mark a single vanishing point (VP) on the horizon line.
  3. Draw the front face of the object (true shape).
  4. From each corner of the object, draw lines receding to the vanishing point.
  5. Add the back edges by cutting off receding lines at desired depth.
  6. Darken the visible outlines โ†’ realistic perspective view.

3๏ธโƒฃ Examples

  • Corridor or Railway Tracks โ†’ parallel sides converge at one point on the horizon.
  • Buildings Viewed Front-On โ†’ front faรงade true shape; sides recede to vanishing point.
  • Roads, Tunnels, Bridges โ†’ straight paths narrow into the distance.

4๏ธโƒฃ Applications

  • Architectural drawings (interiors, streetscapes).
  • Urban design visualizations.
  • Fine arts and photography (framing depth).
  • Teaching perspective basics.

โœ… In summary:
One-point perspective is based on the principle that all receding lines converge at a single vanishing point on the horizon line, making it the simplest and most widely used perspective technique for depicting depth and distance.

Geometric projections: Orthographic, isometric and perspectiveย  projections of one, two- and three-dimensional objects.

๐Ÿ“ Geometric Projections

Projection is a method of representing a three-dimensional object on a two-dimensional drawing surface (paper, screen) using straight lines drawn from the object to an imaginary plane.

The three main types of projections used in architecture, planning, and engineering are:

  1. Orthographic Projection
  2. Isometric Projection
  3. Perspective Projection

1๏ธโƒฃ Orthographic Projection

  • Definition: A method of representing objects by projecting perpendicular lines (orthogonal) from the object to the projection plane.
  • Characteristics:
    • Shows exact shape and size.
    • No distortion.
    • Multiple views (front, top, side) needed to fully describe object.
  • Applications: Engineering drawings, building plans, technical blueprints.

Orthographic views of different dimensions:

  • 1D object (a line) โ†’ Appears as a line or point depending on orientation.
  • 2D object (a square, triangle, circle) โ†’ Shows true shape (e.g., square as square, circle as circle) when parallel to projection plane.
  • 3D object (cube, cylinder, cone) โ†’ Represented using multiple views:
    • Front view
    • Top view
    • Side view

๐Ÿ“Œ Example: A cube in orthographic projection is shown as three separate 2D views (square front, square top, square side).


2๏ธโƒฃ Isometric Projection

  • Definition: A type of axonometric projection where the object is tilted so its three principal axes make equal angles (120ยฐ) with each other.
  • Characteristics:
    • Provides a pictorial 3D view.
    • Scale along each axis is equal, so proportions are preserved.
    • Parallel lines remain parallel (no vanishing point).
  • Applications: Design visualization, engineering drawings, exploded views.

Isometric representation of different dimensions:

  • 1D (line) โ†’ Drawn along one of the isometric axes at 120ยฐ.
  • 2D (plane figure) โ†’ A square becomes a rhombus; a circle appears as an ellipse.
  • 3D (solid figure) โ†’ Cube appears as an equal-sided rhombus structure; cylinder drawn with elliptical bases.

๐Ÿ“Œ Example: A cube in isometric looks like three visible rhombus faces meeting at 120ยฐ.


3๏ธโƒฃ Perspective Projection

  • Definition: A projection method where visual rays converge at a point (the eye or station point) and intersect the projection plane.
  • Characteristics:
    • Mimics human vision.
    • Objects appear smaller as distance increases.
    • Provides realistic depth.
    • Has vanishing points depending on type.
  • Applications: Architecture, urban design, interior design, landscape planning.

Types of Perspective:

  • One-point perspective โ†’ Used for roads, railway tracks, corridors; parallel lines converge at a single vanishing point.
  • Two-point perspective โ†’ Used for showing corners of buildings; two sets of parallel lines converge at two different vanishing points.
  • Three-point perspective โ†’ Used for tall buildings or aerial views; vertical lines also converge at a third vanishing point.

Perspective of dimensions:

  • 1D line โ†’ Appears as a line receding toward a vanishing point.
  • 2D shape โ†’ A square looks like a trapezium if tilted away; a circle appears as an ellipse.
  • 3D object โ†’ A cube appears realistic, with depth shown by receding edges toward vanishing points.

๐Ÿ“Œ Example: A cube in two-point perspective shows vertical edges true, but horizontal edges converge at two vanishing points.


๐Ÿ”‘ Comparison of Projection Methods

FeatureOrthographic ProjectionIsometric ProjectionPerspective Projection
NatureTechnical, accuratePictorial, measurableRealistic, visual
LinesParallel โ†’ parallelParallel โ†’ parallelParallel โ†’ converge
ScaleTrue scaleForeshortened equallyDiminishes with depth
UseWorking drawingsDesign visualizationArchitectural renderings

โœ… In summary:

  • Orthographic โ†’ exact, technical, needs multiple views.
  • Isometric โ†’ pictorial 3D, equal foreshortening, no vanishing point.
  • Perspective โ†’ realistic, mimics human vision, vanishing points.

Anthropometric study and analysis-Space required for variousย  activities by an average person as per European and Americanย  standard and their comparison to Indian requirements.

๐Ÿงโ€โ™‚๏ธ Anthropometric Study and Analysis

Anthropometry is the science of measuring the human body to understand dimensions, proportions, and functional requirements. For planners, architects, and designers, anthropometric data helps determine the minimum and optimum space needed for various activities such as sitting, walking, sleeping, cooking, or working.

Photo by Andres Ayrton on Pexels.com

This ensures designs are:

  • Ergonomic
  • Culturally appropriate
  • Comfortable for users

1๏ธโƒฃ Anthropometric Standards

  • European & American Standards
    • Based on taller and bulkier populations (average male height โ‰ˆ 1.75โ€“1.80 m, female โ‰ˆ 1.65โ€“1.70 m).
    • Furniture dimensions, circulation space, and clearances are more generous.
    • Emphasis on privacy and personal space (higher per capita area in housing and offices).
  • Indian Standards
    • Based on shorter average height and leaner build (average male height โ‰ˆ 1.68 m, female โ‰ˆ 1.55 m).
    • Furniture and space requirements are slightly smaller in scale.
    • Greater space efficiency due to cultural habits (floor sitting, compact kitchens, shared bedrooms).

2๏ธโƒฃ Space Requirements for Activities (Comparison)

Activity / FurnitureEuropean & American StandardIndian Standard (IS codes, CPWD norms, NBC)Remarks
Sleeping (Bed)Single bed: 2.0 ร— 1.0 m
Double bed: 2.0 ร— 1.5 m
Single bed: 1.85 ร— 0.9 m
Double bed: 1.85 ร— 1.35 m
Indian sizes smaller due to average body height
Chair SeatingSeat height: 0.45โ€“0.48 m
Seat depth: 0.45โ€“0.50 m
Seat height: 0.40โ€“0.43 m
Seat depth: 0.40โ€“0.45 m
Indian chairs slightly lower and shallower
Table / DeskHeight: 0.75โ€“0.78 mHeight: 0.72โ€“0.75 mAdjusted to Indian anthropometry
Kitchen WorktopHeight: 0.90 mHeight: 0.82โ€“0.85 mIndian kitchens lower due to shorter average height
Toilet SeatHeight: 0.40โ€“0.43 mHeight: 0.38โ€“0.40 mWestern style seats slightly taller
Passage Width (one person)0.90โ€“1.0 m0.75โ€“0.9 mNarrower passages common in Indian homes
Stair DimensionsRiser: 150โ€“170 mm
Tread: 280โ€“300 mm
Riser: 150โ€“180 mm
Tread: 250โ€“300 mm
Indian standards allow slightly steeper stairs
Work Space per Office Desk4.5โ€“6 mยฒ3.5โ€“4.5 mยฒIndians adapt to smaller workspaces
Personal Space (social distance)1.2โ€“3.6 m (average American/European)0.6โ€“1.2 m (average Indian)Reflects cultural acceptance of closeness

3๏ธโƒฃ Cultural Influence on Space Use

  • Europe/USA
    • Beds and seating furniture are dominant.
    • Greater emphasis on private rooms.
    • Minimal floor seating.
  • India
    • Flexible use of furniture โ†’ beds may double as seating.
    • Floor seating and sleeping in many households.
    • Compact kitchens and multi-functional rooms are common.

4๏ธโƒฃ Implications for Planners & Designers

  • Importing Western standards directly into Indian context often wastes space and resources.
  • Design must be localized โ†’ kitchens, toilets, furniture, and circulation areas need adjustments.
  • With globalization and lifestyle changes, Indian urban elites are shifting toward Western dimensions, but large segments of population still follow traditional compact patterns.

โœ… In summary:

  • European & American standards assume taller, bulkier body sizes and emphasize more personal space.
  • Indian requirements are scaled down, reflecting smaller average body size, space efficiency, and cultural patterns like floor activities.
  • Planners and architects must balance ergonomics + cultural appropriateness while adapting standards.

Types of scales including plain and diagonal scales.

๐Ÿ“ Types of Scales

In technical drawing and planning, a scale is used to represent large or small objects accurately on paper. Since it is not possible to draw everything in actual size, scales help convert real dimensions into manageable drawing sizes while preserving accuracy.


1๏ธโƒฃ Plain Scale

  • Definition: A plain scale can represent only two units of measurement (for example: meters and decimeters, or kilometers and hectometers).
  • Construction: It consists of a straight line divided into main units and further subdivided into smaller parts.
  • Use: Suitable for readings up to one decimal place.

๐Ÿ“Œ Example: A plain scale might show meters on the main divisions and decimeters on the subdivisions.


2๏ธโƒฃ Diagonal Scale

  • Definition: A diagonal scale can represent three units of measurement (for example: meters, decimeters, and centimeters).
  • Construction: A rectangle is drawn, divided horizontally into main units, and vertically into subdivisions. Diagonals are drawn across the small divisions, allowing very fine readings.
  • Use: Suitable for readings up to two decimal places, hence more precise than a plain scale.

๐Ÿ“Œ Example: A diagonal scale might show meters, decimeters, and centimeters all together, allowing accurate measurements.


3๏ธโƒฃ Comparative Scale

  • Definition: Used to compare measurements in different systems of units (e.g., kilometers vs. miles, meters vs. yards).
  • Use: Helpful in international or interdisciplinary projects where unit systems differ.

๐Ÿ“Œ Example: A comparative scale could show kilometers and nautical miles side by side for transport planning.


4๏ธโƒฃ Vernier Scale

  • Definition: A precise scale that uses a vernier device for measuring up to very fine accuracy.
  • Use: Allows readings much smaller than what a plain or diagonal scale can provide (used in instruments like vernier calipers, theodolites, etc.).

๐Ÿ“Œ Example: In surveying or detailed engineering drawings, a vernier scale helps achieve millimeter-level precision.


5๏ธโƒฃ Scale of Chords

  • Definition: Used to measure and construct angles in drawings.
  • Use: Mostly in geometry and navigation-related drafting.

๐Ÿ“Œ Example: In absence of a protractor, a scale of chords can construct angles like 30ยฐ, 45ยฐ, 60ยฐ, etc.


๐Ÿ”‘ Key Difference Between Plain & Diagonal Scales

FeaturePlain ScaleDiagonal Scale
Units represented2 (main unit + subdivision)3 (main unit + two subdivisions)
AccuracyUp to 1 decimal placeUp to 2 decimal places
ConstructionSimple divisions on a lineRectangle with diagonals
UseQuick, less detailed measurementsPrecise measurements

โœ… In summary:

  • Plain scales โ†’ simple, show two units.
  • Diagonal scales โ†’ more precise, show three units.
  • Comparative, vernier, and chord scales โ†’ used for specialized needs.

Concepts of scales and proportions: Sketching of human figures,ย  activities, natural and man-made elements.

โœ๏ธ Concepts of Scales and Proportions in Sketching

Photo by ROMBO on Pexels.com

Sketching is a fundamental tool for planners, architects, and designers to visualize spaces and communicate ideas. Two key principles govern effective sketching: scale and proportion. Without them, drawings lose their accuracy, realism, and communicative power.


1๏ธโƒฃ Concept of Scale

Scale is the mathematical relationship between the real-world size of an object and its representation on paper or digital media.

  • Architectural/Planning Scale:
    • Large-scale (e.g., 1:100) โ†’ Detailed sketches of buildings, streetscapes.
    • Medium-scale (e.g., 1:1000) โ†’ Urban blocks, neighborhoods.
    • Small-scale (e.g., 1:10,000) โ†’ Entire cities, regional plans.
  • Human Scale: Relates built environments to human dimensions, ensuring comfort and usability.

๐Ÿ“Œ Example: A park sketch at 1:500 scale shows benches, pathways, and trees, while a city master plan uses 1:50,000 to highlight land-use zones.


2๏ธโƒฃ Concept of Proportion

Proportion is the relative size of elements within a drawing or composition. Unlike scale (which is fixed), proportion ensures harmony and realism in how objects relate to one another.

  • Human Proportion:
    • Classical rule โ†’ An average adult is about 7โ€“8 heads tall.
    • Body parts have ratios (arm span โ‰ˆ height, hand โ‰ˆ face length, etc.).
  • Object Proportion:
    • Buildings, trees, and vehicles should be sized relative to human figures for accuracy.
  • Contextual Proportion:
    • A lamppost must look taller than a person, but smaller than a building.
    • A bicycle should not appear larger than a car in the same sketch.

๐Ÿ“Œ Tip: Use reference grids or modules to maintain proportions consistently in quick sketches.


3๏ธโƒฃ Sketching Human Figures & Activities

Planners often include people in sketches to show scale, liveliness, and usability of a space.

  • Standing Figures: Used as a height reference (average 1.6โ€“1.8 m).
  • Sitting Figures: Depict benches, bus stops, outdoor seating.
  • Activity Sketches: Walking, cycling, children playing, vendors workingโ€”help illustrate how spaces function.
  • Silhouettes & Stick Figures: Quick, simplified human sketches are enough to convey movement and proportion.

4๏ธโƒฃ Sketching Natural Elements

  • Trees: Represent scale of open spaces (small shrubs, medium trees, large canopy trees).
  • Water Bodies: Ripples, reflective shading, proportionate to surrounding context.
  • Topography: Hills, slopes, or natural barriers drawn in proportion to buildings and human figures.

5๏ธโƒฃ Sketching Man-Made Elements

  • Street Furniture: Benches, lights, dustbinsโ€”scaled in relation to human use.
  • Vehicles: Cars, buses, bicyclesโ€”drawn in proportion to road width and pedestrian figures.
  • Buildings:
    • Door height (โ‰ˆ 2 m) matches average human scale.
    • Windows, floors, and facades proportionally aligned with human activities.

6๏ธโƒฃ Why Scale & Proportion Matter for Planners

  • โœ… Ensures realism in communication.
  • โœ… Helps stakeholders imagine the usability of proposed designs.
  • โœ… Provides a relatable human connection to space.
  • โœ… Avoids distortions that mislead design decisions.

๐Ÿ”‘ In summary:

  • Scale = fixed ratio between real and drawing.
  • Proportion = harmonious relationship among parts.
    Together, they allow planners to sketch human figures, activities, and natural/man-made elements in a way that is accurate, relatable, and visually convincing.

Graphics application for planners with respect to use of lines, colours etc.

๐ŸŽจ Graphics Applications for Planners: The Power of Visual Communication

Urban and regional planning is as much about communicating ideas as it is about designing policies, strategies, and projects. Planners rely heavily on graphics, maps, and diagrams to make complex data understandable, and to influence decision-making. The thoughtful use of lines, colours, textures, and symbols transforms raw information into a narrative that is both engaging and precise.

1๏ธโƒฃ Role of Lines

Lines are the most basic graphic element but carry strong meaning in planning illustrations:

  • Boundary Lines โ†’ Define jurisdictional areas (wards, zones, districts, states).
  • Connectivity Lines โ†’ Represent roads, railways, metro corridors, or pedestrian pathways.
  • Flow Lines โ†’ Show movement of people, goods, or traffic.
  • Thickness & Style: A thick solid line emphasizes importance (national highways), while dashed or dotted lines indicate proposed features, planning boundaries, or constraints.

๐Ÿ“Œ Example: In a transportation plan, thicker bold lines can highlight major highways, while thin dotted lines can denote proposed bus routes.


2๏ธโƒฃ Role of Colours

Colour is a universal language that enhances readability and conveys emotions or priorities. In planning graphics:

  • Land-use Maps โ†’ Different colours symbolize land categories (green = open spaces, yellow = residential, purple = industrial, blue = water bodies).
  • Heat Maps โ†’ Gradient colours communicate density (light = low, dark = high).
  • Policy/Action Plans โ†’ Warm colours (red, orange) highlight urgency or danger, while cool colours (blue, green) denote calmness or sustainability.

๐Ÿ“Œ Tip: Maintain consistencyโ€”a park should always appear green, water blue, and industrial zones a contrasting tone. This helps non-expert stakeholders instantly grasp the message.


3๏ธโƒฃ Supporting Graphic Elements

  • Textures & Patterns: Hatch marks or dotted fills distinguish overlapping land uses when colour is insufficient.
  • Symbols & Icons: Universally understood icons (tree = green space, hospital cross = healthcare, bus icon = transit) make maps intuitive.
  • Typography: Font size and weight signal hierarchyโ€”city names bold, street names smaller, proposed projects italicized.

4๏ธโƒฃ Why it Matters for Planners

  • Clarity โ†’ Visuals simplify complex data for decision-makers and the public.
  • Engagement โ†’ Colours and symbols draw attention and keep audiences interested.
  • Transparency โ†’ Well-designed graphics foster trust by making plans understandable.
  • Advocacy โ†’ Strong visuals strengthen a plannerโ€™s ability to persuade communities and policymakers.

โœ… In essence: For planners, graphics are not just โ€œdecorationsโ€โ€”they are a planning tool in themselves. With careful use of lines, colours, and symbols, maps and diagrams can tell stories, reveal problems, and propose solutions in ways that words alone cannot.

Different Types of Literature Review Techniques and Their Differences

A literature review is an essential part of academic and research writing. It critically analyzes, summarizes, and synthesizes existing research related to a particular topic. Depending on the purpose, scope, and method, literature reviews can take different forms. Below are the main types of literature review techniques and how they differ from one another.


1. Narrative (Traditional) Literature Review

  • Description: Provides a broad overview of existing literature without following a strict methodology.
  • Purpose: To summarize theories, concepts, and general findings on a topic.
  • Strength: Flexible and useful for introducing a new field of study.
  • Limitation: May lack systematic rigor and be prone to author bias.

2. Systematic Literature Review (SLR)

  • Description: Follows a structured and predefined methodology to collect, analyze, and synthesize relevant studies.
  • Purpose: To answer a specific research question using transparent, replicable methods.
  • Strength: Reduces bias, provides comprehensive and reliable evidence.
  • Limitation: Time-consuming, requires strict inclusion/exclusion criteria.

3. Scoping Review

  • Description: Maps the key concepts, evidence, and gaps in the research without assessing the quality of studies.
  • Purpose: To explore the breadth of literature in an area, often before conducting an SLR.
  • Strength: Identifies gaps and research opportunities.
  • Limitation: Does not critically evaluate study quality.

4. Critical Review

  • Description: Goes beyond summarizing by analyzing and evaluating the strengths and weaknesses of existing literature.
  • Purpose: To provide an informed perspective and highlight theoretical contributions or contradictions.
  • Strength: Deep evaluation and new insights.
  • Limitation: Highly interpretive and may reflect researcher bias.

5. Meta-analysis

  • Description: A statistical technique that combines results from multiple quantitative studies to identify patterns and overall effects.
  • Purpose: To provide strong evidence by pooling numerical data.
  • Strength: Increases reliability and precision of findings.
  • Limitation: Only applicable to studies with quantitative data.

6. Meta-synthesis (or Qualitative Synthesis)

  • Description: Integrates findings from qualitative research to create new interpretations or theories.
  • Purpose: To provide deeper understanding of concepts, experiences, and social phenomena.
  • Strength: Offers richer, theory-building insights.
  • Limitation: Subjective and interpretive, may lack generalizability.

7. Mapping Review (or Evidence Mapping)

  • Description: Categorizes and visualizes research on a broad topic, often presented in charts or maps.
  • Purpose: To show trends, volume, and scope of research.
  • Strength: Useful for policymakers and funding agencies.
  • Limitation: Does not provide in-depth analysis.

8. State-of-the-Art Review

  • Description: Focuses on the most recent research and advancements in a field.
  • Purpose: To highlight emerging trends, innovations, and current debates.
  • Strength: Keeps readers updated with cutting-edge knowledge.
  • Limitation: Limited in scope; may overlook foundational studies.

Key Differences Between Literature Review Types

TypeFocusMethodologyStrengthLimitation
Narrative ReviewBroad summaryInformalFlexible, introductoryCan be biased
Systematic Review (SLR)Specific research questionStructured, replicableReliable, comprehensiveTime-consuming
Scoping ReviewBreadth, gapsMapping-focusedIdentifies gapsLacks quality assessment
Critical ReviewEvaluationAnalyticalOffers insightsInterpretive bias
Meta-analysisQuantitative resultsStatistical poolingStrong evidenceNeeds numeric data
Meta-synthesisQualitative findingsThematic synthesisBuilds new theoriesSubjective
Mapping ReviewTrends, volumeCategorization & visualizationEasy to understandSuperficial
State-of-the-Art ReviewRecent advancesFocused on latest workCurrent & innovativeNarrow scope

โœ… Conclusion:
The choice of literature review technique depends on your research question, objective, and type of data available. For a broad overview, a narrative or scoping review may suffice. For evidence-based decisions, systematic reviews and meta-analyses are ideal. For theoretical insights, critical reviews and meta-syntheses work best.

Importance of Walking and Running for a Healthy Life

Walking and running are two of the simplest yet most effective forms of physical activity that can greatly contribute to a healthy life. They donโ€™t require special equipment, can be done almost anywhere, and are suitable for people of different age groups and fitness levels. Below is a detailed explanation of their importance:


1. Physical Health Benefits

a. Cardiovascular Health

  • Both walking and running strengthen the heart by improving blood circulation and reducing the risk of heart diseases.
  • Regular practice lowers blood pressure and cholesterol levels, preventing strokes and heart attacks.

b. Weight Management

  • Running burns more calories in a shorter time, while walking is easier to sustain for longer durations.
  • Both activities help regulate body fat, boost metabolism, and maintain a healthy weight.

c. Stronger Muscles and Bones

  • Walking and running strengthen the muscles of the legs, hips, and core.
  • They improve bone density, reducing the risk of osteoporosis and fractures in old age.

d. Better Immunity

  • Moderate-intensity walking and running enhance immune system function, making the body more resistant to infections.

2. Mental Health Benefits

a. Stress Reduction

  • Walking and running stimulate the release of endorphinsโ€”often called โ€œfeel-good hormones.โ€
  • They reduce stress, anxiety, and symptoms of depression.

b. Mental Clarity and Focus

  • Regular activity improves brain function, concentration, and memory.
  • Running in particular increases blood flow to the brain, enhancing cognitive abilities.

c. Emotional Well-being

  • Outdoor walking or running exposes you to fresh air and sunlight, improving mood and vitamin D levels.

3. Lifestyle and Longevity

  • Studies show that people who walk or run regularly live longer, healthier lives.
  • Walking is especially beneficial for older adults as it maintains mobility and independence.
  • Running, when done properly and within limits, extends life expectancy by reducing chronic disease risks.

4. Accessibility and Simplicity

  • Walking can be integrated into daily routinesโ€”commuting, shopping, or leisure.
  • Running requires no equipment beyond a good pair of shoes.
  • Both are free, adaptable, and time-efficient.

5. Social and Environmental Benefits

  • Group walks or runs create opportunities for social bonding, teamwork, and community building.
  • Choosing to walk or run instead of driving helps reduce pollution and environmental damage.

6. Key Differences and Balance

  • Walking is gentler on joints, suitable for beginners, seniors, or those recovering from injury.
  • Running provides faster results in terms of fitness and calorie burn but carries a higher risk of joint strain if not done carefully.
  • A combination of both, depending on age, fitness goals, and health condition, ensures maximum benefits.

โœ… Conclusion: Walking and running are powerful habits for maintaining physical fitness, emotional stability, and overall longevity. Making them a part of daily lifeโ€”even in small amountsโ€”can significantly improve health and quality of life.

Microsoft Word Formatting Tutorial

โœ… Learn How to Use Headings, Bullets, Fonts & More


1. How to Apply Headings (H1, H2, H3, etc.)

๐Ÿ“Œ Why Use Headings?

Headings create a structured document. They make it easier to navigate, especially in long reports or books. They’re also used to auto-generate a Table of Contents.

๐Ÿงญ Steps:

  1. Highlight the text you want as a heading (e.g., a chapter or section title).
  2. Go to the Home tab on the ribbon.
  3. In the Styles group (top center), choose a heading:
    • Heading 1: For main titles (like chapter titles)
    • Heading 2: For sub-sections
    • Heading 3: For sub-sub-sections

๐Ÿ’ก Tip:

  • You can customize a heading style by right-clicking on it โ†’ Modify.
  • You can change font, color, spacing, and more for that style.

2. How to Create Bullet Points

๐Ÿ“Œ Why Use Bullets?

Bullet points make lists easier to scan and read. Use them for ideas, tasks, steps, features, etc.

๐Ÿงญ Steps:

  1. Click where you want the list, or highlight existing text.
  2. Go to the Home tab.
  3. In the Paragraph group, click the Bullets icon (a dot with three lines).
  4. To change bullet style:
    • Click the small arrow next to the bullets icon โ†’ choose different styles (dots, arrows, checkmarks).

๐Ÿ”„ Keyboard Shortcut:

  • Press Ctrl + Shift + L to start a bullet list instantly.

3. How to Use Numbered Lists

๐Ÿงญ Steps:

  1. Highlight the items you want to number.
  2. Go to Home > Paragraph > Numbering (icon looks like 1., 2., 3.).
  3. Choose from different numbering styles (1., a., i., etc.).

4. How to Change Font Type (Style)

๐Ÿ“Œ Why Use Fonts?

Fonts set the tone of your document. Choose readable fonts for body text and distinct fonts for titles.

๐Ÿงญ Steps:

  1. Highlight the text.
  2. Go to the Home tab.
  3. In the Font group (top left), click the Font dropdown.
  4. Choose a font (e.g., Calibri, Arial, Times New Roman, Georgia).

๐Ÿ’ก Common Font Choices:

  • Serif fonts (like Times New Roman) for formal writing.
  • Sans-serif fonts (like Calibri or Arial) for a clean, modern look.

5. How to Change Font Size

๐Ÿงญ Steps:

  1. Highlight your text.
  2. Go to Home > Font size dropdown (next to the font name).
  3. Choose a size (common sizes: 11 or 12 for body, 14โ€“24 for headings).

๐Ÿ”„ Keyboard Shortcut:

  • Ctrl + Shift + > to increase font size
  • Ctrl + Shift + < to decrease font size

6. How to Bold, Italicize, and Underline Text

๐Ÿงญ Steps:

  1. Highlight the text.
  2. Click the following in the Home > Font group:
    • Bold (B) โ€“ or press Ctrl + B
    • Italic (I) โ€“ or press Ctrl + I
    • Underline (U) โ€“ or press Ctrl + U

7. How to Change Text Color or Highlight Text

๐Ÿงญ Steps:

  1. Highlight the text.
  2. Go to Home > Font group.
  3. Click:
    • A with a colored bar underneath (for text color)
    • Highlighter icon (for highlight color)

8. How to Use Styles for Faster Formatting

๐Ÿงญ Steps:

  1. Highlight your text.
  2. On the Home tab, use the Styles section.
  3. Pick from:
    • Normal
    • Heading 1, 2, 3
    • Title, Subtitle
    • Quote, Emphasis, etc.

๐Ÿ›  Tip: Right-click any style > Modify to change its default appearance.


๐Ÿงพ Summary Table

FeatureWhere to Find ItShortcut
Heading 1โ€“3Home > Stylesโ€”
Bullet PointsHome > Paragraph > BulletsCtrl + Shift + L
Font TypeHome > Font dropdownโ€”
Font SizeHome > Font SizeCtrl + Shift + > / <
Bold/Italic/UnderlineHome > FontCtrl + B / I / U
Text ColorHome > Font > A iconโ€”
HighlightHome > Font > Highlighterโ€”

10 Principles of Design for Microsoft Word Documents

1. Consistency

๐Ÿ“Œ Maintain uniform formatting throughout the document.

  • Use the same font type, size, and spacing for body text.
  • Stick to a consistent heading structure (e.g., Heading 1 for titles, Heading 2 for subheadings).
  • Align margins, spacing, and list styles uniformly.

๐Ÿ›  How to do it in Word: Use Styles under the Home tab to apply consistent formatting across all text.


2. Alignment

๐Ÿ“Œ Align text and objects to create clean, organized layouts.

  • Avoid randomly placed text boxes or images.
  • Left-align body text for readability (especially for English and similar languages).
  • Center-align titles and use consistent paragraph indents.

๐Ÿ›  Use: Home > Paragraph > Alignment tools or use keyboard shortcuts like Ctrl + L for left-align.


3. Hierarchy

๐Ÿ“Œ Establish visual importance using font size, style, and weight.

  • Title > Heading > Subheading > Body text โ€” make sure each level is clearly distinguishable.
  • Use bold or larger font for headers, but donโ€™t overdo it.

๐Ÿ›  Use: Home > Styles and modify Heading styles to suit your visual needs.


4. White Space

๐Ÿ“Œ Give elements room to breathe with proper spacing.

  • Donโ€™t cram text โ€” use spacing between paragraphs and sections.
  • Avoid filling every inch of the page.

๐Ÿ›  Use: Layout > Paragraph Spacing, and adjust margins in Layout > Margins.


5. Readability

๐Ÿ“Œ Make your text easy to read at a glance.

  • Use clean fonts like Calibri, Arial, or Times New Roman.
  • Avoid using decorative or script fonts for body text.
  • Keep paragraph length manageable (4โ€“6 lines is a good average).

๐Ÿ›  Use: Home > Font tools to adjust size and type; aim for 11โ€“12 pt body text.


6. Contrast

๐Ÿ“Œ Use contrast to highlight key information.

  • Ensure there is enough contrast between text and background (especially in colored sections).
  • Use bold, italics, or color (sparingly) to emphasize important points.

๐Ÿ›  Use: Font Color, Bold, and Highlight tools under Home > Font.


7. Visual Balance

๐Ÿ“Œ Create symmetry and balance across pages.

  • Distribute text and images evenly.
  • Donโ€™t overload one section of the page while leaving others empty.
  • Use columns or tables if needed for balance.

๐Ÿ›  Use: Layout > Columns, and Insert > Table for structured layouts.


8. Simplicity

๐Ÿ“Œ Less is more. Avoid clutter.

  • Avoid excessive fonts, colors, or effects.
  • Stick to 2โ€“3 fonts max per document.
  • Don’t overuse borders, clipart, or word art.

๐Ÿ›  Tip: Stick to professional templates and minimalist design practices.


9. Visual Flow

๐Ÿ“Œ Guide the readerโ€™s eye logically through the document.

  • Use headings, bullets, and numbered lists to break up information.
  • Use visual anchors (like images or icons) to help with scanning.

๐Ÿ›  Use: Insert > Shapes, Insert > SmartArt, and Home > Lists.


10. Accessibility

๐Ÿ“Œ Design for all readers, including those with visual impairments.

  • Use high-contrast text.
  • Add alt text to images (Right-click > Edit Alt Text).
  • Avoid using color as the only way to convey meaning.

๐Ÿ›  Use: Review > Check Accessibility to run an accessibility report on your document.


๐Ÿงพ Final Tips

  • Preview your document using Print Preview (File > Print) to see how the layout translates to paper or PDF.
  • If designing for professional use, export as a PDF to preserve formatting.
  • Use Templates from the Word gallery for a head start with good design.

Google Docs Writing Tutorial Series

Tutorial 1: Getting Started with Google Docs

๐Ÿ”น What You’ll Learn:

  • Accessing Google Docs
  • Creating a new document
  • Understanding the interface
  • Saving and auto-save

โœ… Steps:

  1. Access Google Docs
  2. Create a New Document
    • Click the + Blank option or use a template (e.g. resume, report).
    • Your document opens in a new tab.
  3. Understand the Interface
    • Menu Bar: File, Edit, View, Insert, etc.
    • Toolbar: Formatting options like font, bold, alignment.
    • Document Area: Where you type and format your content.
    • Title: Click the “Untitled document” to rename.
  4. Saving
    • Auto-Save: Google Docs saves your work automatically.
    • No need to hit Saveโ€”just ensure you’re connected to the internet.

Tutorial 2: Writing and Text Formatting

๐Ÿ”น What You’ll Learn:

  • Typing and editing
  • Font and text formatting
  • Line and paragraph spacing

โœ… Steps:

  1. Typing and Editing
    • Start typing in the document area.
    • Use Backspace or Delete to remove text.
  2. Format Text
    • Highlight text and use toolbar to:
      • Change font and size
      • Apply Bold (Ctrl/Cmd + B), Italic (Ctrl/Cmd + I), Underline (Ctrl/Cmd + U)
      • Change text color or highlight
  3. Align Text
    • Toolbar icons for align left, center, right, justify.
  4. Line Spacing
    • Click Format > Line & paragraph spacing
    • Choose from 1.15, 1.5, 2.0, etc.

Tutorial 3: Organizing Your Document

๐Ÿ”น What You’ll Learn:

  • Using headings
  • Bullet and numbered lists
  • Page breaks

โœ… Steps:

  1. Use Headings
    • Highlight text > select style from dropdown (Normal text โ†’ Heading 1, 2, etc.)
    • Helps with document structure and table of contents.
  2. Lists
    • Toolbar: click bullet or numbered list icons.
    • Indent using Tab or toolbar arrows.
  3. Page Breaks
    • Insert > Break > Page Break
    • Useful for starting new chapters/sections.

Tutorial 4: Inserting Elements

๐Ÿ”น What You’ll Learn:

  • Inserting images, tables, charts
  • Drawing and shapes
  • Links and bookmarks

โœ… Steps:

  1. Insert Images
    • Insert > Image > Upload from computer / Drive / Search the web
    • Resize and move freely.
  2. Insert Tables
    • Insert > Table > Select size (e.g., 3×3)
    • Use tab to move between cells.
  3. Insert Charts
    • Insert > Chart > Choose type (bar, line, pie)
    • Link to Google Sheets for live updates.
  4. Drawings & Shapes
    • Insert > Drawing > New > Use tools to create diagrams, arrows, etc.
  5. Hyperlinks
    • Highlight text > Insert > Link
    • Add URL, email, or link to document headings/bookmarks.

Tutorial 5: Page Layout and Design

๐Ÿ”น What You’ll Learn:

  • Page size, orientation, margins
  • Headers, footers, and page numbers
  • Background and themes (limited in Docs)

โœ… Steps:

  1. Page Setup
    • File > Page setup:
      • Set page size (e.g., A4, Letter)
      • Set orientation (Portrait or Landscape)
      • Set margins
  2. Headers and Footers
    • Insert > Headers & footers
    • Add titles, dates, or authorship info
  3. Page Numbers
    • Insert > Page numbers
    • Choose location and starting number

Tutorial 6: Collaboration and Review

๐Ÿ”น What You’ll Learn:

  • Sharing documents
  • Comments and suggestions
  • Version history

โœ… Steps:

  1. Share Your Document
    • Click the Share button (top-right)
    • Choose who can view/comment/edit
    • Generate a shareable link if needed
  2. Comments
    • Highlight text > Click comment icon or use Ctrl + Alt + M
    • Collaborators can reply or resolve comments
  3. Suggesting Mode
    • Top-right: Click “Editing” > switch to “Suggesting”
    • Suggested changes appear as tracked edits (like in MS Word)
  4. Version History
    • File > Version history > See version history
    • Restore previous versions or view edit timeline

Tutorial 7: Finalizing Your Document

๐Ÿ”น What You’ll Learn:

  • Table of contents
  • Spelling and grammar check
  • Exporting and printing

โœ… Steps:

  1. Add a Table of Contents
    • Insert > Table of contents
    • Based on headings (Heading 1, 2, etc.)
    • Click entries to jump through document
  2. Spelling & Grammar
    • Tools > Spelling and grammar
    • Enable automatic checking or run manually
  3. Word Count
    • Tools > Word count (or Ctrl + Shift + C)
    • Shows words, pages, characters
  4. Download or Export
    • File > Download as:
      • PDF
      • Microsoft Word (.docx)
      • Plain Text
      • HTML
      • EPUB (for eBooks)
  5. Print
    • File > Print or Ctrl + P
    • Choose layout, pages, and options

โœ… Bonus Tips for Writers

  • Voice Typing: Tools > Voice typing (use your mic to write)
  • Offline Access: Enable Docs offline via Google Drive settings
  • Document Outline: View > Show outline โ€” navigate through headings
  • Add-ons: Extend features using tools like Grammarly, EasyBib, etc.

Microsoft Word Writing Tutorial Series

Tutorial 1: Getting Started with Microsoft Word

๐Ÿ”น What You’ll Learn:

  • Opening Word
  • Understanding the Interface
  • Creating a New Document
  • Saving Documents

โœ… Steps:

  1. Open MS Word
    • Launch Microsoft Word from your desktop, start menu, or applications folder.
    • Choose Blank Document or select a template if desired.
  2. Understand the Interface
    • Ribbon: Toolbar at the top with tabs (Home, Insert, Design, etc.).
    • Document Area: The blank space where you type.
    • Status Bar: Shows word count, page number, etc.
    • Quick Access Toolbar: For common actions like save, undo, redo.
  3. Create a New Document
    • Click File > New > Blank Document to start from scratch.
  4. Save Your Work
    • File > Save As to save the first time.
    • Choose location and format (e.g., .docx).
    • Use Ctrl + S regularly to save changes.

Tutorial 2: Basic Writing and Formatting

๐Ÿ”น What You’ll Learn:

  • Typing and editing text
  • Formatting text (font, size, bold, italics)
  • Using paragraphs and line spacing

โœ… Steps:

  1. Typing Text
    • Click in the document and start typing.
    • Use Enter to create a new paragraph.
  2. Editing Text
    • Use mouse or arrow keys to navigate.
    • Use Backspace and Delete to remove text.
  3. Formatting Text
    • Highlight text, then use the Home tab:
      • Bold: Ctrl + B
      • Italic: Ctrl + I
      • Underline: Ctrl + U
      • Change font and size from the dropdown.
  4. Paragraph Formatting
    • Use Align Left, Center, Right, Justify buttons.
    • Set line spacing: Home > Paragraph > Line and Paragraph Spacing.

Tutorial 3: Structuring Your Document

๐Ÿ”น What You’ll Learn:

  • Headings and subheadings
  • Bullets and numbering
  • Page breaks and sections

โœ… Steps:

  1. Use Headings
    • Use Styles: Home > Styles > Heading 1, Heading 2, etc.
    • Helps organize and auto-generate a Table of Contents later.
  2. Bullets and Numbering
    • Home > Paragraph > Bullets or Numbering
    • Great for lists and outlines.
  3. Page and Section Breaks
    • Insert breaks: Insert > Break > Page Break or Section Break
    • Use to separate chapters or sections.

Tutorial 4: Inserting and Using Objects

๐Ÿ”น What You’ll Learn:

  • Inserting images, tables, and charts
  • Using SmartArt
  • Inserting hyperlinks

โœ… Steps:

  1. Insert Images
    • Insert > Pictures > From File or Online Pictures
    • Resize by dragging corners.
  2. Insert Tables
    • Insert > Table, select rows and columns.
    • Add data like spreadsheets.
  3. Insert Charts
    • Insert > Chart, choose type (bar, line, pie).
    • Opens Excel-style window to edit data.
  4. SmartArt
    • Insert > SmartArt, use for diagrams and flowcharts.
  5. Hyperlinks
    • Highlight text > Insert > Link
    • Add URLs, email addresses, or link to parts of your document.

Tutorial 5: Page Layout and Design

๐Ÿ”น What You’ll Learn:

  • Margins and orientation
  • Headers and footers
  • Page numbers
  • Themes and colors

โœ… Steps:

  1. Set Margins
    • Layout > Margins, choose Normal, Narrow, or Custom.
  2. Orientation & Size
    • Layout > Orientation (Portrait or Landscape)
    • Layout > Size (A4, Letter, etc.)
  3. Headers and Footers
    • Insert > Header or Footer
    • Add titles, dates, or author name.
  4. Page Numbers
    • Insert > Page Number, choose location and style.
  5. Themes and Colors
    • Design > Themes to apply a visual theme.
    • Design > Colors and Fonts to customize.

Tutorial 6: Proofing and Reviewing

๐Ÿ”น What You’ll Learn:

  • Spell check and grammar check
  • Thesaurus
  • Word count
  • Comments and Track Changes

โœ… Steps:

  1. Spelling and Grammar
    • Review > Spelling & Grammar or press F7
    • Errors underlined in red (spelling) or blue (grammar).
  2. Thesaurus
    • Right-click a word > Synonyms
    • Or use Review > Thesaurus
  3. Word Count
    • Review > Word Count to see how many words, pages, characters.
  4. Comments
    • Highlight text > Review > New Comment
    • Useful for giving feedback.
  5. Track Changes
    • Review > Track Changes
    • Shows edits and suggestions visibly for collaboration.

Tutorial 7: Finalizing and Exporting

๐Ÿ”น What You’ll Learn:

  • Creating Table of Contents
  • Saving as PDF
  • Printing
  • Document protection

โœ… Steps:

  1. Table of Contents
    • Use Heading Styles
    • References > Table of Contents to auto-generate
  2. Save or Export as PDF
    • File > Save As > Choose PDF from format options
    • Or File > Export > Create PDF
  3. Print
    • File > Print
    • Choose printer, pages, orientation, and hit Print
  4. Protect Document
    • File > Info > Protect Document
    • Add password or restrict editing if needed

โœ… Bonus Tips for Writers

  • AutoSave (if using OneDrive): Helps prevent data loss.
  • Templates: Use built-in templates for resumes, reports, etc.
  • Navigation Pane: View > Navigation Pane shows headings and makes long docs easier to navigate.
  • Dark Mode: File > Account > Office Theme

Integration of knowledge of all subjects to understand dynamics ofย  planning projects small and big

๐ŸŒ Integration of Knowledge in Planning Projects

Planning projectsโ€”ranging from a small park to a large urban developmentโ€”require a holistic understanding that combines multiple fields. Successful planning is not just about drawing maps or designing buildings; itโ€™s about understanding people, space, environment, and systems together.


1๏ธโƒฃ Core Disciplines Involved

๐Ÿ”น a) Urban & Regional Planning

  • Zoning, land use, and urban design.
  • Planning frameworks, regulations, and development controls.
  • Site analysis and location assessment.

๐Ÿ”น b) Architecture & Design

  • Building forms, scale, and aesthetics.
  • Functional layouts of buildings and open spaces.
  • Interior planning and ergonomics.

๐Ÿ”น c) Environmental Science

  • Climate-responsive design.
  • Water management, drainage, and green infrastructure.
  • Biodiversity and natural resource management.

๐Ÿ”น d) Sociology & Human Geography

  • Understanding communities, demographics, and social behavior.
  • Cultural practices affecting space usage.
  • Public participation and stakeholder engagement.

๐Ÿ”น e) Economics & Infrastructure

  • Cost estimation and budget planning.
  • Transport networks, energy systems, and utilities.
  • Land value and economic feasibility studies.

๐Ÿ”น f) Engineering & Technology

  • Structural engineering for building safety.
  • Civil engineering for roads, bridges, and water systems.
  • GIS, remote sensing, and data analytics for site planning.

2๏ธโƒฃ Integration for Small Projects

  • Example: Community park
    • Landscape design โ†’ aesthetic and functional open space.
    • Environmental knowledge โ†’ tree species, water management.
    • Sociology โ†’ seating arrangement for different user groups.
    • Urban planning โ†’ location accessibility, parking, connectivity.
    • Economics โ†’ budget allocation for materials and maintenance.

Integration ensures the park is functional, sustainable, and user-friendly.


3๏ธโƒฃ Integration for Large Projects

  • Example: Urban housing or industrial township
    • Urban planning โ†’ zoning, land-use allocation, circulation networks.
    • Architecture & Engineering โ†’ high-rise buildings, structural safety.
    • Environmental science โ†’ stormwater management, energy-efficient design.
    • Sociology โ†’ designing public spaces, social amenities, schools, hospitals.
    • Economics โ†’ phasing development, affordability, financing models.
    • Technology & Data โ†’ GIS-based site analysis, traffic modeling, environmental impact assessment.

Integration ensures efficiency, sustainability, social equity, and long-term resilience.


4๏ธโƒฃ Dynamic Understanding

Planning is dynamic because:

  • Stakeholder needs evolve.
  • Environmental and economic conditions change.
  • Technology introduces new possibilities.

By integrating knowledge from multiple disciplines, planners can adapt, anticipate, and optimize project outcomes.


5๏ธโƒฃ Key Benefits of Knowledge Integration

AspectBenefit
Multidisciplinary approachHolistic design solutions
Data-driven decisionsAccuracy and reliability
Community-centered designEnhanced user satisfaction
Sustainability focusLong-term environmental and social resilience
Efficient resource useCost-effective projects

โœ… In summary:

  • Small projects โ†’ integration improves usability, comfort, and aesthetics.
  • Large projects โ†’ integration ensures functional, sustainable, and economically viable urban development.
  • Planners must combine planning, architecture, environmental science, sociology, economics, and engineering for informed, dynamic decision-making.