Education is the process of facilitating learning, or the acquisition of knowledge, skills, values, beliefs, and habits. Educational methods include teaching, training, storytelling, discussion and directed research
English comprehension is the ability to read, listen, and understand written or spoken English effectively. It is a foundation for academic success, professional growth, and day-to-day communication.
Types of Comprehension
Reading Comprehension – Understanding written texts such as articles, reports, or essays.
Listening Comprehension – Understanding spoken language in conversations, lectures, or discussions.
Skills Required
Vocabulary knowledge – Understanding words and their meanings.
Grammar understanding – Sentence structure, tense, and syntax.
Inference skills – Reading between the lines to derive hidden meaning.
Analytical thinking – Identifying arguments, main ideas, and supporting points.
Summarization – Condensing large texts into key points.
Example (Reading comprehension passage & question):
Passage: “Technical communication plays a vital role in modern industries. It not only transmits ideas but also ensures that innovation can be replicated and improved by others.”
Question: What is the role of technical communication in industries? Answer: It helps transmit ideas and ensures innovation can be replicated and improved.
2. Oral Communication
Oral communication is the process of expressing information, ideas, and emotions through spoken words. It is crucial in interviews, presentations, team discussions, client meetings, and everyday life.
Forms of Oral Communication
Face-to-face conversation – Direct exchange of ideas.
Group discussions/Meetings – Sharing viewpoints in professional or academic settings.
Presentations and speeches – Structured oral delivery of information.
Telephonic/online communication – Calls, video conferences, etc.
Key Elements
Clarity – Speak clearly and avoid ambiguity.
Confidence – Maintain steady tone and posture.
Pronunciation – Use correct word stress and intonation.
Listening skills – Effective oral communication requires active listening.
Non-verbal cues – Body language, facial expressions, and gestures.
3. Importance in Academic and Professional Life
English comprehension helps in reading instructions, research papers, manuals, and contracts.
Oral communication builds confidence in interviews, enhances teamwork, and improves leadership skills.
Together, they develop a person’s overall communication competency.
4. Example Situations
Comprehension: Reading a technical manual and correctly applying the procedure.
Oral communication: Explaining a project plan to a team in a meeting.
✅ In summary:
English comprehension = Understanding (input).
Oral communication = Expressing (output). Both are interconnected: good comprehension improves speaking, and strong oral skills reinforce understanding.
Track2Training is a platform dedicated to learning, knowledge sharing, and empowering individuals through meaningful content. As a contributor, it’s essential to maintain high-quality standards, consistency, and a professional tone in your articles. This guideline will walk you through the process of writing, formatting, and publishing articles on Track2Training.
1. Article Structure and Formatting
To maintain consistency across the platform, follow this structure:
Headings (H1, H2, H3)
Use H1 for the main title of the article.
Use H2 for main sections within the article.
Use H3 if needed for sub-sections within an H2.
Writing Style
Keep the tone informative, engaging, and professional.
Write in paragraphs — avoid one-line sentences.
Avoid plagiarism at all costs.
Aim for a word count of 500–1000+ words.
2. Add an Author Line
Right below the title, add your name as the author.
Example: Title: The Future of Online Education By Your Name
3. Include Images
Use at least one relevant image in each article.
You can use free image sites like Pexels or insert a direct image URL.
To maintain contributor status and grow your audience:
Post at least 2 articles daily.
Ensure that both articles are unique and well-researched.
7. Share Your Article
Once your article is published:
Share the live link on your social media platforms:
LinkedIn
Twitter (X)
Facebook
Instagram
Encourage likes, shares, and comments to increase engagement.
Conclusion
Consistency, quality, and engagement are key to making the most of your time at Track2Training. By following these guidelines, you ensure that your content not only informs but also resonates with the audience. Keep learning, keep writing, and keep growing.
References
Brown, K., & Hood, S. (1989). Writing matters: Writing skills and strategies for students of English. Cambridge university press.
Bracewell, R. J. (2020). Investigating the control of writing skills. In Reading Empirical Research Studies (pp. 436-463). Routledge.
Dehalwar, K., & Sharma, S. N. (2023). Fundamentals of research writing and uses of research methodologies. Edupedia Publications Pvt Ltd.
Dehalwar, K. S. S. N., & Sharma, S. N. (2024). Exploring the distinctions between quantitative and qualitative research methods. Think India Journal, 27(1), 7-15.
Kellogg, R. T., & Raulerson, B. A. (2007). Improving the writing skills of college students. Psychonomic bulletin & review, 14(2), 237-242.
Sharma, S. N. (2014). Participatory Planning in Plan Preparation. BookCountry.
Sharma, S. N., Dehalwar, K., & Singh, J. (2024). Emerging techniques of solid waste management for sustainable and safe living environment. In Solid Waste Management: Advances and Trends to Tackle the SDGs (pp. 29-51). Cham: Springer Nature Switzerland.
A comprehensive technical report is divided into three main parts: Front Matter, Body, and Terminal Section.
1. Front Matter (Preliminary Section)
This section introduces the report and provides navigation tools.
a) Preface
Placed before the main text.
Explains the background, motivation, and purpose of the report.
May mention challenges faced during the preparation of the report.
Example: “This report documents the findings of a project on renewable energy systems conducted from Jan–June 2025 at XYZ Institute.”
b) Acknowledgments
Expression of gratitude to individuals, organizations, or funding agencies that supported the work.
Example: “The author thanks Dr. ABC for guidance, and XYZ Labs for providing equipment support.”
c) Contents (Table of Contents)
List of chapters, sections, and subsections with page numbers.
Helps readers navigate the document.
d) Indexing
Alphabetical listing of important terms/topics with page references at the end of the report.
Example: “Energy efficiency, 56; Solar panels, 78; Wind turbines, 102.”
e) Keyword Indexing (Keyword List)
A list of key terms relevant to the report for quick reference.
Also useful for digital archiving and retrieval in databases.
Example: Keywords: Solar energy, Photovoltaic cells, Sustainable power, Energy efficiency.
2. Main Body (Core Section)
The central and most detailed section of the report.
Introduction – Objectives, scope, background.
Literature Review / Background Study – Prior research or standards.
Methodology / Experimental Setup – How the study was conducted.
Results / Findings – Data, figures, tables.
Discussion / Analysis – Interpretation and implications.
Conclusion – Summary of findings.
Recommendations(if applicable) – Suggestions for improvements or future work.
3. Terminal Section (End Matter / Back Matter)
Contains supplementary information and references.
References / Bibliography – Cited sources, standards, and literature.
Appendices – Additional material such as raw data, codes, large tables, questionnaires.
Index (if not placed earlier) – Complete alphabetical listing of terms/topics.
Glossary (optional) – Definitions of technical terms for non-expert readers.
Summary Structure at a Glance
Front Matter:
Preface
Acknowledgments
Table of Contents
Indexing / Keyword Indexing
Main Body:
Introduction
Literature Review (if any)
Methodology
Results
Discussion
Conclusion & Recommendations
Terminal Section:
References
Appendices
Index / Glossary
✅ This extended structure makes the report reader-friendly, searchable, and professional, especially when it is intended for wide circulation or archival.
A technical report is organized systematically so that readers can follow the work easily. The structure usually consists of three main parts: Front Matter, Main Body, and End Matter.
1. Title Page
The first page of the report.
Title of the report (specific and descriptive).
Name(s) of author(s).
Designation and affiliation (organization, department, or institution).
Date of submission.
Report number/project name (if applicable).
2. Abstract / Executive Summary
A short summary (150–300 words).
Includes the purpose, methods, major findings, and conclusions.
Allows busy readers to quickly grasp the essence of the report.
3. Acknowledgments(optional)
Expression of gratitude to individuals, organizations, or sponsors who helped in preparing the report.
4. Table of Contents (ToC)
List of all sections, subsections, and appendices with page numbers.
5. List of Figures and Tables(if applicable)
Provides quick access to important visuals included in the report.
6. Introduction
Background and context of the problem or project.
Objectives of the report.
Scope and limitations.
Importance/relevance of the work.
7. Literature Review / Background Study(optional, for research reports)
Summary of existing studies, theories, or standards related to the topic.
Shows how the current work fits into the broader field.
8. Methodology / Experimental Procedure
Methods, tools, equipment, and techniques used.
Research design, sampling, or testing procedures.
Enough detail so the work can be replicated by others.
9. Results / Findings
Presentation of data collected through experiments, surveys, or analysis.
Often supported by tables, graphs, and charts.
Objective — no interpretation here.
10. Discussion / Analysis
Interpretation of results.
Comparison with expected outcomes, previous research, or standards.
Explanation of significance, trends, and implications.
11. Conclusion
Summary of main findings.
Reflection on whether objectives were achieved.
Overall contribution of the work.
12. Recommendations(if needed)
Suggestions for improvement, future work, or practical applications.
13. References / Bibliography
List of all sources cited in the report (books, journal articles, websites, standards).
Must follow a consistent citation style (e.g., APA, IEEE, MLA).
14. Appendices
Supplementary material not included in the main text.
Examples: raw data, sample calculations, detailed questionnaires, program code.
Sample Flow of Technical Report
Front Matter: Title Page → Abstract → Acknowledgments → Contents → List of Figures/Tables Main Body: Introduction → Methodology → Results → Discussion → Conclusion → Recommendations End Matter: References → Appendices
✅ This format ensures clarity, professionalism, and logical presentation in technical communication.
A technical report is a structured document that presents technical information, research findings, or project results in a systematic manner. It is written to communicate clearly with engineers, researchers, managers, or decision-makers. The report follows a standardized format to ensure clarity, consistency, and ease of reference.
Screenshot
General Format of a Technical Report
A typical technical report contains three major sections:
Preliminary Section (Front Matter)
Main Body
End Matter (Back Matter)
1. Preliminary Section (Front Matter)
These are the elements that appear before the main text:
Title Page
Report title (clear and specific)
Author’s name & designation
Institution/organization name
Date of submission
Project/course details (if applicable)
Acknowledgments(optional)
Recognition of people, organizations, or funding agencies that supported the work.
Abstract / Executive Summary
A short summary (150–300 words) of the purpose, method, results, and conclusions.
Helps readers quickly understand the report without reading the entire document.
Table of Contents (ToC)
List of chapters/sections with page numbers.
List of Figures & Tables
Optional, but useful in long reports for quick reference.
2. Main Body
This is the core of the report, containing detailed information:
Introduction
Background of the topic or problem.
Objectives and scope of the report.
Importance or relevance of the study/project.
Literature Review / Background Study(if applicable)
Summary of previous work, theories, or standards related to the topic.
Helps in establishing context.
Methodology / Experimental Procedures
Tools, techniques, and methods used.
Detailed enough for others to replicate the work.
Includes formulas, equipment, software, standards followed.
Results / Findings
Presentation of data collected.
Use of charts, graphs, tables, and figures for clarity.
Objective description without interpretation.
Discussion / Analysis
Interpretation of results.
Comparison with expected outcomes or previous studies.
Implications, strengths, and limitations of the work.
Conclusion
Summary of major findings.
Whether objectives were achieved.
Implications of the work.
Recommendations(if required)
Suggestions for improvements, further research, or actions to be taken.
3. End Matter (Back Matter)
References / Bibliography
List of books, journal articles, websites, or standards cited in the report.
Follow citation style (APA, IEEE, MLA, or institutional guidelines).
Appendices
Supplementary information not included in the main text.
Example: raw data, detailed calculations, code snippets, maps, questionnaires.
Sample Structure of a Technical Report
Title Page
Acknowledgments (optional)
Abstract / Executive Summary
Table of Contents
List of Figures and Tables (if needed)
Introduction
Literature Review (optional)
Methodology
Results
Discussion
Conclusion
Recommendations (if required)
References
Appendices
Conclusion
The format and elements of a technical report ensure that information is presented in a logical, standardized, and professional manner. A good technical report combines clarity, structure, and evidence so that the reader can easily understand the purpose, methods, results, and significance of the work.
Technical reports are distinct from other forms of writing (literary, scientific, or business) because they aim to convey specialized information in a clear, structured, and practical manner. They document processes, methods, results, and recommendations in a way that can be used, replicated, or acted upon. Below are the major characteristics that define effective technical report writing:
1. Clarity and Precision
Technical reports must be clear, concise, and unambiguous.
Use of jargon should be minimized or explained when necessary.
Precision in terms of numbers, measurements, and terminology is essential to avoid misinterpretation.
Example: Instead of writing “The machine performed better at higher loads”, a precise report would state “The machine efficiency increased by 12% when the load was raised from 200 kg to 250 kg.”
2. Objectivity and Accuracy
Reports must be factual and free from personal opinions or bias.
Every statement should be supported by data, evidence, or references.
Accuracy in technical details (formulas, figures, experimental results) is crucial because decisions may rely on them.
3. Structured Format
Technical reports follow a logical structure that helps readers easily locate information.
Common sections include:
Title Page
Abstract / Executive Summary
Introduction
Methodology
Results / Findings
Discussion
Conclusion & Recommendations
References & Appendices
4. Use of Visual Aids
Since technical information can be complex, tables, charts, graphs, diagrams, and flowcharts are frequently used to simplify and illustrate content.
Visuals must be properly labeled, numbered, and referred to in the text.
5. Formal and Objective Language
Language should be professional, impersonal, and formal.
Passive voice is commonly used to emphasize processes over the author (e.g., “The sample was tested at 40°C” instead of “We tested the sample at 40°C”).
6. Conciseness
Technical reports must avoid unnecessary details or wordiness.
Long explanations are broken down into short paragraphs, bullet points, or numbered lists for easy comprehension.
7. Emphasis on Usability
The report should provide information that readers can apply in practice, such as specifications, guidelines, or procedures.
It must be reader-centered, focusing on what the audience needs (engineers, managers, researchers, or policymakers).
8. Documentation and Referencing
Proper citation of sources, references to standards, and acknowledgment of previous studies or reports are essential.
This increases credibility and allows readers to verify information.
9. Impersonality and Professional Tone
Unlike literary or business writing, technical reports avoid emotional or persuasive tones.
The writing emphasizes facts, data, and logical reasoning, maintaining professionalism.
10. Reproducibility
Methods and processes must be described in enough detail that others can replicate the work or experiment.
This is particularly important in engineering and scientific contexts.
Conclusion
The specific characteristics of technical report writing — clarity, accuracy, structure, conciseness, objectivity, and usability — make it a unique form of professional communication. These qualities ensure that the report serves as a reliable document for decision-making, implementation, or future reference.
A literature survey (or literature review) is the systematic process of collecting, analyzing, and summarizing existing research, theories, and reports related to a particular topic. It provides the foundation for any technical report, thesis, or research paper.
1. Use of Libraries
Libraries are primary sources for gathering authentic and reliable information.
University/Institution Libraries
Access to textbooks, journals, technical reports, conference proceedings, theses, and dissertations.
Special collections (archives, maps, standards, government reports).
Read abstracts and summaries to filter relevant works.
Review and analyze critically – identify gaps, trends, methodologies.
Organize references (using tools like Mendeley, Zotero, EndNote).
Write the survey logically (thematic, chronological, or methodological order).
✅ In short:
Libraries provide access to authentic materials.
Indexing enables efficient retrieval of information.
Reference materials build the foundation for analysis and synthesis in a literature survey.
References
Bornmann, L. (2013). What is societal impact of research and how can it be assessed? A literature survey. Journal of the American Society for information science and technology, 64(2), 217-233.
Cline, W. R. (1975). Distribution and development: A survey of literature. Journal of Development Economics, 1(4), 359-400.
Dehalwar, K., & Sharma, S. N. (2024). Social Injustice Inflicted by Spatial Changes in Vernacular Settings: An Analysis of Published Literature. ISVS e-journal, Vol. 11, Issue 9. https://isvshome.com/pdf/ISVS_11-09/ISVSej_11.09.07.pdf
Dehalwar, K., & Sharma, S. N. (2024). Politics in the Name of Women’s Reservation. Contemporary Voice of Dalit, 2455328X241262562. https://doi.org/10.1177/2455328X241262562
Knopf, J. W. (2006). Doing a literature review. PS: Political Science & Politics, 39(1), 127-132.
Sharma, S. N., & Dehalwar, K. (2025). A Systematic Literature Review of Transit-Oriented Development to Assess Its Role in Economic Development of City. Transportation in Developing Economies, 11(2), 23. https://doi.org/10.1007/s40890-025-00245-1
Sharma, S. N., Singh, S., Kumar, G., Pandey, A. K., & Dehalwar, K. (2025). Role of Green Buildings in Creating Sustainable Neighbourhoods. IOP Conference Series: Earth and Environmental Science, 1519(1), 012018. https://doi.org/10.1088/1755-1315/1519/1/012018
Van Der Waldt, G. (2021). Elucidating the application of literature reviews and literature surveys in social science research. Administratio Publica, 29(1), 1-20.
Reports are structured forms of communication used to present facts, findings, analysis, and recommendations. They can vary significantly depending on the field, purpose, and audience. Among the most common are technical reports, scientific reports, legal reports, and other professional communications.
1. Types of Reports
a) Technical Reports
Present technical information, processes, or results of projects and experiments.
Focus on accuracy, clarity, and usability of technical data.
Common in engineering, IT, industry, and applied sciences.
Example: A report on the performance of a new software system or a structural safety analysis.
b) Scientific Reports
Present findings of scientific research and experiments.
Follow a standard structure: Abstract, Introduction, Methodology, Results, Discussion, Conclusion, References.
Aim to advance knowledge and are written for other researchers, academicians, or journals.
Example: A laboratory research paper on climate change impacts.
c) Legal Reports
Present information relevant to law, compliance, or legal disputes.
Focus on facts, evidence, case precedents, and legal interpretations.
Must be highly precise and conform to legal standards and formats.
Example: Case briefs, investigation reports, or legal compliance documents.
d) Business/Commercial Reports
Used in organizations for decision-making, planning, and monitoring.
Can be financial, market research, feasibility, or performance reports.
Example: Annual business performance report, project feasibility study.
e) Administrative/Government Reports
Prepared by government or administrative bodies.
Aim to inform policymakers, the public, or stakeholders.
Example: Census reports, policy white papers.
f) Educational/Academic Reports
Used in universities and research institutions.
Include dissertations, student project reports, and institutional evaluations.
2. Differences Between Technical, Scientific, Legal, and Other Communications
Aspect
Technical Communication
Scientific Communication
Legal Communication
Business/Other Communication
Purpose
To explain technical processes, designs, or systems for practical use.
To present original research, findings, and theories for knowledge advancement.
To document facts, arguments, and interpretations for legal matters.
To provide information for decision-making, policy, or organizational activities.
Audience
Engineers, technicians, industry experts, clients.
Researchers, academicians, scientists, journals.
Judges, lawyers, clients, government bodies.
Managers, stakeholders, employees, public.
Content Focus
Data-driven, factual, application-oriented.
Hypothesis, experiments, results, theories.
Evidence, law interpretation, case references.
Market trends, finance, strategy, operations.
Language Style
Clear, precise, often with visuals (charts, diagrams).
Formal, academic, objective, structured.
Strict, formal, exact wording; legal terminology.
Professional, persuasive, may be descriptive or analytical.
Technical vs. Scientific: Technical reports are application-oriented (how to use knowledge), while scientific reports are knowledge-oriented (why and what happens).
Technical vs. Legal: Technical reports emphasize usability and precision of technical data, while legal reports emphasize interpretation and compliance with law.
Scientific vs. Legal: Scientific communication is exploratory and hypothesis-driven, while legal communication is fact-driven and bound by legal frameworks.
Business vs. Others: Business communication often balances factual reporting with persuasive recommendations, unlike the strict objectivity of scientific or legal reports.
✅ In summary:
Technical communication = practical application of technical data.
Scientific communication = contribution to academic knowledge.
Legal communication = adherence to laws, facts, and legal reasoning.
Other reports (business, administrative, educational) = decision-making, management, or public awareness.
The United Nations (UN) has been at the forefront of shaping global population policies since the mid-20th century. Recognizing the interlinkages between population growth, sustainable development, health, and human rights, the UN provides guidelines and frameworks through international conferences, resolutions, and agencies. The central philosophy underpinning UN population policy is that population issues must be addressed within the broader context of development, human dignity, and gender equality.
1945 onwards: The UN began monitoring global demographic trends through the Population Division of the Department of Economic and Social Affairs (UNDESA).
1954: First World Population Conference (Rome) initiated global discourse on demographic concerns.
1974 (Bucharest): World Population Plan of Action adopted – emphasized that “development is the best contraceptive.”
1984 (Mexico City): Renewed focus on integrating population with development and family planning.
1994 (Cairo):International Conference on Population and Development (ICPD) became a landmark, shifting the focus from population control to reproductive health, rights, and choices.
3. Key Elements of UN Population Policy Framework
The UN population policy framework is not a single fixed document, but rather a set of guiding principles consolidated through conferences, resolutions, and agency reports (especially by UNFPA – United Nations Population Fund). Its core elements include:
Human Rights and Reproductive Health
Every individual has the right to decide freely and responsibly the number, spacing, and timing of their children.
Access to family planning, safe childbirth, and reproductive health services must be universal.
Gender Equality and Empowerment of Women
Women’s education, participation in decision-making, and economic empowerment are central to population policy.
Sustainable Development Linkages
Population issues (fertility, mortality, migration, ageing) are integrated with the 2030 Agenda for Sustainable Development (SDGs).
Policies emphasize balance between human numbers and available resources.
Migration and Urbanization
Recognizes the importance of internal and international migration, urban growth, and their social, economic, and environmental implications.
Ageing Population
Encourages states to prepare policies for ageing societies, focusing on health, social security, and intergenerational equity.
Youth and Adolescents
Expands access to education, reproductive health, and employment opportunities to harness the demographic dividend.
4. Institutional Framework
United Nations Population Division (UNDESA): Provides demographic data and research.
UNFPA (United Nations Population Fund): Leads implementation of UN population programs, including reproductive health, family planning, and gender equality.
Commission on Population and Development (CPD): A functional commission of ECOSOC, reviews and monitors implementation of ICPD Programme of Action.
5. ICPD Programme of Action (1994) – A Cornerstone Document
Endorsed by 179 countries in Cairo.
Shifted focus from demographic targets (population control) to individual well-being and human rights.
Set goals for:
Universal access to reproductive health services by 2015 (later aligned with SDGs).
Reducing infant, child, and maternal mortality.
Universal primary education.
Closing gender gaps in education and employment.
6. Population and the SDGs
The UN’s current population policy framework is deeply integrated with the Sustainable Development Goals (2015–2030):
Goal 3: Ensure healthy lives and promote well-being (maternal and child health, reproductive health).
Goal 5: Achieve gender equality and empower women and girls.
Goal 10: Reduce inequality (including migration and mobility issues).
Goal 11: Make cities and human settlements inclusive and sustainable (urban population challenges).
7. Criticisms and Challenges
Some critics argue UN population policies are overly influenced by Western development models.
Implementation varies across countries due to cultural, religious, and political contexts.
Funding gaps, especially in reproductive health and family planning, slow progress.
Rising challenges such as climate change, migration crises, and global ageing require constant adaptation of the framework.
8. Conclusion
The Population Policy documents of the UN represent a dynamic framework, evolving from early concerns about “population control” to a rights-based approach centered on health, gender equality, and sustainable development. The ICPD Programme of Action (1994) remains the most influential milestone, guiding governments, civil society, and development partners toward a vision where population issues are integrated with human rights and sustainable futures.
Proposed a spatial reorganization of settlements to reduce over-concentration in large cities.
Identified a hierarchy of settlements:
National Priority Cities (NPUs): 329 cities strategically important for balanced development.
Urban Corridors: Linear clusters of cities along major transport routes (Delhi–Kanpur, Mumbai–Pune, Chennai–Bangalore, etc.).
Emerging Growth Centers: Smaller towns to act as regional hubs to check excessive migration to metros.
3. Balanced Urban-Rural Linkages
Emphasized strengthening urban–rural linkages by promoting market towns and service centers.
Advocated for Integrated Regional Planning, treating rural and urban as complementary rather than separate.
4. Focus on Metropolitan Cities
Recognized the dominant role of metros like Delhi, Mumbai, Kolkata, and Chennai.
Called for planned management of metropolitan regions to tackle congestion, housing shortages, and infrastructure deficits.
Stressed regional planning authorities for metro areas.
5. Equity and Inclusivity
Highlighted the problems of slums, poverty, and informal sector workers in cities.
Urged policies for affordable housing, slum improvement, and social infrastructure.
Stressed inclusive urbanization to prevent widening social inequalities.
6. Institutional and Administrative Reforms
Recommended strengthening urban local bodies (ULBs).
Called for decentralization of governance and greater role of municipalities in planning, finance, and service delivery.
Suggested capacity-building programmes for urban administrators.
7. Urban Infrastructure and Finance
Identified infrastructure deficit as the biggest urban challenge (housing, water supply, sanitation, transport).
Suggested mobilization of municipal finance through:
Property tax reforms.
User charges for services.
Access to capital markets (municipal bonds).
Advocated public-private partnerships (PPPs) in infrastructure.
8. Housing and Land Policy
Suggested removal of artificial constraints like the Urban Land Ceiling and Regulation Act (ULCRA).
Called for land-use planning reforms to ensure adequate land supply for housing.
Focus on low-cost housing and upgradation of existing slums rather than eviction.
9. Transport and Mobility
Stressed the importance of urban transport systems (mass transit, bus services, non-motorized transport).
Recommended integrated transport planning at regional level.
10. Environmental Concerns
Highlighted the dangers of unchecked urban expansion on ecology.
Stressed protection of water bodies, green spaces, and urban environment.
Called for sustainable waste management and pollution control measures.
Significance of the NCU Report
First comprehensive national-level urban policy framework.
Influenced later programmes: 74th Constitutional Amendment (1992), IDSMT scheme expansion, and eventually JNNURM (2005).
Shifted thinking from seeing urbanization as a problem to recognizing it as a driver of growth.
✅ In summary: The NCU Report emphasized balanced spatial development, strengthening smaller towns, empowering urban local bodies, inclusive housing policies, and sustainable infrastructure financing. It remains one of the most important reference points for India’s urban policy.
Urbanization has been a gradually evolving focus in India’s Five-Year Plans. While early plans emphasized rural development, later ones began recognizing cities as engines of growth.
NUPF 2018 (draft), multi-mission approach instead of single national policy
✅ In essence: Urbanization policy in India evolved from a rural-centered planning era to recognizing cities as growth engines. The latest attempts (Smart Cities, AMRUT, PMAY, NUPF) show a multi-pronged, mission-driven approach rather than a single national policy document.
A settlement system refers to the organized pattern of distribution, size, functions, and relationships among human settlements (villages, towns, cities, metropolises) within a region or country.
Settlements are arranged in a hierarchical order:
Hamlets → Villages → Small Towns → Medium Towns → Cities → Metropolises → Megacities → Megalopolis
Dependency relationships (villages depending on towns, towns on cities, etc.)
2. Census Classification of Settlements (India)
(a) Rural Settlements
All places that do not qualify as urban under Census criteria.
Usually depend on agriculture and allied activities.
(b) Urban Settlements
As per Census of India:
Statutory Towns: Places with a municipality, corporation, cantonment board, or notified area committee.
Census Towns: Places meeting all 3 conditions:
Minimum population of 5,000
At least 75% of male workers in non-agricultural pursuits
Population density of 400 persons/sq. km or more
(c) Categories of Urban Settlements by Population Size (Census 2011):
Class I: 100,000 and above
Class II: 50,000 – 99,999
Class III: 20,000 – 49,999
Class IV: 10,000 – 19,999
Class V: 5,000 – 9,999
Class VI: less than 5,000
3. Primate City
A primate city is the largest city in a country or region, which is disproportionately larger than the second-largest city and dominates political, economic, and cultural life.
Term popularized by Mark Jefferson (1939).
Characteristics:
Much larger than next-ranking cities
Concentrates national functions (administration, trade, education, culture)
France: Paris dominates over all other French cities
4. Rank–Size Rule
Proposed by G.K. Zipf (1949).
States that:
“The population of a city is inversely proportional to its rank in the hierarchy.”
The 2nd largest city will have ½ the population of the largest,
The 3rd largest city will have ⅓, and so on.
Indicates a balanced urban system (as opposed to primate city dominance).
In India, the rank-size distribution is distorted by primacy of Delhi and Mumbai.
5. Urbanization
Definition: The process by which a growing proportion of a country’s population comes to live in towns and cities.
Measured by the percentage of urban population in total population.
Urbanization in India (Census data):
1951 → 17.3%
2001 → 27.8%
2011 → 31.2%
Projected 2036 → ~40%
Drivers in India:
Industrialization
Migration (push–pull factors)
Economic opportunities in services/IT
Government policies (Smart Cities, AMRUT)
6. Industrialization
Industrialization refers to the shift from agrarian to industrial economy, concentrating industries in certain towns and cities.
Impact on urbanization:
Creation of industrial towns: Jamshedpur, Rourkela, Bhilai, Durgapur.
Growth of employment and in-migration → urban expansion.
Emergence of slums due to mismatch between population growth and infrastructure.
Industrialization has been the key driver of urban growth globally and in India (especially post-independence).
7. Urban Development
Urban development is a broader concept than urbanization. It refers not only to the growth of towns and cities but also to the improvement of infrastructure, services, quality of life, and sustainability.
Urban areas are more than just concentrations of population – they are settlements that perform multiple functions in the economic, social, cultural, and political life of a region. They act as nodes of development, centers of innovation, and focal points for human activities, linking local, regional, and global networks.
Urban areas are engines of economic growth and provide opportunities beyond subsistence agriculture.
Industrial Production: Cities like Jamshedpur, Bhilai, and Surat function as hubs of steel, textiles, and diamond industries.
Trade and Commerce: Cities serve as marketplaces for agricultural produce, manufactured goods, and services (e.g., Mumbai as a financial capital, Delhi as a wholesale trade hub).
Service Economy: IT, banking, education, tourism, and healthcare thrive in urban centers (e.g., Bengaluru and Hyderabad as IT hubs).
Employment Opportunities: Cities attract rural migrants seeking jobs in industries, construction, transport, and services.
2. Social and Cultural Role
Urban settlements shape social structures, cultural life, and community interactions.
Centers of Learning: Universities and institutions located in cities (Delhi, Pune, Varanasi, Aligarh) make them knowledge hubs.
Cultural Exchange: Cities are melting pots of different communities, languages, and traditions (e.g., Mumbai, Kolkata).
Innovation and Modernization: Urban life fosters exposure to new ideas, lifestyles, gender roles, and progressive values.
Religious and Cultural Functions: Many cities like Varanasi, Haridwar, Amritsar, and Tirupati are pilgrimage and cultural centers.
3. Political and Administrative Role
Cities often function as seats of governance and administration.
National and State Capitals: New Delhi (national capital), Gandhinagar, Bhopal, Lucknow act as political-administrative centers.
Decision-Making Hubs: Government offices, courts, and political institutions are concentrated in cities.
Urban Local Governance: Cities have municipal corporations and urban local bodies for local administration, reflecting democratic decentralization.
4. Functional and Infrastructural Role
Urban areas are equipped with infrastructure and services that support both residents and surrounding rural populations.
Transport Nodes: Cities act as hubs of road, rail, air, and port connectivity (Nagpur as a transport hub, Mumbai as a port city).
Healthcare and Education: Hospitals, universities, and research centers in cities serve both urban and rural populations.
Markets and Supply Chains: Urban markets provide access to goods and services for nearby villages.
5. Environmental and Spatial Role
Urban settlements shape land use and interact with their environment.
Urban–Rural Linkages: Cities depend on rural areas for food, water, labor, and raw materials, while rural areas rely on cities for manufactured goods and services.
Spatial Hierarchy of Settlements: Urban areas form the upper nodes in the settlement hierarchy (village → town → city → metropolis → megalopolis).
Peri-Urban Expansion: The growth of suburbs and peri-urban areas blurs the rural–urban divide (e.g., Gurgaon near Delhi, Navi Mumbai near Mumbai).
6. Global Role
Some Indian cities have become globally significant.
Global Cities: Mumbai, Delhi, Bangalore, and Hyderabad are integrated into global finance, trade, IT, and culture.
Tourism and International Relations: Cities like Agra (Taj Mahal) and Jaipur (heritage) attract global tourism.
Diaspora and Connectivity: Cities are bases of international migration and cultural linkages.
7. Conclusion
Urban areas as settlements serve as multifunctional hubs—economic engines, cultural melting pots, administrative centers, and nodes of connectivity. They not only provide services and opportunities to their residents but also sustain and transform surrounding rural regions. Thus, urban settlements are critical in shaping regional development, social change, and national growth.
Urban settlements in India are officially classified by the Census of India using population size, density, and occupational structure. Beyond this, concepts like metropolis, megalopolis, and functional classification are used in urban studies.
A huge urban region formed by the merging of several metropolitan areas into a continuous urban corridor.
Example (India): Delhi–Meerut–Ghaziabad–Faridabad–Gurgaon urban belt (NCR); also Mumbai–Pune corridor.
3. Functional Classification of Urban Places
Urban settlements are not only defined by size but also by their functions. Functional classification groups cities based on their dominant economic and social roles.
Major Functional Categories:
Administrative Towns
Perform political/administrative functions.
Examples: New Delhi (national capital), Gandhinagar, Chandigarh, Bhubaneswar.
The Census of India provides a statistical and legal definition of urban places, ranging from towns to megacities, while urban geographers extend the concept to megalopolises and functional types. Together, these classifications help us understand the size, spread, and role of urban settlements in India’s socio-economic system.
An urban centre is a human settlement that has distinct characteristics compared to rural settlements, primarily in terms of population size, density, occupational structure, infrastructure, and functions.
In India, the Census of India defines an urban area based on two criteria:
Statutory towns: All places with a municipality, corporation, cantonment board, or notified town area committee.
Census towns: Places that satisfy the following conditions:
Minimum population of 5,000
At least 75% of male working population engaged in non-agricultural activities
Population density of at least 400 persons per sq. km
Thus, urban centres are places that act as nodes of administration, trade, industry, commerce, and services, and often serve as focal points for surrounding rural areas.
2. Concept of Rural–Urban Continuum
The rural–urban continuum suggests that rural and urban areas are not strictly separate categories but exist along a spectrum, with many intermediate forms of settlement in between.
Continuum implies:
A gradual transition from purely rural villages → semi-rural/small towns → medium towns → metropolitan cities.
Settlements share overlapping characteristics rather than being sharply distinct.
Examples in India:
Urban villages on the periphery of Delhi, Gurgaon, or Bangalore where traditional agrarian life coexists with urban services and real estate development.
Small market towns that act as service centers for surrounding rural populations.
Implication: The continuum reflects functional interdependence:
Rural areas supply food, raw materials, and labor.
Urban areas provide markets, education, healthcare, jobs, and modern amenities.
3. Concept of Rural–Urban Dichotomy
The rural–urban dichotomy is the traditional view that rural and urban settlements are fundamentally different and separate in terms of structure, function, and way of life.
Rural areas:
Agriculture-based economy
Low population density
Close-knit social relations, traditional lifestyles
Limited infrastructure and services
Urban areas:
Industry, trade, services-based economy
High population density
Individualistic lifestyles, cosmopolitan culture
Advanced infrastructure and services (transport, education, healthcare, housing)
Dichotomy Perspective: This view assumes a sharp boundary between rural and urban societies, often highlighting contrasts in occupation, social structure, values, and governance.
Overlap of functions (e.g., villages with IT hubs, towns with agriculture markets)
Indian context
Traditional sociological view
More realistic in today’s urbanizing India
5. Conclusion
Urban centres are hubs of population, economic activity, and services defined by statutory and census criteria.
The rural–urban dichotomy represents a simplistic division, useful for classification but less accurate in practice.
The rural–urban continuum better reflects the reality of India’s settlement pattern, where villages, towns, and cities are interconnected and often share mixed characteristics.
Urbanization in India after 1947 has been shaped by the country’s political independence, economic policies, industrialization, demographic growth, and globalization. Unlike the colonial period, where cities were primarily built to serve imperial interests, post-independence urbanization aimed at nation-building, industrial development, and modernization. However, this process has been uneven and continues to face challenges of sustainability, inclusivity, and infrastructure.
1. Immediate Post-Independence Phase (1947–1960s): Nation-Building and Planned Cities
Partition and Refugee Settlements:
Independence in 1947 led to large-scale migration due to Partition. Millions moved across borders, especially into Delhi, Punjab, and West Bengal, creating immediate housing and infrastructure pressures.
Refugee colonies in Delhi and resettlement areas around Kolkata, Ludhiana, and Amritsar grew rapidly.
Planned Capitals and Administrative Cities:
Chandigarh (Punjab/Haryana) designed by Le Corbusier became the first modern planned city.
Other state capitals like Bhubaneswar, Gandhinagar, and Dispur were developed as administrative hubs.
Industrial Townships:
The government’s focus on heavy industries and public sector undertakings (PSUs) led to the creation of industrial cities such as Bhilai, Rourkela, Durgapur, Bokaro, and Neyveli.
These were designed as self-sufficient townships with housing, schools, and amenities.
Urban Planning Approach:
The government emphasized centralized planning through Five-Year Plans.
Urban growth was seen as a byproduct of industrialization, not a sector needing separate focus.
2. Urban Expansion and Migration (1970s–1980s)
Rural-to-Urban Migration:
Rising employment opportunities in cities attracted migrants from villages, accelerating urban growth.
Cities like Mumbai, Delhi, Bangalore, and Hyderabad grew rapidly, often beyond their infrastructural capacity.
Growth of Slums and Informal Settlements:
Migrants, unable to find affordable housing, settled in informal settlements and slums (e.g., Dharavi in Mumbai, Yamuna Pushta in Delhi).
This marked the beginning of urban poverty as a significant challenge.
Metropolitan Dominance:
Mumbai, Delhi, Kolkata, and Chennai became primarily metropolitan centers for commerce, politics, and industry.
Uneven urbanization emerged as smaller towns and intermediate cities grew at slower rates.
Transport and Infrastructure:
Expansion of road and rail networks further integrated urban centers with surrounding rural areas.
3. Economic Liberalization and Globalization (1991–2000s)
Impact of 1991 Economic Reforms:
The liberalization of the Indian economy brought foreign investment, IT industries, and global integration.
Cities like Bangalore, Hyderabad, Pune, Gurgaon, and Noida became hubs of IT and service industries.
Urban Transformation:
Rapid construction of office complexes, tech parks, and gated residential colonies.
Growth of Special Economic Zones (SEZs) to promote exports and industries.
Emergence of New Urban Middle Class:
Rising employment in IT and services gave rise to a new urban middle class, transforming consumption patterns, housing demand, and lifestyles.
Urban-Rural Divide:
Liberalization widened disparities between metropolitan/global cities and smaller towns.
4. Contemporary Urbanization (2000s – Present)
Megacities and Metropolitan Regions:
Delhi, Mumbai, Kolkata, Bangalore, and Chennai have become megacities with populations over 10 million.
Urban sprawl has created vast metropolitan regions, extending urban influence into peri-urban and rural areas.
Urban Programs and Policy Initiatives:
Jawaharlal Nehru National Urban Renewal Mission (JNNURM, 2005–2014): Focused on infrastructure, housing, and governance reforms.
Smart Cities Mission (2015–present): Developing 100 cities with modern infrastructure, digital services, and sustainable planning.
AMRUT (Atal Mission for Rejuvenation and Urban Transformation): Focus on water supply, sanitation, and green spaces.
PMAY (Pradhan Mantri Awas Yojana): Housing for all initiative.
Infrastructure Growth:
Metro rail systems in Delhi, Bangalore, Kolkata, Chennai, and Mumbai.
Expressways, airports, and logistics hubs modernizing urban connectivity.
Challenges:
Overcrowding and congestion in metropolitan areas.
Urban poverty and informal sector dependence.
Environmental degradation: air pollution, waste management, and loss of green spaces.
Inequality: Coexistence of luxury malls and gated communities with slums.
Climate change vulnerability: Floods, heatwaves, and water scarcity affecting cities.
5. Conclusion
Post-independence urbanization in India reflects the country’s transition from a planned economy to a globalized one. While cities have become engines of growth, centers of innovation, and cultural exchange, they also struggle with congestion, inequality, and sustainability. The challenge ahead lies in promoting balanced urbanization by strengthening small and medium towns, while making large cities more inclusive, resilient, and environmentally sustainable.
Urbanization in India is a long and complex process shaped by geography, culture, politics, and economics. It reflects the evolution of Indian society from ancient times to the modern era. Unlike many other parts of the world, India’s urban tradition is among the oldest, yet it has also faced unique challenges of population growth, colonial legacy, and rapid post-independence transformations.
Indus Valley Civilization (Harappa and Mohenjo-Daro): The earliest evidence of urbanization in India dates back to the Indus Valley Civilization (2500–1500 BCE). Cities like Harappa, Mohenjo-Daro, Dholavira, and Lothal were highly organized with grid-planned streets, advanced drainage systems, public baths, warehouses, and marketplaces. These features illustrate a sophisticated urban culture that emphasized trade, administration, and community life.
Decline: Around 1500 BCE, these urban centers declined due to ecological changes, river shifts, and external pressures. The following period saw the growth of rural and agrarian settlements with limited urban activity.
2. Early Historic Period (600 BCE – 600 CE)
Second Urbanization (600 BCE onwards): Around the 6th century BCE, urban centers re-emerged, largely due to agricultural surplus, trade, and the rise of states (Mahajanapadas). Cities like Pataliputra, Varanasi, Ujjain, Taxila, and Rajgir flourished as centers of administration, trade, and learning.
Mauryan and Gupta Periods: Under the Mauryan Empire (4th–2nd century BCE), Pataliputra became one of the world’s largest cities. The Gupta period (4th–6th century CE) saw prosperity and cultural development in cities such as Ujjain and Nalanda, which also became hubs of education and Buddhism.
3. Medieval Urbanization (7th – 16th Century CE)
Rise of Temple and Trade Towns: With the growth of kingdoms in South India (Chola, Pandya, Vijayanagara), temple towns such as Madurai, Thanjavur, and Kanchipuram became urban centers. Trade with Southeast Asia also expanded urban development in port cities like Calicut, Surat, and Masulipatnam.
Delhi Sultanate and Mughal Period: Northern India saw significant urban expansion under the Delhi Sultanate (13th–15th century CE) and later the Mughal Empire (16th–18th century CE). Cities such as Delhi, Agra, Fatehpur Sikri, Lahore, and Shahjahanabad (Old Delhi) grew as centers of governance, culture, and economy. Mughal cities often had planned bazaars, gardens, mosques, and fortifications.
British East India Company & Colonial Rule: Colonialism reshaped India’s urban landscape drastically. The British developed three Presidency towns—Bombay (Mumbai), Calcutta (Kolkata), and Madras (Chennai)—as administrative, military, and trading hubs.
Industrial and Port Cities: Industrialization, especially textile mills in Bombay and jute mills in Calcutta, spurred migration and rapid urban growth. Port cities expanded due to international trade.
Dual Urbanism: Colonial towns often had a “White Town” (European quarters with planned housing and infrastructure) and a “Black Town” (densely populated Indian settlements with poor amenities).
Railways and Urban Expansion: The introduction of railways in the mid-19th century further connected and stimulated the growth of towns such as Kanpur, Nagpur, Lucknow, and Pune.
5. Post-Independence Urbanization (1947 – 1991)
Planned Cities: After independence, India focused on planned urban development. Cities like Chandigarh, Bhubaneswar, and Gandhinagar were designed as administrative capitals.
Industrial Townships: Industrial development led to the growth of cities like Bhilai, Rourkela, Durgapur, and Bokaro, which were built around steel plants and public sector industries.
Urban Migration: Large-scale rural-to-urban migration occurred due to employment opportunities, leading to rapid expansion of metropolitan centers such as Delhi, Mumbai, Bangalore, and Hyderabad. However, this also resulted in slums and housing shortages.
6. Liberalization and Contemporary Urbanization (1991 – Present)
Economic Reforms of 1991: Liberalization and globalization transformed Indian cities. Information Technology (IT) hubs like Bangalore, Hyderabad, Pune, and Gurgaon emerged as global economic centers.
Mega-Cities and Urban Sprawl: Cities such as Mumbai, Delhi, Kolkata, and Chennai grew into megacities, with populations exceeding 10 million. Urban sprawl extended into suburban regions.
Smart Cities Mission and Infrastructure: In recent years, government initiatives like the Smart Cities Mission, AMRUT, and Metro Rail Projects have attempted to modernize urban infrastructure and improve governance.
Challenges: Despite growth, Indian cities face problems like congestion, air pollution, informal housing (slums), inadequate public transport, and inequalities in access to services.
7. Conclusion
The history of urbanization in India reflects a continuous interaction between tradition and modernity, local needs and global forces, and rural-urban linkages. From the well-planned cities of Harappa to today’s sprawling metropolises, Indian urbanization has always been diverse and dynamic. However, the future of Indian cities will depend on how effectively issues of sustainability, inclusivity, and infrastructure are addressed in the coming decades.
The Cohort Survival Model (also called the Cohort-Component Method) is the most widely used method for population projections. It projects the future size and composition of a population by following age-sex groups (cohorts) through time and applying assumptions about fertility, mortality, and migration.
Divide the population by age and sex (e.g., 0–4, 5–9, 10–14, …).
Apply survival ratios (Sx) to each cohort, based on mortality rates (from life tables), to estimate how many survive to the next age group.
Example: If 100,000 children aged 0–4 have a survival ratio of 0.95, then 95,000 will survive to the 5–9 group.
Add new births by applying age-specific fertility rates (ASFRs) to women of reproductive ages (15–49). These births form the new 0–4 age cohort.
Adjust for migration (in-migration and out-migration) if applicable.
Repeat the process for each projection interval (usually 5 or 10 years).
Example (Simplified)
Population in 2011: 1,00,000 children in age group 0–4.
Survival ratio from 0–4 → 5–9 = 0.95.
Projected survivors in 2016 (age 5–9) = 95,000.
Inter-Regional Cohort Survival Model
Definition
The Inter-Regional Cohort Survival Model is an extension of the cohort survival model that incorporates migration between regions. Instead of treating the population as a whole, it simultaneously projects multiple regions and distributes people across them according to migration flows.
Steps in Inter-Regional Model
Divide the population by age, sex, and region (e.g., Region A, Region B, Region C).
Apply survival ratios (mortality) within each region.
Estimate migration flows between regions using a migration matrix:
Shows how many people of each age/sex group move from one region to another.
Example: 5% of 20–24-year-olds in Region A migrate to Region B in the next 5 years.
Add fertility contributions (births) in each region, based on the number of women and regional fertility rates.
Sum up to obtain future age-sex-region-specific population.
Uses
Cohort Survival Model: National population projections (fertility, mortality, migration considered as aggregates).
Inter-Regional Model: Regional/urban planning, migration studies, distribution of schools, hospitals, housing, transport needs.
The Cohort Survival Model is the foundation of demographic projection, focusing on fertility, mortality, and net migration.
The Inter-Regional Cohort Survival Model refines this by including detailed migration between regions, making it essential for regional planning and policy.
Population studies require methods to understand not only the present size and structure of a population but also its future trends. Three important concepts are estimation, projection, and forecasting. Though often used interchangeably, they differ in purpose, time frame, and assumptions.
Stable Population Models: Assume constant fertility and mortality over time.
Example: UN World Population Prospects projections for 2050 (based on medium fertility assumptions).
3. Population Forecasting
Definition: A prediction of the most likely future population based on past trends, present data, and expert judgment.
Difference from Projection: While a projection shows possible outcomes under assumptions, a forecast attempts to give the most probable outcome.
Techniques:
Uses projections as a base, but incorporates expert opinion, policies, and uncertainties.
Involves judgmental adjustments (e.g., considering possible pandemics, wars, migration crises).
Example: A government forecasting the likely population in 2036 to plan schools, hospitals, and jobs.
Key Differences
Aspect
Estimation
Projection
Forecasting
Time frame
Present (between censuses)
Future (scenarios)
Future (most likely)
Basis
Existing data (surveys, registers)
Assumptions of fertility, mortality, migration
Projections + expert judgment
Purpose
Fill gaps in current data
Show possible population outcomes
Predict actual future size
Certainty
Short-term, relatively reliable
Hypothetical, conditional
Probabilistic, judgment-based
Conclusion
Estimation helps us know the present.
Projection provides possible futures under given assumptions.
Forecasting predicts the most probable future outcome.
Together, they form the backbone of population policy, planning, and resource allocation in areas such as health care, education, housing, food supply, and employment.
A life table is a statistical tool used in demography, epidemiology, and actuarial science to summarize the mortality and survival experience of a population. It presents, for a hypothetical cohort of births, the probability of dying or surviving at each age (or age group).
Life tables are useful for calculating life expectancy, mortality risks, survival rates, and for making health, insurance, and population policy decisions.
Techniques in Preparing a Life Table
A life table is prepared in several systematic steps. The basic functions (columns) of a complete life table are:
Age interval (x to x+n): Specific age or age group.
lxl_xlx: Number surviving to exact age x – number of persons alive at the start of the age interval (from a hypothetical cohort, usually starting with 100,000 births).
dxd_xdx: Number dying in age interval x to x+n – difference between survivors at beginning and end of interval.
qxq_xqx: Probability of dying in the interval x to x+n – chance that a person aged x will die before reaching
pxp_xpx: Probability of surviving – complement of
LxL_xLx: Person-years lived in interval – total years lived by the cohort between ages x and x+n.
TxT_xTx: Total person-years lived above age x – cumulative total of person-years from age x to last age.
exe_xex: Expectation of life at age x – average number of years a person aged x is expected to live.
Techniques of Life Table Construction
There are two main techniques:
1. Complete Life Table
Uses single-year age intervals (0, 1, 2, 3, … up to 85+).
Provides detailed mortality and survival data for each exact age.
Common in developed countries with reliable mortality statistics.
2. Abridged Life Table
Uses wider age groups (e.g., 0, 1–4, 5–9, 10–14 … 70–74, 75+).
Mortality probabilities are calculated for each age group instead of each year.
Easier to prepare when data are limited or sample sizes are small.
Widely used in developing countries where age-reporting is not precise.
Preparation of an Abridged Life Table
Steps:
Start with observed mortality rates (mxm_xmx) for each age group.
Convert to probability of dying (qxq_xqx) using formulas or standard approximations.
For large age groups:
Assume a radix (e.g., l0=100,000l_0 = 100,000l0=100,000) for the starting cohort.
Calculate survivors (lxl_xlx) and deaths (dxd_xdx) across age groups.
Compute person-years lived (Lx), total person-years (Tx), and life expectancy (ex).
Example (Simplified Abridged Life Table for Illustration Only)
Age Group (x to x+n)
lx (survivors)
dx (deaths)
qx (prob. of dying)
Lx (person-years)
Tx (total yrs left)
ex (life expectancy)
0
100,000
6,000
0.06
97,000
6,500,000
65.0 yrs
1–4
94,000
2,000
0.021
372,000
6,403,000
68.1 yrs
5–9
92,000
500
0.005
455,000
6,031,000
65.5 yrs
…
…
…
…
…
…
…
(Table truncated for brevity — real abridged life tables extend until 80+ or 100+ years.)
Conclusion
Life tables are fundamental tools in demography to measure mortality, survival, and life expectancy.
Complete life tables use single-year intervals for precision.
Abridged life tables use grouped ages, making them simpler and practical where detailed data is lacking.
Both are essential in public health planning, actuarial science (insurance), and population studies.
Population composition refers to the structure of a population based on various demographic, social, and economic characteristics. It shows how a population is distributed by age, sex, marital status, literacy, religion, caste, occupation, etc. Understanding composition is vital for social planning, resource allocation, and development policies.
Helps in forecasting labor force, education, health, and pension needs.
Indicates social development level.
2. Population Composition Based on Other Factors
a) Marital Status
Classified into never married, currently married, widowed, divorced/separated.
Useful for studying fertility patterns, household structure, and social norms.
b) Caste (specific to countries like India)
Reflects traditional social stratification.
Important for understanding social inequalities, political representation, and affirmative action policies.
c) Religion
Populations are classified by faith (e.g., Hindu, Muslim, Christian, Buddhist).
Religious composition affects cultural identity, festivals, marriage patterns, and political dynamics.
d) Literacy and Education Level
Literacy Rate = Percentage of population above a specified age (usually 7 years and above in India) who can read and write with understanding.
Educational attainment measured by highest level of schooling completed.
Key indicator of human development, employability, and social progress.
e) Economic/Occupational Composition
Division of population into primary (agriculture), secondary (industry), tertiary (services) sectors.
Shows level of economic development.
f) Rural-Urban Composition
Percentage of people living in rural areas vs. towns and cities.
Urbanization indicates modernization, industrial growth, and social mobility.
g) Language & Ethnicity
Shows cultural diversity and regional identities.
Important for policy-making, linguistic states, and cultural preservation.
Conclusion
The age-sex structure and population composition reveal not only how many people live in a region, but also who they are, how they live, and what they contribute to society. Measures like age distribution, sex ratio, and literacy rate are vital for planning in education, healthcare, employment, and social welfare. Broader aspects like marital status, caste, religion, and occupation help policymakers understand the social fabric and address inequalities.
Demography is the scientific study of human populations, particularly their size, composition, distribution, and changes over time. For analyzing fertility, mortality, migration, and population growth, demographers rely on demographic data, which is collected through various direct and indirect sources.
Definition: A census is the complete enumeration of the population of a country at a specified time, usually every 10 years.
Data Collected: Age, sex, marital status, education, occupation, language, religion, place of birth, migration details, etc.
Advantages:
Covers entire population.
Provides comprehensive demographic, social, and economic data.
Limitations:
Conducted at long intervals (decadal in most countries).
Expensive and time-consuming.
May contain inaccuracies in remote or conflict areas.
2. Vital Registration System (Civil Registration System – CRS)
Definition: Continuous recording of vital events such as births, deaths, marriages, and divorces by government authorities.
Advantages:
Provides continuous, up-to-date data.
Useful for calculating fertility, mortality, and natural growth rates.
Limitations:
In many developing countries, registration is incomplete or inaccurate.
Often excludes rural or remote populations.
3. Sample Surveys
Definition: Surveys conducted on a representative sample of the population to collect detailed demographic, social, and economic data.
Examples:
National Sample Surveys
Demographic and Health Surveys (DHS)
Labor Force Surveys
Advantages:
Less costly and quicker than a census.
Provides detailed information (fertility, mortality, migration, health, employment).
Limitations:
Based on samples, not full population.
Subject to sampling errors and biases.
4. Population Registers
Definition: A continuous system that records demographic events for each individual (e.g., births, deaths, migration) and maintains personal records.
Examples: Scandinavian countries maintain detailed registers.
Advantages:
Highly accurate and up-to-date.
Useful for long-term demographic analysis.
Limitations:
Requires strong administrative capacity.
Not common in developing countries.
5. Other Administrative Records
Sources: School records, tax records, voter lists, health records, border control/immigration data, social security records.
Use: Provide indirect but useful information on population size, distribution, and movement.
Limitations: Often incomplete and not standardized for demographic use.
6. Special Studies & Research
Academic or government-led studies on fertility, mortality, migration, or urbanization.
Usually targeted, in-depth, and limited in scope.
Conclusion
The study of demography depends on a combination of primary sources (census, vital registration, surveys, population registers) and secondary sources (administrative records, special studies). Each has its strengths and weaknesses, but together they provide a comprehensive picture of population dynamics. Accurate demographic data is essential for planning development policies, health care, education, housing, and employment.
Migration does not only change the size of a population but also alters its composition in terms of age, sex, education, occupation, and cultural characteristics. These demographic shifts influence both the place of origin and the place of destination.
Migrants are usually young adults in the 15–35 age group, since they are the most mobile section of the population.
Origin: Loss of young people leads to an ageing population in rural or underdeveloped areas.
Destination: Influx of youth increases the proportion of working-age population, boosting the labor force.
2. Sex Composition
Migration often shows a gender imbalance, depending on its type:
Male-dominated migration: Labor migration (construction, industries, international jobs in Gulf countries).
Female-dominated migration: Often linked to marriage or domestic work.
This alters the sex ratio:
Origin: Male out-migration increases the proportion of females in rural areas.
Destination: Male-dominated inflows skew sex ratio in cities or host countries.
3. Occupational Composition
Migrants are generally economically active, moving for employment opportunities.
Origin: Loss of skilled workers may cause brain drain or shortage of professionals.
Destination: Migrants contribute to labor markets, often taking up jobs locals avoid (e.g., construction, agriculture, services).
4. Educational Composition
Highly educated individuals often migrate for higher studies or specialized jobs, leading to a concentration of skilled labor in developed regions.
Origin: Depletion of educated youth creates knowledge gaps.
Destination: Gain in human capital, innovation, and productivity.
5. Cultural / Ethnic Composition
Migration introduces new languages, traditions, and religions in the receiving areas.
Origin: Out-migration sometimes reduces cultural diversity.
Destination: Creates multicultural societies, but can also lead to ethnic tensions or integration challenges.
6. Family and Household Composition
Migration reshapes household structures:
Origin areas may see left-behind families, children, and elderly dependents.
Destination areas may experience increase in nuclear households formed by migrants.
Conclusion
Migration profoundly influences the demographic composition of both sending and receiving regions. While it often strengthens the working-age population and enhances cultural diversity in destination areas, it may cause ageing, gender imbalances, and brain drain in origin regions. Thus, migration is not only a movement of people but also a powerful force reshaping the social and demographic fabric of societies.
Migration is a dynamic demographic process, and its measurement is essential for understanding population change, labor markets, urbanization, and policy planning. Since migration is more complex than birth or death statistics (which are direct and easily recorded), demographers use multiple methods to estimate and analyze migration volumes.
Description: National censuses often include questions about a person’s place of birth, previous residence, or duration of stay in the current place.
Advantages: Provides large-scale data covering the entire population.
Limitations: Conducted only once in 5 or 10 years; may not capture short-term or seasonal migration.
2. Registration Method
Description: Continuous population registers or civil registration systems record people’s movements when they change residence.
Advantages: Provides up-to-date, continuous records.
Limitations: Requires well-developed administrative systems; often incomplete in developing countries.
3. Survey Method
Description: Household surveys (such as Demographic and Health Surveys, labor force surveys) collect detailed migration information, including reasons and duration.
Advantages: Offers detailed and current data, including social and economic aspects.
Limitations: Expensive, time-consuming, and usually based on samples, not entire populations.
4. Vital Registration Method
Description: Sometimes, changes in residence are recorded alongside births, deaths, and marriages.
Advantages: Provides continuous tracking of migration events.
Limitations: Rarely implemented effectively; data often incomplete.
5. Indirect Methods (Statistical Estimates)
When direct data is unavailable, migration is estimated indirectly:
Residuum Method:
Migration = (Population change between two censuses) – (Natural increase from births and deaths).
Useful for estimating net migration.
Survival Ratio Method:
Compares population cohorts across censuses, adjusting for expected survival rates, to estimate migration.
School Enrollment Data, Voter Lists, Tax Records: Indirect sources sometimes used to measure local or temporary migration.
6. Specialized Data Sources
Border Control Records: Used for international migration (immigration/emigration).
Work Permits and Visa Records: Track labor migration.
Remittance Data: Financial flows from migrants are sometimes used as a proxy for migration volumes.
Conclusion
Measuring migration volumes requires a combination of direct methods (like census, surveys, and registration) and indirect methods (statistical estimates). No single method captures the full picture, since migration is fluid and multidimensional. For accurate analysis, countries often use a triangulation approach—combining census data, surveys, and administrative records.
Migration refers to the movement of people from one place to another, either within a country or across borders, for temporary or permanent settlement. It is one of the most significant demographic processes that shapes societies and economies worldwide. Migration is influenced by multiple factors and takes various forms depending on direction, duration, and purpose.
Migration is classified based on geography, time, purpose, and status.
1. Based on Geography
Internal Migration: Movement within a country
Rural-to-Urban: Villagers move to cities for jobs (e.g., rural workers migrating to metropolitan areas).
Urban-to-Rural: Movement from cities back to villages (often for retirement or lower living costs).
Urban-to-Urban: Between cities for employment or lifestyle.
Rural-to-Rural: Movement between agricultural areas, often seasonal.
International Migration: Movement across national borders
Immigration: Entering a new country for settlement.
Emigration: Leaving one’s own country.
Refugees & Asylum Seekers: Forced migration due to conflict, persecution, or disasters.
2. Based on Duration
Temporary Migration: Short-term for work, education, or seasonal labor.
Permanent Migration: Long-term or lifelong settlement in a new area or country.
Circular Migration: Repeated movement between home and destination (common in seasonal labor).
3. Based on Purpose
Labor Migration: Seeking jobs, often in construction, agriculture, or services.
Educational Migration: Students moving for schools, colleges, or universities.
Forced Migration: Displacement due to war, persecution, or disasters.
Voluntary Migration: Based on personal choice for better opportunities.
4. Based on Legality
Legal Migration: Movement with valid visas, permits, or government approval.
Illegal/Irregular Migration: Crossing borders without authorization, overstaying visas, or working without permits.
Conclusion
Migration is driven by economic, social, political, and environmental factors, and it manifests in different types and trends. Understanding these patterns is crucial for planning urban development, managing international relations, and addressing humanitarian challenges. Migration is not only a demographic process but also a reflection of human aspirations for survival, opportunity, and a better life.
Migration, the movement of people from one place to another, is a universal phenomenon that has shaped societies, cultures, and economies throughout history. It may occur within national boundaries (internal migration) or across international borders (international migration). The causes of migration are complex, often involving a combination of economic, social, political, and environmental factors, while the consequences are felt by both the regions of origin and destination.
Migration is usually driven by a mix of push factors (conditions that compel individuals to leave their home) and pull factors (attractions of a new place).
1. Economic Causes
Employment opportunities: People often move in search of better jobs, higher wages, or improved living standards.
Poverty and unemployment: Lack of income or livelihood opportunities in rural or underdeveloped regions forces people to seek work in urban or industrial areas.
Globalization: The interconnected world economy makes labor migration across countries more common, especially from developing to developed regions.
2. Social Causes
Education: Migration for higher education or better schools is common, especially among youth.
Healthcare and living standards: Families may move to access advanced healthcare facilities or improved quality of life.
Family ties and marriage: Many migrations occur for family reunification or after marriage.
3. Political Causes
Conflict and war: Wars, ethnic violence, and political instability create refugees and asylum seekers.
Persecution: Discrimination based on religion, ethnicity, or political beliefs forces people to flee.
Government policies: Restrictive or favorable immigration laws, land reforms, and resettlement programs can influence migration patterns.
4. Environmental Causes
Natural disasters: Floods, droughts, earthquakes, and hurricanes displace millions every year.
Climate change: Rising sea levels, desertification, and unpredictable rainfall patterns push people to leave vulnerable areas.
Resource scarcity: Lack of water, fertile land, or other essential resources drives rural-to-urban and cross-border migration.
Consequences of Migration
Migration has far-reaching impacts, both positive and negative, on individuals, families, and entire societies.
1. Consequences for the Place of Origin
Population decline: Outmigration reduces the working-age population, often leading to labor shortages.
Brain drain: Skilled and educated workers moving abroad can weaken the local economy.
Economic relief: Migration reduces pressure on local resources and provides income through remittances.
Social impacts: Separation of families may cause emotional strain but can also promote social mobility through financial support.
2. Consequences for the Place of Destination
Economic growth: Migrants often fill labor gaps, contribute to innovation, and boost industries.
Cultural diversity: Migration enriches societies with new languages, traditions, and cuisines.
Strain on resources: Rapid influx can stress housing, healthcare, education, and infrastructure.
Social tensions: Migration may fuel xenophobia, competition for jobs, and cultural conflicts.
3. Consequences for Migrants Themselves
Opportunities: Migrants often gain better employment, education, and living conditions.
Challenges: They may face discrimination, exploitation, or cultural isolation.
Identity and belonging: Many migrants experience a struggle between integrating into the new society and maintaining their original culture.
Conclusion
Migration is a dynamic process shaped by economic, social, political, and environmental forces. While it offers opportunities for growth, cultural exchange, and global connectivity, it also creates challenges for both migrants and host communities. Effective policies that ensure integration, protect migrant rights, and balance development between regions of origin and destination are essential. Ultimately, migration remains not just a demographic shift but also a human story of aspiration, resilience, and survival.
The SALSA framework is a methodological approach designed to structure and streamline the process of conducting a literature review. It stands for Search, Appraisal, Synthesis, and Analysis. Each component corresponds to a step in systematically reviewing existing research to ensure that the review is comprehensive, critical, and useful for building knowledge.
The SALSA framework is particularly helpful for scholars, especially beginners, as it provides a clear roadmap for handling large volumes of literature and ensuring rigor in research writing.
1. Search
The first step involves identifying and collecting relevant literature. This is about systematically locating studies, journal articles, reports, and other academic works that are connected to the research problem.
Key tasks in the Search stage:
Define clear research questions or objectives.
Identify keywords, synonyms, and related terms to expand the search scope.
Select appropriate databases (e.g., Scopus, Web of Science, PubMed, Google Scholar).
Use Boolean operators (AND, OR, NOT) and filters to refine the results.
Keep track of search strategies for reproducibility.
Purpose: To ensure that the literature review is comprehensive and avoids bias by relying on a well-documented search strategy.
2. Appraisal
After collecting the studies, not all of them will be relevant or of high quality. This stage involves evaluating and filtering the collected literature based on pre-defined criteria.
Key tasks in the Appraisal stage:
Screen abstracts and titles for relevance.
Evaluate the methodological quality of the studies.
Identify gaps, limitations, and biases in the studies.
Exclude irrelevant, outdated, or poor-quality sources.
Use appraisal tools or checklists (e.g., CASP, PRISMA guidelines in medical fields).
Purpose: To ensure that only the most credible, relevant, and high-quality research is included in the review. This reduces noise and prevents misleading conclusions.
3. Synthesis
Once the relevant studies have been appraised, the next step is to combine and integrate findings from different sources.
Key tasks in the Synthesis stage:
Organize studies into themes, categories, or frameworks.
Compare and contrast findings across studies.
Identify trends, patterns, and recurring concepts.
Highlight contradictory evidence or debates in the literature.
Develop conceptual models or frameworks based on the findings.
Purpose: To build a coherent body of knowledge by integrating diverse findings, instead of just summarizing them one by one. This helps in identifying what is already known and what remains uncertain.
4. Analysis
The final stage is critical analysis, where the researcher goes beyond summarizing and synthesizing, to provide interpretations, implications, and evaluations.
Key tasks in the Analysis stage:
Critically assess the strength of existing evidence.
Discuss gaps in knowledge and areas for future research.
Relate the findings back to the research objectives or hypothesis.
Provide theoretical or practical implications of the literature.
Evaluate how the literature shapes or challenges the current understanding of the topic.
Purpose: To provide a critical, reflective, and value-adding perspective, ensuring the literature review contributes to advancing research rather than merely reporting past findings.
Advantages of the SALSA Technique
Provides a systematic structure for reviewing literature.
Helps manage large amounts of information efficiently.
Reduces the risk of bias in selecting or reporting literature.
Encourages critical evaluation rather than simple summarization.
Ensures transparency and replicability, which are key in academic research.
Example Application of SALSA
Suppose a researcher is studying the effectiveness of e-learning in higher education.
Search: Use databases like Scopus and Google Scholar with keywords “e-learning,” “higher education,” “student performance,” “online teaching effectiveness.”
Appraisal: Select peer-reviewed studies from the last 10 years, exclude non-academic blogs or outdated articles, and prioritize studies with strong empirical methods.
Synthesis: Group findings into themes such as student engagement, learning outcomes, teacher perspectives, and technology challenges.
Analysis: Critically assess whether e-learning truly enhances performance, point out contradictions (e.g., some studies show improvement, others show decline), and suggest areas where future studies should focus (e.g., long-term impacts or hybrid models).
Tabular representation of the SALSA literature review technique with steps, key tasks, and expected outcomes:
Step
Key Tasks
Expected Outcomes
Search
– Define research objectives and questions – Identify keywords, synonyms, Boolean operators – Select databases (Scopus, Web of Science, Google Scholar, etc.) – Apply inclusion/exclusion criteria (time period, language, document type) – Document the search strategy
A comprehensive collection of potentially relevant studies and academic sources
Appraisal
– Screen titles and abstracts – Review full texts for relevance – Assess methodological quality – Exclude weak, irrelevant, or outdated studies – Use appraisal tools/checklists (e.g., CASP, PRISMA)
A refined set of credible, high-quality studies directly relevant to the research
Synthesis
– Organize selected studies into themes/categories – Compare and contrast findings – Identify similarities, contradictions, and trends – Develop conceptual frameworks or models
A coherent synthesis of existing knowledge highlighting patterns and key debates
Analysis
– Critically evaluate the evidence – Relate findings to research questions – Identify research gaps and future directions – Provide theoretical and practical implications – Draw conclusions from the literature
A critical, insightful review that advances understanding and sets an agenda for further research
✅ This table can be easily adapted into a checklist format for students or researchers while conducting their literature reviews.
The SALSA framework (Search, Appraisal, Synthesis, and Analysis) is a practical and structured approach for conducting a systematic literature review. It moves researchers from a broad pool of information to a refined, critically evaluated, and insightful body of work. By following these four stages, scholars ensure that their literature review is transparent, comprehensive, and academically rigorous, forming a strong foundation for future research.
References
Dehalwar, K., & Sharma, S. N. (2023). Fundamentals of research writing and uses of research methodologies. Edupedia Publications Pvt Ltd.
Dehalwar, K., & Sharma, S. N. (2024). Social Injustice Inflicted by Spatial Changes in Vernacular Settings: An Analysis of Published Literature. ISVS e-journal, Vol. 11, Issue 9. https://isvshome.com/pdf/ISVS_11-09/ISVSej_11.09.07.pdf
Dehalwar, K. S. S. N., & Sharma, S. N. (2024). Exploring the distinctions between quantitative and qualitative research methods. Think India Journal, 27(1), 7-15.
Grant, M. J., & Booth, A. (2009). A typology of reviews: an analysis of 14 review types and associated methodologies. Health information & libraries journal, 26(2), 91-108.
Mengist, W., Soromessa, T., & Legese, G. (2020). Method for conducting systematic literature review and meta-analysis for environmental science research. MethodsX, 7, 100777.
Sahoo, S. K., Tengli, M. B., Meeyo, H., Gaurav, S., & Singh, M. S. A Systematic Literature Review on Agrotourism Models (SALSA Approach): Mapping Research Trends and Key Factors.
Sharma, S. N., & Dehalwar, K. (2025). A Systematic Literature Review of Transit-Oriented Development to Assess Its Role in Economic Development of City. Transportation in Developing Economies, 11(2), 23.
Sharma, S. N., Kumar, A., & Dehalwar, K. (2024). The precursors of transit-oriented development. EPW Economic & Political Weekly, 59(16), 14.
Sharma, S. N. (2019). Review of most used urban growth models. International Journal of Advanced Research in Engineering and Technology (IJARET), 10(3), 397-405.
In social science and development research, it is not enough to measure awareness levels and access to credit facilities; researchers also need to know how these factors actually influence outcomes such as productivity, income, technology adoption, or livelihood improvement.
To statistically test these relationships, regression analysis is one of the most powerful tools. It helps quantify:
Whether awareness and credit access significantly influence development outcomes.
The direction of influence (positive/negative).
The magnitude of impact (how strongly each factor contributes).
Why Regression Analysis?
Regression analysis allows researchers to:
Establish a relationship between independent variables (predictors: awareness, access to credit) and a dependent variable (outcome: agricultural productivity, income, technology adoption).
Control for other demographic variables (age, education, landholding, income, etc.).
Test hypotheses statistically and generate predictive models.
Types of Regression Suitable for This Study
Simple Linear Regression
When testing the impact of one predictor on one outcome.
Example: Does credit access alone predict agricultural income?
Multiple Linear Regression
When testing the impact of two or more predictors on one outcome.
Example: How do awareness and credit access together affect agricultural productivity?
Logistic Regression
When the outcome variable is categorical (Yes/No, Adopted/Not Adopted).
Example: Does awareness and credit access influence whether a farmer adopts new technology (Adopted = 1, Not Adopted = 0)?
Model Specification
(a) Multiple Linear Regression
If the outcome (Y) is continuous (e.g., income, yield, effectiveness score):
(b) Logistic Regression
Example Application
Suppose you survey 300 respondents and collect:
Awareness (Aware = 1, Not aware = 0)
Credit Access (Access = 1, No access = 0)
Agricultural Productivity (measured as yield in quintals per hectare).
You run a regression model: Productivity=2.1+0.8(Awareness)+1.5(CreditAccess)+0.3(Education)+ϵProductivity = 2.1 + 0.8(Awareness) + 1.5(Credit Access) + 0.3(Education) + \epsilonProductivity=2.1+0.8(Awareness)+1.5(CreditAccess)+0.3(Education)+ϵ
Interpretation:
Awareness increases productivity by 0.8 units (holding other factors constant).
Credit access increases productivity by 1.5 units.
Education adds a smaller positive effect (0.3 units).
The R² value tells you how much of the variation in productivity is explained by the predictors.
Steps for Researchers
Data Preparation
Collect awareness, credit access, outcome variables, and control variables.
Code categorical variables as dummy variables (0/1).
Check Assumptions (for linear regression)
Linearity between predictors and outcome.
No multicollinearity between predictors.
Homoscedasticity of errors.
Run Regression Analysis (SPSS, R, Stata, or Python).
Interpret Results
Look at coefficients (β\betaβ), p-values, and R².
Identify which predictors are statistically significant.
Importance of Regression in Awareness & Credit Studies
Provides quantitative evidence of how awareness and credit access shape development outcomes.
Helps in policy prioritization – for example, if awareness has a stronger effect than credit, focus on financial literacy campaigns.
Supports predictive modeling – policymakers can estimate the likely improvement in outcomes if awareness or credit access is expanded.
Limitations
Regression shows association, not causation (unless longitudinal/experimental data is used).
Sensitive to outliers and data quality issues.
Requires careful selection of control variables to avoid omitted variable bias.
Conclusion
Regression analysis is a robust method to test how awareness and credit access influence development outcomes. Whether using linear regression for continuous outcomes or logistic regression for categorical outcomes, this method helps quantify relationships and guide data-driven decisions. For policymakers and researchers, regression insights can shape targeted interventions, ensuring resources are directed where they have the strongest impact on development.
In many research studies, we not only want to measure the effectiveness of a program, scheme, or service, but also want to know whether perceptions of effectiveness differ across different groups of people. For example:
Do educated and less-educated respondents perceive a government scheme differently?
Do small, medium, and large farmers rate the effectiveness of a credit facility differently?
Do urban and rural respondents vary in their satisfaction with digital services?
To answer such questions, statistical tests like the t-test and Analysis of Variance (ANOVA) are commonly used.
When to Use t-test and ANOVA
t-test
Used when comparing the means of two groups.
Example: Comparing the average effectiveness perception score between male and female respondents or rural vs. urban respondents.
Types:
Independent samples t-test – when two different groups are compared.
Paired samples t-test – when the same group is measured before and after an intervention.
ANOVA (Analysis of Variance)
Used when comparing the means of more than two groups.
Example: Comparing effectiveness perceptions across education levels (illiterate, primary, secondary, higher) or income categories (low, medium, high).
Measuring Effectiveness Perception
Usually, effectiveness is measured using a Likert scale (e.g., 1 = Strongly Disagree, 5 = Strongly Agree) for items like:
Timely delivery of services.
Adequacy of benefits.
Ease of access.
Transparency in the system.
Respondents’ answers can be aggregated to form an effectiveness score (average or sum), which becomes the dependent variable for analysis.
Steps for Applying t-test / ANOVA
Step 1: Formulate Hypotheses
Null Hypothesis (H₀): There is no significant difference in effectiveness perceptions across groups.
Alternative Hypothesis (H₁): There is a significant difference in effectiveness perceptions across groups.
Step 2: Independent Samples t-test (Two Groups)
Suppose you want to compare effectiveness scores between urban and rural respondents:
Group
Mean Effectiveness Score
Std. Dev.
Sample Size
Urban
3.9
0.6
100
Rural
3.4
0.7
100
If the calculated t-value exceeds the critical value (from the t-distribution table), reject H₀.
Step 3: One-way ANOVA (More Than Two Groups)
Suppose you want to compare perceptions across four education levels:
Education Level
Mean Effectiveness Score
Illiterate
3.1
Primary Education
3.5
Secondary Education
3.8
Higher Education
4.2
ANOVA partitions the variation in scores into:
Between-group variance (differences in means across groups).
Within-group variance (differences within each group).
The F-ratio is then calculated as: F=Between-group varianceWithin-group varianceF = \frac{\text{Between-group variance}}{\text{Within-group variance}}F=Within-group varianceBetween-group variance
If F > critical F (from F-distribution table), reject H₀.
Step 4: Post-hoc Tests (for ANOVA)
If ANOVA shows a significant difference, we need to find which groups differ.
Post-hoc tests like Tukey’s HSD or Bonferroni test help identify the exact group differences.
Example: Higher education group may perceive significantly greater effectiveness than the illiterate group.
Interpretation of Results
A significant t-test result means two groups differ in their perception of effectiveness.
A significant ANOVA result means at least one group differs from others, but post-hoc tests are needed to locate the difference.
A non-significant result means perceptions are statistically the same across groups.
Importance in Awareness & Effectiveness Studies
Helps identify demographic disparities in perception.
Provides evidence for targeted policy interventions (e.g., improving effectiveness for disadvantaged groups).
Ensures resource allocation is based on actual needs reflected in perception differences.
Limitations
Assumes data is approximately normally distributed.
Sensitive to outliers in small samples.
Only tests for differences in means, not the cause of those differences.
Conclusion
The t-test and ANOVA are essential tools for comparing perceptions of effectiveness across groups. They allow researchers to statistically determine whether different categories of respondents (based on education, income, location, or other demographics) perceive a program or service differently. These insights are crucial for refining programs, making them more inclusive, and ensuring that all groups benefit equally.
In social science, education, health, marketing, and development research, one of the most common questions is: Does awareness about a particular scheme, service, or product vary across demographic groups such as age, education, income, or occupation?
To answer this, researchers often use the Chi-square test of independence. It is a non-parametric test that determines whether two categorical variables are related or independent of each other. For example, we may want to know if:
Awareness of digital banking varies by education level.
Awareness of government health insurance differs across income categories.
Awareness of renewable energy schemes depends on location (urban/rural).
What is the Chi-square Test of Independence?
The Chi-square test checks whether the distribution of one categorical variable depends on another categorical variable. It compares:
Observed frequencies (O): Actual counts from the survey or data.
Expected frequencies (E): Counts we would expect if there were no relationship between the variables.
If the difference between O and E is large, the test shows a significant relationship.
Application in Awareness Studies
Step 1: Collect Data
Suppose a researcher wants to test whether awareness of a government scheme is related to education level. The data from 200 respondents may look like this:
Education Level
Aware
Not Aware
Total
Illiterate
20
30
50
Primary Education
30
20
50
Secondary Education
40
10
50
Higher Education
45
5
50
Total
135
65
200
Step 2: Set Hypotheses
H₀ (Null Hypothesis): Awareness is independent of education level.
H₁ (Alternative Hypothesis): Awareness is associated with education level.
Step 3: Calculate Expected Frequencies
Step 4: Apply Chi-square Formula
Step 5: Degrees of Freedom and Significance
Interpretation of Results
A significant result means awareness is not evenly distributed across demographic categories. For example, education might strongly influence awareness levels.
A non-significant result means awareness is independent of that demographic factor.
Importance of the Chi-square Test in Awareness Studies
Identifies influencing factors – shows which demographic groups have higher or lower awareness.
Guides policy and planning – awareness campaigns can be targeted at groups with low awareness.
Simple yet powerful – works well with survey data and categorical variables.
Limitations
Does not measure the strength of the relationship, only whether it exists.
Requires a sufficiently large sample size (expected frequency in each cell ≥ 5).
Works only with categorical data, not continuous variables.
Conclusion
The Chi-square test of independence is a widely used statistical tool for analyzing whether awareness of a scheme, product, or program is associated with demographic variables. It provides researchers and policymakers with valuable insights into which groups are better informed and which require more attention. By applying this test, organizations can design targeted interventions, awareness drives, and policy measures that effectively reach the intended beneficiaries.
Demographic variables are statistical characteristics of populations that researchers, policymakers, and businesses use to understand groups of people. They provide quantifiable data about who people are in terms of age, gender, income, education, family structure, location, and other attributes.
In research, demographic variables are often used as independent variables (to study their effect on behavior, choices, or attitudes) or as control variables (to ensure fair comparisons across groups).
🔹 Why Are Demographic Variables Important?
Social Research → Helps in understanding social structures, inequality, mobility, and population trends.
Policy Making → Guides governments in designing education, healthcare, housing, and employment policies.
Marketing & Business → Businesses use demographic profiling to identify target customers and segment markets.
Urban Planning → Planners use demographics to design infrastructure, transport, housing, and public services.
Public Health → Demographics like age, gender, and income influence health risks and healthcare needs.
🔹 Common Types of Demographic Variables
Variable
Explanation
Examples
Age
One of the most basic variables, used to group populations by life stage.
Children (0–14), Youth (15–24), Adults (25–64), Elderly (65+)
Gender / Sex
Biological sex or gender identity, important for studying social roles, equality, and consumer behavior.
Male, Female, Non-binary
Income / Socioeconomic Status
Reflects purchasing power, lifestyle, and access to resources.
Low income (<$20,000), Middle income, High income
Education Level
Indicates skill levels, literacy, and career opportunities.
Primary, Secondary, Higher Education, Doctorate
Occupation / Employment Status
Shows economic activity and professional identity.
Student, Employed, Self-employed, Retired
Marital Status & Family Structure
Shapes household spending, housing needs, and social support.
Single, Married, Divorced, Nuclear/Joint family
Religion / Ethnicity
Cultural and social identity markers, often linked with traditions and practices.
Hindu, Muslim, Christian; Ethnic groups
Geographic Location
Determines accessibility, lifestyle, and opportunities.
Urban vs. Rural, Region, State, Country
Household Size
Impacts consumption patterns, housing needs, and mobility choices.
Single-person household vs. joint family
Language
Indicates communication needs and cultural identity.
Hindi, English, Spanish, Mandarin
🔹 Applications of Demographic Variables
In Academic Research
Sociologists study inequality using income, caste, or gender.
Psychologists examine how age affects learning or memory.
Economists analyze how employment status influences consumption.
In Business & Marketing
A company selling baby products targets young parents (Age + Family Structure).
Luxury brands market to high-income professionals (Income + Occupation).
Regional ads use local language (Geographic Location + Language).
In Public Policy & Planning
Governments forecast school needs using child population data (Age + Location).
Healthcare policies for elderly depend on aging population statistics.
Urban planners use household size and migration patterns to plan housing.
In Healthcare
Age and gender are key for predicting disease risks.
Income and education affect healthcare access and awareness.
🔹 Examples of Demographic Variables in Use
Census Surveys: National censuses collect data on age, sex, literacy, occupation, and household structure.
Market Segmentation: Amazon segments users based on age (tech-savvy youth vs. senior citizens) and income.
Transportation Planning: Demographics help decide whether a city needs more public transport for working adults or cycling facilities for students.
Elections: Political campaigns target voters using demographic categories like age, caste, religion, or income group.
🔹 Key Takeaways
Demographic variables are the building blocks of population studies.
They help in understanding diversity, predicting behavior, and designing policies and business strategies.
A strong understanding of demographic variables enables researchers, businesses, and policymakers to make evidence-based decisions.
🔍 How This Helps in Scopus-Based Literature Review
Scopus Filters – You can directly extract Year, Source, Publisher, Country, Citations, and Keywords from Scopus metadata.
Comparative Analysis – Helps you see trends by year, most cited works, or country contributions.
Gap Identification – The Limitations/Gaps column forces critical review beyond summarization.
Relevance Tracking – The last column ensures you connect each paper to your research objectives.
Keyword Mapping – Useful for thematic clustering and bibliometric analysis later.
Doing a Literature Review using Scopus Database
A literature review is not just collecting papers; it is about analyzing, comparing, and identifying gaps in past studies to justify your own research. Scopus is a very useful database for this process.
🔎 Step 1: Define Your Research Topic
Write down your research question or theme (e.g., “Role of metro rail in sustainable urban transport”).
Identify keywords (e.g., metro rail, sustainability, public transport, pollution reduction).
Think of synonyms and variations (e.g., “urban transit,” “mass rapid transit,” “rail-based mobility”).
👉 Tip: Use Boolean operators in Scopus search:
AND = combine (e.g., metro rail AND sustainability)
OR = include synonyms (e.g., “metro rail” OR “mass rapid transit”)
Urbanization in India owes much of its modern character to the Mughal and British periods. Both left distinct imprints on the physical layout, architecture, economy, and social fabric of Indian cities, though their approaches and motivations were very different.
1. Mughal Influence on Indian Cities (16th–18th Century)
The Mughals, who ruled a large part of India between the 16th and 18th centuries, were great city-builders. Their urban vision reflected their Persian, Central Asian, and Indian cultural influences.
Key Features:
Imperial Capitals:
Agra: Established as the Mughal capital by Akbar, it became a center of governance, trade, and culture.
Fatehpur Sikri: Built by Akbar in the late 16th century as a planned city with palaces, mosques, gardens, and administrative quarters.
Shahjahanabad (Old Delhi): Founded by Shah Jahan in 1648, it was a grand capital with the Red Fort, Jama Masjid, Chandni Chowk (market street), and gardens.
City Planning:
Use of fortified walls and gateways for defense.
Charbagh (four-part gardens) symbolizing Persian influence.
Central market squares and bazaars like Chandni Chowk, which encouraged trade and cultural mingling.
Emphasis on aesthetics – symmetry, wide avenues, and monumental architecture.
Architecture and Urban Aesthetics:
Mughal cities blended Islamic, Persian, and Indian styles.
Landmark structures like forts, mosques, caravanserais (rest houses), and stepwells formed the urban landscape.
Red sandstone and marble became signature materials.
Economic Role:
Cities functioned as hubs of craft production, trade, and administration.
Delhi, Agra, and Lahore became cosmopolitan centers attracting artisans, traders, scholars, and travelers.
Lasting Impact:
Many Mughal cities like Delhi, Agra, and Lahore remain cultural and architectural icons. Their forts, gardens, and bazaars still shape the identity and heritage of these cities today.
2. British Influence on Indian Cities (18th–20th Century)
The British had very different urban priorities compared to the Mughals. Their cities were driven by administration, military strategy, trade, and segregation between colonizers and locals.
Key Features:
Presidency Towns:
Calcutta (Kolkata), Bombay (Mumbai), and Madras (Chennai) were the first major British cities, serving as centers of administration, trade, and ports for global commerce.
Dual City Pattern:
British cities had “White Towns” (European quarters with planned roads, bungalows, clubs, and churches) and “Black Towns” (densely populated Indian settlements with bazaars and narrow lanes).
This segregation reflected racial and social hierarchies.
City Planning and Architecture:
Introduction of grid patterns and planned layouts, especially in military cantonments.
Construction of civil lines, railway colonies, and cantonments with orderly streets and open spaces.
Use of neo-classical, gothic, and Indo-Saracenic architecture in public buildings like Victoria Memorial (Kolkata), Gateway of India (Mumbai), and High Courts.
Transport and Trade:
Expansion of railways, ports, and telegraph systems turned cities into commercial hubs.
Bombay became a textile hub, Calcutta a jute hub, and Madras a center for trade in cotton and spices.
New Capitals and Planned Cities:
The British shifted their capital from Calcutta to Delhi in 1911, leading to the creation of New Delhi (designed by Edwin Lutyens and Herbert Baker).
New Delhi was characterized by wide boulevards, administrative buildings (Rashtrapati Bhavan, India Gate), and radial planning, contrasting with the organic growth of Shahjahanabad nearby.
Lasting Impact:
India’s modern administrative and commercial cities owe much to the British.
The railway network stimulated the growth of industrial towns (e.g., Kanpur, Jamshedpur).
Colonial architecture and urban layouts continue to dominate central areas of cities like Delhi, Kolkata, Mumbai, and Chennai.
3. Comparison: Mughal vs. British Urban Influence
Aspect
Mughal Cities
British Cities
Purpose
Imperial capitals, cultural centers, trade hubs
Administrative, military, and commercial bases
Planning Style
Organic + symbolic (forts, gardens, bazaars, religious centers)
Mughal and British urban influences represent two very different urban traditions in India. The Mughals emphasized imperial grandeur, cultural integration, and vibrant bazaars, while the British imposed segregation, order, and administrative functionality. Together, they have left a layered urban fabric in India, where Old Delhi coexists with New Delhi, Mughal Agra with colonial Cantonments, and bazaars with skyscrapers.
Urbanization in India is not merely a demographic phenomenon; it is a complex process shaped by a range of socio-cultural, political, economic, and administrative forces. These factors interact with each other, producing diverse patterns of urban growth and transformation across time and space.
Urbanization in India has been closely tied to the country’s cultural traditions, migration patterns, and social dynamics.
Historical Legacy: Ancient civilizations (e.g., Harappa, Mohenjo-Daro), medieval temple towns (Madurai, Varanasi, Thanjavur), and Mughal capitals (Delhi, Agra, Fatehpur Sikri) laid strong urban foundations.
Religious and Cultural Centers: Cities like Varanasi, Ujjain, Haridwar, and Tirupati developed as pilgrimage centers, drawing permanent settlements, traders, and services.
Migration and Diversity: Social migration for education, jobs, and cultural opportunities has made cities cosmopolitan. For example, Mumbai, Delhi, and Bangalore are melting pots of languages, cuisines, and traditions.
Education and Modernization: Establishment of universities and institutions (e.g., Banaras Hindu University, JNU, IITs) transformed cities like Varanasi, Delhi, and Kanpur into knowledge hubs.
Changing Lifestyles: Urban areas act as spaces of social change—promoting modern values, women’s education, and new family structures (nuclear families, working women).
2. Political Factors
Urbanization has always been influenced by state policies, power centers, and political decisions.
Colonial Legacy: British rule created presidency towns (Calcutta, Bombay, Madras), cantonments, and port cities that remain major urban centers even today.
Capital Formation: Political decisions to shift or create capitals shaped urban landscapes, e.g., New Delhi (1911), Chandigarh (1950s), Gandhinagar, Bhubaneswar.
Post-Independence Planning: State-driven industrialization and Five-Year Plans emphasized creation of industrial townships like Bhilai, Rourkela, Bokaro.
Democracy and Governance: Urban governance through municipal corporations, state governments, and urban local bodies directly affects city growth, infrastructure, and service delivery.
Urban Policy Programs:
JNNURM (2005), AMRUT (2015), Smart Cities Mission (2015), PMAY have shaped modernization and housing.
Political will determines resource allocation for urban transport, housing, and slum redevelopment.
3. Economic Factors
Urbanization is fundamentally tied to economic change, as cities are engines of growth, trade, and employment.
Industrialization:
Post-independence establishment of heavy industries (steel, coal, power plants) created new industrial townships.
Growth of Mumbai (textiles), Kolkata (jute), Ahmedabad (cotton) linked to industrial activity.
Globalization and IT Revolution:
Since the 1990s, Bangalore, Hyderabad, Pune, Gurgaon emerged as IT hubs due to globalization and liberalization.
Special Economic Zones (SEZs) and IT parks accelerated service-led urbanization.
Rural-to-Urban Migration:
Economic opportunities attract migrants to cities for jobs in factories, construction, services, and informal economies.
Urban Informal Economy:
Street vendors, daily-wage workers, domestic help, and small enterprises form the backbone of urban survival but also create planning challenges.
Global Cities:
Indian cities like Mumbai, Delhi, and Bangalore are now integrated into global trade, finance, and technology networks.
4. Administrative Factors
Administrative decisions and governance structures are crucial in shaping urbanization patterns.
Planning and Development:
Post-1947, planning bodies like Town and Country Planning Organization (TCPO) and Delhi Development Authority (DDA) took charge of city development.
State-level Urban Development Authorities (BDA in Bangalore, MMRDA in Mumbai, LDA in Lucknow) oversee land use, housing, and infrastructure.
Municipal Governance:
Local self-governments (municipal corporations, municipalities) play a direct role in providing basic services—water, waste management, roads, and health.
Weak capacity and resource constraints often lead to inefficiency.
Urban Renewal Programs:
Administrative initiatives like Smart Cities Mission, AMRUT, Metro Rail projects, and Housing for All are reshaping urban landscapes.
Decentralization and 74th Constitutional Amendment (1992):
Empowered Urban Local Bodies (ULBs) with more autonomy, encouraging participatory urban governance.
Challenges of Governance:
Issues of corruption, lack of coordination among agencies, and poor enforcement of master plans continue to hinder balanced urban growth.
5. Conclusion
The urbanization process in India is the outcome of interconnected socio-cultural traditions, political choices, economic transformations, and administrative interventions. While cultural heritage and migration enrich Indian cities, politics and governance determine their planning and resource allocation. Economic forces—from industrialization to globalization—drive growth, while administration ensures (or fails to ensure) efficiency and equity.
The future of Indian urbanization depends on how effectively these four dimensions are balanced to create inclusive, sustainable, and resilient cities.
Increasing importance of urban governance and planning to handle migration, inequality, and climate change.
✅ In summary: Urbanization has transformed from being rare in 1800 to a global norm in the 21st century. While developed countries show stable, high levels of urbanization, the developing world is undergoing explosive urban growth, bringing both opportunities for development and challenges of sustainability and inclusivity.
India did not have a clear urbanization policy at Independence (1947); the focus was on rural development. Over time, with rapid urban growth, the government adopted planning interventions to manage urbanization.
Strategy direction is shifting toward sustainable, smart, inclusive, and regionally balanced urbanization.
5. Summary Table
Strategy Area
Examples in India
Balanced growth
IDSMT, satellite towns, industrial corridors
Housing & inclusion
PMAY, Rajiv Awas Yojana, slum redevelopment
Sustainability
AMRUT, Smart Cities, Swachh Bharat Mission
Transport & mobility
Metro projects, National Urban Transport Policy
Governance
74th CAA, ULB empowerment, PPP projects
✅ In summary: India’s urbanization policies have evolved from ignoring cities (pre-1960s) → controlling metros (1970s–80s) → infrastructure modernization (2000s) → smart, sustainable, and inclusive cities (2010s–present). The future requires balanced regional growth, sustainable planning, and empowered local governance.
Migration is the movement of people from one place to another, often from rural to urban areas in India. It is driven by a combination of push factors (forces that drive people away from rural areas) and pull factors (attractions of urban areas).
(a) Push Factors (Rural “Repulsion”)
Agricultural distress: Small landholdings, low productivity, monsoon dependency.
Unemployment/underemployment: Lack of non-farm jobs in villages.
Poverty and indebtedness: Inability to sustain livelihoods.
Searching the Web of Science Master Journal List (MJL) is the most reliable way to confirm whether a journal is indexed in the Science Citation Index (SCI) or any other Web of Science collection.
Optional—Use Manuscript Matcher If you’re submitting a paper and need help finding suitable journals, try the Manuscript Matcher tool on the MJL site. Paste your title or abstract, and it suggests journals matching your manuscript’s content.Web of Science Master Journal ListiLovePhD
What This Means for Authors and Researchers
The MJL tool helps verify whether a journal you’re targeting is truly SCI or WoS indexed, which is crucial for academic credibility and compliance with institutional requirements.
You can refine your search by collection, ensuring your chosen journal aligns with the right WoS index (e.g., SCIE for science & engineering; SSCI for social sciences).
The Manuscript Matcher isn’t just about indexing—it’s a smart discovery tool for finding journals aligned with your research topic.
The Idea of Indian Democracy: Varieties, Successes, and Shortcomings
Introduction
Indian democracy stands as the largest and one of the most vibrant democratic experiments in the world, embodying the aspirations of over a billion people across diverse cultures, languages, and religions. Rooted in the Constitution adopted in 1950, it is founded on the principles of sovereignty, equality, liberty, and justice, while embracing pluralism as its defining strength. The system operates through multiple forms – representative, parliamentary, federal, and social – ensuring governance that is both participatory and inclusive. Over the decades, India’s democratic journey has witnessed remarkable achievements, from peaceful transitions of power to the empowerment of historically marginalised communities. At the same time, it has grappled with persistent challenges such as corruption, casteism, communal tensions, and the influence of money in politics. Understanding the varieties, successes, and shortcomings of Indian democracy is essential to appreciating its resilience, diagnosing its flaws, and envisioning a future where democratic ideals are fully realised in practice.
Types of Indian Democracy
Representative Democracy In India’s representative democracy, citizens elect their leaders through free and fair elections to voice their concerns and make decisions on their behalf. This system ensures that governance reflects the will of the people, allowing them to hold their representatives accountable through periodic elections. By delegating decision-making authority to elected officials, citizens can participate indirectly in shaping policies and laws, creating a bridge between the government and the governed.
Parliamentary Democracy India follows the Westminster model of parliamentary democracy, where the Prime Minister and the Council of Ministers are chosen from among the elected members of Parliament. They are collectively responsible to the legislature, ensuring that the executive remains answerable to the people’s representatives. This arrangement allows for continuous legislative oversight, fosters transparency, and maintains a balance of power between law-making and law-enforcing bodies.
Federal Democracy Indian democracy is also federal in nature, with powers and responsibilities distributed between the Union government and the states. This division, outlined in the Constitution, enables regional governments to address local needs while maintaining national cohesion. Such an arrangement not only protects the diversity of India’s vast population but also strengthens democratic participation at multiple levels of governance.
Social Democracy Social democracy in India strives to create a society where justice, equality, and dignity are accessible to all. Through measures such as affirmative action, reservations, and targeted welfare programmes, it aims to bridge the socio-economic gaps caused by historical injustices. This commitment to inclusivity ensures that disadvantaged communities are given opportunities to participate equally in the democratic process.
Successes
Smooth Transitions of Power One of the notable successes of Indian democracy is the peaceful transfer of power through regular elections. Governments change hands without violence, demonstrating the maturity and resilience of the democratic system. This stability strengthens the legitimacy of political institutions and builds public trust in governance.
Empowerment of Marginalised Communities Affirmative action policies, reservations, and rights-based legislation have empowered Scheduled Castes, Scheduled Tribes, women, and other marginalised groups. These measures have expanded access to education, employment, and political representation, helping to address centuries of social exclusion.
A Robust Judiciary India’s independent judiciary serves as the guardian of the Constitution and protector of citizens’ rights. Through judicial review, it checks executive and legislative excesses, ensuring that the principles of justice, liberty, and equality remain intact.
Freedom of Speech and Press The right to freely express opinions and access information through a free press is a cornerstone of Indian democracy. This freedom encourages public debate, holds leaders accountable, and ensures that governance remains transparent and responsive to the people.
Shortcomings
Corruption and Abuse of Public Office Despite democratic safeguards, corruption remains a significant challenge in India. Misuse of public office for personal gain undermines trust in institutions and diverts resources away from public welfare.
Casteism, Communalism, and Political Polarization Deep-rooted caste and communal divisions continue to influence politics, often leading to social tensions and reduced national unity. Increasing polarisation can weaken democratic consensus and hamper effective governance.
Limited Political Awareness In certain sections of society, low levels of political literacy limit meaningful participation in democratic processes. Without adequate awareness, citizens may be less able to hold leaders accountable or make informed electoral choices.
Criminalization of Politics and Money Power The growing presence of individuals with criminal backgrounds in politics, coupled with the influence of money in elections, poses a serious threat to democratic integrity. These factors distort the electoral process and reduce public confidence in political leadership.
Conclusion
The idea of Indian democracy is both ambitious and dynamic, reflecting the nation’s vast diversity and complex socio-political fabric. Its varieties—representative, parliamentary, federal, and social—work together to create a framework that aspires to uphold justice, equality, and liberty for all citizens. Over the decades, the system has achieved notable successes, such as peaceful transfers of power, empowerment of marginalised groups, a vigilant judiciary, and the safeguarding of freedoms that form the lifeblood of democratic governance. Yet, persistent shortcomings—corruption, social divisions, political polarisation, low civic awareness, and the influence of money and crime in politics—remain significant challenges. The endurance of Indian democracy lies in its ability to reform, adapt, and engage citizens more meaningfully. Strengthening institutions, deepening political literacy, and fostering inclusivity are essential for ensuring that the promise of democracy is not merely an ideal but a lived reality for every Indian.
References
Verma, R. (2023). The Exaggerated Death of Indian Democracy. Journal of Democracy, 34(3), 153-161.
Dehalwar, K., & Sharma, S. N. (2024). Politics in the Name of Women’s Reservation. Contemporary Voice of Dalit, 2455328X241262562.
Guha, R. (1976). Indian Democracy: Long Dead, Now Buried. Journal of Contemporary Asia, 6(1), 39-53.
Kohli, A. (Ed.). (2001). The success of India’s democracy (Vol. 6). Cambridge University Press.
Kohli, A. (Ed.). (2014). India’s Democracy: An Analysis of Changing State-Society Relations. Princeton University Press.
Lijphart, A. (1996). The Puzzle of Indian Democracy: A Consociational Interpretation. American Political Science Review, 90(2), 258-268.
Tudor, M. (2023). Why India’s Democracy Is Dying. Journal of Democracy, 34(3), 121-132.
Varshney, A. (1998). India Defies the Odds: Why Democracy Survives. Journal of Democracy, 9(3), 36-50.
Arithmetic, Geometrical, and Decadal Population Growth methods, including formulas and their interpretation. These are widely used techniques in demography and urban planning to estimate or analyze population growth trends.
1. Arithmetic Growth Method
✅ Definition:
The Arithmetic growth method assumes that the population increases by a constant number of people every year. This method is suitable for short-term projections and when population growth is linear or slow.
✅ Formula:
Where:
PtP_tPt = Projected population at time ttt
P0P_0P0 = Base year population
rrr = Average annual increase in population
ttt = Number of years from base year
✅ How to calculate r:
If data from two known years is available: r=Pn−P0nr = \frac{P_n – P_0}{n}r=nPn−P0
Where:
PnP_nPn = Population at the end of nnn years
P0P_0P0 = Initial population
nnn = Number of years between the two known populations
So, for 2015: P2015=50,000+(1,000×15)=65,000P_{2015} = 50,000 + (1,000 \times 15) = 65,000P2015=50,000+(1,000×15)=65,000
2. Geometric Growth Method
✅ Definition:
In the Geometric growth method, the population increases at a constant rate (percentage) every year. Each year’s increase is compounded on the previous year’s population. It follows exponential growth.
✅ Formula:
Where:
PtP_tPt = Projected population at time ttt
P0P_0P0 = Base year population
rrr = Annual growth rate (expressed as a decimal, e.g., 2% = 0.02)
The Decadal Growth Method calculates the percentage increase in population over a 10-year (decade) period. It’s commonly used in census analysis to measure long-term growth trends.
Chitra Vishwanath is a renowned Indian architect celebrated for her pioneering work in sustainable architecture, ecological planning, and the use of vernacular materials. Based in Bengaluru (Bangalore), Karnataka, she is the principal architect of Biome Environmental Solutions, a multidisciplinary firm that integrates architecture with ecological engineering. Through her practice, Chitra Vishwanath has become a leading figure in climate-responsive architecture, water-sensitive urban design, and resource-efficient housing in India.
👩🎓 Early Life and Education
Chitra Vishwanath was born in Kerala and raised in Delhi. She pursued architecture at the School of Architecture, CEPT University, in Ahmedabad, which is known for its strong foundation in climate-responsive and regional design. Her education and upbringing in different parts of India helped shape her sensitivity to the local climate, culture, and materials, which became central to her design philosophy.
🏛 Architectural Philosophy
Chitra Vishwanath’s design philosophy emphasizes:
Sustainability and Ecology: Her buildings minimize environmental impact and actively restore ecological balance.
Use of Local and Natural Materials: She is especially known for using mud (compressed earth blocks), stone, bamboo, and lime — avoiding cement and synthetic materials when possible.
Water Conservation: She advocates rainwater harvesting, groundwater recharge, and wastewater recycling in all her designs.
Energy Efficiency: Her buildings use passive solar techniques, natural ventilation, and daylighting to reduce reliance on artificial systems.
Community-Centric Design: She promotes inclusive development, particularly focusing on rural areas and marginalized communities.
Integration of Architecture and Nature: Her projects blend seamlessly with the landscape and promote biodiversity.
Chitra believes in living what she designs, evident from her own mud house in Bengaluru, which functions entirely off-grid, harvests water, recycles waste, and exemplifies sustainable living.
🏠 Key Projects and Contributions
1. Biome Environmental Solutions
Chitra is the principal architect and managing director of this interdisciplinary firm that works on architecture, ecological sanitation, rainwater harvesting, and landscape design. It brings together engineers, ecologists, planners, and architects.
2. Her Own Residence and Office (Bangalore)
Built using stabilized mud blocks (SMBs) made on site.
Includes solar power, composting toilets, rainwater harvesting, and greywater recycling.
It is both a living laboratory and an example of how urban households can be made sustainable.
3. Design of Eco-Sensitive Schools and Institutions
Has worked on designing rural schools, community centers, and institutions across Karnataka and Tamil Nadu.
Emphasis on low-cost, high-impact construction with natural cooling and ventilation.
4. Water Projects
Biome has undertaken urban water audits, lake rejuvenation, and rainwater harvesting systems across Bengaluru.
Worked with government agencies and citizen groups for sustainable urban water management.
🌿 Materials and Technology
Chitra Vishwanath is known for advocating and using the following materials:
Mud Blocks (Compressed Earth Blocks): Stabilized using minimal cement or lime, produced on-site.
Lime Plaster: Breathable, antibacterial, and low-carbon.
Bamboo: For structural and non-structural elements.
Stone and Terracotta: Locally sourced and culturally relevant.
Recycled and Upcycled Materials: Wherever possible, she incorporates reused wood, bricks, and other materials.
These materials are not just environmentally responsible but are also deeply connected to India’s cultural heritage.
🌊 Water and Sanitation Advocacy
Chitra and Biome are widely respected for their water literacy and rainwater harvesting efforts:
Helped design and implement over 1000+ rainwater harvesting systems in urban and rural settings.
Worked with public institutions, schools, and residential layouts.
Promotes the idea of zero-discharge campuses, where all water used is harvested, reused, and recycled.
🧑🤝🧑 Social Responsibility and Community Work
Chitra Vishwanath has been involved in:
Empowering local masons and artisans by training them in sustainable building techniques.
Supporting urban poor communities in developing affordable, safe, and eco-friendly housing.
Collaborating with NGOs, academic institutions, and government agencies on climate-resilient infrastructure.
🏆 Recognition and Influence
While Chitra Vishwanath may not seek fame, her work has been widely recognized:
Invited Speaker at TEDx, design conferences, and architecture schools.
Featured in national and international platforms for her contributions to ecological architecture.
Recognized as a thought leader in sustainable design in India.
She continues to mentor young architects, emphasizing ethical practice, environmental stewardship, and contextual relevance.
📚 Publications and Advocacy
Chitra writes and speaks regularly on topics such as:
Mud architecture
Water conservation in urban planning
Sustainable living practices
Vernacular architecture in contemporary India
She strongly advocates that architects should be environmentalists, and that architecture should be part of the solution to India’s climate and housing challenges.
🧠 Conclusion
Chitra Vishwanath stands out as a pioneer of sustainable and context-sensitive architecture in India. Her work goes beyond buildings — she fosters ecosystems, empowers communities, and creates models for climate-resilient living. In a time when architecture is often driven by spectacle and commercial gain, Chitra’s work serves as a humble, powerful reminder of what architecture can and should do: serve people, respect nature, and nurture the planet.
Her life’s mission — to build in harmony with nature and inspire others to do the same — continues to influence urban designers, architects, ecologists, and changemakers across India and the world.
Ludwig Mies van der Rohe (1886–1969) was a pioneering German-American architect and one of the most influential figures in modern architecture. Known for his minimalist approach, Mies is celebrated for his famous dictum “Less is more” and his commitment to clarity, simplicity, and modern materials like steel and glass. His designs emphasized open space, rational structures, and functionalism, and his work laid the foundation for what is now called the International Style in architecture.
🧒 Early Life and Background
Full Name: Maria Ludwig Michael Mies
Born: March 27, 1886, Aachen, Germany
Died: August 17, 1969, Chicago, USA
Mies was born into a family of stone masons, which exposed him early on to construction and craftsmanship. Though he had no formal architectural education, he gained experience working in his father’s workshop and later under established architects in Berlin, including Peter Behrens, a major figure in early modernism. At Behrens’ office, Mies worked alongside Walter Gropius and Le Corbusier — all of whom would later define modernist architecture.
🏛 Architectural Philosophy
🔹 “Less is More”
Mies championed minimalism, where every element has a clear function and unnecessary ornamentation is eliminated. His famous motto, “Less is more,” became a core principle of modernist design.
🔹 Universal Space
He introduced the idea of universal space—open, flexible floor plans made possible by modern structural techniques using steel frames and glass walls.
🔹 Truth to Materials
Mies believed in expressing the true nature of materials—steel should look like steel, glass like glass. He did not try to disguise the materials but celebrated their essence.
🔹 Architecture as Order
He viewed architecture as a disciplined expression of form and order, influenced by classical proportions and a rationalist approach.
🏗 Key Projects
1. Barcelona Pavilion (1929)
Location: Barcelona, Spain
Built for: German Pavilion at the 1929 International Exposition
Style: Minimalist, open-plan space using glass, steel, and marble
Famous Furniture: The Barcelona Chair, designed with Lilly Reich
This iconic structure is a symbol of modernism and spatial purity. Though demolished after the exhibition, it was reconstructed in 1986 and is widely studied today.
2. Villa Tugendhat (1930)
Location: Brno, Czech Republic
A luxury private home that employed open-plan living and modern materials.
One of the first residential buildings to use a steel frame structure.
Famous for its large curved glass windows, onyx wall, and custom furniture.
3. Seagram Building (1958) (with Philip Johnson)
Location: New York City, USA
A landmark skyscraper that defines the International Style: sleek, rectilinear, and monumental.
Use of bronze-toned I-beams as decorative (but honest) elements on the facade.
Pioneered the idea of a public plaza in front of the building, influencing urban skyscraper design in America.
4. Farnsworth House (1951)
Location: Plano, Illinois, USA
A weekend retreat for Dr. Edith Farnsworth, a single-room glass house elevated on stilts.
Radical for its complete transparency and openness to nature.
Considered a masterpiece of modernist residential design.
5. Illinois Institute of Technology (IIT) Campus (1938–58)
Mies was the head of the architecture department and designed many of the buildings on the campus.
The Crown Hall (1956), the architecture building, is especially famous for its steel and glass box design.
His work at IIT became a model for educational campuses worldwide.
🏫 Role as Educator
Mies was a passionate teacher and a profound influence on architectural education:
Director of the Bauhaus (1930–1933), Germany’s most avant-garde design school, until it was closed by the Nazis.
Fled to the United States in 1937 and became head of the architecture school at Illinois Institute of Technology (IIT) in Chicago.
At IIT, he reformed the curriculum around modernist principles and trained a generation of influential architects.
✈️ Move to the United States
Mies emigrated to the United States in 1937 due to increasing Nazi hostility toward modernist art and architecture, which they viewed as “degenerate.” In America, he found a new platform to experiment with skyscrapers, free plans, and industrial materials.
🏆 Awards and Recognition
AIA Gold Medal (1960)
Royal Gold Medal by RIBA (1959)
Numerous buildings listed as historic landmarks
Widely recognized as one of the “Big Three” of modernism (with Le Corbusier and Gropius)
📚 Notable Contributions to Furniture Design
Mies also designed iconic modern furniture, often with his collaborator Lilly Reich, such as:
Barcelona Chair
Brno Chair
MR Lounge Chair
These pieces are celebrated for their elegance, simplicity, and use of modern materials like tubular steel and leather.
🕊 Death and Legacy
Ludwig Mies van der Rohe died on August 17, 1969, in Chicago. His ashes were buried near the graves of his architect students at Graceland Cemetery.
Legacy:
Mies van der Rohe’s International Style became the global language of corporate and institutional architecture from the 1950s–1970s.
His designs inspired countless office buildings and skyscrapers around the world.
His clear, rational architectural grammar continues to influence architects today.
Museums, design schools, and architecture faculties continue to study his work and philosophy as foundational in modern architecture.
🧠 Conclusion
Ludwig Mies van der Rohe was a master of modernism — a man who stripped architecture down to its essence and reshaped how we think about space, materials, and form. Whether through the clean lines of the Seagram Building or the transparent grace of the Farnsworth House, Mies created timeless works that emphasize order, openness, and honesty.
His legacy is immortalized not only in his buildings and furniture but also in his ideas, which remain a cornerstone of architectural thought across the globe. In every minimalist structure, in every glass-and-steel skyscraper, the influence of Mies can still be seen — a testament to his enduring vision of “less is more.”
Balkrishna Vithaldas Doshi (1927–2023) — affectionately known as B.V. Doshi — was a visionary Indian architect whose work bridged the worlds of tradition and modernity, and played a transformative role in shaping post-independence Indian architecture. He is widely celebrated for his humane approach to design, commitment to sustainability, and dedication to social housing, education, and culture. As the first Indian architect to receive the Pritzker Architecture Prize in 2018, Doshi’s legacy extends beyond buildings to influence generations of architects and planners.
🧒 Early Life and Education
B.V. Doshi was born on August 26, 1927, in Pune, Maharashtra, into a family of furniture makers. His early exposure to craftsmanship and traditional Indian aesthetics would later shape his architectural philosophy.
He studied at the Sir J.J. School of Architecture in Mumbai. However, it was his time in Europe during the early 1950s that had a profound impact on his thinking. Doshi worked under the legendary modernist Le Corbusier in Paris and later in Chandigarh and Ahmedabad, where he supervised major projects. He also collaborated with Louis Kahn on the Indian Institute of Management (IIM) Ahmedabad.
🏛 Architectural Philosophy
B.V. Doshi’s architecture was deeply rooted in Indian traditions, climatic responsiveness, social responsibility, and human-centric design. He was a pioneer of modern Indian architecture who adapted modernist principles to the Indian context, fusing them with local materials, construction techniques, and cultural motifs.
Key principles in Doshi’s work:
Synthesis of tradition and modernity
Use of natural light and ventilation
Community-focused spaces
Affordable and low-cost housing
Sustainability and local materials
Spatial hierarchy and interactivity
Celebration of courtyards, terraces, and verandas
🏠 Major Works
1. Aranya Low-Cost Housing, Indore (1989)
One of Doshi’s most significant contributions to social housing.
Designed for economically weaker sections, Aranya consists of over 6,500 residences.
Encourages incremental growth, allowing families to expand or modify their homes.
Winner of the Aga Khan Award for Architecture (1995).
2. Indian Institute of Management (IIM), Bangalore (1977–1992)
A sprawling campus of interlinked courtyards, stone corridors, and shaded walkways.
The design reflects ancient Indian temples and educational spaces, creating contemplative environments.
3. CEPT University, Ahmedabad (1966 onwards)
Doshi founded and designed the campus of Centre for Environmental Planning and Technology (CEPT).
A model of flexible, open, and democratic learning spaces.
Features exposed brickwork, natural light, and a strong sense of place.
4. Tagore Memorial Hall, Ahmedabad (1967)
Inspired by Indian temple architecture and brutalist aesthetics.
Known for its bold concrete forms and acoustics suitable for performing arts.
5. Amdavad ni Gufa (1995)
An underground art gallery built in collaboration with artist M.F. Husain.
Organic, cave-like forms with domes, mosaics, and undulating surfaces.
A symbolic fusion of art, architecture, and nature.
6. Sangath, Ahmedabad (1981)
Doshi’s own architectural studio.
“Sangath” means “moving together” in Sanskrit.
Built with sunken vaults, white mosaic surfaces, and shaded gardens, it reflects his approach to spatial experimentation and climate sensitivity.
🏆 Awards and Recognition
Pritzker Architecture Prize (2018)
First Indian to win this prestigious award.
Jury citation praised Doshi for “always designing for the backdrop of life… never architecture for architecture’s sake.”
Royal Institute of British Architects (RIBA) Gold Medal (2022)
One of the world’s highest honors in architecture, awarded for lifetime achievement.
Other Recognitions:
Padma Shri (1976)
Padma Bhushan (2020)
Aga Khan Award for Architecture (1995)
Numerous honorary doctorates and international acclaim
🎓 Academic and Institutional Contributions
Founder of CEPT University, a leading institution for architecture and planning in India.
Taught and mentored generations of students.
Served on design committees for national policy on architecture and planning.
Advocated for architecture as a tool for social change.
📚 Writings and Influence
B.V. Doshi was a prolific speaker, thinker, and writer. His lectures, interviews, and writings reflect a deep philosophical engagement with architecture as a cultural, spiritual, and emotional practice.
His Work Emphasized:
Timelessness over trends
Contextual relevance over global styles
Joyful spaces that promote human interaction
Democracy in spatial design
The spiritual dimension of built form
🕊 Death and Legacy
B.V. Doshi passed away on January 24, 2023, at the age of 95, in Ahmedabad. His passing marked the end of an era, but his ideas live on through his students, institutions, and built works.
Legacy Highlights:
Regarded as the father of modern Indian architecture
Celebrated globally as a humanist architect
Inspired new generations to design with empathy, humility, and sustainability
His buildings remain active, evolving spaces — not static monuments
🧠 Conclusion
Balkrishna Vithaldas Doshi was more than an architect — he was a philosopher, educator, and social reformer who believed in the power of design to improve lives. He showed the world how architecture could be deeply modern yet rooted in tradition; humble yet monumental; and sustainable yet imaginative.
Frank Lloyd Wright (1867–1959) was one of the most influential and iconic architects of the 20th century. Known for developing the philosophy of organic architecture, he left behind a legacy that continues to shape the way we design homes, buildings, and spaces. Wright’s visionary designs integrated buildings with their environments, emphasized harmony between the natural world and the built form, and often broke conventional architectural norms.
🧑🎨 Early Life and Education
Frank Lloyd Wright was born on June 8, 1867, in Richland Center, Wisconsin, USA. His early life was marked by strong influences from both his parents:
His mother, Anna Lloyd Jones, believed he would become an architect and encouraged his development through Froebel education methods, which emphasized geometric forms and design.
His father, William Wright, was a preacher and musician. Though his parents divorced when Wright was young, their influence shaped his early thinking.
Wright never formally graduated from any architecture school. In 1887, he moved to Chicago during a construction boom and found work at the prestigious firm of Adler and Sullivan, where he apprenticed under Louis Sullivan, often called the “father of skyscrapers.” Sullivan’s philosophy of “form follows function” deeply influenced Wright.
🏛️ Architectural Philosophy: Organic Architecture
Wright coined and championed the concept of organic architecture, which means that a building should:
Be integrated into its environment
Use local materials
Reflect the needs and nature of its inhabitants
Have fluid, open spaces
He believed that buildings should grow naturally from their surroundings, like a tree growing from the ground. This vision was not just aesthetic—it was a response to industrialization, urban sprawl, and poor housing conditions.
🏠 Major Works and Styles
1. Prairie Style (1900s–1910s)
Wright developed the Prairie School of architecture, inspired by the flat, horizontal lines of the American Midwest landscape.
Features included low-pitched roofs, overhanging eaves, horizontal lines, and open floor plans.
Notable Prairie Houses:
Robie House (1909), Chicago, IL – Considered a masterpiece of Prairie design.
Unity Temple (1905–08), Oak Park, IL – An early example of concrete used innovatively in architecture.
2. Usonian Houses (1930s–1950s)
Designed as affordable housing for middle-class Americans during the Great Depression.
Usonian homes were single-story, L-shaped, had no basements or attics, and featured built-in furniture, radiant floor heating, and carports.
Notable Usonian Example:
Jacobs House (1937), Madison, WI – The first true Usonian house.
3. Integration with Nature
Wright’s belief in harmony with nature reached its peak in his most famous work:
🏞️ Fallingwater (1935), Pennsylvania
A house built over a waterfall, with cantilevered balconies and local stonework.
Often cited as one of the greatest architectural works of the 20th century.
🕌 Other Landmark Projects
🔷 Taliesin (1911–1959)
Wright’s own home and studio in Spring Green, Wisconsin.
Rebuilt several times after fires and constantly modified, it served as a testing ground for his ideas.
🔷 Taliesin West (1937)
Wright’s winter home and architectural school in Scottsdale, Arizona.
Blended desert rock and wood, emphasizing the Southwestern environment.
🔷 The Guggenheim Museum (1959), New York
An iconic spiral-shaped art museum.
Designed to let visitors experience art in a continuous flow.
🌍 Global Impact and Influence
Frank Lloyd Wright designed over 1,000 structures, of which around 532 were built. His work influenced generations of architects worldwide and continues to be studied for its innovation in:
Open floor planning
Structural engineering (e.g., cantilevers)
Use of natural light
Integration with landscape
Human-centric design
His disciples spread his ideas internationally, and the Taliesin Fellowship, which he founded in 1932, trained many architects who went on to successful careers.
🏆 Awards and Recognition
Royal Institute of British Architects Gold Medal (1941)
American Institute of Architects Gold Medal (1949)
Named the “Greatest American Architect of All Time” by the AIA in 1991.
In 2019, eight of his buildings, including Fallingwater, Unity Temple, and the Guggenheim Museum, were inscribed on the UNESCO World Heritage List as “The 20th-Century Architecture of Frank Lloyd Wright.”
📚 Writings and Legacy
Wright was not only an architect but also a prolific writer and thinker. His works include:
“The Natural House” (1954) – Outlined his vision for simple, sustainable homes.
“An Autobiography” (1932) – A philosophical and detailed account of his life and work.
His legacy is preserved by:
The Frank Lloyd Wright Foundation
The Taliesin Preservation
Numerous museums, archives, and tours around his built works.
⚰️ Death and Final Years
Frank Lloyd Wright passed away on April 9, 1959, at the age of 91. He was active in architectural work until the end of his life, leaving behind unfinished designs and a rich architectural philosophy that redefined modern architecture.
📝 Conclusion
Frank Lloyd Wright was more than just an architect—he was a cultural figure who reshaped how we think about space, nature, and design. His organic philosophy of building harmoniously with the environment, combined with his innovative use of space, light, and materials, made him a pioneer of modern architecture. His ideas continue to inspire architects and environmental designers around the globe, underscoring the timelessness of his vision.
A literature review is a critical component of any research study. It helps in understanding existing knowledge, identifying research gaps, and building a theoretical foundation for new investigations. Over time, various methods and frameworks have been developed to conduct literature reviews more systematically and transparently. Here are some of the key techniques:
1. Traditional Literature Survey (Narrative Review)
Overview:
Also called narrative review, this is the most conventional and flexible approach.
Involves summarizing and synthesizing existing literature based on the author’s subjective selection.
Key Features:
Broad overview of a topic.
Thematic or chronological organization.
Focuses on theoretical perspectives, concepts, and debates.
Strengths:
Useful for conceptual exploration or theoretical discussions.
Allows interpretation and critical thinking.
Limitations:
No formal methodology, making it prone to bias.
Less reproducible and transparent compared to systematic reviews.
2. Systematic Literature Review (SLR)
Overview:
A rigorous and structured method to review literature.
Seeks to identify, evaluate, and synthesize all relevant studies on a specific topic or question.
Steps Involved:
Define a research question.
Develop inclusion/exclusion criteria.
Conduct systematic searches in databases.
Screen titles, abstracts, and full texts.
Extract data and analyze findings.
Strengths:
Reproducible and transparent.
Minimizes bias.
Suitable for evidence-based research.
Limitations:
Time-consuming and complex.
May exclude qualitative insights.
Use Cases:
Medicine, education, social sciences, and policy-making.
3. PRISMA (Preferred Reporting Items for Systematic Reviews and Meta-Analyses)
Overview:
PRISMA is a reporting framework, not a review method per se.
It provides a checklist and flow diagram to enhance the transparency and quality of systematic reviews and meta-analyses.
A structured model for literature reviews introduced by Booth et al.
Balances systematic rigor with flexibility.
Components:
Search: Identify literature using keywords, databases, and grey literature.
Appraisal: Evaluate the quality, relevance, and rigor of each study.
Synthesis: Group, compare, and contrast findings.
Analysis: Interpret results, identify gaps, and derive implications.
Strengths:
Allows a structured yet adaptable approach.
Suitable for both qualitative and quantitative studies.
Limitations:
Still requires researcher judgment for synthesis and analysis.
Use Cases:
Useful for interdisciplinary research, education, and social sciences.
5. Scoping Review
Overview:
Explores the extent, range, and nature of research on a topic.
Often used to map evidence and identify gaps.
Key Features:
Broad focus.
No detailed quality appraisal (unlike systematic reviews).
May include grey literature.
Strengths:
Great for exploratory purposes.
Helps formulate precise research questions.
Limitations:
May lack depth in synthesis.
Does not usually assess study quality.
Use Cases:
Preliminary stage of large projects or policy development.
6. Meta-Analysis
Overview:
A quantitative extension of a systematic review.
Combines statistical data from multiple studies to calculate a pooled effect size.
Key Features:
Requires studies with similar designs and measurable outcomes.
Provides numerical summary of evidence.
Strengths:
Increases statistical power.
Helps in confirming patterns.
Limitations:
Not suitable for qualitative data.
Requires statistical expertise.
7. Meta-Synthesis
Overview:
A technique to integrate and interpret qualitative research findings.
Focuses on themes and conceptual models.
Strengths:
Deepens understanding of human experiences and perceptions.
Useful in social sciences and humanities.
Limitations:
Subjective interpretation.
Cannot be generalized statistically.
8. Rapid Review
Overview:
A time-efficient alternative to systematic reviews.
Uses streamlined methods for quick evidence synthesis.
Strengths:
Faster and less resource-intensive.
Useful for policy or urgent decision-making.
Limitations:
May compromise rigor and comprehensiveness.
9. Integrative Review
Overview:
Integrates data from both experimental and non-experimental studies.
Synthesizes past empirical and theoretical literature.
Strengths:
Offers a comprehensive understanding of complex phenomena.
Flexible and inclusive.
Limitations:
Requires careful organization and strong justification.
🔍 Comparison of Major Review Techniques
Technique
Scope
Rigor
Time Needed
Suitable For
Narrative Review
Broad
Low
Short
General understanding
Systematic Review
Focused
High
Long
Evidence-based studies
PRISMA
Focused
Very High
Long
Medical/social science reviews
SALSA
Moderate
Medium
Moderate
Thematic reviews, education
Scoping Review
Broad
Medium
Moderate
Mapping literature
Meta-Analysis
Narrow
Very High
Long
Quantitative studies
Meta-Synthesis
Narrow
Medium
Long
Qualitative research
Rapid Review
Focused
Medium
Short
Time-sensitive topics
Integrative Review
Moderate
Medium
Moderate
Mixed-methods synthesis
✍️ Conclusion
Choosing the right literature review technique depends on your research objectives, available time, field of study, and type of data. For a basic understanding, a narrative review may suffice, while a systematic or PRISMA-guided review is essential for evidence-based disciplines. Methods like SALSA, scoping reviews, and meta-syntheses offer flexible and in-depth alternatives for complex or interdisciplinary topics.
Each technique, when used properly, strengthens the foundation of your research and enhances the quality and credibility of your academic work.
References
Dehalwar, K., & Sharma, S. N. (2023). Fundamentals of research writing and uses of research methodologies. Edupedia Publications Pvt Ltd.
Sharma, S. N., & Dehalwar, K. (2025). A Systematic Literature Review of Transit-Oriented Development to Assess Its Role in Economic Development of City. Transportation in Developing Economies, 11(2), 23.
Sharma, S. N., & Dehalwar, K. (2024). Review of Evergreen ILS: Highly-Scalable Open Source Library Management Solution. Available at SSRN 4853757.
Sharma, S. N., & Dehalwar, K. (2025). Assessing the Transit-Oriented Development and Travel Behavior of the Residents in Developing Countries: A Case of Delhi, India. Journal of Urban Planning and Development, 151(3), 05025018.
Sharma, S. N. (2024). Understanding Scientometric Analysis: Applications and Implications.Track2Training
Sharma, S. N. (2018). Review of National Urban Policy Framework 2018. Think India Journal, 21(3), 74-81.
Sharma, S. N., Singh, D., & Dehalwar, K. (2024). Surrogate safety analysis-leveraging advanced technologies for safer roads. Suranaree Journal of Science and Technology, 31(4), 010320.
Dehalwar, K., & Sharma, S. N. (2024). Social Injustice Inflicted by Spatial Changes in Vernacular Settings: An Analysis of Published Literature.
Natural disasters, especially floods, are increasingly affecting vulnerable communities around the world, and children are often the most impacted. In India, recurrent flooding in states like Assam, Bihar, Odisha, and Kerala has had devastating effects on educational continuity and early childhood care. Schools and Anganwadis—integral to child development and learning—are frequently damaged or disrupted. This underscores the urgent need to adopt child-centric Disaster Risk Reduction (DRR) strategies and build resilient educational and care infrastructure in flood-prone zones.
1. Why Child-Centric DRR Matters
Children are not just passive victims of disasters—they are active stakeholders whose rights to safety, education, and well-being must be protected. Child-centric DRR:
Recognizes the unique vulnerabilities of children.
Focuses on minimizing disruption to learning and care.
Ensures children’s voices are included in planning and preparedness.
Enhances psychological and social resilience through supportive environments.
2. Understanding the Risk: Flood Impacts on Schools and Anganwadis
Floods affect educational institutions in several ways:
Structural damage: Buildings collapse or become unusable due to waterlogging.
Learning loss: Closure of facilities causes prolonged interruption of education.
Health risks: Unsanitary conditions lead to disease outbreaks among children.
Psycho-social trauma: Exposure to disaster causes long-term mental health issues in children.
Anganwadis, which serve children aged 0–6 years, are even more vulnerable due to their location in community buildings and limited funding for resilient infrastructure.
3. Principles for Building Resilient Schools and Anganwadis
a. Location and Site Planning
Avoid constructing in low-lying or floodplain areas.
Use GIS-based hazard mapping to identify safe zones.
Raise plinth levels and construct on stilts or elevated platforms in high-risk areas.
b. Climate-Resilient Infrastructure
Use flood-resistant materials and designs that allow for quick drying and easy cleaning.
Ensure robust drainage systems to prevent water stagnation.
Install rainwater harvesting and water purification units to ensure safe drinking water post-disaster.
c. Multipurpose Use and Community Integration
Design schools and Anganwadis as community disaster shelters.
Include safe storage spaces for learning materials and emergency kits.
Ensure inclusive design for children with disabilities.
d. Green and Safe Spaces
Create safe outdoor play areas with flood-tolerant landscaping.
Include kitchen gardens and child-friendly environments to support nutrition and well-being.
4. Institutional and Capacity Strengthening
a. School and Anganwadi Disaster Management Plans (DMPs)
Prepare child-friendly DMPs that involve children in evacuation drills and safety education.
Form School Safety Committees and link them with local DRR bodies.
b. Training and Sensitization
Train Anganwadi workers and teachers in first aid, child protection, and psychological first aid.
Conduct regular mock drills and safety education activities for children.
c. Interdepartmental Coordination
Ensure collaboration between education, women and child development, disaster management, and public works departments.
Leverage schemes like the National Disaster Response Fund (NDRF) or District Mineral Funds for resilient infrastructure.
5. Technology and Innovation in Resilience Building
Use digital early warning systems to alert institutions in advance of floods.
Implement e-learning solutions and mobile education units for continued access during displacement.
Deploy solar-powered lights and communication tools in remote areas.
6. Case Studies and Best Practices
a. Bihar’s Flood-Resistant Schools
In flood-prone districts of Bihar, UNICEF and local authorities piloted raised school buildings with floating furniture and elevated storage. This helped ensure continuity of learning even during monsoon floods.
b. Kerala’s Multi-Hazard Resilient Anganwadis
Post-2018 floods, Kerala redesigned Anganwadis with elevated foundations, emergency kits, and community awareness components.
c. Assam’s Child-Friendly DRR Initiatives
NGOs partnered with local governments to train children in flood preparedness, build child-centric evacuation plans, and provide psychosocial care post-disaster.
7. Policy and Financing Support
Incorporate DRR in National Education Policy and Integrated Child Development Services (ICDS) guidelines.
Allocate dedicated budget lines for school and Anganwadi resilience in disaster-prone districts.
Tap into CSR funds, state disaster mitigation funds, and international climate financing.
8. Moving Forward: Strategic Recommendations
Mainstream DRR in education and childcare planning at all levels.
Promote community-led infrastructure design for better acceptance and sustainability.
Ensure every new Anganwadi and school in flood zones is built with resilience as a core component.
Empower children as DRR ambassadors through age-appropriate education and participation.
Build evidence and data systems for monitoring school safety and child well-being during disasters.
Resilient schools and Anganwadis are not just about bricks and mortar—they are about protecting futures. By embedding child-centric DRR in the planning, design, and operation of these institutions, we can ensure that every flood or disaster becomes a moment of learning, not loss. Investing in such resilience is not only a humanitarian imperative but also a foundational step toward sustainable development and child rights protection.
India has no single comprehensive urbanization policy document, but multiple initiatives, programmes, and committees have shaped the approach:
First & Second Five-Year Plans (1951–61): Focus on rural development, little attention to cities.
Third & Fourth Plans (1961–74): Recognition of rapid urban growth, emergence of metropolitan planning.
National Commission on Urbanisation (NCU, 1986): Landmark effort; stressed strengthening of small and medium towns, reducing pressure on metros, and promoting balanced regional growth.
Post-1990s (Economic Liberalization): Market-driven urbanization, rise of SEZs, industrial corridors.
✅ In summary: India’s urbanization policy has evolved gradually, but challenges persist. The basic issues revolve around imbalanced growth, inadequate housing & infrastructure, weak governance, and environmental degradation. A comprehensive National Urbanization Policy should address these with integrated planning, inclusive strategies, and sustainable urban growth models.
ATAL Academy stands for AICTE Training and Learning Academy. It is an initiative of the All India Council for Technical Education (AICTE) launched in 2018 to improve the quality of technical education in India by building capacities of teachers, researchers, and technical staff through short-term Faculty Development Programmes (FDPs) in emerging and relevant domains. The Academy’s aim is to support institutions in fostering research, innovation, and entrepreneurship by upskilling faculty with contemporary knowledge, pedagogy, and hands-on exposure. JIIT
(Note: ATAL Academy is distinct from—but complementary to—the Atal Innovation Mission (AIM) under NITI Aayog, which focuses on broader innovation ecosystems like Atal Tinkering Labs and incubation. The ATAL FDPs are specifically faculty capacity-building via AICTE.)Eduindex News
2. Objectives
The core objectives of ATAL Academy FDPs are to:
Impart quality training in emerging areas of technology and pedagogy to faculty and technical staff.
Enhance teaching and research capabilities in institutions to align with evolving academic and industry trends.
Promote innovation and entrepreneurship mindset through exposure to new tools, interdisciplinary themes, and best practices.
Create a nationwide reach, including remote and underrepresented regions, by funding and supporting FDPs across India.
Enable networking and collaboration among academicians, researchers, and industry experts. JIITEduindex News
3. Course Categories and Structure (2025–26)
For the academic year 2025–26, the ATAL Academy FDPs are divided mainly into two categories: JIIT
Basic FDPs – Typically 6 days long.
Grant-in-aid: ₹3,50,000 per approved programme.
Advanced FDPs – Typically 12 days long.
Grant-in-aid: ₹6,00,000 per approved programme.
Both are conducted in offline mode (with separate provisions for online FDPs outlined in their scheme documents), and are meant to cover frontier topics in engineering, management, architecture, design, sciences, and allied technical areas. JIIT
There are separate scheme documents for online FDPs (e.g., six-day online programmes) with their own guidelines, eligibility, minimum participant thresholds, and funding ceilings, reflecting adaptation post-COVID to digital delivery. Scribd
4. Proposal Submission and Approval Process
Who Can Propose: Faculty from AICTE-approved institutions (engineering, management, architecture, pharmacy, etc.) act as coordinators and submit proposals on behalf of their institutes through the ATAL Academy online portal. JIIT
Portal & Registration: Coordinators and participants register at the official ATAL Academy portal. Faculties must fill institutional details, upload necessary documents (e.g., ID, NOC), and submit the FDP proposal in the prescribed format. mitfgc.in
Limits & Restrictions:
Institutes that were awarded consecutively in earlier years may have restrictions (e.g., those awarded in both 2023–24 and 2024–25 may not be considered for 2025–26 in some categories).
Coordinators who already had FDPs in 2024–25 may be ineligible for selection in 2025–26 for the same category. JIIT
Selection: Submitted proposals are evaluated per scheme guidelines; shortlisted programmes receive sanction orders. For online FDPs, there are additional conditions like minimum participant numbers and coordinator experience criteria. Scribd
5. Funding and Financial Support
Grant-in-Aid: As noted, approved offline Basic and Advanced FDPs receive fixed grants (₹3,50,000 and ₹6,00,000 respectively). JIIT
Online FDPs: Funding details differ (e.g., specified ceiling of around ₹1,00,000 for certain six-day online programmes) with guidelines to cover resource persons, platform management, and administration. Scribd
No Participant Fees: ATAL FDPs are generally free for participants; no fee is charged from attending faculty or students in approved programmes. smec.ac.in
6. Eligibility and Roles
Coordinators: Usually faculty members with requisite teaching/industry experience (details vary between online vs offline schemes), responsible for designing the course, securing resource persons, and overall execution. Scribd
Participants: Faculty, researchers, and technical staff from AICTE-approved institutions; sometimes open to others based on the specific FDP advertisement. Selection is often first-come-first-served or as per the brochure’s criteria. smec.ac.in
Resource Persons: Experts in the thematic area—often drawn from academia, research organizations, or industry—who deliver the content of the FDP. Eduindex News
7. Delivery Modes
Offline FDPs: Conducted in-person at host institutions, structured over multiple days with lectures, hands-on sessions, interactions, and project/case study components as per the theme. JIIT
Online FDPs: Designed to leverage digital platforms, including live sessions, recorded content, and virtual interaction; the online scheme emphasizes adaptability to rapid changes and broader reach. Scribd
8. Logistics, Certification, and Follow-up
Logistics: Host institutions are expected to manage venue, scheduling, resource-person coordination, and participant communication. Online FDPs require platform setup, digital attendance mechanisms, and content management systems. Scribd
Certification: Participants who fulfill attendance and assessment criteria receive certificates of participation/completion from ATAL Academy. smec.ac.in
Feedback & Reporting: Feedback collection and submission of post-programme reports are mandatory for closure and future eligibility. Scribd
9. Benefits
For Faculty/Participants: Exposure to updated and emerging technical knowledge, pedagogical enhancement, networking, and potential research/industry collaborations. Eduindex News
For Host Institutions: Capacity building of their teaching/research staff, elevation in academic quality, visibility through high-quality thematic programmes. JIIT
10. Recent and Live Examples (2025)
Numerous FDPs are ongoing or recently conducted in 2025 on specialized topics (e.g., AI-embedded precision farming, circular economy themes, biomaterials for tissue engineering, etc.), showing active implementation and thematic diversity. indianresearchers.comAnnamacharya University –
The portal for 2025–26 shows that the list of accepted offline and online FDPs is released and open for participant applications. atalacademy.aicte.gov.in
11. Actionable Steps to Engage
To Propose/Host an ATAL FDP:
Select a timely and high-impact theme aligned with emerging technology or pedagogy. Scribd
Register as coordinator on the ATAL Academy portal and prepare the proposal per the scheme document (basic vs advanced or online). JIITmitfgc.in
Finalize resource persons, prepare detailed curriculum/brochure, and submit before the specified deadlines. Scribd
Upon approval, promote the programme, manage logistics, collect feedback, and submit final reports. Scribd
To Participate:
Monitor the ATAL Academy portal or specific host institute announcements for open registrations; register early (often first-come-first-served). smec.ac.in
12. Comparison (briefly vis-à-vis similar schemes)
Unlike GIAN which brings international experts for short-term credit-bearing courses with foreign faculty engagement, ATAL FDPs are capacity-building programmes primarily for Indian faculty/staff to upgrade skills in emerging areas through funded, often free, training. JIITEduindex News
Summary
ATAL Academy’s FDPs are structured, funded faculty upskilling programmes under AICTE aimed at strengthening technical education and research ecosystem in India. They include both offline (basic and advanced) and online formats, have concrete grant support, clear eligibility and proposal procedures, and are actively being rolled out in 2025 with diverse thematic offerings. JIITScribdatalacademy.aicte.gov.in
Influenced deeply by Mahatma Gandhi’s philosophy, he consciously chose a path of simplicity, service, and local resilience in architecture Hindustan Times.
Lived in north India’s Pithoragarh region from 1948 to 1963, working on health and housing projects, before establishing his base in Kerala (Trivandrum)Hindustan Times.
A firm believer in low-cost, sustainable architecture, Baker pioneered using local materials, passive ventilation, and minimal energy consumption well before “green architecture” became common discourse bennykuriakose+15Wikipedia+15STIRworld+15.
His guiding principles included:
Use on-site and local materials, preferably within a five-mile radius.
Design with a strong awareness of climate, topography, and natural lighting.
Residential and institutional work across Kerala and beyond, including:
Loyola Chapel & Auditorium (Trivandrum), Pallikoodam School (Kottayam), Mitraniketan (Vagamon), Salim Ali Centre, Indian Coffee House, Slum redevelopment units in Chengalchoola thehindu.com+2Wikipedia+2Wikipedia+2.
Developed affordable housing projects such as fishermen’s housing and rural schemes—even in the hilly regions of Pithoragarh—often under the aegis of COSTFORD (Centre of Science & Technology for Rural Development) with CM C. Achutha Menon and KN Raj in the mid-1980s indianexpress.com+2Aζ South Asia+2Wikipedia+2.
✨ Legacy & Recognition
Fondly called “Daddy” by workers and students, reflecting his involvement in every brick laid on site Wikipedia.
Awards include:
Padma Shri (1990), MBE (1983), UN Roll of Honour (1992), International architectural recognitions from IUA and the Netherlands Wikipedia+1Wikipedia+1.
The Laurie Baker Centre for Habitat Studies in Kerala continues to teach and disseminate his ideas on sustainable architecture and cost-effective housing Hindustan Times+7lauriebaker.net+7STIRworld+7.
🧠 Why Laurie Baker Still Matters
His architecture is rooted in social equity—beauty was not reserved for the affluent.
Pre‑emptive sustainability: rainwater harvesting, passive cooling, minimal resource use decades ahead of the global agenda.
A true vernacular modernist, combining low-tech local craft with thoughtful design to elevate ordinary materials.
Today, his buildings are seen as living museums, still teaching lessons on climate-responsive, humane architecture thehindu.comWikipedia.
Laurie Baker’s life teaches us that architecture need not be fossil-fuel-intensive or elitist. With empathy, craftsmanship, thrift, and respect for context, it can uplift communities, gracefully blend with environment, and stand the test of time.
National Housing Policy, National Urban Transport Policy (2006), National Habitat Standards set sectoral guidelines.
The Centre also facilitates data collection (Census, NSSO, NIUA, MoHUA reports).
d. Addressing Regional Imbalances
Central policies encourage growth centers, industrial corridors (e.g., DMIC, Chennai-Bengaluru Corridor), and SEZs to spread urbanization.
Promotes urban–rural linkages via Rurban Mission.
2. State-Level Policies
Urban development is primarily a State subject under the Indian Constitution (though the Centre has a supportive role). States are crucial in implementation and governance.
a. Urban Planning and Land Use
States prepare Master Plans, Regional Plans, Town Planning Schemes through Development Authorities and Municipal Corporations.
Land acquisition, zoning, building regulations → managed by state agencies.
b. Policy Formulation
Many states have their State Urban Policies/Housing Policies.
Urban planning, land use, implementation of schemes, empowering ULBs, local policies
State Housing Policies, Master Plans, Urban Dev. Authorities
✅ In summary:
National policies set the direction, funding, and reforms, ensuring that urbanization supports national goals like balanced development, economic growth, and sustainability.
State-level policies translate these into local planning, land use, governance, and service delivery, tailoring urban strategies to regional realities.
For successful urbanization, synergy between national vision, state execution, and ULB empowerment is essential.
Dame Zaha Hadid was an Iraqi-British architect, widely recognized as one of the most influential figures in contemporary architecture. Known as the “Queen of Curves,” she revolutionized architectural design with her futuristic, fluid, and dynamic forms that defied traditional conventions. In 2004, she became the first woman to receive the Pritzker Architecture Prize, the highest honor in architecture.
2. Early Life and Education
Birth: 31 October 1950, Baghdad, Iraq.
Family background: Born into an influential family; her father was an industrialist and politician, and her mother was an artist.
Education: Studied mathematics at the American University of Beirut before moving to London in 1972 to study architecture.
Architectural Association School of Architecture (AA), London: She trained under Rem Koolhaas and Elia Zenghelis, where she developed her unique style influenced by Russian Suprematism and avant-garde movements.
3. Career Beginnings
Founded her own firm Zaha Hadid Architects (ZHA) in 1979 in London.
Initially faced challenges, as her radical designs were considered too experimental and “unbuildable.”
Early works were mostly conceptual drawings and paintings, such as the Peak Leisure Club project in Hong Kong (1983), which gained international recognition but was never constructed.
4. Architectural Style
Zaha Hadid’s architecture is characterized by:
Fluidity: Buildings with flowing, organic curves inspired by natural landscapes.
Parametric design: Use of advanced computer modeling and digital tools.
Deconstructivism: Breaking away from traditional rigid forms, creating fragmented yet harmonious structures.
Light and movement: Dynamic spaces that seem to flow, often described as “frozen motion.”
Futuristic vision: Designs resembling spaceships, waves, and organic forms.
5. Major Works
a) Vitra Fire Station (Weil am Rhein, Germany, 1993)
Her first major built project.
Angular, sharp concrete forms resembling a frozen explosion.
b) MAXXI Museum of 21st Century Arts (Rome, Italy, 2009)
A fluid structure with sweeping curves and interconnected spaces.
Won the 2010 Stirling Prize.
c) London Aquatics Centre (2012, for the Olympic Games)
Wave-like roof inspired by the movement of water.
Considered one of her most iconic and widely admired projects.
d) Guangzhou Opera House (China, 2010)
Designed like two river-worn pebbles.
Combines technology and organic form seamlessly.
e) Heydar Aliyev Cultural Center (Baku, Azerbaijan, 2012)
One of her most celebrated works.
Fluid, flowing white structure with no straight lines, symbolizing a break from rigid Soviet architecture.
f) Other Notable Works
Sheikh Zayed Bridge (Abu Dhabi, 2010)
Dongdaemun Design Plaza (Seoul, 2014)
The Rosenthal Center for Contemporary Art (Cincinnati, USA, 2003)
Pritzker Architecture Prize (2004) – first woman recipient.
Stirling Prize (2010 & 2011) – for MAXXI Museum and Evelyn Grace Academy, London.
Dame Commander of the Order of the British Empire (DBE, 2012).
Royal Gold Medal (2016) – first woman to receive it in her own right.
Countless other international honors, cementing her status as one of the world’s greatest architects.
7. Legacy and Philosophy
Zaha Hadid challenged the male-dominated world of architecture and broke barriers for women.
Believed in “pushing the boundaries” of architecture using technology and imagination.
Her firm, Zaha Hadid Architects, continues to design groundbreaking projects after her death.
She has inspired a new generation of architects to think beyond geometry and rigidity.
8. Death
Zaha Hadid passed away on 31 March 2016 in Miami, Florida, due to a heart attack while being treated for bronchitis.
Her death was a huge loss to the architectural world, but her legacy endures through her works and her firm.
9. Conclusion
Zaha Hadid was not just an architect—she was a visionary artist, a pioneer of digital architecture, and a symbol of innovation and resilience. Her bold, unconventional, and futuristic designs reshaped skylines around the world and proved that architecture can be both functional and poetic. She remains an inspiration for architects, artists, and dreamers who dare to see beyond limitations.
The British rule led to the rise of Indian nationalism as people began to resist colonial rule. The British came to India, thousands of kilometers away, to exploit our human, natural, mineral, and other resources. Because of their misrule, the freedom movement started, and many people sacrificed their lives. On July 31, 1940, Udham Singh was hanged to death in London. Udham Singh (birth name Sher Singh; December 26, 1899–July 31, 1940) was an Indian revolutionary belonging to the Ghadar Party and the Hindustan Socialist Republican Association (HSRA), known for assassinating Michael O’Dwyer, the former Lieutenant Governor of the Punjab in India, on March 13, 1940. Udham Singh assassinated Michael O’Dwyer in revenge for the Jallianwala Bagh massacre in Amritsar in 1919, for which O’Dwyer was responsible and of which Singh himself was a witness. Sher Singh’s mother died when he was about three years old, and his father passed away a few years later. Orphaned at a young age, he and his elder brother were admitted to the Central Khalsa Orphanage in Amritsar in 1907. They were initiated into the Sikh religion at the orphanage, and Sher Singh was renamed Udham Singh. Singh was furious because of the Jallianwala Bagh massacre. On April 13, 1919, at least 10,000 people assembled at Jallianwala Bagh for a peaceful protest against the Rowlatt Acts, legislation passed by the British that year, which allowed certain political cases to be tried without juries and permitted the internment of the accused without trial. The British officer Reginald Dyer arrived at the protest site and ordered his troops to seal off the exit and open fire on the unarmed crowd, killing indiscriminately. Singh was serving water to the attendees at the time of the attack and watched it. This sparked in him a hatred for colonial rule. The Lieutenant Governor of Punjab at the time, Michael O’Dwyer, not only condoned Reginald Dyer’s actions but also justified them. Later on, Michael O’Dwyer went back to London. Singh came to London and decided on his action. He came to know that Michael O’Dwyer would be attending an event at Caxton Hall in Westminster on March 13, 1940, and chose this opportunity to assassinate him. Singh reached the hall with a loaded gun, and after O’Dwyer had given a speech, Singh shot him twice. O’Dwyer fell to the floor and succumbed to the gunshot wounds. Singh was subsequently tried and convicted of murder and hanged on July 31, 1940. While in custody, he used the name ‘Ram Mohammad Singh Azad,’ which represents the three major religions (Hinduism, Islam, and Sikhism, respectively) in united India. Singh’s actions evoked different reactions in India. Overall public sentiment was positive, with several Indian nationalists, including many Congress supporters, supporting his action and considering him a hero and a martyr. Revolutionary Netaji Subhas Chandra Bose approved of Singh’s actions. But Mahatma Gandhi and Jawaharlal Nehru denounced the assassination. The patriotic feelings of Singh can be understood because before the judge had passed the sentence, Singh said, “I am not afraid to die. I am proud to die.… I have great sympathy with the workers of England, but I am against the dirty British government.” Like all Indians, we respect this great hero and martyr. (Sources of this article are, a) britannica.com/biography/Udham-Singh and b)wikipedia.org/wiki/Udham_Singh)
Fertility refers to the actual reproductive performance of an individual, couple, group, or population. It is a demographic concept that quantifies the frequency of childbirth in a population over time.
II. Fertility Trends
Definition:
Fertility trends refer to changes in fertility rates over time, influenced by social, economic, biological, and political factors.
Global Patterns:
Declining fertility in developed nations due to urbanization, higher education levels, career focus, and contraceptive access.
Higher fertility in developing regions due to early marriage, lower education, cultural norms, and limited family planning.
III. Fertility and Social Behavior
Social factors affecting fertility:
Marriage patterns: Early and universal marriage often results in higher fertility.
Education level: Higher female education is associated with lower fertility.
Employment: Working women tend to delay childbirth or have fewer children.
Cultural norms: Beliefs about ideal family size, gender roles, and childbearing influence fertility.
Religion: Some religious doctrines encourage higher fertility.
IV. Fertility and Biological Behavior
Biological factors influencing fertility:
Age of woman: Fertility peaks in the 20s and declines after 35.
Health and nutrition: Poor health reduces fertility.
Infertility: Biological infertility (in either partner) limits reproductive outcomes.
Menstrual and ovulation cycles: Timing affects conception probability.
Postpartum amenorrhea and lactation: These naturally suppress ovulation and reduce birth intervals.
V. Differential Fertility
Differential fertility refers to variations in fertility across different subgroups of the population. These differences can be due to:
1. Ethnic Groups:
Cultural values and traditions around family size vary.
E.g., In multi-ethnic countries, one ethnic group may exhibit higher fertility rates than others.
2. Socio-Economic Groups:
Lower-income groups may have higher fertility due to less contraceptive use and higher child mortality.
Wealthier, urban, and more educated groups tend to have fewer children.
3. Mobility and Migration:
Migrants may initially retain high fertility but adopt host-country norms over time.
Mobile populations may have reduced access to reproductive healthcare.
4. Location (Urban vs Rural):
Urban residents usually have fewer children due to better education, healthcare, and employment opportunities.
Rural areas may show higher fertility due to agricultural labor needs and lower access to contraception.
VI. Measures of Fertility
Fertility is quantified using several statistical indicators. Below are the main fertility measures with formulas and explanations:
1. Crude Birth Rate (CBR)
Definition:
Total number of live births per 1,000 people in a given year.
Formula:
Example:
If there are 20,000 live births in a population of 1,000,000: CBR=?
Limitations:
Not age-specific.
Includes total population, even those not of reproductive age.
2. Age-Specific Fertility Rate (ASFR)
Definition:
Number of births per 1,000 women in a specific age group (usually 5-year intervals).
Formula:
Example:
If women aged 25–29 have 3,000 births and their population is 100,000: ASFR25−29=?
3. Total Fertility Rate (TFR)
Definition:
Average number of children a woman would have during her reproductive years (typically ages 15–49), based on current ASFRs.
Formula:
The sum is over all reproductive age groups.
Length of age interval is usually 5 years.
Example:
If the ASFRs add up to 600 across all age groups: TFR=600×51,000=3.0 children per womanTFR =?
Interpretation:
TFR of 2.1 is considered the replacement-level fertility (in developed countries).
TFR > 2.1 = population growth; TFR < 2.1 = population decline (without migration).
4. Net Reproduction Rate (NRR)
Definition:
Average number of daughters a woman would have in her lifetime if she were subject to current age-specific fertility and mortality rates.
Formula:
NRR focuses on female children, since only they can reproduce.
Interpretation:
NRR = 1 → each woman is replaced by one daughter → stable population.
NRR > 1 → population grows.
NRR < 1 → population declines (without migration).
VII. Summary Table of Fertility Measures
Measure
Formula
Unit
Use
Crude Birth Rate (CBR)
Per 1,000 population
General fertility indicator
Age-Specific Fertility Rate (ASFR)
Per 1,000 women (age group)
Detailed analysis of fertility across age groups
Total Fertility Rate (TFR)
Children per woman
Best measure of fertility potential
Net Reproduction Rate (NRR)
Daughters per woman
Population replacement measure accounting for mortality
VIII. Conclusion
Fertility is influenced by complex social, economic, cultural, and biological factors. Understanding fertility measures like CBR, ASFR, TFR, and NRR is essential for population policy, healthcare planning, and socio-economic development. Differential fertility across ethnic, regional, and economic lines highlights the need for targeted interventions.
References
De Bruijn, B. J., & De Bruijn, B. J. (2006). Fertility: theories, frameworks, models, concepts (pp. 549-569). na.
Kumar, G., Vyas, S., Sharma, S. N., & Dehalwar, K. (2025). Urban growth prediction using CA-ANN model and spatial analysis for planning policy in Indore city, India. GeoJournal, 90(3), 139.
McNicoll, G. (1980). Institutional determinants of fertility change. Population and development review, 441-462.
Morgan, S. P., & Hagewen, K. J. (2005). Fertility. In Handbook of population (pp. 229-249). Boston, MA: Springer US.
Whelpton, P. K., & Kiser, C. V. (1945). Trends, determinants, and control in human fertility. The Annals of the American Academy of Political and Social Science, 237(1), 112-122.
detailed explanation of key measures of mortality, including definitions, formulas, and interpretations for:
Crude death rate
Age-specific death rate
Infant mortality rate
Neonatal mortality rate
Adjusted/standardized death rate
1. Crude Death Rate (CDR)
Definition:
The crude death rate is the total number of deaths in a population over a given period (usually a year) per 1,000 individuals.
Formula:
Example:
If a country has 50,000 deaths in a year and a mid-year population of 5,000,000: CDR=?
Limitations:
Doesn’t account for age structure of the population.
Can be misleading when comparing countries with different age demographics.
2. Age-Specific Death Rate (ASDR)
Definition:
ASDR measures the death rate within a specific age group per 1,000 people in that group.
Formula:
Example:
If there are 500 deaths among people aged 65–74 and that group’s population is 50,000: ASDR=?
Use:
Helps identify high-risk age groups.
More accurate than crude death rate for health planning and analysis.
3. Infant Mortality Rate (IMR)
Definition:
IMR refers to the number of deaths of infants under 1 year of age per 1,000 live births in a given year.
Formula:
Example:
If 1,200 infants die in a year and there were 100,000 live births: IMR=?
Importance:
Reflects health care quality, nutrition, and maternal health.
A key indicator of social and economic development.
4. Neonatal Mortality Rate (NMR)
Definition:
The NMR refers to the number of deaths of infants within the first 28 days of life per 1,000 live births.
Formula:
Example:
If there are 600 deaths within 28 days among 100,000 live births: NMR=?
Use:
Assesses quality of prenatal and immediate postnatal care.
5. Adjusted or Standardized Death Rate (SDR)
Definition:
Standardized death rate adjusts the crude death rate to eliminate the effects of differences in age distribution. It allows comparison between populations with different age structures.
Why Standardize?
Populations with more elderly people will naturally have higher crude death rates, even if the healthcare system is good. Standardization accounts for this.
Methods of Standardization:
Two common methods:
Direct standardization
Indirect standardization
A. Direct Standardization
Formula:
Steps:
Multiply each age-specific death rate by the standard population for that age group.
Sum all the products.
Divide by the total standard population.
Use:
For comparing mortality between countries or over time using a common standard.
B. Indirect Standardization (Often used when age-specific rates are not available)
Steps:
Use standard population’s age-specific death rates.
Apply them to your study population to find expected deaths.
Compare observed vs. expected deaths.
Standardized Mortality Ratio (SMR):
SMR = 100: mortality is equal to standard.
SMR > 100: higher mortality than standard.
SMR < 100: lower mortality than standard.
Summary Table:
Measure
Formula
Denominator
Use/Significance
Crude Death Rate (CDR)
Entire population
General mortality level
Age-Specific Death Rate
Age group population
Risk in specific age groups
Infant Mortality Rate (IMR)
Live births
Maternal/child health indicator
Neonatal Mortality Rate
Live births
Immediate newborn care indicator
Standardized Death Rate
Standard population
Removes age structure bias in comparisons
References
Kumar, G., Vyas, S., Sharma, S. N., & Dehalwar, K. (2024). Challenges of environmental health in waste management for peri-urban areas. In Solid Waste Management: advances and trends to tackle the SDGs (pp. 149-168). Cham: Springer Nature Switzerland.
Morris, R. F. (1957). The Interpretation of Mortality Data in Studies on Population Dynamics1. The Canadian Entomologist, 89(2), 49-69.
Ogbanga, M. M., & Sharma, S. N. (2024). Climate Change and Mental Heat. EduPub
Siegel, J. S. (2011). Concepts and basic measures of mortality. In The Demography and Epidemiology of Human Health and Aging (pp. 73-134). Dordrecht: Springer Netherlands.
Sheil, D., Burslem, D. F., & Alder, D. (1995). The interpretation and misinterpretation of mortality rate measures. Journal of Ecology, 331-333.
Stocks, P. (1944). The measurement of morbidity.
Sharma, S. N., Dehalwar, K., Yadav, K., & Verma, D. (2025). Urban Street Canyon Turbulence and Vehicular Pollution Dispersion.
Zeighami, E. A., & Morris, M. D. (1983). The measurement and interpretation of proportionate mortality. American Journal of Epidemiology, 117(1), 90-97.
Demographic variables refer to the statistical characteristics of human populations used primarily in research, marketing, policy-making, and social sciences to identify and understand different segments within a population. These variables help describe, analyze, and predict behavior patterns, preferences, and trends among groups of people. They are essential in both qualitative and quantitative research because they allow for the classification and segmentation of target audiences.
Below is a detailed breakdown of the major demographic variables:
Age is one of the most fundamental demographic variables. It categorizes individuals based on their age group (e.g., children, teenagers, adults, seniors). It influences:
Consumer behavior (e.g., preferences for technology, fashion, food)
Health and medical needs
Educational interests
Social and economic priorities
Age groups commonly used:
0–14 years (children)
15–24 years (youth)
25–54 years (working-age adults)
55–64 years (pre-retirement)
65+ years (elderly)
2. Gender (or Sex)
Gender refers to whether someone identifies as male, female, or non-binary/other. Traditionally, this variable was limited to biological sex (male/female), but contemporary research often includes gender identity for inclusivity and accuracy.
Influences:
Employment patterns
Purchasing decisions
Healthcare needs
Social roles and expectations
3. Income
Income refers to the monetary earnings of an individual or household. It is usually measured annually and is a key variable in economic research, marketing, and social studies.
Categories often used:
Low income
Middle income
High income
Impacts:
Spending habits
Access to education and healthcare
Living standards
Investment and savings behavior
4. Education Level
This variable indicates the highest level of education an individual has attained. It is a strong predictor of job prospects, income, and lifestyle.
Typical categories:
No formal education
Primary education
Secondary education
Higher education (college/university)
Postgraduate education
Influences:
Employment opportunities
Political participation
Health awareness
Media consumption
5. Occupation
Occupation refers to the kind of job or profession an individual is engaged in. This helps categorize people based on skill levels, industry sectors, and work environments.
Categories:
White-collar (e.g., managers, professionals)
Blue-collar (e.g., factory workers, technicians)
Service industry (e.g., waitstaff, customer service)
Unemployed
Retired
6. Marital Status
Marital status describes a person’s legal relationship status. It plays a crucial role in shaping family structure, financial responsibilities, and lifestyle choices.
Common categories:
Single
Married
Divorced
Widowed
Separated
Cohabiting (not legally married but living together)
7. Religion
Religion refers to the spiritual beliefs and practices followed by individuals or groups. It can influence values, behaviors, dietary choices, holidays observed, and attitudes toward social issues.
Examples:
Christianity
Islam
Hinduism
Buddhism
Judaism
Non-religious/Atheist
8. Ethnicity or Race
This variable categorizes people based on shared cultural, national, or racial characteristics. It’s often used in studies of health disparities, education access, political representation, and cultural practices.
Examples:
Caucasian
African descent
Asian
Hispanic/Latino
Indigenous
Mixed race
9. Geographic Location
This refers to the physical location where an individual resides, including country, region, state, city, or even neighborhood.
Impact areas:
Climate preferences
Political views
Cultural norms
Language
Access to resources and services
10. Family Size and Structure
This variable accounts for the number of individuals in a household and their relationships to each other.
Includes:
Nuclear family (parents and children)
Extended family (includes relatives)
Single-parent family
Childless couples
Applications:
Housing needs
Consumption patterns
Healthcare planning
Educational services
11. Language
Language spoken at home or as a first language is another important demographic factor, especially in multicultural or multilingual societies. It impacts communication strategies in marketing and public services.
Applications of Demographic Variables
Demographic variables are used in a variety of domains:
Marketing: To segment customers and tailor advertising.
Public Policy: For resource allocation, program planning, and social welfare.
Healthcare: To understand needs and disparities.
Education: To plan curriculum, school locations, and funding.
Political Science: For voter profiling and electoral strategy.
Conclusion
Demographic variables provide a structured way to understand human populations. By categorizing people based on measurable traits, researchers, policymakers, and businesses can identify patterns, predict behaviors, and create targeted strategies. While these variables are powerful, they are often used alongside psychographic, behavioral, and geographic variables for deeper insights.
References
Dehalwar, K., & Sharma, S. N. (2023). Fundamentals of research writing and uses of research methodologies. Edupedia Publications Pvt Ltd.
Goldberg, L. R., Sweeney, D., Merenda, P. F., & Hughes Jr, J. E. (1998). Demographic variables and personality: The effects of gender, age, education, and ethnic/racial status on self-descriptions of personality attributes. Personality and Individual differences, 24(3), 393-403.
Gutiérrez, J. L. G., Jiménez, B. M., Hernández, E. G., & Pcn, C. (2005). Personality and subjective well-being: Big five correlates and demographic variables. Personality and individual differences, 38(7), 1561-1569.
Lam, D. (1997). Demographic variables and income inequality. Handbook of population and family economics, 1, 1015-1059.
Pollak, R. A., & Wales, T. J. (1981). Demographic variables in demand analysis. Econometrica: Journal of the Econometric Society, 1533-1551.
Sharma, S. N., & Dehalwar, K. (2025). Assessing the Transit-Oriented Development and Travel Behavior of the Residents in Developing Countries: A Case of Delhi, India. Journal of Urban Planning and Development, 151(3), 05025018.
The study of population, or demography, is the scientific investigation of human populations, focusing on their size, structure, distribution, and changes over time. It analyzes how and why populations grow or decline, how people move, and how demographic trends affect society. This field provides critical information for planning and policy-making in areas like health, education, housing, labor markets, and environmental sustainability.
A population refers to a group of individuals living in a specific geographic area who share certain social or biological characteristics. For example, the population of a city includes all its residents regardless of age or background. The study of such populations allows researchers to track trends in health, education, income, and mobility.
2. Importance of Population Studies
Population studies are vital for making informed decisions in governance and development. By understanding population trends, governments can anticipate future needs, such as how many schools or hospitals will be required, how to manage food supply, and how to prepare for aging populations or urban expansion. It also helps global agencies monitor human development and inequality.
3. Key Components of Population Study
a) Population Size
Population size refers to the total number of individuals living in a specific area at a given time. Knowing this helps planners assess demand for services like healthcare, education, and infrastructure. It also allows comparisons between countries or regions.
b) Population Density
Population density measures how many people live per unit area (e.g., per square kilometer). High density may indicate urban crowding, while low density often suggests rural or underdeveloped areas. Understanding density helps in planning transportation, housing, and utilities.
c) Population Distribution
This term describes how people are spread across a region or the world. Population distribution is influenced by natural features (like rivers and mountains), economic factors (such as job availability), and political stability. Uneven distribution can lead to overuse of resources in some areas and underdevelopment in others.
d) Population Structure
Population structure refers to the composition of a population, usually broken down by age and sex. It is often visualized using population pyramids. Understanding this helps forecast future needs — for example, a young population will need more schools, while an aging population will require more healthcare services.
e) Population Growth
Population growth indicates the rate at which the number of individuals in a population is increasing. It is influenced by birth rates, death rates, and migration. Rapid population growth can strain resources, while population decline can affect the workforce and economy.
4. Demographic Processes
a) Fertility
Fertility refers to the actual number of children born to women in a population. It is measured using indicators like the Crude Birth Rate or Total Fertility Rate. Fertility is influenced by culture, education, access to contraception, and government policies.
b) Mortality
Mortality is the frequency of deaths in a population over a specific period. Important measures include the Crude Death Rate and Infant Mortality Rate. Mortality rates help assess the overall health conditions and the effectiveness of medical services in a society.
c) Migration
Migration is the movement of people from one place to another, either within a country (internal migration) or between countries (international migration). It affects population size, cultural composition, and the labor force, and can be driven by economic, social, or environmental factors.
5. Population Theories
a) Malthusian Theory
This theory, proposed by Thomas Malthus, suggests that population growth tends to outpace food production, leading to shortages, famine, and conflict. Although criticized, the theory sparked debate on sustainable development and resource management.
b) Demographic Transition Theory
This theory explains how societies transition from high birth and death rates to low ones as they develop economically. It outlines four or five stages of demographic change, and helps in predicting population trends in developing versus developed nations.
c) Marxist Theory
The Marxist perspective views population issues as consequences of unequal resource distribution rather than natural laws. It argues that poverty and overpopulation stem from capitalism and advocates for social reforms to ensure equitable access to resources.
6. Population Data Sources
Population studies rely on data collected through censuses, surveys, and administrative records. Censuses offer a complete population snapshot, while surveys and records provide detailed information on births, deaths, migration, education, and employment. Accurate data is essential for effective planning and analysis.
7. Challenges in Population Studies
Demographic research faces various challenges, including outdated or inaccurate data, especially in less developed regions. Tracking migration and undocumented populations can be complex. Additionally, ethical issues arise when collecting sensitive information from vulnerable groups, such as minorities or refugees.
8. Applications of Population Studies
Demographic insights are used to design public policies, predict workforce needs, control disease outbreaks, plan cities, and manage natural resources. Whether it’s allocating healthcare funding or responding to a refugee crisis, population studies play a critical role in both immediate decision-making and long-term planning.
Conclusion
The study of population is essential for understanding how societies function and change. It equips governments, researchers, and international organizations with the tools to address pressing challenges such as urbanization, aging, poverty, and environmental degradation. By analyzing population trends and dynamics, we can build more equitable and sustainable futures.
References
Dehalwar, K., & Sharma, S. N. (2023). Fundamentals of research writing and uses of research methodologies. Edupedia Publications Pvt Ltd.
Emerson, E., Kiernan, C., Alborz, A., Reeves, D., Mason, H., Swarbrick, R., … & Hatton, C. (2001). The prevalence of challenging behaviors: A total population study. Research in developmental disabilities, 22(1), 77-93.
Hull, M. G., Glazener, C. M., Kelly, N. J., Conway, D. I., Foster, P. A., Hinton, R. A., … & Desai, K. M. (1985). Population study of causes, treatment, and outcome of infertility. Br Med J (Clin Res Ed), 291(6510), 1693-1697.
Szklo, M. (1998). Population-based cohort studies. Epidemiologic reviews, 20(1), 81-90.
Sharma, S. N., & Dehalwar, K. (2025). Assessing the Transit-Oriented Development and Travel Behavior of the Residents in Developing Countries: A Case of Delhi, India. Journal of Urban Planning and Development, 151(3), 05025018.
Sharma, S. N. (2024). Role of Demography & Rahul Gandhi in Karnataka State Election Results. Track2Training
Mortality, defined as the incidence of death within a population, is a critical indicator of public health and social well-being. Over time, mortality trends have shown a general decline globally, particularly due to advancements in medicine, sanitation, nutrition, and public health infrastructure. However, disparities persist due to a combination of biological and social determinants.
1. Biological Factors Affecting Mortality
Biological factors refer to innate or genetically influenced aspects that contribute to mortality. These include:
Genetics: Inherited conditions like sickle cell anemia, cystic fibrosis, or certain cancers influence life expectancy. Genetic predisposition can also affect how one responds to diseases or environmental hazards.
Age: Mortality rates vary significantly by age group. Infants and the elderly often have higher mortality rates due to weaker immune systems and greater vulnerability to diseases.
Sex/Gender (Biological Aspect): Biologically, women tend to live longer than men globally. This is attributed to hormonal differences (e.g., estrogen may offer some protection against heart diseases), genetic factors (e.g., two X chromosomes), and risk behavior tendencies often higher in males.
Health Conditions: Chronic conditions like hypertension, diabetes, and obesity increase the risk of premature death. Infectious diseases also remain leading causes of death in many developing countries.
2. Social Factors Influencing Mortality
Social determinants of health play a powerful role in shaping mortality patterns across populations. These include:
A. Gender and Mortality
Women typically live longer than men, but may experience more non-fatal chronic conditions. Men’s higher mortality is linked to occupational hazards, higher rates of risky behaviors (e.g., smoking, alcohol use), and lower rates of healthcare utilization.
Maternal mortality is a significant concern in many low-income countries, where inadequate healthcare access during pregnancy and childbirth remains a major issue.
Gender-based violence, discrimination, and access to education and healthcare also skew mortality rates differently for men and women in various regions.
B. Race and Ethnicity
Racial disparities in mortality are evident in many countries. For example, in the United States, Black Americans have higher mortality rates than White Americans, particularly from preventable or manageable conditions such as heart disease, cancer, and homicide.
Causes include systemic racism, historical disadvantages, economic inequality, and reduced access to quality healthcare, nutritious food, and safe living environments.
Indigenous populations across the world (e.g., Native Americans, Aboriginal Australians) often suffer higher mortality due to poverty, marginalization, and reduced access to health services.
C. Social Structure and Class
Socioeconomic status (SES) is one of the most powerful predictors of mortality. Individuals from lower-income groups face higher mortality rates due to factors like poor housing, underemployment, lack of insurance, and environmental hazards.
Education: Those with higher educational attainment often have lower mortality due to better health literacy, more stable employment, and healthier lifestyles.
Inequality in wealth distribution is associated with poorer overall public health outcomes, even in economically advanced societies.
D. Lifestyle and Behavioral Factors
Diet, physical activity, and substance use directly influence mortality. Tobacco use alone is responsible for over 8 million deaths annually worldwide. Poor diet and sedentary behavior contribute to obesity and cardiovascular disease.
Mental health: Depression, anxiety, and other disorders, if unaddressed, can lead to higher suicide rates and risky behaviors increasing mortality risk.
Health-seeking behavior: Individuals who delay or avoid medical help due to cultural, psychological, or economic reasons are at greater risk of preventable mortality.
E. Occupational Hazards
Manual labor and high-risk jobs, often held by lower-income or less educated individuals, are associated with higher mortality. Examples include construction, mining, fishing, and factory work.
Workplace stress, long working hours, exposure to hazardous materials, and lack of health insurance all exacerbate mortality risks.
The COVID-19 pandemic also highlighted occupational disparities—essential workers (often from minority and lower-income backgrounds) faced greater exposure and mortality risk.
F. Social Status and Marginalization
Social capital—the strength of social networks and community ties—can impact health outcomes. Isolation and lack of support are linked to higher mortality, especially among the elderly.
Discrimination and stigma—based on gender identity, sexual orientation, caste, religion, or immigration status—can lead to chronic stress and reduced access to healthcare, ultimately increasing mortality.
Conclusion: Intersecting Factors and Policy Implications
Mortality is not merely a biological inevitability but is deeply shaped by intersecting social, economic, and environmental conditions. Understanding mortality trends through a multifactorial lens helps:
Governments prioritize investments in public health, sanitation, and education.
Healthcare systems target interventions toward vulnerable groups.
Researchers design equitable health policies and interventions.
Communities advocate for structural reforms to reduce health disparities.
Reducing mortality disparities requires a holistic approach—one that integrates biomedical interventions with social justice, economic reform, and inclusive policy frameworks.
Thomas Robert Malthus (1766–1834) was an English cleric, scholar, and economist known for his influential theories on population dynamics. His work “An Essay on the Principle of Population” (1798) laid the foundation for demographic studies and influenced generations of economists, policymakers, and scientists. Malthus proposed that population growth, if left unchecked, would inevitably outstrip food production, leading to famine, disease, and societal collapse. This essay explores Malthus’s principles of population, the stages of population growth, and examines them with suitable justifications and examples from history and contemporary society.
Malthusian Principles of Population
Malthus’s population theory revolves around two key principles:
Population Grows Geometrically (Exponential Growth) According to Malthus, human populations tend to grow in a geometric progression (i.e., 1, 2, 4, 8, 16…), doubling every 25 years if unchecked. This rapid growth, he argued, is driven by humans’ natural reproductive tendencies.
Food Supply Grows Arithmetically (Linear Growth) In contrast, Malthus believed that agricultural production increases only in an arithmetic progression (i.e., 1, 2, 3, 4, 5…), limited by land availability, soil fertility, and technological constraints. Therefore, food production cannot keep up with population growth over time.
From this imbalance, he concluded that population growth would eventually surpass the means of subsistence unless checked by “positive” and “preventive” checks.
Malthusian Checks on Population
Malthus identified two types of checks to control population growth:
Preventive Checks – These are voluntary measures to limit reproduction, including:
Moral restraint (delaying marriage, celibacy)
Birth control (although not explicitly supported by Malthus)
Societal norms limiting family size
Positive Checks – These are natural consequences that increase the death rate:
Famine
Disease (e.g., plague, cholera)
War
Natural disasters
These checks are nature’s way of restoring the balance between population and resources when preventive measures fail.
Criticism and Relevance of Malthusian Theory
Although revolutionary, Malthus’s theory was criticized for being too pessimistic and for underestimating human innovation. Critics, particularly during and after the Industrial Revolution, pointed out that technological advancements in agriculture (e.g., mechanization, fertilizers, GMOs) have allowed food production to keep pace with or even exceed population growth.
Yet, Malthus’s ideas remain relevant in specific contexts:
In Sub-Saharan Africa, many countries still face challenges like food insecurity and high fertility rates.
The Rwanda genocide (1994) is often cited as a tragic example where high population density, land scarcity, and poverty contributed to conflict.
The concept of “carrying capacity” in environmental science, often linked to Malthusian ideas, is used to evaluate the sustainable limits of ecosystems.
Stages of Population Growth: The Demographic Transition Model (DTM)
Although Malthus did not describe population change in stages, modern demography interprets his insights within the Demographic Transition Model (DTM). The DTM outlines five stages of population growth, reflecting changes in birth and death rates over time.
Stage 1: High Stationary Stage
High birth rate and high death rate result in slow population growth.
Pre-industrial societies with poor healthcare, sanitation, and food security.
Example: Medieval Europe, tribal communities in pre-modern Africa or South America.
Justification: High mortality from diseases, famines, and wars limits population expansion.
Stage 2: Early Expanding Stage
High birth rate remains, but death rate declines due to improvements in health, hygiene, and food availability.
Leads to population explosion.
Example: Many African countries today (e.g., Niger, Democratic Republic of Congo).
Justification: Access to vaccinations, clean water, and better nutrition reduces infant mortality, but cultural norms still favor large families.
Stage 3: Late Expanding Stage
Birth rates begin to fall, while death rates continue to decline, slowing population growth.
Transition toward urbanization and industrialization.
Example: India, Egypt, and parts of Southeast Asia.
Justification: Increased education, especially for women, access to contraception, and changes in societal values lead to smaller families.
Stage 4: Low Stationary Stage
Low birth and death rates stabilize the population.
Seen in highly industrialized nations.
Example: United States, United Kingdom, Australia.
Justification: Better living standards, high cost of child-rearing, and career prioritization lead to low fertility rates.
Stage 5: Declining Stage (Optional/Controversial)
Birth rate falls below death rate, leading to population decline.
Aging populations and shrinking workforce become major concerns.
Example: Japan, Germany, South Korea.
Justification: High levels of urbanization, economic pressures, and lifestyle preferences result in fewer children.
Contemporary Relevance and Neo-Malthusianism
While classical Malthusian predictions did not fully materialize, the Neo-Malthusian school emerged in the 20th century, stressing concerns about overpopulation and environmental degradation. The Club of Rome’s “Limits to Growth” (1972) echoed Malthusian themes, warning about finite resources and ecological collapse.
Today, global challenges such as:
Climate change
Water scarcity
Urban overcrowding
Food insecurity in conflict zones
…have revived interest in Malthusian thinking, especially in policymaking, urban planning, and sustainability discourse.
Conclusion
Thomas Malthus’s population theory, though developed over two centuries ago, continues to influence how we understand demographic dynamics and resource management. His core idea—that unchecked population growth has limits—remains a foundational concern in today’s globalized world. While technological advancement has postponed the crises Malthus envisioned, uneven development and ecological limits reinforce the importance of balancing population growth with sustainable resource use. The Demographic Transition Model helps contextualize his theory across different stages of development, reminding us that demographic change is not only inevitable but also manageable through informed policy, education, and innovation.
References
Malthus, T. R. (1798). An Essay on the Principle of Population.
UN Department of Economic and Social Affairs, Population Division (2024).
World Bank. (2023). Fertility Rate and Demographic Indicators.
Dehalwar, K., & Sharma, S. N. (2023). Fundamentals of research writing and uses of research methodologies. Edupedia Publications Pvt Ltd.
Dehalwar, K., & Sharma, S. N. (2024). Social Injustice Inflicted by Spatial Changes in Vernacular Settings: An Analysis of Published Literature.
Dehalwar, K. (2015). Basics of environment sustainability and environmental impact assessment. Edupedia Publications Pvt Ltd.
Dehalwar, K., & Sharma, S. N. (2023). Fundamentals of Area Appreciation and Space Perceptions.
Sharma, S. N., & Dehalwar, K. (2023). Fundamentals of Planning and Design of Housing.


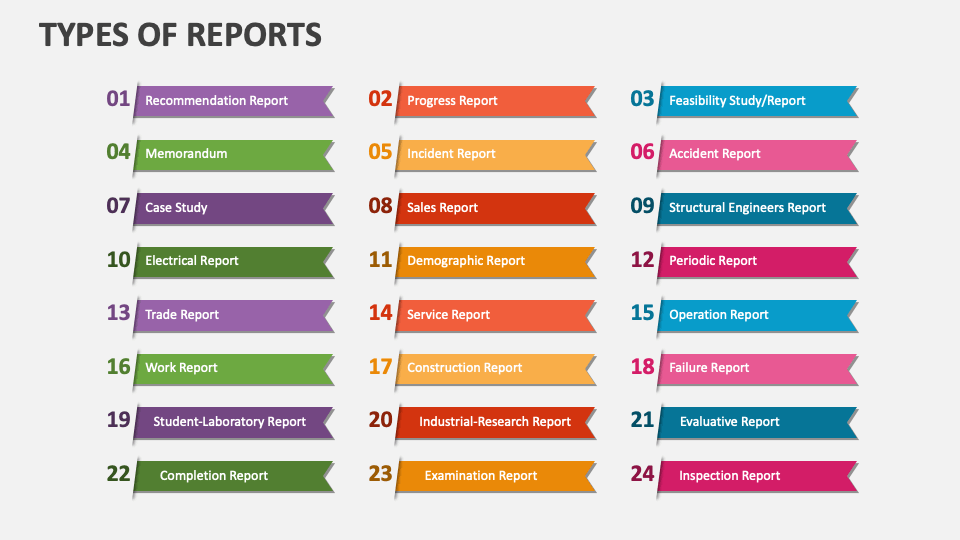


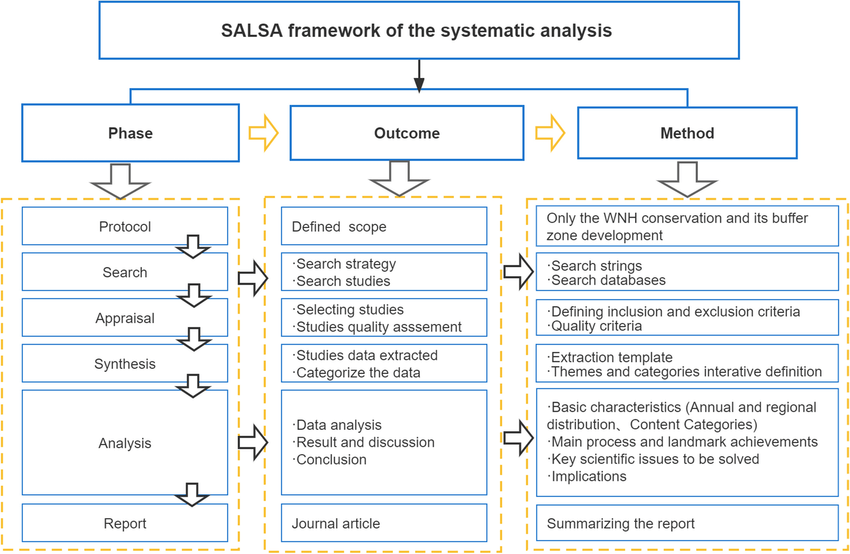


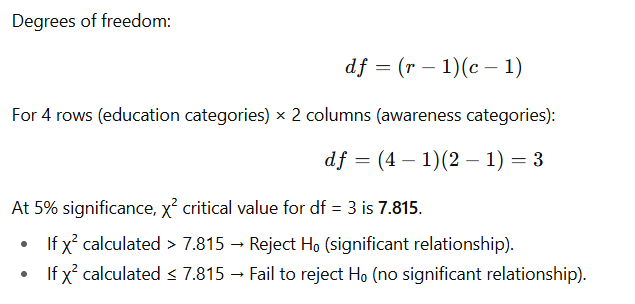
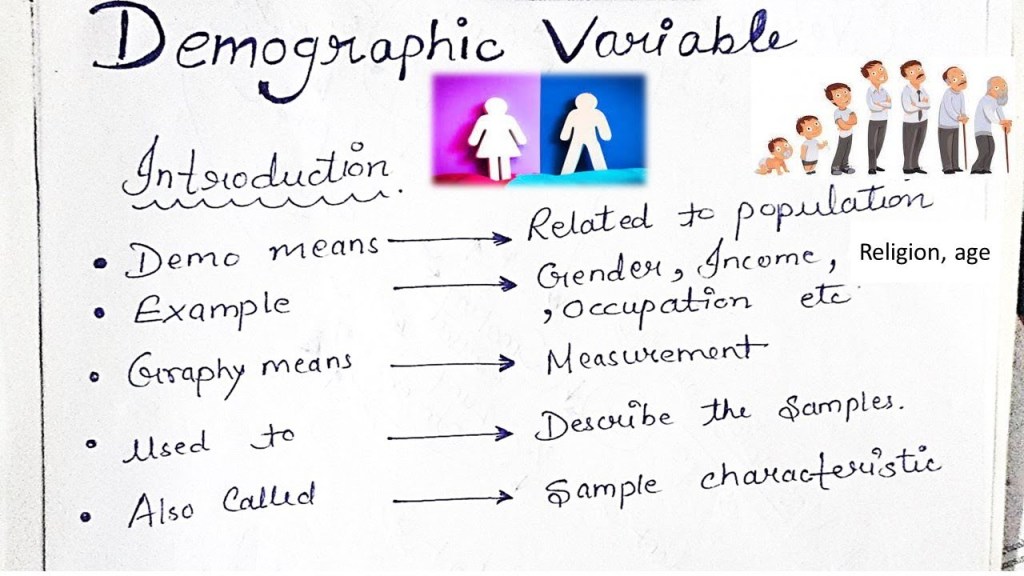


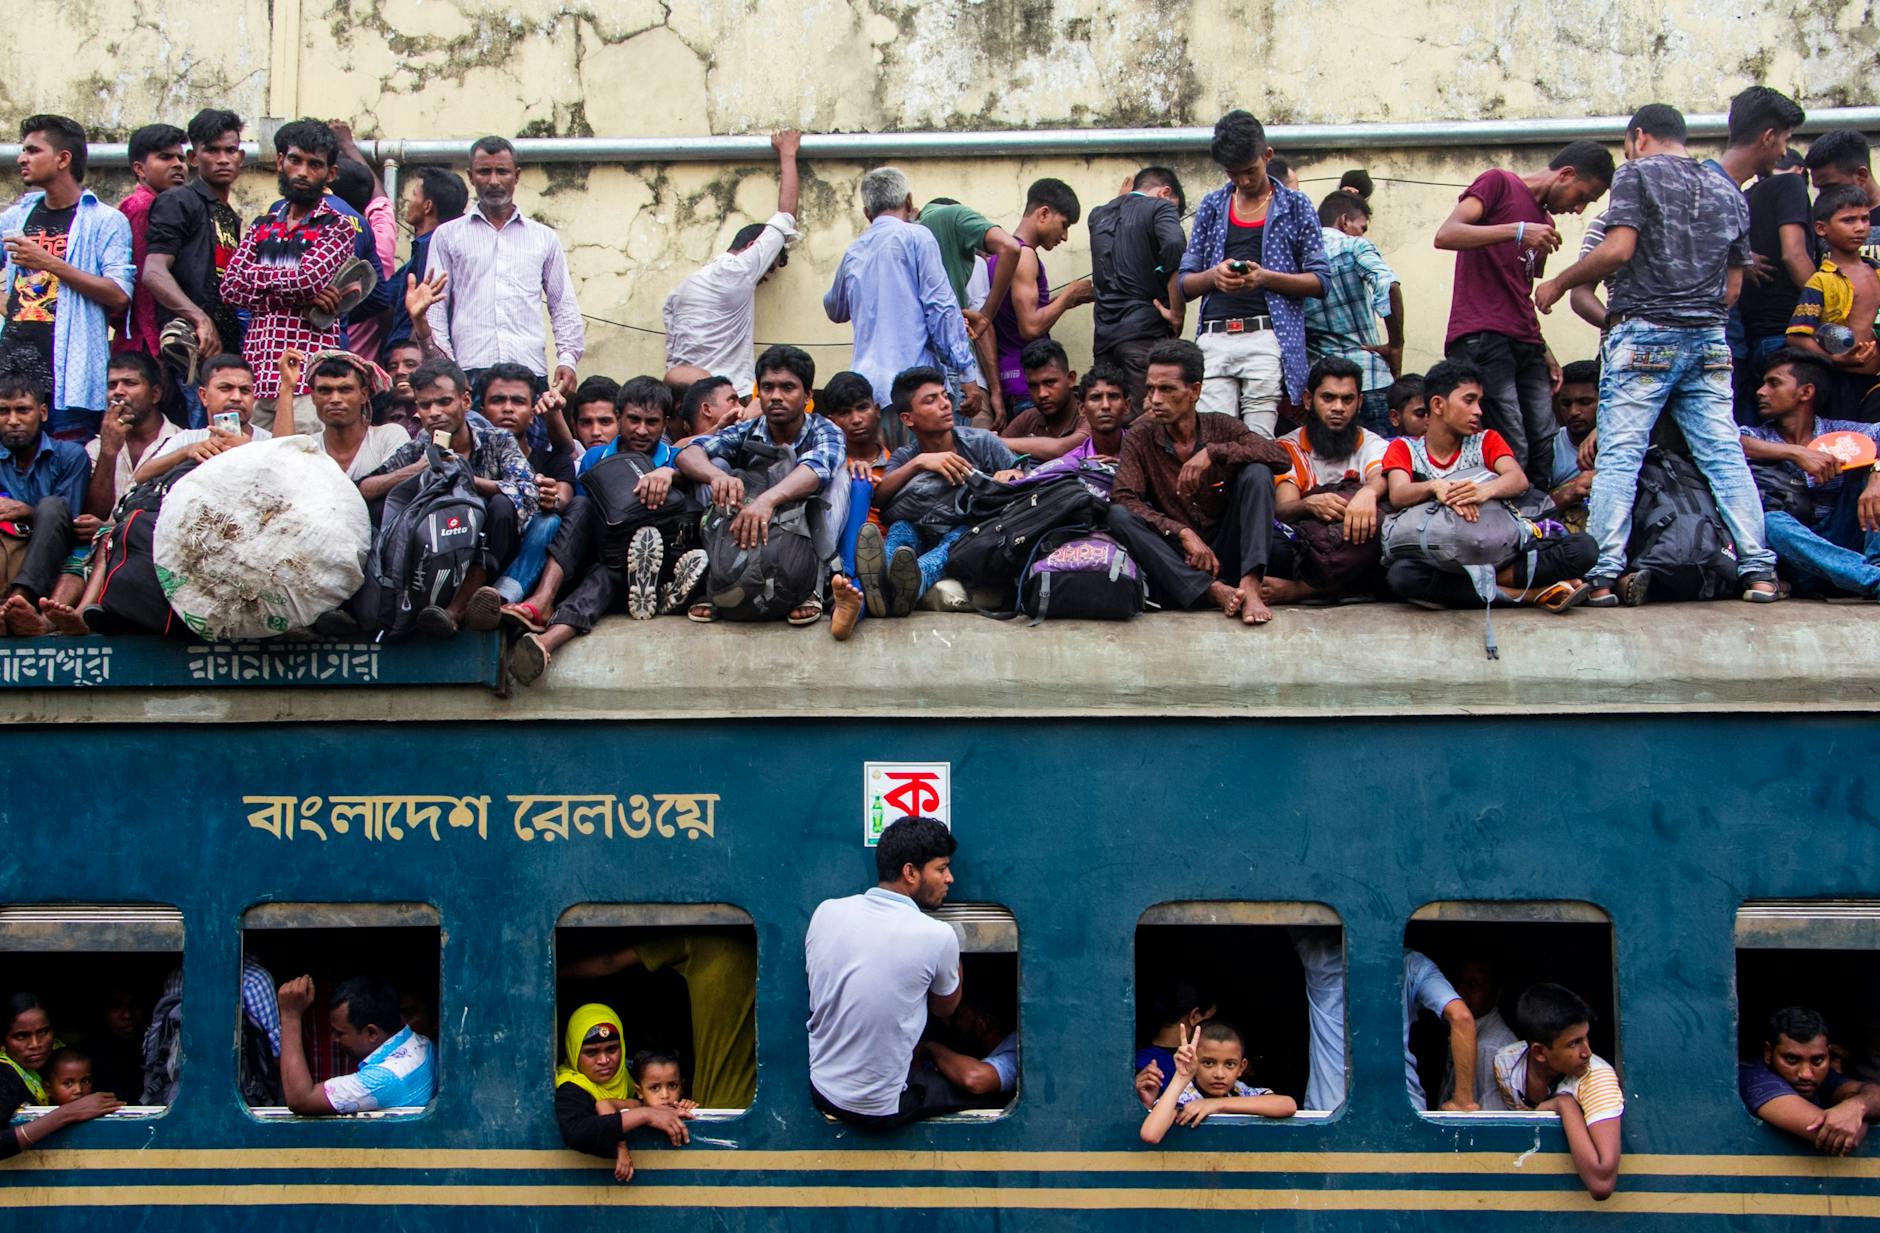


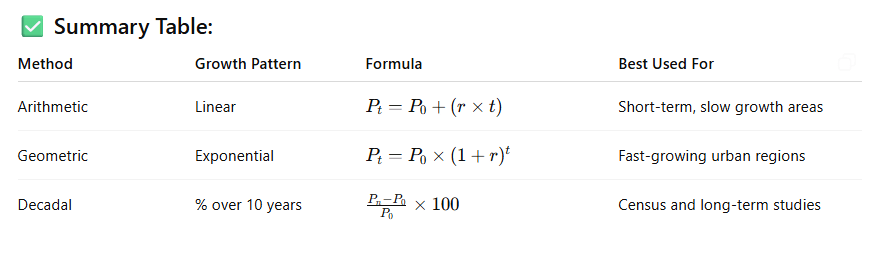


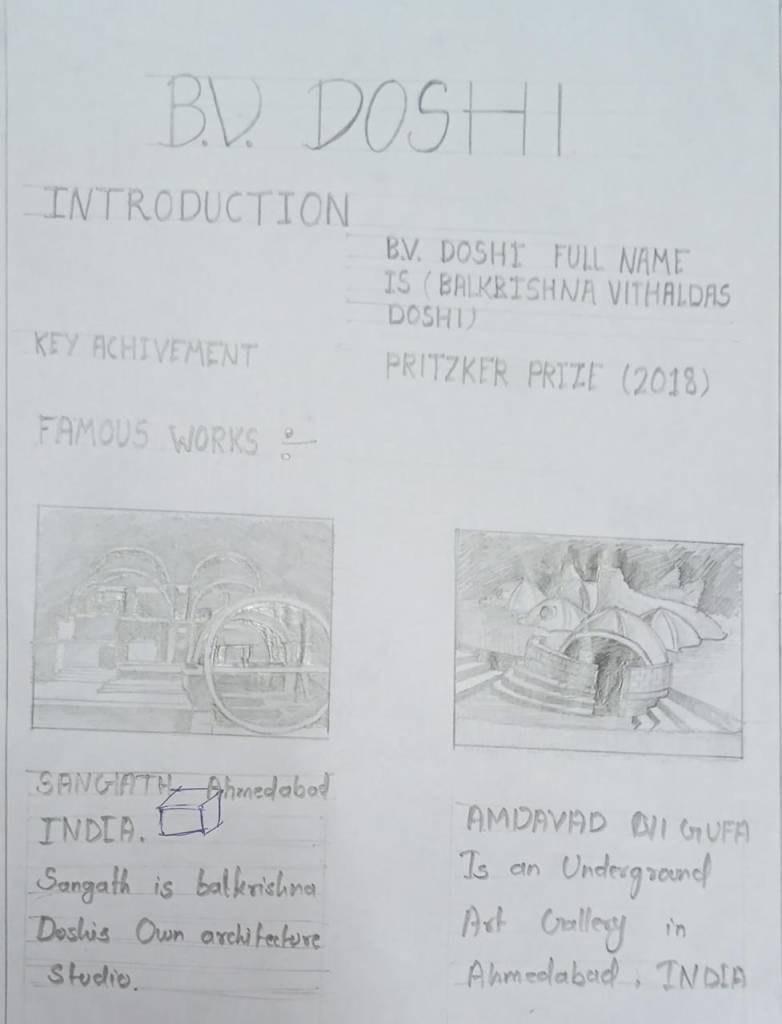


You must be logged in to post a comment.