Urban areas have become the primary form of human settlement in the modern world, serving as centers of economic activity, cultural exchange, and social development. This essay examines the multifaceted roles that urban settlements play in contemporary society. Through analysis of recent research, it explores how cities function as economic hubs, centers of innovation, and providers of essential services, while also addressing the challenges they present including overcrowding, environmental degradation, and social inequality. The essay demonstrates that understanding the role of urban areas as settlements is crucial for developing sustainable urban development policies and addressing global urbanization trends. This work synthesizes existing literature to provide a comprehensive overview of urban settlement functions and their significance in shaping human civilization.
2. Introduction
The world is rapidly urbanizing. According to recent statistics, more than half of the global population now lives in urban areas, and this proportion is expected to increase to nearly 70% by 2050. This dramatic shift in human settlement patterns represents one of the most significant transformations in human history. Cities have evolved from being merely places where people live to becoming complex systems that serve as engines of economic growth, centers of innovation, and hubs of cultural and social development.
The concept of urban areas as settlements is not new, but the scale and speed of contemporary urbanization is unprecedented. Understanding the various roles that cities play in human society is essential for policymakers, urban planners, and researchers who work to create sustainable and livable urban environments. Urban settlements are no longer simply residences; they are multifunctional systems that serve diverse purposes and accommodate the needs of billions of people worldwide.
This essay explores the critical roles that urban areas fulfill in modern society. It examines how cities function economically, socially, culturally, and environmentally, while also acknowledging the significant challenges that rapid urbanization creates. By understanding these roles comprehensively, we can better appreciate why cities are so important to human development and what strategies might help us build more sustainable urban futures.
3. Discussion
3.1.1. Economic Functions of Urban Settlements
One of the most fundamental roles that urban areas play is as centers of economic activity and employment generation. Cities concentrate businesses, industries, and services in relatively small geographic areas, creating what economists call “agglomeration economies.” This concentration allows for efficient resource allocation, reduced transportation costs for goods and services, and increased productivity. According to research on urbanization and economic development, cities generate a disproportionate share of national GDP despite occupying only a small fraction of land area. In many developed nations, urban areas produce 80-90% of national economic output despite comprising only 3-5% of total land area.
The economic importance of cities stems from multiple factors. First, urban areas provide access to larger markets and diverse consumer bases. Businesses locate in cities because they can access millions of potential customers within reasonable distances. Second, cities offer concentrated labor markets with diverse skill sets, allowing employers to find qualified workers relatively easily. This attracts both established companies and startups seeking talented employees.
Third, urban settlements provide infrastructure and services necessary for business operations including transportation networks, utilities, communication systems, and financial institutions. Fourth, cities facilitate knowledge transfer and innovation through proximity of workers, researchers, and entrepreneurs. This agglomeration of talent and resources has made cities the primary locations for research institutions, technology parks, and innovation hubs globally.
3.1.2. Social and Cultural Roles
Beyond economic functions, urban areas serve crucial social and cultural roles. Cities are centers of cultural diversity where people from different ethnic, religious, and social backgrounds live in proximity. This diversity has historically made cities centers of cultural innovation, artistic expression, and intellectual development. Museums, theaters, universities, and cultural institutions concentrate in urban areas, providing citizens with access to educational and cultural opportunities.
Urban settlements also provide access to essential services including healthcare, education, and government services. Large hospitals with specialized facilities, universities offering diverse programs, and government administrative centers typically locate in cities. This concentration of services means that urban residents often have better access to quality healthcare and education compared to rural populations, though this advantage varies significantly depending on urban inequality levels.
Additionally, cities serve as centers of social mobilization and political engagement. Urban areas historically have been sites of social movements, activism, and political change. The concentration of population and diversity of perspectives in cities facilitates collective action and social organization. Many important social movements, from labor rights to civil rights to environmental movements, have originated in or been significantly advanced through urban activism.
3.1.3. Innovation and Knowledge Centers
Urban areas increasingly function as centers of innovation and knowledge creation. The concentration of universities, research institutions, and technology companies in cities creates environments conducive to innovation. Research on innovation ecosystems highlights how urban agglomeration facilitates collaboration between academics, entrepreneurs, and investors. Cities like Silicon Valley, Boston, and Bangalore have become synonymous with technological innovation partly because of the concentration of educational institutions, venture capital, and tech companies in these areas.
This innovation role extends beyond technology to include social innovation. Cities are laboratories for experimenting with new approaches to solving social problems including housing, transportation, and environmental management. Municipal governments often pilot new policies and programs that subsequently spread to other cities or become national models.
3.1.4. Administrative and Political Functions
Cities serve as administrative and political centers for regions, nations, and increasingly, global networks. Most nations designate capital cities as centers of government administration. These capital cities concentrate political power, decision-making institutions, and government services. Beyond capital cities, regional centers and secondary cities serve similar administrative functions at local and regional levels. This administrative concentration gives cities significant political influence and makes them sites where policy decisions affecting entire regions or nations are made.
3.1.5. Environmental and Sustainability Challenges
While urban areas serve important functions, they also present significant environmental challenges that must be addressed. Cities concentrate human activities and consumption, generating substantial waste, pollution, and energy consumption. Urban areas consume disproportionate amounts of resources including energy, water, and raw materials. They also generate significant waste streams including solid waste, wastewater, and air pollution. The environmental footprint of urban residents is typically much larger than that of rural residents, despite cities occupying smaller land areas.
However, research also suggests that cities can be more environmentally efficient than dispersed rural settlements. Dense urban areas can provide public transportation systems that reduce per capita energy consumption compared to automobile-dependent rural areas. Cities can achieve economies of scale in waste management, water treatment, and energy production. Therefore, the environmental role of cities is complex—they present challenges but also opportunities for more sustainable living patterns if properly planned and managed.
3.1.6. Housing and Settlement Functions
Urban areas fulfill the basic function of providing housing for large populations. As rural-to-urban migration accelerates, cities must accommodate growing populations by providing housing. However, this has become increasingly challenging, particularly in rapidly urbanizing regions. Housing shortages, affordability crises, and the proliferation of slums and informal settlements have become major urban challenges. In many developing nations, rapid urban growth has outpaced housing supply, forcing significant populations into inadequate housing conditions. Understanding cities’ role in providing housing is therefore critical for addressing urbanization challenges.
3.1.7. Social Inequality and Service Provision
An important but often problematic role that cities play is as sites of social inequality. While cities offer opportunities and services, access to these opportunities is often unequally distributed. Urban areas frequently exhibit stark divisions between wealthy and poor neighborhoods, with significant differences in access to quality services, employment opportunities, and living conditions. Slums and informal settlements that concentrate in cities house millions of people in inadequate conditions. This concentration of both opportunity and inequality makes cities sites of significant social tension and inequality.
Cities must therefore balance their role as opportunity centers with responsibility to provide equitable access to services and opportunities for all residents. This remains one of the central challenges of contemporary urban governance.
3.1.8. Demographic and Migratory Functions
Urban areas serve as magnets for migration, both internal and international. People migrate to cities seeking employment, education, and better living standards. This migration function has profound implications for both urban and rural areas. Rural areas lose population and labor force as people migrate to cities, while cities must accommodate rapid population growth. Understanding cities’ role in migration patterns is essential for understanding both urbanization processes and rural development challenges.
4. Conclusion
Urban areas fulfill multiple critical roles in contemporary society that extend far beyond simply being places where people live. They function as economic engines generating employment and wealth, centers of innovation and knowledge creation, providers of essential services and infrastructure, and sites of cultural and social development. Cities are also administrative and political centers where important decisions affecting entire regions are made.
However, cities also present significant challenges. Rapid urbanization has created housing shortages, environmental degradation, overcrowding, and increased social inequality in many urban areas. These challenges must be addressed through thoughtful urban planning and governance.
The future of human civilization is inextricably linked to cities. As global population continues to grow and urbanization accelerates, understanding the multiple roles that urban settlements play becomes increasingly important. Policymakers and urban planners must work to maximize the positive functions that cities provide—economic opportunity, innovation, cultural exchange, and service provision—while minimizing negative outcomes including inequality, environmental degradation, and poor living conditions.
Sustainable urban development requires recognizing that cities are complex systems serving many functions simultaneously. Successful urban areas will be those that can provide economic opportunity and innovation while maintaining environmental sustainability, social equity, and quality of life for all residents. This requires integrated approaches to urban planning that consider economic, social, environmental, and political dimensions simultaneously.
The role of urban areas as settlements will continue to evolve as technology, climate change, and social preferences shift. However, cities will undoubtedly remain central to human civilization, and investing in understanding and improving urban systems is essential for creating a sustainable and equitable future for the growing proportion of humanity that will live in cities.
5. References
World Bank. (2016). Urban development overview. The World Bank, Washington, D.C.
Chen, M., Kasmire, J., & Japelli, B. (2018). Reconceptualizing urbanization in the era of contemporary globalization. Journal of Urban Affairs, 40(5), 613-628.
Frey, W. H. (2012). Population redistribution and metropolitan governance. Brookings Institution Metropolitan Policy Program, 45-67.
Glaeser, E. L. (2011). Triumph of the city: How our greatest invention makes us richer, smarter, greener, healthier, and happier. Penguin Press.
Habitat, U. N. (2019). World cities report: The role of cities in achieving the sustainable development goals. United Nations Human Settlements Programme, 12-34.
Henderson, J. V. (2002). Urbanization and economic development. Annals of Economics and Finance, 3(2), 275-341.
Kjellstrom, T., & Corvalan, C. (2008). Framework for the development of environmental health indicators. World Health Organization, Geneva.
Lall, S. V., Shalizi, Z., & Deichmann, U. (2004). Agglomeration economies and productivity in Indian industry. Journal of Development Economics, 73(2), 643-673.
Martine, G., & McGranahan, G. (2013). Urban density in low income countries. Environment and Urbanization, 25(2), 185-199.
Pradhan, R., & Bagchi, T. P. (2009). Effect of urbanization on housing: A study in the context of Indian cities. International Journal of Housing and Human Settlements, 56(4), 402-418.
Satterthwaite, D. (2009). The implications of population growth and urbanization for climate change. Environment and Urbanization, 21(2), 545-567.
United Nations. (2019). World urbanization prospects: The 2018 revision. Department of Economic and Social Affairs, Population Division, 78-95.
Urbanization in India embodies a progression shaped by colonial economic imperatives, post-Independence state-led development policies, and contemporary economic liberalization, resulting in a top-heavy urban system dominated by large cities with pronounced socio-economic inequalities and spatial disparities. Addressing these challenges requires nuanced urban planning and governance strategies that recognize historical legacies and contemporary dynamics of growth and migration.
Introduction
Urbanization has evolved as a dynamic process across different civilizations, reflecting the socio-economic, political, and cultural contexts of each period. Every era and society developed its distinct urban planning approaches to address the pressing challenges of its time. Recognizing these historical patterns is crucial for today’s urban planners, as it provides critical insights into how cities respond to changing human needs and environmental conditions. In the Indian context, urbanization exhibits a rich and diverse trajectory shaped by successive rulers, regional influences, and technological advancements. This essay, therefore, seeks to explore the evolution of urbanization in India through medieval to the modern period., highlighting key planning characteristics, spatial arrangements, and the enduring influence of past ideas and major events on the timeline of history such as the rise and fall of the Mughal Regime and the British Raj on contemporary urban development.
Discussion
First Urbanization
The Indus Valley Civilization (2350-1800 BCE) represents India’s first major urban phase, featuring remarkably advanced city planning. Cities like Harappa and Mohenjo-daro demonstrated sophisticated urban design with grid-pattern streets, advanced drainage systems, and clear zoning between upper and lower towns. These settlements included well-organized residential areas, granaries, public baths, and comprehensive sewerage networks that were far ahead of their time.
Second Urbanization
Following the Indus Valley period, India experienced what historians term the “second urbanization” during the early historic period (600 BCE – 300 CE), centered around the middle Gangetic plains. This phase witnessed the emergence of cities connected to regional kingdoms and expanding trade networks. However, the early medieval period (600-1300 CE) saw varied patterns of urban development, with some scholars arguing for urban decline while others identify new forms of temple-centered urbanization, particularly in South India.
The British Raj
Transformation and Urban Decline
The British colonial period initially brought significant urban decline to traditional Indian cities. This decline occurred for several interconnected reasons:
Economic Disruption: The British showed little interest in India’s traditional industries, leading to the deterioration of established urban centers that had thrived under Mughal rule. The Industrial Revolution in England fundamentally altered India’s economic landscape, making many traditional crafts and industries uncompetitive.
Trade Route Disruption: The introduction of railways dramatically redirected existing trade routes, disrupting the monopoly of traditional trading centers. Every railway station became an export point for its hinterland, depriving earlier trade centers of their economic foundations. This transformation was so significant that traditional centers in regions like Rajasthan experienced delayed decline only because railways reached them later, during World War I.
The Presidencies
The emergence of Calcutta, Bombay, and Madras as dominant metropolitan centers represents one of colonialism’s most significant urban transformations.
Calcutta’s Colonial Development
Calcutta exemplified colonial urban planning principles. After Sirajudaula’s 1756 raid, the East India Company rebuilt Fort William and created the Maidan – a large open space around the fort for defensive purposes. The city developed a stark “White Town” and “Black Town” division, with British mansions around the Maidan contrasting sharply with crowded Indian neighborhoods in North Calcutta.
Bombay’s Transformation
Originally comprising seven islands, Bombay was gradually connected and expanded to accommodate growing populations. As colonial India’s commercial capital, it developed significant industrial infrastructure while maintaining rigid spatial segregation between European areas like Malabar Hill and overcrowded Indian districts like Girgaum and Byculla.
The Hill Stations
The establishment of over 80 hill stations between 1815 and 1870 created entirely new categories of urban settlements. These included major centers like Shimla, Darjeeling, Mussoorie, Nainital, Ooty, and Kodaikanal.
British colonial-era buildings in Shimla hill station with distinctive architecture and greenery
Multiple Functions: Hill stations served various colonial purposes – initially as sanatoriums for health recovery, later as horticultural centers for tea and coffee plantations (1840s), and finally as military cantonments and administrative centers after 1857. Shimla’s designation as summer capital in 1864 exemplified their growing political importance.
Spatial Segregation: Hill stations functioned as “exclusive British preserves” where “the Indian [could be rendered] into an outsider”. They featured strict racial segregation, with original inhabitants like the Paharis, Lepchas, and Todas relegated to servant roles. These settlements recreated English village aesthetics through clock towers, bandstands, and Anglican churches, creating “home away from home” environments.
A densely built colonial hill station town in India showing British-era architecture and forested hillsides typical of Shimla or Darjeeling
Salient features of British Urban Settlements
Civil Lines and Cantonments: Institutionalized Segregation
The modification of existing cities through civil lines and cantonments created systematic spatial apartheid.
Civil Lines: These residential areas housed British administrative officials, courts, and offices. Characterized by low-density development, broad tree-lined roads, and large bungalow compounds, they stood in stark contrast to overcrowded native quarters. The size of garden space around bungalows directly reflected hierarchical rank – senior officers enjoyed 15:1 garden-to-building ratios while junior ranks had 1:1 ratios.
Cantonments: Military settlements followed grid patterns based on European urban planning principles. Originally mobile tent structures, they evolved into permanent suburban settlements designed to “promote aloof incorruptible government” while reinforcing “arrogant ideas of racial superiority”. These were connected to railway stations for troop mobility and supply logistics.
The “Mall” served as the protected main thoroughfare in cantonments, contrasting with the “chowk” (central marketplace) of traditional Indian cities. While native city streets encouraged interaction, cantonment social life was restricted to exclusive clubs and gymkhanas.
Railway-Driven Industrial Townships
Railways catalyzed the emergence of new industrial townships like Jamshedpur, Asansol, and Dhanbad. However, colonial railway development primarily served British economic interests rather than Indian industrialization.
Limited Industrial Development: Despite massive railway construction, only 700 locomotives were manufactured in India between 1865 and 1941, while 12,000 were imported. This pattern reflected the colonial economy’s role as raw material supplier rather than manufacturing center.
Employment and Urban Growth: Railways employed approximately 800,000 people by 1931, with major workshop complexes like Jamalpur employing over 11,000 workers. Railway colonies housed European employees in superior conditions, perpetuating racial hierarchies even in new industrial centers.
Architectural details and colonial features of Chhatrapati Shivaji Terminus (Victoria Terminus) in Bombay, showcasing British-Indian railway station design and urban colonial influence
Infrastructure Inequality and Urban Apartheid
Colonial infrastructure improvements were deliberately unequal, reinforcing social segregation.
Selective Modernization: Piped water supply, sewerage systems, street lighting, and domestic electrification were “restricted to civil lines and cantonment areas”. Most cities, particularly Indian residential areas, remained deprived of these facilities. Even municipal bodies established in 1881 served primarily areas with British populations.
Health and Sanitation Divide: Colonial authorities justified demolishing Indian neighborhoods (bustis) on health grounds, forcing workers, craftsmen, and the unemployed to relocate repeatedly. Building regulations mandated tiled roofs over traditional thatch, creating additional economic burdens for Indian residents. This reinforced the racial division between “healthy” European areas and “unhealthy” Indian districts.
Water Management Disruption: British water policies, influenced by Britain’s abundant rainfall patterns, neglected India’s traditional rainwater harvesting systems. The shift toward large-scale canal irrigation and centralized control disrupted community-based water management practices that had sustained settlements for centuries.
Post Independence
The post-Independence period (post-1947) marks a new phase of urbanization, characterized by rapid expansion and a marked increase in the number of towns and large cities, including the emergence of numerous one-lakh and million-plus urban agglomerations. This period saw significant refugee influxes, planned administrative centers such as Chandigarh and Bhubaneswar, and the development of new industrial cities. Urban growth increasingly concentrated in metropolitan and Class I cities, leading to pronounced urban primacy and regional disparities. While economic growth, particularly from the 1990s onward, has accelerated urbanization, it has also led to the informalization of the urban economy and proliferation of slums, highlighting socio-economic vulnerabilities.
India’s urbanization trajectory exhibits notable unevenness, with developed states experiencing concentrated urban growth and backward regions witnessing stagnation or decline in smaller towns. This dichotomy reflects broader patterns of economic development, infrastructural investment, and migration dynamics, where urban areas in developed states benefit from more robust economic bases and governance structures. Simultaneously, smaller towns in less developed regions struggle with maintaining their urban status and population. The colonial legacy continues to influence this urban dualism, with metropolitan centers dominating economic and demographic growth while peripheral areas lag behind.
Conclusion
The process of urbanization in India represents a complex and multifaceted transformation deeply rooted in historical, economic, and socio-political contexts, marked by distinct phases from the colonial era to the post-Independence period. Urbanization, understood as the progressive concentration of population in urban units, manifests through diverse interpretations—behavioral, structural, demographic, and geographical—reflecting changes in societal conditions and relationships.
References
Kanneboina, B., Singh, J. (2022), Urban Planning and Architecture of Indus Cities: Exploring the Layout and Infrastructure of Harappan Settlements, International Journal of Advanced Research in Science, Communication and Technology (IJARSCT), Volume 2, Issue 1 [Accessed on 12 October 2025]
Adukia, A., et al. (2022), Residential Segregation and Unequal Access to Local Public Services in India: Evidence from 1.5m Neighborhoods, 17th Annual Conference on Economic Growth and Development December 19-21, 2022 Indian Statistical Institute, New Delhi [Accessed on 12 October 2025]
Sharma, P. & Joshi, A. & Choudhary, R. & Tiwari, H. (2024). Water Management in India: from Ancient Community–based Systems to Colonial Interventions and Modern Strategies. [Accessed on 12 October 2025]
Mortality indicators are essential tools for assessing the health status of populations and guiding public health interventions. This paper explores three critical metrics: Infant Mortality Rate (IMR), Neonatal Mortality Rate (NMR), and Adjusted and Standardized Death Rates. IMR and NMR reflect the quality of maternal and child healthcare, while standardized death rates allow for fair comparisons across populations with differing age structures. Using global and Indian data, this paper analyzes
trends, causes, and policy implications, highlighting the importance of these indicators in achieving Sustainable Development Goals and improving health equity.
Ø INTRODUCTION
Mortality statistics serve as a mirror to the health and development of societies. Among these, infant and neonatal mortality rates are sensitive indicators of maternal health, healthcare access, and socio-economic conditions. Meanwhile, adjusted and standardized death rates provide analytical clarity by accounting for demographic differences. This essay aims to define and compare these metrics, examine their trends globally and in India, and discuss their implications for public health planning.
Historically, high infant and neonatal mortality rates were common across the globe, especially before the advent of
modern medicine, sanitation, and vaccination. In the early 20th century, many countries reported IMRs exceeding 100 deaths per 1,000 live births. Today, thanks to advancements in healthcare and targeted public health programs, these rates have declined dramatically in most regions. However, disparities persist—both between and within countries—highlighting the need for
continued vigilance and investment.
In parallel, the use of adjustedandstandardizeddeathrates
has become essential in epidemiology and health planning. These metrics allow researchers and policymakers to compare mortality across populations with different age structures,
socioeconomic profiles, and risk exposures. Without adjustment, crude death rates can be misleading, especially in aging societies or regions with uneven demographic distributions.
This essay explores these three key mortality indicators—IMR, NMR, and standardized death rates—by defining their concepts, analysing global and Indian trends, identifying underlying causes,
and discussing their implications for public health policy. Through this comparative lens, we aim to understand how these metrics guide efforts toward achieving health equity, improving maternal and child outcomes, and meeting global targets such as the
Sustainable Development Goals (SDGs).
Ø DISCUSSION
1. Infant Mortality Rate (IMR)
Definition
The Infant Mortality Rate is defined as the number of deaths of infants under one year of age per 1,000 live births in a given year. It is a widely used indicator of the overall health of a population,
reflecting the quality of maternal care, nutrition, sanitation, and access to medical services.
Causes of Infant Mortality
Infant mortality is influenced by a range of medical, social, and environmental factors:
Pretermbirthcomplications
Birthasphyxia
Neonatal infections (e.g., sepsis, pneumonia)
Congenital anomalies
Malnutrition and poor maternal health
Lack of access to skilled birth attendants
Global Trends
Globally, the IMR has declined significantly over the past few decades. According to the World Bank, the global IMR dropped from 65 per 1,000 live births in 1990 to around 25 in 2025. This progress is attributed to improved healthcare infrastructure, vaccination programs, and maternal education.
India’s Progress
India has made remarkable strides in reducing infant mortality:
1GG0: ~88 deaths per 1,000 live births
2010: ~47 deaths
2025: ~27 deaths
Government initiatives like the Janani Suraksha Yojana, Mission Indradhanush, and National Health Mission have played pivotal roles in this decline.
Regional Disparities
Despite national progress, disparities persist:
States like Kerala and Tamil Nadu report IMRs below 10.
States like Uttar Pradesh and Madhya Pradesh still report rates above 40. Socioeconomic Correlates
IMR is closely linked to maternal education, household income, and urbanization.
Studies show that each additional year of maternal education can reduce IMR by up to 9%.
Health System Factors
Availability of primaryhealthcarecenters, emergencyobstetric care, and trained birth attendants significantly lowers IMR.
Immunizationcoverage(e.g., DPT, measles) is a key determinant.
Data Note
IMR is often used in Human Development Index (HDI)
calculations and is a key SDG 3.2 target: “End preventable deaths of newborns and children under 5 years of age.”
2. Neonatal Mortality Rate (NMR)
Definition
The Neonatal Mortality Rate refers to the number of deaths of infants within the first 28 days of life per 1,000 live births. It is a subset of infant mortality and is often more sensitive to the quality of perinatal and immediate postnatal care.
Causes of Neonatal Deaths
Prematurityandlowbirthweight
Birthtraumaandasphyxia
Neonatal infections (e.g., sepsis, meningitis)
Congenital anomalies
Lack of skilled birth attendance
Global Scenario
2025GlobalAverage: ~17 deaths per 1,000 live births
Sub-SaharanAfrica: Highest rates, often exceeding 30
Urban areas benefit from better infrastructure and awareness.
Rural areas face challenges like poor transport, lack of skilled personnel, and cultural barriers.
Biological Vulnerability
Neonates are biologically more vulnerable due to immature immune systems and thermoregulation.
The first 24 hours are the most critical—up to 50% of neonatal deaths occur within this window.
Innovations in Care
Point-of-care diagnostics, portable incubators, and telemedicine are improving neonatal outcomes in remote areas.
Essential Newborn Care (ENC) protocols are being scaled in India under the Reproductive, Maternal, Newborn, Child, and Adolescent Health (RMNCH+A) strategy.
Global Benchmarks
Countries like Japan, Iceland, and Singapore have NMRs below 2 due to universal healthcare, high institutional delivery rates, and strong postnatal follow-up.
3. Adjusted and Standardized Death Rates
Why Adjust Mortality Rates?
Crude death rates can be misleading when comparing
populations with different age structures. For instance, a country with an older population may naturally have a higher death rate, even if its healthcare system is effective. To address this, adjusted and standardized mortality rates are used.
Age-Adjusted Mortality Rate
Definition: A mortality rate statistically modified to eliminate the effect of different age distributions in different populations.
Purpose: Allows for fair comparisons across regions or time periods.
Method: Applies age-specific death rates to a standard population structure.
Standardized Mortality Ratio (SMR)
Definition: The ratio of observed deaths in a study population to the number of deaths expected based on a standard population.
Formula:
Interpretation:
SMR = 1: Mortality is as expected
SMR > 1: Higher-than-expected mortality
SMR < 1: Lower-than-expected mortality
Applications
Public Health Surveillance: Identifying high-risk regions or groups
Occupational Health: Comparing mortality in exposed vs. unexposed workers
Policy Evaluation: Assessing the impact of health interventions
Example
Suppose a mining town reports 120 deaths in a year, while the expected number based on national age-specific rates is 100. The SMR would be:
This indicates a 20% higher mortality than expected, warranting further investigation.
Direct vs Indirect Standardization
Direct method: Requires age-specific death rates in the study population.
Indirect method: Used when age-specific rates are unavailable; relies on a standard population’s rates.
Use in Epidemiology
SMRs are widely used in occupational health studies (e.g., comparing factory workers to general population).
Also used in epidemic surveillance to detect excess mortality (e.g., during COVID-19 waves).
Policy Implication
Adjusted rates help prioritizeinterventionsin high-risk groups and evaluate program effectiveness over time.
They are essential for international comparisons, especially in WHO and OECD reports.
Cross-Cutting Themes
Digital Health C Data Systems
India’s Health Management Information System (HMIS) and Civil Registration System (CRS) are improving mortality data accuracy.
Aadhaar-linked health IDs and Ayushman Bharat Digital Mission aim to streamline maternal and child health
tracking.
Equity and Inclusion
Marginalized groups (e.g., Scheduled Tribes, rural poor) often face higher mortality rates.
Gender disparities persist: female infants in some regions have higher mortality due to neglect and lower healthcare access.
Future Directions
Artificial Intelligence and predictive analytics are being explored to identify at-risk pregnancies and optimize neonatal care.
Community-based interventions (e.g., Accredited Social Health Activists or ASHAs) remain vital in bridging last-mile gaps.
Ø CONCULSION
Infant and neonatal mortality rates are vital indicators of a
nation’s health infrastructure and maternal care. India’s progress in reducing these rates reflects successful policy interventions, though regional disparities remain. Adjusted and standardized death rates offer a refined lens for comparing mortality across populations, enabling targeted health planning. Together, these metrics guide efforts toward equitable healthcare and the
achievement of global health goals.
India’s progress in reducing infant and neonatal mortality over the past two decades is commendable. Targeted programs, improved institutional delivery rates, and community-based interventions have saved millions of lives. However, persistent disparities across states, rural-urban divides, and vulnerable populations underscore the need for sustained investment, innovation, and equity-focused policies.
Standardized and adjusted mortality rates, meanwhile, offer a critical lens for interpreting mortality data fairly. They allow policymakers to look beyond raw numbers and understand the
true burden of disease and death across different demographic profiles. In an era of aging populations, emerging diseases, and climate-related health risks, these tools are indispensable for evidence-based decision-making.
Looking ahead, the integration of digital health technologies, real- time data systems, and predictive analytics holds promise for further reducing preventable deaths. Yet, technology alone is not enough. Strengthening primary healthcare, empowering frontline
workers, and addressing social determinants of health—such as education, nutrition, and sanitation—remain foundational.
Ultimately, reducing mortality is not just a health goal—it is a moral imperative. Every infant saved, every mother supported, and every life extended reflects a society’s commitment to dignity, equity, and human development. As we strive toward the Sustainable Development Goals and universal health coverage, these mortality indicators will continue to guide our path,
reminding us that behind every number is a life that matters.
Ø REFERENCES
Adams, V. (2016). Metrics: What counts in global health. Duke University Press.
Bilheimer, L. T. (2010). Evaluating metrics to improve population health. Preventing Chronic Disease, 7(4), A69.
Gouda, H. N., Critchley, J., Powles, J., & Capewell, S. (2012). Why choice of metric matters in public health analyses: a case study of the attribution of credit for the decline in coronary heart disease mortality in the US and other populations. BMC public health, 12(1), 88.
Murray, C. J., & Frenk, J. (2008). Health metrics and evaluation: strengthening the science. The Lancet, 371(9619), 1191-1199.
World Bank Data on Infant and Neonatal Mortality
National Family Health Survey (NFHS-5), India
WHO Global Health Observatory
Ministry of Health and Family Welfare, Government of India
UNICEF Reports on Child Mortality
Lashya and Janani Suraksha Yojana Program Documents
The study of population dynamics has long been a central concern in demography, providing essential insight into how human societies grow, age, and transform. Among the many analytical approaches in this field, the Cohort Survival Model (CSM) stands out for its simplicity and practicality in projecting population changes based on fertility, mortality, and migration rates. This model uses age-sex cohorts to estimate the number of individuals who will survive and move into the next age group in future time periods. While the traditional model offers reliable projections, its application becomes more complex in societies where religion, culture, and social practices strongly influence demographic behaviour. The Inter-Religion Cohort Survival Method (IRCSM) addresses this complexity by introducing a comparative and culture-sensitive framework that accounts for inter-religious variations in fertility, mortality, and migration patterns. This essay provides a comprehensive overview of the theoretical foundation, methodology, and applications of both the CSM and the IRCSM. It also highlights their significance in population forecasting, social policy, and planning in pluralistic societies such as India.
Introduction
Demography, at its core, is the study of population structure and change. Every population evolves through the combined effects of births, deaths, and migration, and demographers have long sought methods to understand and predict these changes. The Cohort Survival Model is one such powerful technique used to project populations over time by tracking groups—or cohorts—of individuals as they age. A cohort typically refers to people who share a common defining event within a specific time frame, such as those born in the same year or period.
The cohort survival method projects future population by applying age-specific survival ratios to existing cohorts, adjusting for migration and fertility where necessary. The result is an estimation of how many individuals from a given cohort will survive to the next age group at a future date. This method is widely used in education planning, labour-force studies, healthcare forecasting, and national population projections because it provides both accuracy and clarity.
However, population dynamics are rarely uniform across a society. Religious affiliation, cultural norms, and social values play a significant role in shaping fertility, mortality, and migration patterns. In countries with religious and cultural diversity, such as India, the Inter-Religion Cohort Survival Method (IRCSM) offers a more nuanced approach by disaggregating population data by religion and applying religion-specific demographic parameters. This provides insights into population trends among different communities and helps planners design equitable and inclusive policies.
The objective of this essay is threefold:
1. To explain the principles and operation of the cohort survival model.
2. To elaborate on the inter-religion cohort survival method and its importance.
3. To discuss the applications, benefits, and limitations of these methods in demographic and policy studies.
Discussion
1. The Concept of the Cohort Survival Model
The Cohort Survival Model (CSM) is a demographic tool used to project population size and structure by age and sex for future time periods. It operates on the idea that a population can be divided into age-sex groups (e.g., 0–4 years, 5–9 years, etc.), and each cohort can be projected forward by applying a survival ratio derived from life tables.
In its simplest form, the model can be represented as:
P_{x+n,t+n} = P_{x,t} \times S_{x,t} + M_{x,t}
Where:
= Population aged x at time t
= Survival ratio from age x to x+n
= Net migration between time t and t+n
The model assumes that each age cohort “survives” into the next age interval according to the probability of survival, adjusted for migration. Fertility is introduced to project new entrants into the youngest age group, based on age-specific fertility rates and survival rates for infants.
This method is widely used because of its clarity, computational simplicity, and reliability, particularly for medium-term projections. Governments, educational planners, and international organizations use it to estimate population needs for schooling, housing, employment, and healthcare.
2. Data Requirements and Process
The accuracy of the cohort survival model depends on the quality of its input data. The required data typically include:
Base-year population by age and sex (from a census or survey)
Life tables to derive survival ratios
Fertility rates (to estimate births entering the 0–4 cohort)
Migration statistics (to adjust for inflows or outflows of people)
The process involves several steps:
1. Establish the base population in five-year age groups for both males and females.
2. Apply age-specific survival ratios to each cohort to estimate survivors in the next period.
3. Add or subtract migration to account for net movement.
4. Estimate new births using fertility rates applied to women in reproductive ages (15–49).
5. Repeat the process for each projection interval.
This sequential, age-based calculation makes the cohort survival model both transparent and adaptable to different geographic scales—from national to regional to local projections.
Can incorporate fertility, mortality, and migration changes.
Useful for short- and medium-term projections where data are limited.
Limitations:
Assumes constant rates between time intervals.
Sensitive to inaccuracies in survival or migration data.
May not capture sudden social or environmental disruptions (wars, pandemics, disasters).
4. The Inter-Religion Cohort Survival Method (IRCSM)
The Inter-Religion Cohort Survival Method extends the basic CSM by introducing religion as a key variable. It acknowledges that demographic behaviours differ across religious groups due to variations in cultural norms, socioeconomic conditions, and access to resources. For instance, fertility and mortality rates may vary significantly among Hindus, Muslims, Christians, Sikhs, or Buddhists in India.
This method disaggregates the base population into subgroups by religion and applies religion-specific survival and fertility ratios. Each community’s demographic behaviour is modelled separately, allowing analysts to study differences in population growth, aging, and migration.
Key Steps in the IRCSM:
1. Disaggregate the population by religion, age, and sex using census data.
3. Apply cohort survival projections to each religious subgroup separately.
4. Compare inter-religious results to understand disparities and growth patterns.
Rationale and Importance:
Religion often influences reproductive behaviour through doctrines, cultural expectations, and gender roles. Some groups may favour larger families, while others may adopt modern family-planning methods. Mortality can also differ due to economic inequalities or access to healthcare, and migration patterns may vary based on community networks or discrimination.
By incorporating these factors, the IRCSM provides a culturally contextualized and socially sensitive picture of population change—crucial for inclusive policymaking and social research.
5. Applications of the Inter-Religion Cohort Survival Method
The IRCSM has broad applications in planning and social research:
a. Educational Planning:
Projections of school-age populations can differ among religious communities. Identifying such variations helps in the equitable distribution of educational resources and targeted interventions.
b. Health and Welfare Planning:
Different communities may have distinct health outcomes and healthcare access. IRCSM helps forecast healthcare needs, maternal health programs, and vaccination strategies.
c. Urban and Regional Planning:
Migration and fertility patterns across religions affect urban composition and housing demand. IRCSM assists in urban policy formulation by anticipating community-specific population growth.
d. Employment and Labor Studies:
Demographic forecasts by religion provide insights into labour-force participation, skill levels, and future employment demands among different communities.
e. Social and Political Analysis:
Understanding religious demographic trends aids in maintaining social harmony, preventing resource conflicts, and ensuring fair representation in policymaking.
6. Case Illustration: India
India offers an ideal context for applying the inter-religion cohort survival method due to its immense religious diversity. According to the Census of India (2011), major religious communities include Hindus (79.8%), Muslims (14.2%), Christians (2.3%), Sikhs (1.7%), Buddhists (0.7%), and Jains (0.4%).
Empirical studies (Bhat, 2003; Registrar General of India, 2011) reveal that fertility rates among Muslims have traditionally been higher than among Hindus or Christians, though the gap has been narrowing. Likewise, mortality and migration patterns differ due to disparities in income, education, and healthcare access. Applying IRCSM allows researchers to project future religious composition more accurately, revealing potential implications for education demand, labour markets, and social policies.
For example, if higher fertility persists in certain groups, their proportion in younger age cohorts will increase, influencing school enrolment and labour-force trends. Conversely, declining fertility and higher longevity in others may lead to aging populations requiring healthcare and pension support. Policymakers can use such insights to ensure equitable resource allocation and social stability.
7. Limitations and Challenges
While the IRCSM offers valuable insights, it also faces several challenges:
Data Limitations: Detailed religion-specific data on mortality and migration are often unavailable or outdated.
Sensitivity of Religious Data: Religion-based demographic analysis can be politically sensitive and must be handled ethically to avoid misinterpretation.
Inter-Religious Mobility: Conversions and interfaith marriages blur the boundaries of religious identity, complicating cohort projections.
Socioeconomic Factors: Variations within a religion (by region or class) can be as significant as variations between religions.
To address these challenges, researchers must combine demographic data with social and economic indicators and ensure transparency in methodology.
Conclusion
The Cohort Survival Model remains a cornerstone of demographic analysis, offering a structured and reliable method for population projection. Its stepwise approach, grounded in survival ratios and life-table data, provides planners and policymakers with clear insights into how populations age, grow, and transform. However, in diverse societies where religion and culture profoundly influence demographic behaviour, the traditional model may fall short of capturing real-world complexities.
The Inter-Religion Cohort Survival Method bridges this gap by integrating cultural and religious dimensions into demographic projections. It enables a deeper understanding of inter-community differences in fertility, mortality, and migration, allowing governments and institutions to plan more inclusively and equitably. Despite challenges in data collection and sensitivity, this method represents a progressive and necessary evolution in demographic research—one that respects social diversity while enhancing scientific accuracy.
Ultimately, both the cohort survival and inter-religion cohort survival models underscore the principle that population is not merely a collection of numbers but a reflection of human diversity, behaviour, and belief. Understanding these patterns helps societies plan better for the future—socially, economically, and culturally.
References
1. Siegel, J. S., & Swanson, D. A. (2004). The Methods and Materials of Demography. Elsevier Academic Press.
2. Shryock, H. S., Siegel, J. S., & Associates. (1976). The Methods and Materials of Demography. Academic Press.
3. United Nations. (2019). World Population Prospects 2019: Methodology of the United Nations Population Estimates and Projections.
4. Bhat, P. N. Mari. (2003). Religion and Demographic Behaviour in India. Oxford University Press.
5. Preston, S. H., Heuveline, P., & Guillot, M. (2001). Demography: Measuring and Modelling Population Processes. Blackwell Publishers.
6. Registrar General of India. (2011). Census of India 2011: Population by Religious Communities. Government of India.
Governance in a federal or quasi-federal structure, such as India, is predicated upon a critical duality of policymaking: the national and the state levels. This essay examines the essential, complementary, yet occasionally divergent roles played by these two spheres of authority in steering a nation towards its developmental goals. National policies provide the overarching vision, strategic direction, and universal standards necessary for cohesion, economic integration, and international standing. Conversely, state-level policies ensure context-specific, localized implementation, and tailored solutions that address regional heterogeneity, cultural nuances, and specific demographic needs. Effective governance, therefore, relies on a dynamic equilibrium, or ‘cooperative federalism,’ where the synergy between these two policy spheres maximizes efficiency, equity, and responsiveness in achieving inclusive socio-economic progress.
1. Introduction
The policy landscape of any large, diverse nation is a complex tapestry woven from the threads of central and sub-national policy imperatives. Policies, fundamentally, are deliberate systems of principles to guide decisions and achieve rational outcomes, and their formulation reflects a state’s aspirations, values, and priorities. In nations with a federal character, the constitutional division of powers creates two distinct, yet interdependent, arenas for policy action. The central or national government focuses on issues of strategic, macro-economic, and national security importance, utilizing its position to establish common frameworks. Simultaneously, the state or regional governments, being closer to the ground realities, focus on matters directly impacting the daily lives of their citizens, such as public order, health, and agriculture. Understanding the separate and combined roles of these two levels is crucial to appreciating the dynamics of national development, where top-down mandates must successfully meet bottom-up requirements. This duality is not merely a jurisdictional division but a strategic necessity for managing the intrinsic complexity and diversity of a large population and varied geographical expanse.
2.National Policies: The Visionary Blueprint and Unifying Framework
National policies serve as the visionary blueprint for the entire nation, establishing fundamental principles, long-term objectives, and binding standards that ensure unity and equitable development across all geographical regions. Their primary role is to manage issues that transcend state boundaries or require a coordinated approach to maintain national integrity and international competitiveness.
One of the most significant functions of national policy is macro-economicregulation and planning. The central government is responsible for fiscal policy, monetary policy, foreign trade, and large-scale infrastructure projects like national highways, railways, and telecommunications. Policies such as the Goods and Services Tax (GST) in India, for instance, exemplify the national government’s power to create a unified common market, dismantling inter-state barriers and streamlining the economic process, thereby boosting overall efficiency and investment. Furthermore, national policies are the sole custodians of defense, foreign affairs, and national security, setting the nation’s posture on the global stage and ensuring its sovereignty and protection.
In the realm of social welfare and human development, national policies play a crucial role in establishing minimum universal standards and addressing national-level disparities. Major central government schemes, whether for food security, universal education (like the National Education Policy, NEP 2020), or healthcare insurance (like Ayushman Bharat), aim to create a floor of entitlements and opportunities below which no citizen should fall, irrespective of their state of residence. This function of equity and redistribution is paramount, as the national government uses its taxing power to collect revenue from wealthier regions and allocate funds to support development in backward or poorer states, acting as a crucial national equalizer. Such policies foster a sense of shared citizenship and national integration by ensuring uniform access to fundamental rights and services.
3. State Policies: Local Context, Implementation, and Innovation
While national policies set the broad direction, it is the state-level policies that translate these mandates into tangible, on-the-ground outcomes, making them the crucible of practical governance and policy implementation. State governments, empowered by the constitutional framework to legislate on subjects like public order, health, land, and agriculture, are uniquely positioned to address the heterogeneity that characterizes large nations. The role of state policies is distinguished by its capacity for localization and customization.
The vast differences in climate, culture, economic structure, and demographic profiles necessitate that a one-size-fits-all national policy be adapted to local conditions. For instance, while a National Health Mission provides funding and guidelines, each state government formulates its specific public health policy regarding the operation of hospitals, disease surveillance, and sanitation, factoring in its unique regional disease burdens or infrastructural constraints. Similarly, state governments’ agricultural policies, dealing with land reforms, irrigation schemes, and crop procurement, are tailored to the specific soil conditions and prevalent cropping patterns of their regions. This allows for greater efficiency and responsiveness, as policymakers are intimately familiar with local demands and challenges.
Moreover, states often serve as laboratories of democracy, where innovative policy experiments are piloted before being potentially adopted at the national level or by other states. A state’s pioneering approach to renewable energy incentives, digital governance, or even poverty alleviation programs can provide valuable lessons and best practices for the entire nation. This competitive and collaborative federalism, where states compete to implement policies more effectively and learn from each other, drives overall national improvement. The states’ role is therefore not merely a submissive function of implementation but an active, creative one of adaptation, innovation, and direct service delivery, which critically determines the ultimate success or failure of any policy initiative.
4.The Indispensable Interface: Co-ordination and Conflict Resolution
The true art of federal governance lies in the effective interface between national and state policy frameworks. This interface, often termed Cooperative Federalism, requires robust institutional mechanisms for consultation, resource sharing, and conflict resolution. National policies frequently come with financial provisions, but their effective utilization depends on state capacity and political will. Bodies like the NITI Aayog (National Institution for Transforming India) in India, which replaced the Planning Commission, are designed precisely to foster this cooperation by providing a platform for states to contribute to national policymaking and for the central government to support state-specific priorities.
However, the relationship is not always seamless. Conflicts can arise from jurisdictional ambiguities, where subjects fall under the Concurrent List (allowing both levels to legislate), or from political disagreements, especially when different political parties govern the Centre and the states. For example, a national law might face resistance from state governments whose local economies or political bases are adversely affected. In such scenarios, mechanisms like the Inter-State Council and the judiciary play a crucial role in resolving disputes, interpreting constitutional provisions, and ensuring that the fundamental principles of the Constitution—such as the supremacy of national law on national issues and the autonomy of states on local matters—are maintained. The successful implementation of large-scale, centrally sponsored schemes, therefore, depends on clear guidelines, flexible adaptation by states, and a shared commitment to the ultimate goal of public welfare.
5.Conclusion
The dual role of national and state-level policies is the bedrock of governance in a diverse federal polity. National policies, with their emphasis on universal standards, macro-stability, economic integration, and national security, provide the essential structural foundation and unified vision. State-level policies, in turn, provide the necessary elasticity, contextual relevance, and precision in implementation, ensuring that the benefits of governance reach the last mile, taking into account local needs and ground realities. The dynamic interaction between these two spheres—a blend of central direction and regional discretion—is essential for transforming policy intent into developmental outcomes. Sustained progress is ultimately a function of how effectively this policy duality is managed: when national ambition is harmonised with state agility, the nation is positioned to achieve inclusive growth, social justice, and robust, resilient development. Therefore, the continuous effort to strengthen cooperative federalism and build institutional capacity at both levels remains the single most critical factor for future prosperity.
References
Austin, G. (1999). The Indian Constitution: Cornerstone of a Nation. Oxford University Press.
Bardhan, P., & Mookherjee, D. (2006). Decentralization and Local Governance in Developing Countries. MIT Press.
Dye, T. R. (2017). Understanding Public Policy (15th ed.). Pearson Education.
Government of India. (2020). National Education Policy 2020. Ministry of Education. [Source 1.3]
International Monetary Fund (IMF). (2007). Fiscal Federalism and the Efficiency of Public Spending: A Study in Regional Allocation. IMF Working Paper.
Joshi, R. (2013). Policies for Inclusive Growth in India. Routledge.
Lane, J. E. (2000). The Public Sector: Concepts, Models and Approaches. Sage Publications.
NITI Aayog, Government of India. (n.d.). Cooperative Federalism. Retrieved from the official NITI Aayog website. [Source 5.1]
Shah, A. (Ed.). (2007). The Practice of Fiscal Federalism: Comparative Perspectives. McGill-Queen’s University Press.
The Constitution of India. (n.d.). Part IV: Directive Principles of State Policy & Seventh Schedule (Union, State, and Concurrent Lists). [Source 1.2, 3.1]
India’s urban population is projected to reach 40% by 2030 and 900 million by 2050. While urban areas contribute 63% of GDP, they face critical challenges: housing shortage (19.1 million units), slum proliferation (104 million people), 80% informal employment, and weak governance. “Top-heavy” urbanization concentrates development in megacities (Delhi-NCR 32 million, Mumbai 20.4 million) while neglecting smaller towns and perpetuating regional inequality.
A comprehensive National Urbanization Policy is essential to address these issues through: strengthening municipal governance, promoting tier-2 and tier-3 cities, integrating land-use and transport planning, and adopting sustainable financing mechanisms. Government initiatives like Smart Cities Mission (₹98,000 crores), AMRUT (₹48,000 crores), and Pradhan Mantri Awas Yojana have made progress but face implementation challenges.
The vision for India’s urban future centers on three principles—Smart, Sustainable, and Equitable—ensuring urbanization becomes an instrument of inclusive prosperity while addressing environmental concerns and regional disparities through coordinated action across all government levels.
1. Introduction
Urbanization is a dynamic process characterized by the growth of cities and the concentration of human populations in urban areas, accompanied by the transformation of economic and social structures. In simple terms, it refers to the shift of population from rural to urban settlements, where more than 50% of the population lives in cities and towns. For India, a nation with a predominantly agrarian heritage, urbanization represents a fundamental shift in its development trajectory.
The importance of urbanization in India’s economic and social development cannot be overstated. Urban areas generate approximately 63% of India’s Gross Domestic Product (GDP), despite housing only about 35% of the population as of 2024. Cities serve as engines of economic growth, innovation, and employment generation. They provide enhanced access to education, healthcare, and other services, thereby contributing to human development. However, India’s urbanization has been largely unplanned and haphazard, resulting in acute challenges such as housing shortages, infrastructural deficits, environmental degradation, and widespread poverty in urban centers. The need for a comprehensive national policy framework to manage urban growth has become imperative to ensure that urbanization becomes an instrument of inclusive and sustainable development rather than a source of social fragmentation and environmental crisis.
2. Need for a National Urbanization Policy
India is witnessing unprecedented urbanization. According to the 2011 Census, the urban population was 377.1 million (31.2% of total population), projected to reach 600 million (40% of total population) by 2030 and 900 million by 2050. This rapid increase in urban population presents both opportunities and challenges. Between 1991 and 2011, the urban population growth rate averaged 2.7% annually, significantly outpacing rural growth.
The necessity of planned urban growth stems from several critical factors. Unplanned urbanization leads to sprawl, inefficient land use, inadequate infrastructure, environmental degradation, and the proliferation of slums. Without coherent policy guidance, cities grow chaotically, burdening existing infrastructure and creating pockets of severe deprivation. India’s experience with cities like Delhi, Mumbai, and Bengaluru demonstrates the consequences of reactive rather than proactive urban planning.
A national urbanization policy must facilitate the integration of rural-urban development, recognizing that cities and rural areas are interconnected components of a single system. Rural migration to cities is driven by the search for better livelihood opportunities, but without planned development, cities cannot absorb migrants productively. Furthermore, the policy must address the “top-heavy” nature of Indian urbanization, where a disproportionate share of development concentrates in a few megacities, leaving smaller towns and medium cities underdeveloped.
The role of policy in guiding sustainable and inclusive urbanization is fundamental. A well-articulated national urbanization policy provides the institutional, financial, and regulatory framework necessary to shape urban development in accordance with national development goals, constitutional principles, and environmental sustainability.
3. Objectives of the National Urbanization Policy
The National Urbanization Policy (NUP) should pursue multiple interconnected objectives:
Balanced Regional Development involves promoting the growth of cities across different regions and scales, not merely in existing metropolitan centers. This reduces urban congestion and creates employment opportunities in smaller cities, thereby stemming excessive migration to megacities.
Sustainable and Environment-Friendly Cities require integration of environmental considerations into urban planning. This includes promoting green spaces, managing waste systematically, reducing pollution, and building climate-resilient infrastructure. Cities must minimize their ecological footprint while improving quality of life.
Inclusive Growth and Affordable Housing aim at ensuring that urbanization benefits all sections of society. This involves providing affordable housing for low-income groups, preventing slum formation, and ensuring equitable access to urban services such as water, sanitation, and transportation.
Strengthening Local Governance and Citizen Participation recognizes that sustainable urban development requires democratically accountable local institutions and active community engagement in planning and decision-making processes.
Efficient Urban Infrastructure and Service Delivery ensures that cities have adequate roads, public transport, water supply, sanitation, electricity, and waste management systems to support their populations and facilitate economic activity.
4. Urbanization in the Indian Context
India’s urbanization pattern exhibits distinctive characteristics that shape the challenges and opportunities for policy formulation.
The pattern of urbanization in India is decidedly “top-heavy,” with disproportionate concentration in megacities. As of 2021, the National Capital Region (Delhi-NCR) had a population of 32 million, making it the world’s second-largest metropolitan area. Mumbai metropolitan area housed approximately 20.4 million people, and Bangalore, Hyderabad, and Chennai have emerged as major urban centers. Meanwhile, there are only 23 cities with populations exceeding 1 million, while thousands of small towns remain underdeveloped and infrastructure-deficient. This concentration creates severe congestion and environmental stress in megacities while starving smaller towns of investment and opportunities.
Rural-to-urban migration is a powerful demographic force reshaping India. Approximately 50 million people migrate internally annually, with a significant portion moving from rural to urban areas in search of employment and improved living standards. The proportion of rural workers in agriculture declined from 75% in 1991 to approximately 42% by 2021, reflecting a structural shift in the economy. However, most migrants end up in the informal sector, lacking job security, social protection, or adequate housing.
The growth of small and medium towns (SMTs) offers a potential counterweight to megacity concentration. Towns with populations between 100,000 and 1 million have grown at faster rates than megacities in recent years. These towns can serve as intermediate nodes in the urban hierarchy, absorbing migrants, providing local markets, and facilitating regional development.
Economic corridors and metropolitan regions, such as the Mumbai-Pune corridor, the Bangalore-Chennai industrial corridor, and the National Capital Region, play crucial roles in shaping urbanization patterns. These high-growth zones attract investment and talent but also intensify regional imbalances, as resources and opportunities concentrate in these corridors.
5. Basic Issues in Urbanization Policy in India
(a) Regional Imbalances
India’s urbanization is geographically uneven, with the Southern and Western regions accounting for a disproportionate share of urban growth. States like Maharashtra (48.8% urban population), Tamil Nadu (48.4%), and Gujarat (42.6%) are significantly more urbanized than states like Bihar (11.3%) and Odisha (16.7%). This imbalance perpetuates regional inequality, concentrates resources in prosperous regions, and leaves large areas with limited urban infrastructure or services. Policymakers must actively intervene to stimulate urbanization in backward regions through investments in tier-2 and tier-3 cities.
(b) Housing Shortages and Slum Proliferation
India faces a massive housing shortage. According to government estimates, approximately 19.1 million housing units were needed as of 2024, particularly for economically weaker sections (EWS) and low-income groups (LIG). Consequently, slums and informal settlements proliferate in urban areas. As of the 2011 Census, 104 million people (13.7% of urban population) lived in slums. Slum dwellers face precarious living conditions, poor sanitation, inadequate water supply, and vulnerability to eviction. The shortage of affordable housing remains one of the most pressing urban challenges.
(c) Infrastructure Deficiency
Indian cities suffer from acute infrastructure deficits across multiple dimensions. Transportation infrastructure remains inadequate, with per capita road length in Indian cities significantly lower than in developed countries. Water supply coverage varies widely, with rural and peri-urban areas often lacking adequate piped water systems. Sanitation infrastructure, while improving through missions like Swachh Bharat, remains incomplete in many cities. Approximately 90% of India’s wastewater remains untreated, causing severe water pollution. Electricity supply, though expanding, is unequal, with formal sectors receiving better access than informal settlements. The infrastructure deficit limits urban growth potential and affects quality of life.
(d) Unemployment and Informal Sector Dominance
Urban unemployment in India remains considerable, with an unemployment rate of approximately 7-8% as of recent surveys. More critically, approximately 80% of urban workers operate in the informal sector, lacking job security, social benefits, or legal protections. The informal sector includes street vendors, day laborers, construction workers, and domestic helpers who form the backbone of urban economies but remain marginalized in policy frameworks. Income inequality in cities is stark, with a Gini coefficient in urban areas around 0.55, reflecting significant disparity.
(e) Environmental and Ecological Challenges
Indian cities face severe environmental degradation. Air pollution in cities like Delhi reaches hazardous levels seasonally, with PM2.5 concentrations exceeding World Health Organization standards. Water pollution from untreated sewage and industrial waste contaminates rivers and groundwater. Waste management is inadequate, with many cities lacking integrated waste management systems. Urban heat islands effect reduces livability in dense cities. Climate change poses additional risks, with cities like Mumbai and Kolkata facing threats from rising sea levels and extreme weather events. Urban environmental challenges demand urgent policy interventions.
(f) Weak Urban Governance and Institutional Gaps
Despite the 74th Constitutional Amendment (1992), which devolved powers to Municipal Corporations, Municipal Councils, and Wards, urban governance remains weak. Municipal bodies often lack financial autonomy, depend heavily on state transfers, and suffer from limited revenue-raising capacity. Coordination between different urban agencies (water supply, sanitation, transport, planning) is poor. Capacity constraints, political interference, and lack of professional management hamper institutional effectiveness. Citizens’ participation in urban governance remains limited despite constitutional provisions for Ward Committees.
(g) Poor Urban Data and Planning Mechanisms
Indian cities suffer from inadequate data systems. The absence of comprehensive, real-time urban data hampers evidence-based planning. Many cities lack updated land-use maps, demographic profiles, or infrastructure inventories. Master plans, even when prepared, often become outdated and poorly implemented. The coordination between national, state, and municipal planning mechanisms is weak. This data deficit results in haphazard development, duplication of efforts, and inefficient resource allocation.
6. Government Initiatives and Policy Responses
The Indian government has launched several important urban development missions and policies to address these challenges:
Jawaharlal Nehru National Urban Renewal Mission (JNNURM) (2005-2015) was India’s first major centrally-sponsored urban development scheme, covering 63 cities with an investment of approximately ₹55,000 crores. JNNURM focused on infrastructure development, institutional strengthening, and governance reforms. While it achieved notable improvements in water and sanitation infrastructure, it faced criticisms regarding unequal implementation, debt burden on cities, and limited focus on affordable housing.
Smart Cities Mission (2015-ongoing) aims to develop 100 smart cities across India with a total investment of ₹98,000 crores. The mission focuses on sustainable infrastructure, technology integration, citizen participation, and quality of life improvements. Cities selected include Pune, Kochi, Jaipur, and Visakhapatnam. While ambitions are high, implementation challenges, including land acquisition issues, financing hurdles, and coordination problems, persist.
AMRUT (Atal Mission for Rejuvenation and Urban Transformation) (2015-ongoing) covers 500 cities with investments in water supply, sewerage, storm water drains, and transportation. With an initial allocation of ₹48,000 crores, AMRUT complements Smart Cities Mission by focusing on basic amenities. The mission has achieved tangible results, including improved water supply coverage and sanitation infrastructure in participating cities.
Pradhan Mantri Awas Yojana (PMAY-Urban) (2015-ongoing) aims to construct approximately 12 million affordable houses for economically weaker sections. As of 2024, over 11 million houses have been sanctioned, with significant numbers completed. PMAY represents a direct policy response to housing shortages and slum proliferation, though implementation challenges related to land availability and construction remain.
National Urban Transport Policy (NUTP) (2006) provides guidelines for sustainable urban mobility. It emphasizes public transport, non-motorized transport, and demand management. While progressive in conception, NUTP implementation varies significantly across cities, with many continuing car-centric development patterns.
7. Future Directions for Effective Urbanization Policy
Effective urbanization policy in India must pursue several forward-looking directions:
Strengthening Local Governance through meaningful implementation of the 73rd and 74th Constitutional Amendments is essential. This involves devising robust revenue-sharing mechanisms between national, state, and municipal governments; building municipal capacity through training and technology; and ensuring genuine citizen participation in urban planning and service delivery. Municipal governments must transition from administrative bodies to entrepreneurial institutions capable of innovative service delivery.
Promoting Tier-2 and Tier-3 Cities requires deliberate policy interventions including targeted infrastructure investments, business incubation centers, special economic zones in secondary cities, and regional development corridors. These cities must be positioned as attractive alternatives to megacities, offering employment opportunities, better quality of life, and sustainable growth potential.
Integrating Land Use and Transport Planning can reduce urban sprawl and congestion. Transit-Oriented Development (TOD) strategies, where residential and commercial development concentrates around public transport nodes, can reduce car dependency and improve urban efficiency. Mixed-use zoning can reduce travel distances and create vibrant neighborhoods.
Sustainable Urban Financing and PPPs must evolve beyond property tax-dependent revenue models. Cities should explore innovative financing mechanisms such as value capture taxes, congestion pricing, user fees for services, and green bonds. Public-Private Partnerships can leverage private sector efficiency while ensuring public interest protection. However, PPPs must be carefully designed to prevent monopolistic practices and ensure equitable service delivery.
Climate-Resilient and Inclusive Urban Planning becomes increasingly critical as climate change threatens cities with extreme weather events, flooding, and heat waves. Urban planning must incorporate climate adaptation strategies, nature-based solutions (green infrastructure, wetland conservation), and resilience-building measures. Simultaneously, planning must prioritize inclusive development, ensuring that informal sector workers, migrants, and low-income groups are not marginalized but integrated into urban development processes.
8. Conclusion
India’s rapid urbanization presents profound challenges and immense opportunities. A coherent, comprehensive National Urbanization Policy is essential to harness urbanization’s potential for economic growth, employment generation, and social advancement while mitigating its negative consequences. Such a policy must balance competing objectives: development and sustainability, growth and equity, metropolitan expansion and regional development. It must strengthen local institutions, improve governance, and ensure citizen participation.
The vision for future Indian cities should be encapsulated in three principles: “Smart, Sustainable, and Equitable.” Smart cities harness technology and data for efficient service delivery and citizen engagement. Sustainable cities minimize environmental impact, adapt to climate change, and preserve natural resources for future generations. Equitable cities ensure that urbanization’s benefits are widely distributed, that affordable housing and basic services are universally accessible, and that informal sector workers and marginalized groups are not left behind.
Realizing this vision requires sustained political commitment, adequate financing, institutional reforms, and social participation. It demands coordination across government levels, cooperation between public and private sectors, and genuine engagement with urban communities. The stakes are high: by 2050, India will have over 900 million urban residents. Whether these cities become engines of inclusive prosperity and sustainable development or center of inequality and environmental degradation depends on the quality of policy choices made today.
REFERENCES:
Shachar, A. S. (1971). Evaluation of national urbanization policy. Journal of the American Institute of Planners, 37(6), 362-372.
Wang, X. R., Hui, E. C. M., Choguill, C., & Jia, S. H. (2015). The new urbanization policy in China: Which way forward?. Habitat International, 47, 279-284.
Hamer, A. M., & Linn, J. F. (1987). Urbanization in the developing world: patterns, issues, and policies. Handbook of regional and urban economics, 2, 1255-1284.
National Urbanization Policy
ESSENTIAL GOVERNMENT DOCUMENTS
Ministry of Housing and Urban Affairs (MOHUA). (2015). Smart Cities Mission: Guidelines. Government of India. https://smartcities.gov.in/
Ministry of Housing and Urban Affairs (MOHUA). (2015). Pradhan Mantri Awas Yojana (PMAY-Urban): Guidelines and Operational Framework. Government of India. https://pmayurban.mohua.gov.in/
Ministry of Housing and Urban Affairs. (2015). AMRUT (Atal Mission for Rejuvenation and Urban Transformation): Guidelines. Government of India. https://www.pmayurban.gov.in/
Ministry of Statistics and Programme Implementation (MOSPI). (2023). Gross Domestic Product by Economic Activity (State Series). Government of India. https://mospi.gov.in/
CONSTITUTIONAL FRAMEWORK
Government of India. (1992). The 73rd and 74th Amendments to the Indian Constitution (Panchayati Raj and Municipal Governance Acts). https://www.indiacode.nic.in/
KEY RESEARCH STUDIES
Kundu, A. (2011). Urbanization and Migration: An Analysis of Trends, Patterns and Policies in India. Institute of Economic Growth, University of Delhi. https://ieg.ac.in/
Bhagat, R. B. (2011). Urbanization in India: An Overview. Indian Council of Social Science Research (ICSSR). https://www.icssr.org/
INTERNATIONAL REFERENCES
United Nations DESA. (2018). World Urbanization Prospects: The 2018 Revision. Department of Economic and Social Affairs, United Nations. https://population.un.org/wup/
Central Pollution Control Board (CPCB). (2022). Report on Air Quality in Indian Cities. Ministry of Environment, Forest and Climate Change, Government of India. https://www.cpcb.gov.in/
Ministry of Jal Shakti. (2022). National Water Quality Monitoring Report. Government of India. https://jalshakti-dowr.gov.in/
EMPLOYMENT STATISTICS
National Sample Survey Organization (NSSO). (2019). Periodic Labour Force Survey (PLFS): Employment Statistics. Ministry of Statistics & Programme Implementation. https://mospi.gov.in/
Urbanization is among the most revolutionary processes of our contemporary world. It can be understood as the higher level of aggregation of population in urban areas and the transformation of rural spaces into towns and cities. It is shaped by various forces acting together — socio-cultural, political, economic, and administrative. Urbanization influences the way people live, work, and relate to their habitat and thus is a subject of paramount importance in learning about sustainable development.
The rate of urbanization has expanded very fast in the 20th and 21st centuries as a result of industrialization, globalization, and technological advancements. Urban areas are now the principal drivers of growth, innovation, and job creation. However, the process comes with difficulties like inequality, housing deficit, and environmental degradation. Thus, understanding how factors affect urbanization assists in fostering more inclusive and balanced urban development.
2. Understanding Urbanization as a Process
Urbanization is not simply physical growth of cities but also a dynamic transformation of society and economy. It entails demographic change, economic reorganization, and change in cultural and social behavior. Industrial Revolution ushered in large-scale urbanization in Europe due to technological progress and job opportunities.
Now, globalization and technology advancement have transformed urbanization into a world phenomenon. As per the UN statistics, more than half of the world’s population now resides in cities, and this proportion is expected to increase to almost 70% by the year 2050. Cities account for over 80% of world GDP, illustrating the significance of cities as economic hubs. Urbanization is therefore both a cause and an effect of wider social and economic transformation.
3. Socio-Cultural Factors Driving Urbanization
Socio-cultural factors are among the most powerful drivers of urbanization. Urban areas provide greater access to education, healthcare, and social mobility, and thus individuals migrate from rural areas to achieve a higher standard of living. Migration frequently occurs not merely for economic purposes but also because of the need for social advancement, exposure, and contemporary lifestyles.
Cities promote cultural exchange, innovation, and diversity. Individuals from diverse backgrounds meet, sharing different traditions, languages, and food culture. This encounter gives rise to rich city cultures and new social norms. For example, Mumbai, Delhi, and Kolkata are melting pots where conventional and contemporary ways of life coexist.
In addition, urbanization has also changed gender roles and family formations. Education and work participation by women have improved considerably in urban areas, leading to empowerment and economic progress. Nevertheless, massive urbanization also has the potential to result in socio-cultural problems like eroding community identity, fraying of customary bonds, and emergence of slums.
4. Political Factors and Governance Influence
Urban expansion is greatly influenced by political stability, quality of governance, and policy-making. Governments decide upon land use, housing, infrastructure, and environmental policies that can directly impact urban development.
In India, the “74th Constitutional Amendment Act (1992)” gave power to urban local bodies to control important city functions like water supply, waste management, and planning. Decentralization of government has enhanced local responsibility and community participation. National efforts like the “Smart Cities Mission”, “AMRUT (Atal Mission for Rejuvenation and Urban Transformation)”, and “PMAY (Pradhan Mantri Awas Yojana)” showcase how political will can contribute towards sustainable and inclusive urban development.
Nonetheless, political intervention, irregular policies, and coordination issues between agencies frequently hold back effective urban management. For instance, Delhi and other cities have overlapping jurisdictions among municipal corporations, state governments, and central bodies that lead to inefficiencies in governance. Urbanization therefore thrives only when backed by open, participatory, and visionary political systems.
5. Economic Drivers of Urban Growth
Urbanization is based on economic prospects. Industrialization in the past spurred migration to cities for employment. Cities are still hubs of trade, industry, and services today.
The growth of the IT and services industries has spurred urbanization in India. Bengaluru, Hyderabad, and Pune have become international technology centers and are attracting skilled professionals and multinationals. Mumbai, being India’s financial hub, has witnessed steady urban growth with a diversified economic base in finance, entertainment, and trade.
Globalization has also connected cities to global markets, enabling the development of industries, logistics, and finance. Economic inequality within cities, however, is still a significant issue. While some neighborhoods are prosperous with good living standards, poverty and poor infrastructure characterize others. Urban planning, therefore, needs to focus on ensuring balanced access to opportunities and resources.
6. Administrative and Institutional Dimensions
Administrative and institutional considerations decide the extent to which a city is able to manage its expansion. Urban planning instruments like Master Plans , Zoning Regulations, and Development Control Rules are important in dictating spatial growth and the distribution of resources.
Cities that have good and effective administrative systems tend to perform better in resolving urban issues. For instance, Ahmedabad has made good use of planning instruments such as the Town Planning Scheme (TPS) to orchestrate land re-allocation and the provision of infrastructure.
Yet, many Indian cities are plagued by inefficient institutions, conflicting jurisdictions, and departmental non-coordination. Bureaucratic inefficiency, corruption, and tardy clearance slow down urban projects even more. Bringing in e-governance systems , digital mapping, and real-time monitoring can make city governance more transparent and effective. Administrative reforms are therefore necessary to enable planned and sustainable urbanization.
7. Interlinkages Between the Four Factors
Urbanization is a four-way, inter-linked process in which all four factors : socio-cultural, political, economic, and administrative , interact very closely.
Economic growth induces migration (a socio-cultural process), resulting in a growth of housing, transport, and services demand. This demands political and administrative intervention to increase infrastructure and governance capacity. Such governance encourages additional investment and economic activity, establishing a cyclical relationship between all factors.
For example, in Singapore, effective governance, economic planning, and cultural integration have established one of the world’s most livable and well-governed urban environments. In contrast, where these factors are in imbalance, cities tend to suffer from congestion, inequality, and low quality of life.
8. Global Perspectives: Comparative Examples
Urbanization proceeded differently by region:
Western Europe: Industrialization preceded urbanization and was bolstered by robust planning systems. Cities such as London and Paris developed as international hubs of commerce and culture based on early investment in infrastructure and regulation.
East Asia: Nations such as China and South Korea practiced state-directed urbanization. China’s post-1978 economic reforms built up cities such as Shanghai and Shenzhen as global economic leaders.
Africa and Latin America: Unplanned but fast urbanization has contributed to informal settlements and infrastructural strain. Lagos and Rio de Janeiro are among cities with congestion, inequality, and poor services.
These observations emphasize the need for coordinated governance, economic planning, and social inclusion in effective management of urbanization.
9. The Indian Urbanization Experience
India’s urbanization has changed dramatically since independence. In 1951, merely 17% of Indians resided in cities; nowadays, that proportion is more than 35%. This intense growth is influenced both by natural population growth and rural-urban migration.
During the early years, India concentrated on developing planned industrial cities like Bhilai, Rourkela, and Chandigarh for the purpose of regional balance. Economic liberalization since 1991 brought cities in contact with private investment, and the service sector has experienced huge growth.
Today, metropolitan areas such as Delhi, Mumbai, and Bengaluru serve as the drivers of national growth, whereas Tier-2 cities such as Indore, Surat, and Coimbatore are gaining prominence as new growth poles. National initiatives like the Delhi-Mumbai Industrial Corridor (DMIC), Smart Cities Mission, and Gati Shakti Master Plan focus on upgrading urban infrastructure and connectivity.
Despite this, unplanned urban expansion, poor housing, and ecological degradation are still major concerns. For India to attain sustainable urbanization, its planning agencies must be robust, it should encourage affordable housing, and it should invest in public transport as well as green belts.
10. Challenges and Future Prospects
Urbanization presents the potential for innovation and development, but it also presents challenges like:
Slums and overcrowding due to rural migration
Pollution and traffic congestion resulting from poor infrastructure
Water shortage and waste management challenges
Socio-economic disparity between formal and informal economies
The way forward for urbanization is embracing sustainable and inclusive practices. Ideas such as smart cities , green infrastructure and public engagement can transform cities to be more resilient and fair. Encouraging renewable energy, recycling of waste, public transportation that is efficient, and housing that is affordable are major steps.
Globally, such models as “Copenhagen’s sustainable urban planning” and “Singapore’s intelligent planning” can provide lessons to developing countries such as India.
11. Conclusion
Urbanization is a dynamic and complex process influenced by socio-cultural, political, economic, and administrative forces. When these forces work in harmony, cities can flourish as hubs of opportunity, innovation, and inclusiveness. When ignored, they result in congestion, inequality, and environmental stress.
Thus, sustainable urbanization demands a balanced strategy that marries good governance, robust institutions, and an engaged citizenry. The aim is not merely to expand the cities but to develop “better cities” , inclusive, robust, and sustainable for posterity.
12. References
Asghar Pilehvar, A. (2021). Spatial-geographical analysis of urbanization in Iran. Humanities and Social Sciences Communications, 8(1), 1-12.
Bhattarai, K., & Budd, D. (2019). Effects of rapid urbanization on the quality of life. In Multidimensional Approach to Quality of Life Issues: A Spatial Analysis (pp. 327-341). Singapore: Springer Singapore.
Suhartini, N., & Jones, P. (2019). Urbanization and urban governance in developing countries. In Urban Governance and Informal Settlements: Lessons from the City of Jayapura, Indonesia (pp. 13-40). Cham: Springer International Publishing.
Census of India (2011, 2021 projections)
UN-Habitat (2022) “World Cities Report”
Ministry of Housing and Urban Affairs, Government of India
Central Place Theory (CPT), proposed by the German geographer Walter Christaller in 1933, is a foundational model in spatial geography and urban theory that seeks to explain the size, spacing, and functions of settlements in a hierarchical system. It revolves around key ideas of threshold, range, and centrality, and posits an idealized, hexagonal pattern for market areas under certain assumptions. While the theoretical elegance of CPT has influenced urban planning, geography, and regional development, it also faces strong criticism for its simplifying assumptions and limited applicability in real-world, uneven landscapes. This essay introduces the theory, explains its components and variants (the K principles), discusses its strengths and limitations, and reflects on its continuing relevance in contemporary settlement planning and geography.
Introduction
How and why do settlements (villages, towns, cities) arrange themselves in particular patterns across a landscape? Why do some towns grow large and distant, while many small villages cluster closely? Geographers have long sought models to explain settlement patterns in relation to the provision of goods and services to surrounding populations. One of the most influential of these is Central Place Theory (CPT), formulated by Walter Christaller in his work Die zentralen Orte in Süddeutschland(Central Places in Southern Germany) in 1933.
Central Place Theory offers a spatial logic: settlements function as “central places” that provide goods and services to a surrounding area (its hinterland). Depending on the nature and specialization of their service functions, settlements form a hierarchy. The theory aims to explain the number, size, and spacing of these central places in a region. While its idealized assumptions rarely hold in full in reality, CPT nevertheless provides a vital conceptual framework for thinking about settlement systems, market areas, and planning decisions. In this essay, we describe the theory’s core components, its variants (the K-principles), its merits and drawbacks, and its contemporary significance.
Description / Discussion
Basic Concepts: Central Place, Range, Threshold, Hinterland
A central place is a settlement (village, town, or city) whose primary function is to supply goods and services to people in its surrounding area.
The hinterland (or market area / sphere of influence) of a central place is the region from which its consumers are drawn.
Threshold is the minimum population (or economic demand) required to support a particular good or service. If the population is below the threshold, the service is not viable.
Range is the maximum distance consumers are willing to travel to acquire a good or service. When the cost or inconvenience becomes too great, consumers will instead go to a closer central place that offers the same service.
These two parameters (threshold and range) help define the size and shape of a central place’s market area, and influence which levels of services can be sustained at each settlement.
Hierarchy of Settlement
Hamlet: fewest goods and services available.
Village: includes the region of the hamlet and some additional goods and services.
Town: includes the region of the village and hamlet and provides some additional goods and services.
City: includes the region of the village, hamlet and town and provides additional goods and services.
Assumptions of the Theory
For the sake of creating a clean, predictable model, Christaller built CPT upon several simplifying assumptions. These assumptions are rarely fully met in real landscapes, but they allow theoretical analysis and prediction. Some of the key assumptions are:
The region is an isotropic plain (flat, no variation in terrain) with no physical barriers.
Population is evenly distributed throughout the plane, and all consumers have roughly equal purchasing power.
Resources (economic opportunities) are uniformly distributed.
Transportation is equally easy in all directions; transport cost is proportional to distance (and there is only a single mode of transport).
Consumers patronize the closest central place that offers the desired good or service (minimizing travel).
Central places maximize their market area without overlapping (i.e., no redundant service areas).
Given these assumptions, Christaller derived a regular, systematic pattern of central places.
Christaller’s Model and K-Principles
Under the above assumptions, Christaller showed that central places would tend to be arranged in a hexagonal lattice pattern (to avoid gaps or overlaps in service areas). Instead of circular market areas (which would either overlap or leave gaps), hexagons tessellate neatly.
Christaller also introduced variants (often called K-principles) that show different organizational logics depending on whether marketing, transport, or administrative factors dominate. The main ones are:
K = 3, the Marketing Principle: This principle emphasizes the idea of minimizing distance consumers travel, so that a higher-order center receives one-third of the market area of each adjacent lower-order center. In practice, six lower-order centers surround a higher-order center, with each contributing a share.
K = 4, the Transport (Traffic) Principle: The structure is arranged so as to reduce transport cost (minimize total road length). Under K = 4, a higher-order center captures half of the market area of each of six neighboring lower-order settlements.
K = 7, the Administrative Principle: This prioritizes administrative control. Each higher-order center completely encloses the territories of six subordinate centers (so the hierarchic nesting is clear and nonoverlapping).
Thus, depending on which logic dominates in a region (market efficiency, transport economy, or administrative governance), the settlement pattern might more closely resemble one of these K variants.
Hierarchy and Spatial Predictions
From this model, Christaller derived a number of generalizations about settlement systems:
A greater number of small, low-order settlements and fewer large, high-order settlements.
Larger settlements (with high-order functions) are spaced farther apart than smaller ones.
Higher-order services (hospitals, universities, specialized goods) are located only in the larger central places, since they have higher thresholds and are viable over larger ranges.
Settlements of the same order should be equidistant from each other in a regular pattern.
The shape of market areas ideally becomes hexagonal to avoid overlaps and gaps.
Strengths and Applications (Merits)
Central Place Theory, despite its limitations, offers several valuable insights:
Theoretical clarity: It gives a logical, structured way to think about how settlements and services might spatially organize.
Predictive power: Under certain idealized conditions, it can predict spacing, size, and function of settlements.
Framework for planning: Urban planners and regional developers can use CPT as a guide for organizing service centers, facilities, marketplaces, or infrastructure.
Comparative baseline: Although real geography is messy, deviations from CPT can be instructive (i.e., by studying how real systems diverge from the ideal).
Cross-cultural and historical use: The theory has been applied in various geographical contexts (e.g. parts of Europe, North America, India) to analyze settlement hierarchies and development planning.
Critiques and Limitations (Demerits)
However, CPT has been extensively critiqued, and many of its assumptions break down in real-world settings:
Unrealistic assumptions: Very few real regions have perfectly flat terrain, uniform population, or homogeneous transport costs.
Variation in consumer behaviour: Consumers differ in income, preferences, mobility, and willingness to travel; they don’t always go to the closest center.
Multiple modes of transport: Modern transport networks (roads, rail, air) and varying cost regimes distort the simple distance assumption.
Natural and political barriers: Rivers, mountains, borders, administrative boundaries, and planning constraints often disrupt the ideal pattern.
Historical path dependence: Settlement patterns are often legacy of history, trade routes, colonization, or power, not pure spatial optimization.
Non-uniform service functions: Some places may offer specialized services for reasons unrelated to population thresholds (tourist centers, pilgrimage sites, administrative capitals).
Scale issues: At different scales (local vs national), the regularity of CPT may not hold.
Modern economies and technology: Telecommunication, e-commerce, and digital services reduce the importance of physical distance, weakening the relevance of the classical range and threshold notions.
Some modern geographers have even used fractal or complexity-based models to better describe settlement patterns, arguing that real human settlement networks show irregular, scale-free, or self-similar structures that deviate from the perfect lattice of CPT.
Contemporary Relevance and Adaptation
Even though its original assumptions are idealistic, CPT continues to be a valuable conceptual tool. Contemporary studies seek to adapt or extend it:
Integrating economic complexity indices and data analytics to measure centrality beyond simple population and services.
Using network theory and fractal geometry to allow irregular settlement patterns while preserving hierarchical relationships.
Applying CPT logic to service location planning, retail site selection, and infrastructure zoning, while relaxing strict assumptions to allow real-world constraints.
Considering multi-modal transport, communication technology, and varying demand patterns in updated models.
Thus, CPT’s value is not in literal replication of its ideal pattern but in offering a baseline, heuristic framework to assess, compare, and plan human settlement systems.
Conclusion
Central Place Theory remains one of the classic models in geography and spatial planning. Its strength lies in providing a clear, logical structure — anchored in the ideas of threshold, range, and hierarchical centrality — to analyze settlement systems. Christaller’s elaboration of K = 3, 4, and 7 variants shows how different organizing principles (marketing, transport, administration) shape settlement layouts. However, the theory’s many idealizing assumptions limit its direct application in real terrain, demographic complexity, and modern technological conditions.
Nevertheless, the deviations from CPT in real systems are as interesting as the theory itself — they reveal the influence of history, geography, political boundaries, infrastructure networks, and technological change. In modern planning, CPT still informs decisions about service location, urban hierarchy, market coverage, and spatial strategy — albeit in more flexible, hybrid models that integrate empirical data, network analysis, and local constraints.
Reference
Berry, B. J., & Garrison, W. L. (1958). A note on central place theory and the range of a good. Economic geography, 34(4), 304-311.
Clark, W. A., & Rushton, G. (1970). Models of intra urban consumer behavior and their implications for central place theory. Economic Geography, 46(3), 486-497.
Dacey, M. F. (1965). The geometry of central place theory. Geografiska Annaler: Series B, Human Geography, 47(2), 111-124.
Mulligan, G. F. (1984). Agglomeration and central place theory: A review of the literature. International Regional Science Review, 9(1), 1-42.
The study of population has evolved over centuries from simple headcounts to complex analyses of demographic, social, and economic variables that explain human distribution, growth, and movement. Initially rooted in philosophical and religious explanations of human reproduction and mortality, population studies gradually became a scientific discipline with the emergence of demography in the seventeenth and eighteenth centuries. From early censuses in ancient civilizations to modern-day demographic modeling and big data analytics, the field has expanded both in scope and methodology. This essay traces the chronological development of population studies, highlighting key theoretical contributions, methodological advancements, and the increasing relevance of population data in understanding development, urbanization, and policy planning.
1. Introduction
Population studies—or demography—deal with the scientific study of human populations, focusing on their size, structure, distribution, and changes over time due to births, deaths, and migration. The subject lies at the intersection of geography, sociology, economics, and public health. The evolution of population studies reflects humanity’s growing understanding of the relationship between population dynamics and socio-economic development. Over time, demographic research has expanded from simple enumeration to sophisticated analyses addressing fertility behavior, migration patterns, mortality trends, and population policies.
2. Early Origins of Population Study
2.1 Ancient Civilizations and Enumeration
The earliest form of population study can be traced back to ancient civilizations such as Egypt, Babylon, China, and Rome, where rulers conducted censuses to assess taxation, military service, and resource management.
The Babylonian Empire (around 3000 BCE) recorded agricultural and population data on clay tablets.
Ancient China under Emperor Yao (around 2238 BCE) conducted population counts to manage land and resources.
The Roman Empire held regular censuses (from 6th century BCE), laying a foundation for systematic population enumeration.
Although these early records were not analytical in a modern sense, they demonstrated the recognition of population as an essential element of state administration.
2.2 Religious and Philosophical Interpretations
In the pre-scientific era, population changes were often explained through religious or moral frameworks. Many ancient texts—such as the Bible or the Vedas—contained observations on fertility, mortality, and migration, but these were often linked to divine will. Philosophers like Aristotle and Plato also discussed population in the context of ideal state size and social order, marking early theoretical thinking.
3. The Birth of Demographic Thinking (17th–18th Century)
3.1 John Graunt and the Statistical Revolution
The formal study of population began in the seventeenth century with John Graunt’s pioneering work “Natural and Political Observations Made upon the Bills of Mortality” (1662). Graunt analyzed birth and death records in London, identifying regularities in mortality rates and age-specific patterns. His work is widely regarded as the foundation of modern demography, introducing concepts like life expectancy and vital statistics.
3.2 William Petty and Political Arithmetic
Graunt’s contemporary, Sir William Petty, extended his ideas into what he called “Political Arithmetic”—the use of numerical data to inform governance and policy. Petty and Graunt together transformed population study from simple record-keeping into an early statistical science.
3.3 The Malthusian Theory
The most influential early theory of population was proposed by Thomas Robert Malthus in his “Essay on the Principle of Population” (1798). Malthus argued that population grows geometrically while food supply increases arithmetically, leading to inevitable shortages and crises unless checked by “positive” (famine, disease) or “preventive” (moral restraint) factors. The Malthusian Theory profoundly influenced 19th-century social thought, shaping debates on poverty, industrialization, and public policy.
4. The Classical Period (19th Century)
4.1 Expansion of Census Systems
During the nineteenth century, systematic national censuses became common across Europe and the Americas.
The first modern census was conducted in Sweden in 1749, followed by the United States in 1790.
By the mid-19th century, censuses became standardized instruments for population data collection, providing valuable insights into demographic change during industrialization.
4.2 Neo-Malthusian Thought
In response to rising population and urban crowding, the Neo-Malthusian movement advocated for birth control and family planning as a rational method of population control. Thinkers like Francis Place and John Stuart Mill promoted the use of contraception, marking the beginning of social reform movements grounded in demographic reasoning.
4.3 Emergence of Vital Statistics
The 19th century also witnessed the development of vital registration systems, which systematically recorded births, deaths, and marriages. Statisticians such as William Farr in England advanced quantitative techniques to analyze mortality and morbidity patterns, linking them to social and environmental conditions. This period marked the consolidation of demography as both a statistical and social science.
5. The Modern Scientific Era (20th Century Onwards)
5.1 The Demographic Transition Theory
One of the most significant theoretical advances in the 20th century was the Demographic Transition Theory (DTT), developed by demographers such as Frank W. Notestein and Warren Thompson. The theory describes population growth in stages—from high birth and death rates (pre-industrial societies) to low rates (industrial societies)—illustrating how economic development influences demographic behavior. This model provided a universal framework to compare countries at different stages of modernization.
5.2 Quantitative and Statistical Innovations
The early 20th century saw major progress in statistical demography, including life tables, age-sex pyramids, and population projections. Governments and international organizations (like the League of Nations and later the UN) began using demographic data for planning, health policy, and development.
5.3 United Nations and Global Demographic Surveys
After World War II, the United Nations (UN) and its agencies—particularly UNFPA (United Nations Population Fund)—played a vital role in promoting population censuses and surveys worldwide. Projects like the World Fertility Survey (1970s) and Demographic and Health Surveys (DHS) standardized data collection globally, enabling cross-national comparisons and research on fertility, mortality, and family planning.
5.4 Population and Development Linkages
The 1950s–1970s marked growing concern over the relationship between rapid population growth and economic development, especially in developing countries. This led to the Population and Development paradigm, linking demographic behavior with employment, education, and urbanization. The Cairo International Conference on Population and Development (ICPD, 1994) redefined the field by emphasizing reproductive rights, gender equality, and human development as integral components of population policy.
6. The Contemporary Era: Technological and Theoretical Expansions
6.1 Spatial Demography and GIS Applications
From the late 20th century onwards, Geographic Information Systems (GIS) revolutionized demographic research. Spatial demography emerged as a subfield combining population data with spatial analysis to study settlement patterns, migration flows, and urban expansion. This allowed planners to visualize population densities, service accessibility, and regional inequalities with unprecedented accuracy.
6.2 Big Data and Computational Demography
In the 21st century, digital technologies have expanded data sources far beyond traditional censuses and surveys. Big data, such as mobile phone records, satellite imagery, and online activity, now complement traditional demographic methods. Researchers use machine learning models to predict migration, estimate informal settlements, and project urban population changes in real time.
6.3 Social and Environmental Dimensions
Modern demography increasingly recognizes the interconnections between population dynamics and environmental change. Concepts like population-environment nexus, carrying capacity, and climate migration have become central to global policy discourse. Furthermore, population aging, declining fertility, and urban overcrowding present new challenges for both developed and developing nations.
6.4 Interdisciplinary Integration
Population studies today integrate insights from economics, public health, anthropology, and data science. This interdisciplinary approach helps address emerging issues such as pandemics, inequality, and sustainable development. The field now plays a crucial role in achieving the United Nations Sustainable Development Goals (SDGs), particularly those related to health, education, and urban sustainability.
7. Key Theories and Models in Population Study
Over time, several key theories have shaped population study:
Malthusian Theory – Population growth tends to outstrip resources.
Demographic Transition Theory – Describes population change through modernization.
Marxist Perspective – Emphasizes socio-economic structures as causes of overpopulation and poverty.
Optimum Population Theory – Proposes an ideal population level for maximum per capita output.
Biological Theories – Relate reproduction and mortality to biological and genetic factors.
Boserup Theory – Suggests population pressure stimulates technological innovation and agricultural intensification. These models collectively represent the evolution of thought regarding how populations interact with their environment and economy.
8. Population Studies in India
India has a rich tradition of demographic inquiry.
The first modern Indian census was conducted in 1872, and since 1881, it has been held regularly every ten years.
Institutions like the International Institute for Population Sciences (IIPS), Mumbai, and programs like the National Family Health Survey (NFHS) have advanced population research in areas such as fertility, health, and gender.
Indian demographers have contributed significantly to understanding issues of population explosion, urbanization, and migration, especially in the post-independence development context.
9. Challenges and Future Directions
Despite enormous progress, population studies face several challenges:
Data quality and comparability across countries.
Privacy and ethics in using digital demographic data.
Rapid urbanization and migration, which complicate enumeration.
Climate change impacts, leading to new forms of displacement. Future research must focus on integrating human mobility, aging populations, and sustainability into demographic frameworks, using advanced modeling and participatory approaches.
10. Conclusion
The evolution of population study mirrors humanity’s quest to understand itself—how societies grow, decline, and transform. From ancient enumerations to modern computational demography, the discipline has evolved into a vital tool for planning and policy-making. Its interdisciplinary nature allows it to address global challenges such as aging, migration, and environmental stress. As the 21st century unfolds, the integration of technology and human-centered policy will define the next phase of demographic research, ensuring that population study continues to inform sustainable and equitable development worldwide.
References
Graunt, J. (1662). Natural and Political Observations Made upon the Bills of Mortality. London.
Malthus, T. R. (1798). An Essay on the Principle of Population. London.
Farr, W. (1852). Vital Statistics: A Memorial Volume of Selections from the Reports and Writings of William Farr.
Notestein, F. W. (1945). “Population—The Long View.” In Food for the World, University of Chicago Press.
Thompson, W. S. (1929). “Population.” American Journal of Sociology, 34(6).
United Nations (1958). The Determinants and Consequences of Population Trends. New York.
United Nations Population Fund (UNFPA) (1994). International Conference on Population and Development (ICPD) Programme of Action.
Boserup, E. (1965). The Conditions of Agricultural Growth: The Economics of Agrarian Change under Population Pressure.
Weeks, J. R. (2015). Population: An Introduction to Concepts and Issues. Cengage Learning.
Dyson, T. (2010). Population and Development: The Demographic Transition. Zed Books.
Bongaarts, J. (2001). “The End of the Fertility Transition in the Developed World.” Population and Development Review.
International Institute for Population Sciences (IIPS). (2021). National Family Health Survey (NFHS-5): India Report.
Cohen, J. (1995). How Many People Can the Earth Support? W.W. Norton & Company.
Lutz, W., Sanderson, W., & Scherbov, S. (2001). “The End of World Population Growth.” Nature, 412(6846): 543–545.
Globalization refers to the process of increasing interconnection and integration among nations through flows of goods, capital, ideas, people, and technology. While it has produced significant economic benefits — such as increased productivity, access to foreign investment, and global market expansion — it has also raised challenges: disruption of local industries, growing inequality, cultural homogenization, and environmental stresses. This essay examines what globalization is, its driving factors, the positive and negative consequences, with particular focus on India’s experience since liberalization in 1991. The essay argues that while globalization has been a powerful engine of growth and modernization, its benefits must be managed with careful policy, and its costs mitigated through inclusive strategies.
Introduction
In the contemporary era, the notion of a “world without boundaries” is no longer purely metaphorical. Globalization has emerged as one of the defining forces that shape politics, economy, culture, and society. The concept implies that national borders and barriers become more porous to trade, investment, information, and migration. Globalization does not mean the absence of national sovereignty or diversity, but rather accentuates interdependence among nations. In India, the process gained momentum from the early 1990s, when liberalization, privatization, and opening to foreign investment were adopted as core policy shifts. As this essay will show, globalization has generated both opportunities and pitfalls. Understanding its mechanisms, outcomes, and the Indian case helps us discern how to harness its potential while minimizing its downsides.
Description / Discussion
What Is Globalization?
Globalization is the process by which countries, businesses, and people across the world become increasingly connected and interdependent. It involves the free flow of goods, services, information, ideas, technology, and people across national borders. This phenomenon has been accelerated by advancements in communication, transportation, and digital technology, which have made the world more integrated than ever before.
Economically, globalization promotes international trade and investment, allowing companies to operate in multiple countries and consumers to access products from around the world. Culturally, it leads to the exchange and blending of traditions, lifestyles, and values, creating a more interconnected global society. Politically, it encourages cooperation between nations through global institutions such as the United Nations and World Trade Organization.
However, globalization also presents challenges. It can widen the gap between rich and poor nations, threaten local cultures, and strain natural resources due to overproduction and consumption. Despite these drawbacks, globalization remains a powerful force shaping modern society. It influences how we work, communicate, and solve global issues, making the world more unified but also more complex. In essence, globalization represents both opportunity and responsibility for nations to collaborate and progress collectively.
Thus, globalization is not only about economics, but also about power structures, cultural exchange, and institutional alignment.
Types of Globalization
1. Economic: Countries that trade with many others and have few trade barriers are economically globalized.
2. Social: A measure of how easily information and ideas pass between people in their own country and between different countries (includes access to internet and social media networks).
3. Political: The amount of political co-operation there is between countries.
Driving Forces / Reasons for Globalization
Several forces propel the process of globalization:
Technological advances: Improvements in communication (internet, mobile phones), transportation (air freight, containerization), and logistics have lowered the cost and time of moving goods, people, and ideas.
Economies of scale & competitive pressures: Firms seeking larger markets push to expand across borders to remain efficient and competitive.
Liberalization policies: Many countries have reduced trade barriers, deregulated capital flows, and encouraged foreign direct investment (FDI).
Market saturation at home / resource seeking: Firms look outward when domestic markets mature or when natural resources, labor, or new markets lie abroad.
Global institutions and rules: Multilateral trade agreements (WTO), regional trade blocs, and investment treaties provide a framework that fosters cross-border flows.
Ideological shifts & political will: The dominance of neoliberal economic thinking in late 20th century encouraged freer markets, privatization, and global integration.
These factors, acting in reinforcement, have accelerated the pace and depth of globalization.
Effect of Globalization
Globalization has significantly transformed the world by increasing interconnectedness among countries. It promotes economic growth through trade, investment, and job opportunities, while also spreading technology, culture, and ideas across borders. However, it can lead to income inequality, exploitation of labor, and loss of local cultures. Politically, it fosters international cooperation but can reduce national sovereignty. Environmentally, globalization raises awareness about global issues like climate change but also contributes to resource depletion and pollution. Overall, globalization creates a more integrated world, offering vast opportunities for development while posing serious challenges that require balanced and sustainable management.
Advantages / Positive Impacts of Globalization
Globalization brings a number of potential benefits:
Higher productivity and growth: Access to global capital, technology, and knowledge helps countries modernize industries and enhance growth.
Access to foreign investment: FDI brings capital, management practices, technology transfer, and jobs.
Expanded trade and market access: Producers can reach international markets; consumers get access to a wider variety of goods at lower cost.
Competition and efficiency: Domestic firms face international competition, spurring innovation and efficiency gains.
Spillovers in technology and human capital: Cross-border diffusion of research, skills, and ideas helps domestic firms catch up.
Cultural exchange: Exposure to global cultures, ideas, and networks fosters innovation, diversity, and cosmopolitan outlooks.
Global cooperation on shared challenges: Issues such as climate change, pandemics, and terrorism require cross-border collaboration, which is easier in a globally integrated world.
Disadvantages / Negative Impacts of Globalization
However, globalization also entails serious risks and costs:
Displacement of local industries: Local firms, especially small and traditional ones, may be outcompeted by cheaper imports or multinationals.
Increased inequality: Benefits often skew to skilled, connected, or capital-rich groups, exacerbating the gap between rich and poor.
Vulnerability to external shocks: Economies become more susceptible to global financial crises, commodity price swings, or contagion.
Cultural homogenization: The dominance of global (often Western) cultural products may erode local traditions and identities.
Environmental degradation: Increased production, transportation, and resource use can strain ecosystems and accelerate climate change.
Regulatory challenges: Global firms may exploit loopholes, tax havens, or weaker regulatory frameworks.
Loss of policy space: Nations may feel constrained in imposing social protections, tariffs, or capital controls, lest they deter foreign capital.
Globalization in the Indian Context
Pre-1991 India
After independence, India adopted an inward-looking, controlled economy with licensing, high tariffs, and strict regulation of foreign investment. Economic growth was modest, and the “license Raj” limited private enterprise expansion.
The 1991 Reforms & Opening Up
Facing a severe balance of payments crisis in 1991, the Indian government embarked on sweeping reforms: liberalization, privatization, and global integration. Key measures included:
Abolishing industrial licensing
Reducing import tariffs and quotas
Encouraging foreign direct investment
Reforming fiscal and public sector policies
Relaxing controls over capital flows
Indian policymakers increasingly viewed outward orientation and global linkages as essential to growth.
Positive Impacts in India
Rapid growth: India’s GDP growth accelerated in the decades following liberalisation.
Influx of foreign capital: The IT, pharmaceutical, telecom, and services sectors attracted large FDI and foreign partnerships.
Export growth: India became more integrated into global supply chains in software, textiles, and services.
Technology and knowledge transfer: Indian firms adopted global best practices and leveraged innovation.
Job creation in new sectors: The services and software sectors provided new employment opportunities, especially for skilled youth.
Rising global recognition: India’s presence in global forums, trade, and diplomacy expanded.
Negative and Challenging Impacts in India
Unequal gains: Urban, educated, and connected groups benefited more; rural and unskilled populations saw fewer benefits.
Agrarian distress: Small farmers faced price shocks, competition, and limited access to global markets.
Displacement of small-scale industries: Traditional crafts and small enterprises struggled against cheaper imports.
Employment concerns: While new jobs were created, many were in informal or contractual sectors with weak social security.
Vulnerability to global crises: India’s economy was impacted by global downturns (e.g., 2008 financial crisis).
Cultural stress: Exposure to global media and consumption patterns has created tensions over identity and cultural values.
In sum, globalization has transformed India in profound ways — structurally, economically, and socially — but its benefits have not been uniformly shared.
Conclusion
Globalization is a multifaceted force. It brings tremendous opportunities — economic growth, technology transfer, trade expansion, cultural exchange — but also imposes significant challenges: inequality, disruption, environmental stress, and policy constraints. The experience of India illustrates this dual nature: since the 1990s, the country has grown more dynamic, open, and globally engaged, yet many citizens, especially in rural and marginal sectors, continue to face the costs of adjustment.
Therefore, globalization should not be accepted or rejected uncritically; it must be managed. Policy measures like social safety nets, investment in education/skills, protecting nascent domestic industries, progressive taxation, environmental regulation, and trade policy that balances openness with welfare can help mitigate the downsides. In the end, the goal should be to harness global connectivity to foster inclusive, sustainable development.
Reference
Beck, U. (2018). What is globalization?. John Wiley & Sons.
Robertson, R., & White, K. E. (2007). What is globalization?. The Blackwell companion to globalization, 54-66.
Smith, K. E. I. (2018). What is globalization?. In Sociology of globalization (pp. 3-10). Routledge.
This essay explores the fundamental challenge of measuring human populations, health planning, and resource allocation. While demography aims for precise statistics on fertility, mortality, and migration, a pervasive global data gap often makes traditional counting impossible. The discussion includes the direct and indirect measures, their precision and limitations, methods used for measuring. The conclusion offers a strong case for why Direct and Indirect Measures are essential partners—they truly can’t survive without each other in the real world of demographic research.
1. Introduction
Demography, in its most basic sense, is the mathematical and statistical analysis of human populations. It aims to grasp the three main processes that govern population dynamics: fertility, mortality, and migration.
But acquiring this information is seldom easy. The data is collected with the means of two measures: direct measures and indirect measures. Direct measures, the “gold standard,” strive towards near-perfect accuracy from complete primary sources. Indirect measures, necessity and statistical creativity, employ mathematical models and empirical population theory to derive sound estimates from incomplete or unorthodox data. Knowledge of the strengths, limitations, and synergistic use of these two methods is at the heart of contemporary demography.
2. Direct Measures: The Gold Standard of Precision
Direct measurement is the gathering of demographic statistics directly from sources that are specifically created to note down a population occurrence as it actually happens or to enumerate the population at a given point in time. These statistics yield the most precise and detailed statistics when applied fully and successfully.
The validity of direct measurements relies chiefly on two conventional institutional supports: the Population Census and the Vital Registration System (VRS).
2.1. The Population Census
A census is a complete, systematic enumeration and collection of demographics, economic, and social information for all the individuals in a given area at a particular moment. Usually taken every ten years, the census is the major source for the denominator in most demographic rates—the population at risk—and is the basis for population distribution and structure data.
Key Indicators: Total population size is directly measured by the census, as well as age-sex structure (the basis of all demographic analysis), household composition, and geographical distribution. It is also the main source for the measurement of lifetime migration (through questioning about place of birth versus where residents are living now) and internal migration (through questions about residence at a fixed number of years past).
2.1.1. Precision and Limitations
When carried out flawlessly, the census provides a peerless picture of the population. Censuses, however, are prone to some major pitfalls:
2.1.2. Coverage Error
Missing individuals (underenumeration, typical with floating or marginalized populations) or enumeration of individuals twice (overenumeration).
2.1.3. Content Error
Misstating qualities, most significantly age heaping (reporting ages ending in 0 or 5).
2.1.4. Infrequent Data
The once-a-decade character results in the data becoming outdated rapidly, particularly in regions with rapid population change.
2.2. The Vital Registration System (VRS)
The VRS is a legal administrative system to record continuously and permanently the occurrence and characteristics of vital events (live births, deaths, marriage, divorces, etc.). While the census gives the stock (the population itself), the VRS gives the flow (the changes in the population).
Key Measurements: The VRS is the primary source for the calculation of crude birth rates, crude death rates, and most importantly, Age-Specific Fertility Rates (ASFRs) and Age-Specific Death Rates (ASDRs). These rates in detail are necessary for the preparation of life tables and complex population projections.
2.2.1. Precision and Limitations
An entire VRS provides the best quality of data, with the possibility to analyze timely, yearly, or even monthly. But the completeness of VRS is extremely different around the world. In the majority of low- and middle-income nations, coverage is less than 50% owing to inferior infrastructure, low literacy rates, and cultural customs (e.g., home delivery). When coverage is inadequate, the data cannot be used for direct measurement and has to be indirectly adjusted.
2.3. Demographic and Health Surveys (DHS)
Large-scale, internationally standardized sample surveys, such as the Demographic and Health Surveys (DHS), serve as a bridge in settings where VRS is weak. Technically a sample, the data are gathered directly using questionnaires.
Key Indicators: DHS directly measures fertility by interrogating women on their full birth histories (retrospective information on all children ever born, their birth date, and survival status). It directly measures child mortality from these birth histories.
2.3.1. Precision and Limitations
Surveys provide good-quality data (since they use trained interviewers) but are prone to recall bias (women forgetting or misdating events, especially older ones) and sampling error, since they represent a sample, not a census.
3.Indirect Measures: Estimation Through Models and Theory
Indirect methods are the demographer’s primary instruments for putting forth efforts on incomplete, bad, or non-traditional data. They depend on proven mathematical models, theory of the population (including the theory of the stable population), and specific data interrelationships to derive useful estimates of demographic parameters.
Indirect methods are most common in three situations:
Data-Deficient Settings: Mortality and fertility estimation in nations with bad VRS and few resources.
Historical Demography: Quantifying parameters in populations where only partial records are available.
Cross-Validation: Verifying consistency and plausibility of direct measurements in situations where quality of data is likely low.
4. Underlying Principles of Indirect Estimation
The effectiveness of indirect methods is dependent upon fundamental theoretical relationships that apply to most human populations:
The relationship between adult survival and parental survival.
The relationship between infant/child mortality and children’s survival.
The organization of stable and quasi-stable populations (in which fertility and mortality rates have been constant or have changed slowly).
5.Key Indirect Methods in Fertility and Mortality
The most important advances in indirect estimation result from the contributions of William Brass and his coworkers, who use readily available data from censuses or single-round surveys to make estimates of vital rates.
5.1. The Brass P/F Ratio Method (Fertility)
The P/F ratio approach is probably the best-known indirect method, intended to revise the reported level of current fertility based on information on children ever born (CEB).
The Data: The approach applies two different kinds of data:
P (Parity): The mean ever born number of children reported by women within various age groups (a measure of cumulative or lifetime fertility). It is generally reliable among young women but is affected by omission/recall bias in older women.
F (Fertility): Average number of children women have borne in the past year (or recent interval) computed from those reported recent births (a measure of recent fertility). This tends to be underreported but the pattern by age is generally accurate.
The Model: The approach estimates the ratio of the correct pattern of fertility (from the F data) to the right level of fertility (from the P data for younger, less-biased women). It presumes the pattern of fertility is right, and applies the P/F ratio from younger women to adjust the total level of the recent fertility schedule (F), thus giving a corrected Age-Specific Fertility Rate (ASFR) schedule.
5.2. The Orphanhood Method (Adult Mortality)
For estimating adult mortality, particularly in settings where there is no death registration, the Orphanhood Method applies.
The Data: Respondents are queried whether their parents are alive or not. For instance, “Is your mother alive?” or “Is your father alive?”
The Model: The ratio of survey respondents whose mother (or father) is deceased is used to estimate the conditional probability of survival for parents. By knowing the respondent’s and mother’s age, demographers employ model life tables to translate the ratio of orphans into a complete measure of adult mortality, usually in the form of the probability of survival from age 20 to age 60.
5.3. The Widowhood Technique (Adult Mortality)
Like orphanhood, the technique relies on spousal survival to measure adult mortality.
The Data: Survivals of first spouses are reported by individuals.
The Model: Responses reporting that the first spouse is dead are translated through modeling to produce an estimate of adult mortality, often for the sex whose survival is being ascertained (e.g., women reporting about husbands’ survival estimates male mortality).
5.4. The Reconstructed Birth History Method (Child Mortality)
This technique, frequently employed with DHS data, estimates Infant and Child Mortality Rates (IMR and CMR) on the basis of the straightforward query: “Of the children you have ever had, how many are still alive?”
The Data: Cumulative data on children ever born (CEB) and children surviving (CS).
The Model: The ratio of dead children to ever-born children is cross-tabulated by mother’s age group. These rates are then translated, via mathematical models (e.g., the ones constructed by Trussell), into conventional measures of child mortality (e.g., probability of dying before one year, or before five years). The main strength is that the method is successful in time-locating the mortality estimates, tying the cumulative data back to recent historical periods.
6. The Critical Synergy: Complementarity and Cross-Validation
Direct and indirect measures are not in competition with each other, but are rather the essence of complementarity. Together, they constitute a system of checks and balances essential to constructing a defensible and coherent demographic profile under conditions of low data availability.
6.1. Indirect Measures Validating Direct Data
In most countries, the VRS results are considered a “direct” measure, but their completeness is quite doubtful. In this case, indirect procedures are employed to check the plausibility of the direct estimates.
If a nation’s registered Crude Death Rate (CDR) is 12 deaths per 1,000 population, but the indirect estimate by the Orphanhood Method provides a higher rate, the demographer has to conclude that the VRS is probably undercounting deaths.
The process then moves from mere reporting into data adjustment, where the demographic estimate (obtained indirectly) substitutes or systematically remedies the flawed direct measurement.
6.2. Direct Measures Informing Indirect Models
Indirect models themselves are constructed and tested with good-quality, full direct data sets.
The models employed in the Brass P/F ratio or the Trussell method are based on observed relationships in model life tables. These model life tables were initially established and calibrated against complete, long-term, high-quality VRS data from historic developed countries (such as Sweden, England, and Wales).
In this way, today’s indirect estimation tools are yesterday’s successful direct measurements’ historical legacies.
7. Closing the Data Gap
The most useful practical application of the synergy lies in filling the gap between the ideal and the actual in data.
7.1. The Requirement for Up-to-Date Data
A census (direct) gives us a base population once every ten years. Indirect projection techniques—like the cohort-component method—are subsequently employed to advance that population, utilizing high-quality inputs (ASFRs, ASDRs, immigration rates) which might themselves be calculated from adjusted (indirect) survey data.
7.2. Conflict and Disaster Areas
Under quickly shifting or unstable conditions, the sole practical data collection would be a short, focused survey inquiring regarding the survival of parents or spouses (indirect measures), enabling humanitarian organizations to rapidly estimate the effect of conflict on adult mortality, short-circuiting the long and unfeasible task of establishing a VRS.
8. Limitations and Biases
Though precious, both methods have inherent limitations that need to be handled by the working demographer.
8.1. The Limitations of Direct Measures
The basic weakness of direct measures is susceptibility to human failure and logistical mishap:
Cost and Logistics: Censuses are immensely costly, logistically challenging endeavors, rendering their administration challenging for economically strained countries.
Bias in Reporting: Sensitive events (such as illegal immigration or stigmatized deaths, e.g., from AIDS) are underreported or systematically misreported by age in even high-income countries.
8.2. The Limitations of Indirect Measures
Indirect methods have their own particular limitations:
Assumption Dependence: The outcome depends completely on the validity of model assumptions (e.g., constant mortality patterns, child mortality and parental survival being uncorrelated). If the assumption is broken (e.g., in the presence of AIDS epidemics or recent wars), the estimate can be substantially biased.
Reference Period: Indirect estimates tend to be historical averages rather than point-in-time data. For example, an estimate of orphanhood is an average death rate over the last ten or more years, so it is not ideal for following recent, fast-moving changes.
Lack of Detail: They do not typically give the level of detail, local detail, or cause detail required for targeted policy interventions.
9. Conclusion
The path of demographic measurement is the ongoing search for the truth behind people’s numbers. Direct measures give the accuracy and fine-grained specificity required by advanced demographic analysis, serving as the required anchors of the statistical system. Yet the data world out there is a long way from being standardized. It is the advanced genius of indirect measures—the mathematical formulations and theoretical schemas—that enables demographers to replicate the population image where raw data is broken.
The two methods are not alternatives but symbiotic companions. The optimal modern demographic practice is to apply rigorously indirect methods of estimation for missing rates, cross-validate these estimates against any direct sources available, and finally yield a consistent, adjusted data set that is at once theoretically valid and practically useful for policy-making. As data sources become more dynamic and varied, the demographer’s core dilemma has not changed: to employ all the tools at hand, direct count or statistical inference, to construct the most precise map possible of mankind.
BIBLIOGRAPHY
Preston, S. H., Heuveline, P., & Guillot, M. (2001). Demography: Measuring and Modeling Population Processes. Blackwell Publishing.
Shryock, H. S., & Siegel, J. S. (1976). The Methods and Materials of Demography. Academic Press.
Brass, W. (1975). Methods for Estimating Fertility and Mortality from Limited and Defective Data. The Carolina Population Center at the University of North Carolina at Chapel Hill.
National Center for Health Statistics (NCHS). (Ongoing). Vital Statistics of the United States.
Rutstein, S. O., & Rojas, G. (2006). Guide to DHS Statistics: Demographic and Health Surveys Methodology. MEASURE DHS.
Trussell, T. J. (1975). A New Method of Estimating Infant and Child Mortality Rates from Demographic Survey Data. Population Studies, 29(3), 414–425.
United Nations. (1983). Manual X: Indirect Techniques for Demographic Estimation. Department of International Economic and Social Affairs, Population Studies No. 81. United Nations.
Title:City Growth Pattern Assessment Due Date:6 November 2025 Length:~20 pages (5,000–7,000 words) References:Minimum 20 (APA 7th edition) Methods Required:
Document Analysis
Google Earth Historical Imagery Analysis
Objective: To evaluate how your city has grown spatially, functionally, and demographically over time—identifying key patterns, drivers, and consequences of urban growth.
📘 1. Selecting Your Study Area
Choose your city or urban agglomeration—preferably one you know well or can easily research (e.g., Delhi, Bhopal, Dehradun, Jaipur, etc.).
Define administrative boundaries (Municipal Corporation or Development Authority).
Note its population and area at different census years (e.g., 1991, 2001, 2011, 2021 projections).
Mention relevance or unique aspects (e.g., TOD initiatives, water bodies, industrial zones, or heritage areas).
🗂️ 2. Research Framework
Structure your study around urban growth pattern dimensions such as:
Spatial expansion (built-up area increase, direction of spread)
Population growth and density changes
Land use transformation
Transport infrastructure development
Environmental change (green cover, water bodies, encroachments)
Policy and planning influences (master plans, zoning policies)
🧭 3. Methodology
3.1 Document Analysis
A. Purpose
To interpret and extract information from existing policy, planning, and secondary data sources that reveal urban growth dynamics.
B. Sources
Collect official and academic documents such as:
Master Plans / Development Plans
City Development Plans (CDPs) under JNNURM or AMRUT
Census of India (1991, 2001, 2011, 2021 projection)
Urban Local Body (ULB) reports
Land records, zoning maps, and notifications
Peer-reviewed journal articles
Reports from NIUA, TCPO, MoHUA, NITI Aayog, and World Bank
C. Procedure
Collect Documents: Download PDFs from government or institutional websites.
Read and Code Themes: Identify recurring themes such as urban sprawl, infrastructure, and land-use change.
Extract Data: Tabulate information such as population growth, land use zoning, and policy measures.
Synthesize Findings: Connect document evidence with observed spatial changes.
D. Expected Outputs
Timeline of policy interventions and major city expansion phases
Tables summarizing land use distribution by decade
Summary of planning priorities and deviations observed
3.2 Google Earth Historical Imagery Analysis
A. Purpose
To visually and spatially assess changes in the city’s built-up area, green cover, and infrastructure using satellite imagery.
B. Tools
Google Earth Pro (Desktop version)
Google Earth Engine (optional for advanced users)
QGIS (optional for overlay and measurement)
C. Procedure
Open Google Earth Pro → Locate your city.
Activate Historical Imagery Tool → View satellite images from different years (e.g., 2000, 2005, 2010, 2015, 2020, 2025).
Identify Built-up Expansion:
Use polygon tool to delineate built-up area at each time point.
Note direction and pattern of expansion (radial, ribbon, clustered, leapfrog).
Capture Screenshots/Exports:
Take georeferenced snapshots for each decade.
Annotate major features: highways, metro lines, industrial areas, and water bodies.
Overlay and Compare:
Compare built-up growth visually.
Calculate area change (using polygon measurement tool).
In the realm of demography, fertility stands out as a central concept. It provides insights into how a population replenishes itself, influencing elements such as population expansion, age demographics, and the trajectory of societal and economic progress. However, procreation rates aren’t uniform; various subgroups exhibit distinct fertility levels. These disparities, contingent on factors like ethnicity, religious affiliation, socioeconomic status, educational attainment, residential mobility, and geographic location, shape the landscape of differential fertility. These variations stem from a complex interplay of cultural norms, societal structures, economic conditions, and individual behaviors. This discussion will delve into the intricacies of differential fertility, specifically examining how ethnicity, financial circumstances, social mobility, and geographical positioning shape fertility patterns. Through a combination of global case studies and a focused look at India, this analysis will explore theoretical frameworks, including the fertility transition theory, the minority group hypothesis, and the modernization perspective. Furthermore, the implications of differential fertility for planning, public policy, and societal equity will be highlighted, underscoring the subject’s importance in demography and urban planning.
Demography, the study of human populations, examines their size, composition, distribution, and how they evolve. These changes are driven by births (fertility), deaths (mortality), and migration patterns. Fertility, which essentially measures the number of live births, is a key driver of population growth. But fertility rates aren’t uniform; they differ depending on factors like culture, economic resources, and geographical location. These variations result in what is known as differential fertility, describing the differing birth rates across various population segments.
Differential fertility is a valuable tool for demographers and urban planners, offering insights into the varying family sizes across groups, and linking these patterns to a society’s level of development, its degree of modernization, and the effect of government initiatives. For instance, women residing in rural areas or those with limited financial resources often have larger families compared to women in urban settings, those with higher educational attainment, or those with access to better employment opportunities. Similarly, distinct ethnic or religious communities frequently exhibit unique fertility patterns, shaped by their cultural values and the desire to preserve their distinct identities.
In the realm of urban and regional planning, the ability to understand fertility differentials is critical. It helps forecast population growth, aids in the planning of essential services like schools, healthcare facilities, and housing, and contributes to the development of targeted health and family planning strategies tailored to specific demographic groups. This discussion will delve into different aspects of differential fertility, with a focus on the variations between ethnic and religious groups, economic status and social mobility, and regional differences. Examples from both developed and developing nations will be considered.
1. Concept of Differential Fertility
Differential fertility refers to measurable variations in fertility levels among distinct groups within a population. These groups may be defined by socio-economic class, educational level, occupation, residence (urban or rural), religion, ethnicity, or regional identity. Fertility differentials are typically analyzed using indicators such as the Crude Birth Rate (CBR), Total Fertility Rate (TFR), or Age-Specific Fertility Rate (ASFR).
Demographers view these differences as outcomes of both structural factors (like income, education, healthcare access) and cultural factors (like family norms, religion, gender roles). As societies undergo economic and social transformation, fertility levels tend to decline, but not uniformly across all segments. This uneven pace creates observable fertility differentials that shape demographic transitions.
2. Fertility and Ethnic/Religious Groups
Ethnicity and religion strongly influence reproductive behavior through norms, beliefs, and value systems. Cultural traditions determine ideal family size, gender preference, marriage age, and contraception acceptance.
Ethnic Groups:
In multi-ethnic societies, fertility differences often reflect historical, economic, and cultural inequalities. For instance, in the United States, Hispanic and African American communities have traditionally exhibited higher fertility rates compared to non-Hispanic Whites or Asians. This has been linked to differences in income levels, educational attainment, and cultural emphasis on family size. Similarly, in Malaysia, ethnic Malays have historically maintained higher fertility rates than Chinese and Indian minorities due to differing cultural and religious attitudes toward contraception.
Religious Groups:
Religious doctrines and practices can directly shape fertility behavior. For example, in India, Muslim populations have been observed to have slightly higher fertility rates compared to Hindus, Christians, or Sikhs, partly due to differences in female education, age at marriage, and contraceptive use. However, recent National Family Health Survey (NFHS-5, 2019–21) data show a narrowing gap, suggesting modernization and family planning efforts are influencing all groups.
Globally, in countries like Israel, Jewish religious subgroups such as the Haredim (ultra-Orthodox Jews) maintain high fertility rates (above 6 children per woman), contrasting sharply with secular Jews (around 2 children per woman). Such differences demonstrate how cultural preservation and group identity can motivate higher fertility, supporting the Minority Group Hypothesis, which argues that some minorities maintain high fertility as a strategy to preserve group identity or counter perceived discrimination.
3. Socio-Economic Status (SES) and Fertility
Socio-economic status—typically measured through education, income, and occupation—has long been recognized as a key determinant of fertility.
Education:
Female education is perhaps the most powerful single factor influencing fertility decline. Educated women tend to marry later, have better access to contraception, and prioritize careers, leading to smaller family sizes. Education also transforms attitudes toward childbearing, emphasizing quality of upbringing over quantity.
Income and Occupation:
Economic considerations significantly affect reproductive choices. In low-income groups, children may be viewed as economic assets—contributors to household labor and security in old age. In contrast, in high-income urban societies, the cost of raising and educating children acts as a deterrent to large families. Thus, higher SES groups often display lower fertility, a pattern consistent with the Fertility Transition Theory, which posits that fertility declines first among wealthier, more educated groups before spreading to the wider population.
Case Study – India:
The NFHS data show clear fertility differentials by wealth quintile: women in the lowest quintile have a TFR of around 3.0, compared to 1.6 among the richest quintile. Urban, educated, and employed women have significantly fewer children than rural, uneducated women. For example, Kerala and Tamil Nadu—states with higher literacy and income levels—exhibit replacement-level fertility (TFR ≈ 1.7), while states like Bihar and Uttar Pradesh, with lower SES indicators, maintain high fertility rates (TFR ≈ 3.0).
4. Social and Economic Mobility
Mobility—both upward and downward—affects fertility behavior by reshaping aspirations, lifestyles, and social norms.
Upward Mobility:
As families experience upward socio-economic mobility, fertility tends to decline. This is because improved income and education bring greater access to healthcare and family planning, delayed marriage, and aspirations for better living standards. Upwardly mobile groups often adopt urban or “modern” reproductive norms, emphasizing child quality over quantity. For instance, rural migrants to cities often reduce fertility as they adapt to urban constraints like limited space and higher living costs.
Downward or Limited Mobility:
Conversely, groups experiencing economic insecurity or marginalization may maintain higher fertility as a form of social security or cultural continuity. For instance, in many developing regions, lower-class families continue to rely on larger families for labor and future support.
5. Location and Spatial Variations
Spatial factors—urban vs. rural location, regional development, and neighborhood effects—also contribute significantly to fertility differentials.
Urban–Rural Divide:
Urban areas typically have lower fertility than rural areas due to better education, health services, exposure to mass media, and greater female workforce participation. Urban residents also face higher costs of living and more constrained housing, discouraging large families. In contrast, rural areas, with agricultural dependence and traditional social structures, promote early marriage and higher fertility.
For example, in India, the urban TFR (1.6) is well below the rural TFR (2.1). Similarly, in African countries like Nigeria and Kenya, urban fertility is markedly lower than rural fertility, reflecting differential access to family planning and education.
Regional and Neighborhood Effects:
Fertility rates also vary regionally due to policy focus, cultural zones, and migration. For instance, southern and western India have achieved demographic transition faster than northern states. In developed nations, immigrant-dense neighborhoods often exhibit fertility patterns distinct from national averages, showing persistence of cultural norms even in new environments.
Neighborhoods with better healthcare, transport, and educational facilities tend to have lower fertility, as these promote modern lifestyles and access to reproductive health services.
6. Theoretical Explanations of Differential Fertility
Several demographic theories explain fertility differentials:
Fertility Transition Theory:
Suggests that fertility declines as societies modernize—beginning among high-SES groups and later spreading to others.
Cultural Lag Theory:
Indicates that cultural change lags behind structural change, causing persistent fertility differences even in economically advanced regions.
Minority Group Hypothesis:
Argues that minority groups may maintain higher fertility as a response to perceived marginalization or as a means to sustain cultural identity.
Modernization and Diffusion Theory:
Highlights that exposure to urban or modern ideas spreads fertility control practices across social networks and spatial boundaries.
7. Implications for Demography and Planning
Understanding differential fertility has significant policy and planning implications:
Population Projections:
Fertility differentials affect population growth rates and age structure, influencing future demands for education, housing, and employment.
Health and Family Planning:
Identifying high-fertility groups enables targeted interventions in reproductive health and awareness programs.
Gender and Education Policies:
Enhancing female literacy and economic empowerment helps reduce fertility inequalities.
Urban Planning:
Urban areas with high in-migration or minority concentration may require adaptive infrastructure planning, as fertility levels differ by group and location.
Case Studies
Case 1: Kerala, India
Kerala achieved fertility transition early due to high literacy (94%), social development, and women’s empowerment. Despite religious and caste diversity, fertility levels across groups are relatively uniform, reflecting the role of education and healthcare over cultural differences.
Case 2: Uttar Pradesh, India
In contrast, Uttar Pradesh continues to exhibit high fertility, particularly among low-income and rural groups. Differences persist across caste, religion, and education, illustrating how structural inequality sustains fertility differentials.
Case 3: United States
The U.S. shows persistent fertility differentials by race and ethnicity. Hispanic women, on average, have higher fertility than White or Asian women, influenced by cultural norms and socioeconomic status. However, as education and urbanization rise, fertility convergence is gradually occurring.
Case 4: Sub-Saharan Africa
Despite economic growth, many African nations show slow fertility decline due to strong cultural pronatalism and limited access to contraception. Ethnic and religious differences remain pronounced, highlighting the importance of social and cultural context.
Conclusion
In the realm of population studies, differential fertility remains a concept of considerable significance. It illustrates the influence of societal factors, cultural norms, financial standings, and geographical locations on individual reproductive choices. Factors such as ethnicity, religious affiliations, socioeconomic status, social mobility, and residential environments all contribute to the diverse fertility patterns observed within a population. While advancements and educational opportunities typically correlate with reduced family sizes, certain cultural viewpoints and existing inequalities can perpetuate these variations.
A nuanced understanding of these disparities is crucial, not only for analyzing population dynamics but also for formulating effective policies. This involves ensuring equitable access to healthcare, family planning services, and educational resources for all. Furthermore, when considering long-term development strategies, acknowledging and addressing these fertility differences enables us to align population growth with our broader social and economic objectives. The study of differential fertility serves as a bridge between demography, sociology, and urban planning, offering valuable insights into how individuals adapt their behaviors in response to a changing world.
References
1. Bongaarts, J. (2017). The Causes of Educational Differences in Fertility in Sub-Saharan Africa. Population Council.
2. Davis, K., & Blake, J. (1956). Social Structure and Fertility: An Analytical Framework. Economic Development and Cultural Change.
3. National Family Health Survey (NFHS-5), Government of India (2019–21).
4. Notestein, F. W. (1945). Population: The Long View. In Food for the World. University of Chicago Press.
5. Preston, S., Heuveline, P., & Guillot, M. (2001). Demography: Measuring and Modeling Population Processes. Blackwell Publishers.
6. Weeks, J. R. (2021). Population: An Introduction to Concepts and Issues (13th ed.). Cengage Learning.
7. United Nations Population Fund (UNFPA). (2023). World Population Dashboard.
8. Dyson, T. (2010). Population and Development: The Demographic Transition. Zed Books.
9. Caldwell, J. C. (1976). Toward a Restatement of Demographic Transition Theory. Population and Development Review.
10. Singh, S. (2020). Fertility Differentials in India: Trends and Patterns. Economic and Political Weekly.
Urbanisation is one of the most transformative processes shaping the modern world. Over the past two centuries, the global population has increasingly concentrated in cities, driven by industrialisation, economic opportunity, and social change. In 1950, only about 30% of the world’s population lived in urban areas; today, more than 55% do, and this figure is expected to rise to nearly 70% by 2050. This essay provides an overview of world urbanisation, examining its historical evolution, regional patterns, and socio-economic impacts. It explores how developed nations experienced early, industrial-led urban growth, while developing countries are witnessing rapid, often unplanned urban expansion. The paper also discusses challenges such as overcrowding, housing shortages, pollution, and inequality, alongside emerging trends like smart cities and sustainable urban planning. Understanding global urbanisation is crucial for addressing the complex issues of modern urban life and ensuring a more balanced and inclusive urban future.
The Journey from Villages to Mega Cities: An Overview of World Urbanization
For much of human history, most people lived in small, rural communities surrounded by fields, forests, and rivers. Villages filled with familiar faces and family ties were the backbone of civilization. It wasn’t until the last few centuries that humanity began to gather in cities—and this shift, known as urbanization, has utterly transformed how people live, work, and dream.
Early Beginnings: The Village World
Go back a few centuries, and the concept of a “city” existed for only a tiny fraction of humankind. Around 1500, perhaps as little as 4% of the world’s population inhabited urban settlements. For the majority, the rhythm of life was dictated by the seasons, crops, and local traditions. Daily existence was deeply localized—what happened in a nearby field or a neighboring house mattered far more than distant events.
Of course, there were exceptional places—Beijing with its imperial grandeur, Istanbul at the crossroads of empires, Tenochtitlan dazzling in the heart of present-day Mexico. These cities were magnets for power, culture, and innovation, but they were still rare jewels in a vast countryside. Most European towns were modest in size, often only a few thousand residents, and urban life in Africa, Asia, and the Americas was just as diverse, shaped by environmental, political, and economic factors.
Seeds of Change: 1500 to 1800
The seeds of change began to sprout as new technologies, expanding trade networks, and the global reach of colonial powers took root. The Renaissance sparked a drive for knowledge and innovation in European cities, and explorers ventured forth to map new continents, often founding cities along the way. Colonialism led to the growth of trading posts and garrison towns from Africa to the Americas and Asia. These urban centers echoed the architecture, laws, and ambitions of their founding countries, but they also evolved over time, becoming melting pots of people and ideas.
During these centuries, city populations slowly increased as trade and administration drew people in from rural areas. Yet, most families remained tied to the land. The majority of people sustained themselves through agriculture—food production was truly the lifeblood of society.
The Fire of Industry: 1800 to 1900
Everything changed with the birth of the Industrial Revolution. Suddenly, machines powered by coal and steam could produce goods faster and more efficiently than ever before. Factories, railroads, and mines appeared on the landscape, beckoning millions to abandon slow, uncertain rural life for the ceaseless possibilities of the city.
In this era, cities grew both outward and upward. In England, cities like Manchester and Birmingham exploded in size, while London became the world’s first true megacity. The population density became both a blessing and a curse—urban centers became bustling hubs of commerce, energy, and creativity, but also crowded spaces plagued by poor sanitation, pollution, and inequality.
By 1900, the world had several hundred cities with populations above 100,000—an astronomical increase from just a handful in previous centuries. This trend was mirrored in North America, where places like New York, Chicago, and Toronto became symbols of urban aspiration.
The Twentieth Century: Cities for the Multitudes
The 20th century was an era of sheer acceleration. Wars, revolutions, migrations, and technology fuelled an unprecedented wave of urban growth. Cities ceased being merely centers of power or culture; they became home to millions.
By mid-century, urbanization was no longer confined to Europe and North America. Asian, African, and South American cities began expanding rapidly. São Paulo, Mexico City, and Cairo joined the ranks of global urban giants, while in Asia, Beijing, Mumbai, and Shanghai began their transformation into the sprawling megacities of today.
Government policies, economic opportunities, and technological advances made rural-to-urban migration easier and sometimes required. Infrastructure (roads, trains, electricity), healthcare, and education were more accessible in cities, further motivating the switch.
By 2007, for the first time in history, more people lived in cities than in the countryside. Now, over half the world’s population inhabits urban areas, and in some wealthier regions (Western Europe, America, Australia, and Japan), the share is above 80%.
What Drives Urbanization?
Urbanization happens for many reasons. At its core, it’s often about hope—a better job, improved education, safer healthcare, and a more varied lifestyle. Sometimes, it is driven by necessity, such as environmental change, war, or the decay of rural economies.
Modern urban expansion is deeply linked to economic growth. As societies develop, more people are pulled into service industries, manufacturing, and administrative work, which traditionally cluster in urban settings. The global movement from farming toward other forms of work means cities become centers of opportunity. The connection between income and urban living is strong; richer countries nearly always have more urban populations.
But there’s a tension—cities can be places of creativity and innovation, or they can be centers of stark inequality and hardship. Many cities offer higher standards of living, better public services, and vibrant cultural scenes, but they also host crowded slums and suffer from pollution, traffic, and insufficient housing.
The Challenges of Urban Life
Cities are, by design, dense concentrations of resources, people, and ambition. The upside is clear: jobs, education, hospitals, and entertainment are often a short commute away. But these benefits can mask deep challenges.
Globally, almost 1 in 4 urban residents live in slums or informal settlements, lacking clean water, reliable sanitation, or safe and durable housing. The situation is worse in many parts of sub-Saharan Africa and South Asia, where rapid urban growth has outstripped the capacity of governments and markets to provide basic services.
Large urban agglomerations can also be deeply unequal. In some cities, immense wealth is found just blocks away from extreme poverty. Managing these contradictions is one of the great challenges of the 21st century.
Urban Growth and Environmental Impact
As cities expand, so do their environmental footprints. Urban areas consume vast amounts of resources—energy, food, water—and generate significant waste and pollution. The world’s largest cities are responsible for a disproportionate share of greenhouse gas emissions.
But cities also offer some of the best opportunities for sustainable living. High population densities mean infrastructure like mass transit, water treatment, and energy distribution can be more efficient. Innovative architecture, green spaces, and public policies help mitigate ecological impacts, though much work remains to be done to make urban living truly sustainable.
Definitions: The Numbers Game
Talking about urbanization means grappling with definitions. Is a settlement of 5,000 residents urban, or must it have 50,000? Should population density or economic activity be the standard? Some countries count any city above 2,000 as urban; others set the bar at 50,000. These differences make international comparisons tricky; reliable data is difficult to come by, and estimates sometimes vary dramatically depending on definitions.
To address these challenges, organizations like the United Nations and the European Commission have proposed harmonized classifications, such as the “Degree of Urbanization,” which considers both population and density for consistent international statistics. Still, debates continue about where to draw the line.
Urbanization Patterns: Not All Cities Are Alike
There are many kinds of cities, shaped by geography, politics, and history. Some countries—like Singapore or Monaco—are almost entirely urban. Others, such as Ethiopia or Nepal, remain overwhelmingly rural, with cities that are still growing, sometimes in fits and starts.
Some nations see much of their urban population concentrated in a single city. In places like Mongolia, Paraguay, or Liberia, half or more of urban dwellers live in the capital. In contrast, countries like Germany or Japan have urban populations spread across many cities, resulting in less centralization and often more equitable distribution of resources.
Globally, cities like Tokyo, Jakarta, Delhi, and Dhaka have transformed into megacities, each housing tens of millions. The infrastructure and planning required for such vast urban populations push the limits of innovation and governance.
Living Standards and Inequality
On average, urban populations have higher living standards than rural ones. Electricity, clean water, and modern sanitation are more common in cities; access to healthcare and education improves as well. Urban areas also tend to be more resilient to economic shocks or climate impacts due to their diversified economies and more extensive networks.
However, these averages can hide dramatic inequality. Many city residents—especially those in slum settlements—live in precarious conditions, sometimes without secure tenure or reliable public services. The battle to make cities “inclusive, safe, resilient and sustainable” is ongoing.
The Future of Urbanization
Looking ahead, urbanization will only intensify. By 2050, more than two-thirds of humanity is projected to live in cities. Country-level projections suggest nearly every part of the globe will complete the transition from rural to urban dominance, although the pace varies. India, now poised to become the world’s most populous nation, still has only slightly more than half its population living in cities; this is expected to grow substantially in coming decades.ourworldindata
This global trend raises urgent questions about planning, sustainability, equity, and governance. The battle to build cities that are inclusive and efficient—and that respect both human dignity and environmental limits—will define the 21st century.
The Human Story: Why Cities Matter
Why do cities matter? Because they tell the story of human connection, aspiration, and challenge. In cities, people rub shoulders with strangers, forge new relationships, collaborate, and compete. Cities pulse with life: the sound of markets, music in the streets, the rush of commuters, and the hum of factories and offices.
Cities have always been places of risk and reward. They foster innovation in business, science, politics, and the arts—but also host social tensions and sometimes violence. Throughout history, cities shaped the destinies of nations, acting as crucibles for ideas and agents of change.
The best cities do more than collect people; they inspire them. They create spaces for art, science, and public debate—arenas where the future is imagined and sometimes realized.
Toward the Next Urban Century
The history of urbanization is not merely a story of numbers and buildings. It is a testament to human adaptability, resilience, and the search for meaning beyond mere survival. As the world becomes still more urban, the challenges ahead demand new thinking—about inclusion, fairness, ecological limits, and what it truly means to thrive as a community.
If cities can balance humanity’s ambitions with its need for dignity and connection, they can continue to be engines of progress, hope, and creativity. The future of urbanization is an unfinished story, one in which every generation contributes a new chapter—one building, one neighborhood, and one dream at a time .
References
United Nations, Department of Economic and Social Affairs (UN DESA). World Urbanization Prospects: The 2022 Revision. New York: United Nations, 2022.
World Bank. Urban Development Overview. Washington, D.C.: World Bank, 2023.
UN-Habitat. World Cities Report 2022: Envisaging the Future of Cities. Nairobi: UN-Habitat, 2022.
Davis, Mike. Planet of Slums. London: Verso, 2006.
Satterthwaite, David. “The Transition to a Predominantly Urban World and Its Underpinnings.” Human Settlements Discussion Paper Series, International Institute for Environment and Development (IIED), 2007.
United Nations. The Sustainable Development Goals Report 2023. New York: United Nations, 2023.
World Economic Forum. Global Future Council on Cities and Urbanization: Shaping the Future of Urban Development. Geneva: WEF, 2021.
Knox, Paul L., and Linda McCarthy. Urbanization: An Introduction to Urban Geography. 4th ed. Pearson Education, 2020.
Seto, Karen C., et al. “Global Urban Land Expansion, 1980–2000.” Environmental Research Letters 6, no. 3 (2011): 034009.
Glaeser, Edward. Triumph of the City: How Our Greatest Invention Makes Us Richer, Smarter, Greener, Healthier, and Happier. New York: Penguin Press, 2011.
OECD. The Governance of Land Use in OECD Countries: Policy Analysis and Recommendations. Paris: OECD Publishing, 2017.
McGranahan, Gordon, and Deborah Balk. “Urban Transitions and the Spatial Displacement of Environmental Burdens.” Urban Studies 49, no. 12 (2012): 2317–2334.
This lecture material critically examines fertility trends across the globe, focusing on essential demographic indicators, the underlying socioeconomic and cultural determinants of change, and the resulting policy challenges. The discussion begins by defining core measures such as the Total Fertility Rate (TFR), the Crude Birth Rate (CBR), and the concept of Replacement Level Fertility (approximately 2.1). It highlights the universal trend of fertility decline, contextualized by the Demographic Transition Model, illustrating the transition from high to low birth rates. The analysis then investigates the principal drivers of this transformation, including female education and empowerment, increased access to family planning, and urbanization. Finally, the module addresses the critical planning implications of both rapid decline (e.g., aging populations) and high fertility (e.g., resource strain), concluding with the necessity of integrating fertility data into sustainable development policy.
1. INTRODUCTION: Context and Significance
The trajectory of a nation’s development is inextricably linked to its population dynamics, of which fertility—the actual reproductive performance of a population—is a foundational component. Fertility trends reflect profound societal shifts in health, education, economic structure, and gender roles. Over the past century, the global population has witnessed an unprecedented and widespread decline in birth rates, a phenomenon that has dramatically reshaped the age structures of both developed and developing countries. According to the United Nations Population Division (official source), the global average TFR has fallen from approximately 5.0 children per woman in 1950 to around 2.3 in recent estimates, signaling a major transition.
Policy Relevance: The significance of accurately charting and understanding fertility trends extends into every realm of governance. Low fertility in industrialized nations fuels concerns over aging populations and pension solvency, while persistently high fertility in parts of the Global South strains resources and infrastructure, contributing to a youth bulge.
Purpose: This material aims to dissect the core measures and mechanisms driving these shifts, using established academic frameworks and reliable demographic data to illuminate the complexities of the modern fertility landscape and its implications for effective urban and regional planning.
2. CORE DEMOGRAPHIC DEFINITIONS AND MEASURES
To analyse fertility, specific, internationally recognized metrics are used:
Measure
Definition
Significance
Total Fertility Rate (TFR)
The average number of children a woman would have over her lifetime, given current age-specific fertility rates.
The most comprehensive measure for comparing fertility across time and regions.
Crude Birth Rate (CBR)
The number of live births per 1,000 people in a given year.
A simple, initial measure of fertility, though sensitive to the population’s age structure.
Age-Specific Fertility Rate (ASFR)
The number of live births per 1,000 women in a specific age group (e.g., 20-24 years).
Provides detailed insight into when women are having children (timing and tempo).
Gross Reproduction Rate (GRR)
The average number of daughters a woman would have in her lifetime, used for population replacement analysis.
Used to estimate the pure biological potential for population replacement.
Replacement Level Fertility
The TFR required to maintain a stable population size, excluding migration. Conventionally set at approximately 2.1 children per woman.
The critical threshold. TFR below 2.1 indicates long-term population contraction.
3. THE FRAMEWORK OF FERTILITY CHANGE
The universal decline in fertility is analyzed through two major theoretical models: the classical framework of the Demographic Transition Model (DTM) and the more recent conceptualization of the Second Demographic Transition (SDT).
3.1 The Demographic Transition Model (DTM)
The DTM describes the historical shift from high birth rates (HBR) and high death rates (HDR) to low birth rates (LBR) and low death rates (LDR) as a society industrializes and modernizes.
Stage
Birth Rate
Death Rate
Population Growth
Characteristics
Stage 1 (Pre-Industrial)
High
High
Slow/Zero
Found historically; high child mortality, dependence on agriculture.
Stage 2 (Early Transitional)
High
Rapidly Falling
Very Rapid
Public health improves, sanitation advances; Population Explosion due to falling death rates.
Stage 3 (Late Transitional)
Falling
Low
Slowing
Fertility begins to drop due to social and economic changes.
Stage 4 (Post-Industrial)
Low
Low
Stable/Zero
Modern developed economies; TFR often at or below Replacement Level (2.1).
3.2 Global Trends and Milestones
Developed Nations: Most industrialized countries (e.g., Japan, Germany, Italy) are in Stage 4, with TFRs significantly below 1.5, leading to rapid population aging.
Developing Nations (The “Catch-Up”): Many large economies (e.g., India, Brazil) have experienced a much faster fertility decline than historically seen in Western countries, largely due to accelerated access to technology and information. For example, India’s TFR officially dropped to 2.0 as per the National Family Health Survey (NFHS-5, 2019-21), marking a historic point below replacement level.
Outlier Regions: Parts of Sub-Saharan Africa remain in Stage 2/Early Stage 3, characterized by TFRs still high (e.g., 5.0+), leading to a significant youth bulge and continued rapid population growth.
4. DETERMINANTS OF FERTILITY DECLINE
The decision to have fewer children is driven by powerful, inter-connected societal shifts:
Socioeconomic Development and Education:
Female Education: This is the single strongest and most consistent correlate with fertility decline. Higher education leads to delayed marriage, postponed first birth, greater agency in family planning, and changed life aspirations.
Economic Cost of Children: In agricultural societies, children are economic assets (labor). In industrialized/urban societies, they become economic liabilities (cost of education, healthcare, etc.), incentivizing smaller families.
Health and Mortality:
Decline in Infant and Child Mortality: As fewer children die in infancy, parents no longer need “insurance births” to ensure some children survive to support them in old age. This increases confidence in family planning.
Access to Family Planning and Contraception:
The widespread availability and knowledge of modern contraceptive methods enable individuals and couples to translate their desire for fewer children into reality. Government policies promoting informed choice and access are key enablers.
Urbanization and Changing Social Norms:
Urban Lifestyles: Urbanization is associated with less living space, different social networks, and access to mass media that promotes modern, smaller-family ideals.
Women’s Labor Force Participation: Increased participation in non-agricultural work competes with time for child-rearing and increases the opportunity cost of having children.
5. POLICY CHALLENGES AND IMPLICATIONS
Fertility trends present a duality of profound policy challenges globally, requiring sharply different governmental responses:
5.1 Challenges of Sub-Replacement Fertility (TFR < 2.1)
This trend, typical of SDT countries, leads to an acute imbalance in the Old-Age Dependency Ratio (the ratio of retirees to working-age adults).
Aging Population and Economic Strain: A shrinking base of young workers must support an expanding, longer-lived cohort of retirees.
Implication:Solvency crisis for public pension and social security systems; soaring costs for specialized elderly healthcare.
Policy Response (Pronatalism): Governments implement policies designed to encourage births, such as:
Generous cash incentives and child benefits (e.g., France, Sweden).
Long, paid parental leave for both parents.
Subsidized, high-quality childcare and kindergarten access.
Immigration: Used as a compensatory measure to fill workforce gaps and counteract population shrinkage.
5.2 Challenges of High Fertility (TFR >> 2.1)
This trend, typical of nations still in DTM Stage 2/Early Stage 3, is characterized by a significant Youth Bulge (a very large proportion of the population under age 15).
Resource Strain and Developmental Hurdles: Rapid population growth consumes development gains and strains infrastructure.
Implication: Overburdened and low-quality education systems; massive demand for job creation that often outstrips economic growth; increased pressure on basic services (water, sanitation, housing).
Policy Response (Family Planning): Governments focus on managing and slowing growth:
Massive investment in female education and keeping girls in school.
Strengthening reproductive health services to ensure access to contraception and prevent unwanted pregnancies.
Prioritizing maternal and child health to further drive down infant mortality, thereby reducing the “insurance motive” for high fertility.
CONCLUSION
The global narrative of fertility is one of profound and sustained transformation, shifting the demographic center of gravity for nearly every nation. The decline in TFR is a testament to human development—a success story largely attributable to the rising status of women and advancements in public health. While the DTM explains the initial, economically rational shift away from high fertility, the SDT is essential for understanding the sustained sub-replacement fertility and the value-driven decision-making in highly developed societies.
The primary task for policymakers remains the effective utilization of reliable, officially generated fertility data (from Census bureaus and national health surveys) to anticipate future population structures. Effective governance necessitates tailored strategies: promoting family-friendly environments in SDT nations to mitigate aging and simultaneously ensuring robust education and health infrastructures in high-fertility regions to capture the Demographic Dividend. Future census exercises must be refined to capture emerging household formations and values (as suggested by the SDT) to ensure that policy remains responsive to the dynamic and complex demographic realities of the 21st century.
REFERENCES
United Nations, Department of Economic and Social Affairs, Population Division. (2022). World Population Prospects 2022: Summary of Results. (Provides official global TFR data and projections).
International Institute for Population Sciences (IIPS) and Ministry of Health and Family Welfare, Government of India. (2021). National Family Health Survey (NFHS-5), 2019-21. (Example of official, national-level data used for TFR calculation).
Bongaarts, J. (2003). Completing the Fertility Transition in the Developing World: The Role of Contraception and Education. Population Council. (Key academic analysis on the determinants of fertility decline).
World Bank Group. (2020). Demographic Dividends and the Power of Women’s Education. (Official report linking human capital, TFR, and economic growth).
Abstract Migration has been an essential human phenomenon throughout history, shaping societies, economies, and cultures across the globe. It refers to the movement of people from one place to another, often across geographical, political, or cultural boundaries, with the intent of settling temporarily or permanently in a new location. This report examines the various reasons and types of migration trends, emphasizing both the “push” and “pull” factors that influence human movement. It also explores the different forms of migration—internal and international, voluntary and forced—and their socio-economic and demographic implications. Furthermore, the discussion delves into contemporary migration patterns driven by globalization, urbanization, political instability, environmental crises, and economic opportunities. By analyzing these factors, the report aims to provide a comprehensive understanding of how migration has evolved in the 21st century and its impact on both origin and destination regions. The report concludes that while migration can foster cultural diversity and economic growth, it also poses challenges such as urban congestion, cultural assimilation, and policy conflicts. Understanding these dynamics is essential for planning and managing sustainable migration systems in an increasingly interconnected world. Introduction Migration, in the simplest sense, refers to the movement of people from one geographical location to another, often across political or administrative boundaries. It is one of the most significant demographic processes influencing the growth, structure, and distribution of the world’s population. Migration is as old as human civilization itself; from prehistoric nomads moving in search of food and favorable climates to contemporary professionals migrating for education, employment, or better living standards, migration remains an integral part of human existence. According to the International Organization for Migration (IOM), migration can be defined as “the movement of persons away from their place of usual residence, either across an international border or within a state.” Migration is influenced by a complex mix of economic, social, political, cultural, and environmental factors. In the modern world, it is also deeply interconnected with global issues such as urbanization, climate change, and globalization. Migration can be classified based on various criteria, such as distance (internal or international), duration (temporary or permanent), and the voluntariness of the act (voluntary or forced). Each type reflects distinct motivations and impacts on both the migrants and the regions involved. While some individuals migrate in search of better economic opportunities, others are compelled to leave their homes due to wars, persecution, or natural disasters. Understanding migration trends is crucial for planners, policymakers, and researchers because migration affects urban development, labor markets, social integration, and demographic balance. With globalization and advances in communication and transportation, migration patterns have become more dynamic and complex, demanding a comprehensive study of their causes and consequences.
Discussion 1. Concept and Importance of Migration Migration plays a crucial role in the demographic and socio-economic structure of societies. It helps in balancing labor markets, redistributing population, and stimulating economic development. For individuals, migration often means access to better jobs, education, and living standards. For countries of origin, migration can reduce unemployment pressure and increase remittances, while for destination countries, it can supply essential labor and promote multiculturalism. However, migration also brings challenges such as brain drain, population decline in rural areas, strain on urban infrastructure, and socio-cultural conflicts. Therefore, migration must be understood not merely as a demographic movement but as a multidimensional process that reflects the interplay of economic, political, environmental, and social forces.
2. Reasons for Migration Migration is driven by numerous factors, which can broadly be categorized into push and pull factors. 2.1 Economic Factors Economic reasons are among the most significant drivers of migration. Individuals move from areas with limited job opportunities, low wages, or economic instability to regions offering better employment prospects, higher incomes, and improved living conditions. Examples include: Migration of workers from rural to urban areas in search of industrial jobs. Movement of professionals from developing nations to developed countries for better career opportunities. Labor migration within regions, such as seasonal workers moving for agricultural harvests. Globalization has intensified economic migration by connecting labor markets worldwide, allowing people to move more easily across borders in pursuit of better livelihoods. 2.2 Social Factors Social factors such as education, family reunification, marriage, or lifestyle preferences also motivate people to migrate. Students move abroad for higher education, and families relocate to reunite with relatives who have already settled elsewhere. Social networks often facilitate migration by providing information and support, making it easier for new migrants to adapt. 2.3 Political Factors Political instability, discrimination, or persecution often force individuals to leave their countries. Refugees and asylum seekers migrate to escape conflicts, human rights abuses, or oppressive regimes. For instance, the Syrian civil war and political crises in Afghanistan and Sudan have resulted in millions of people seeking refuge in neighboring and developed countries. 2.4 Environmental Factors Environmental degradation and climate change are increasingly becoming major causes of migration. Natural disasters like floods, earthquakes, droughts, and cyclones displace millions every year. Long-term changes such as desertification, rising sea levels, and deforestation make certain areas uninhabitable, leading to “environmental refugees.” For example, island nations such as the Maldives face existential threats from rising sea levels, prompting plans for relocation. 2.5 Demographic Factors Population growth in certain regions can create pressure on resources, employment, and infrastructure, pushing people to migrate. Conversely, countries with aging populations, like Japan or many European nations, attract young migrants to maintain their labor force and economic vitality. 2.6 Cultural and Psychological Factors Cultural aspirations, the desire for freedom, or exposure to foreign lifestyles through media and technology also inspire migration. Young people, especially from developing nations, are drawn to cities or countries that offer a modern, cosmopolitan lifestyle. In some cases, migration is driven by curiosity and a sense of adventure.
3. Types of Migration Migration can be classified based on several criteria, each offering insights into its nature and impacts. Based on Distance 3.1.1 Internal Migration – Movement within the same country, such as rural-to-urban, urban-to-rural, or inter-state migration. Rural-to-Urban Migration: The most common type, driven by industrialization and better urban opportunities. Urban-to-Rural Migration: Sometimes occurs due to congestion, pollution, or desire for a peaceful environment. Intra-urban Migration: Movement within the same city, often for better housing or access to services. 3.1.2 International Migration –Movement across national borders. It includes emigration (leaving a country) and immigration (entering another country). Examples include South Asians migrating to Gulf countries for employment or Europeans moving freely within the EU. Based on Time Duration 3.2.1 Temporary Migration – People move for a short period for work, education, or seasonal employment. Example: Construction workers or students who plan to return after completing their studies. Permanent Migration – Individuals or families settle in a new location indefinitely, often acquiring citizenship or long-term residence. Based on Nature of Decision 3.3.1 Voluntary Migration – When people choose to move for better opportunities or lifestyle improvements. Example: Skilled professionals migrating to developed nations. 3.3.2Forced Migration – When people are compelled to move due to war, persecution, or natural disasters. Example: Refugees from conflict zones such as Ukraine or Gaza. 3.4 Based on Legal Status 3.4.1 Legal Migration – Movement conducted under the laws of the destination country, often through visas, work permits, or asylum approvals. 3.4.2Illegal or Irregular Migration – Movement that violates immigration laws, such as unauthorized border crossings or overstaying visas. 3.5 Based on Motivation Labour Migration – Driven by employment needs; may be skilled, semi-skilled, or unskilled workers. Educational Migration – Students migrating for higher studies abroad. Environmental Migration – People relocating due to environmental degradation. Political Migration – Refugees fleeing persecution or war. Technological or Digital Migration – Professionals relocating due to opportunities in technology-driven industries. 4. Global Migration Trends Migration trends have changed significantly over the past few decades due to globalization, technological advancement, and international cooperation. The following are notable trends: 4.1 Urbanization and Internal Migration Urban areas have become major magnets for migration, particularly in developing countries. The United Nations estimates that more than 55% of the world’s population now lives in urban areas, with rural-to-urban migration being the key driver. Cities like Mumbai, Lagos, and Jakarta have witnessed explosive population growth due to internal migration. 4.2 South–North and South–South Migration While migration from developing (Global South) to developed (Global North) countries remains high, there has been an increase in South–South migration—movement between developing countries. For instance, many African migrants move to other African nations, and South Asians migrate to Gulf countries for employment. 4.3 Brain Drain and Skilled Migration Highly educated professionals from developing countries often migrate to developed nations, seeking better career prospects and living conditions. This phenomenon, known as “brain drain,” can negatively affect the origin country’s human capital but can also generate remittances and knowledge transfer in the long run. 4.4 Refugee and Displacement Crises According to the UNHCR, there were over 120 million forcibly displaced people worldwide by 2024 due to conflicts and environmental disasters. Forced migration has become a global humanitarian concern, requiring coordinated international responses. 4.5 Feminization of Migration Women now constitute nearly half of all international migrants. Many migrate independently as workers, caregivers, or professionals, challenging traditional gender roles and contributing significantly to household and national economies. 4.6 Digital and Remote Work Migration The COVID-19 pandemic accelerated a new trend—remote work migration. Many professionals now move to countries offering digital nomad visas or affordable living conditions, reshaping global labor mobility.
5. Impacts of Migration Migration has multifaceted effects on both origin and destination regions. 5.1 Economic Impacts On Origin Areas: Migration can relieve population pressure, reduce unemployment, and bring in remittances that boost the local economy. However, it may also lead to brain drain and labor shortages in certain sectors. On Destination Areas: Migrants fill labor gaps, contribute to economic growth, and stimulate innovation. Yet, they may also compete with locals for jobs or strain public services. 5.2 Social and Cultural Impacts Migration promotes multiculturalism, diversity, and social exchange. It fosters cultural integration and global awareness. However, it can also lead to cultural conflicts, identity crises, and challenges of assimilation for migrants. 5.3 Demographic Impacts Migration alters the age and sex composition of populations. Young migrants can rejuvenate aging societies, while depopulation can occur in areas experiencing high outmigration. 5.4 Environmental Impacts Large-scale migration to urban areas can lead to overpopulation, pollution, and pressure on housing and infrastructure. Conversely, migration can relieve overexploited rural environments. 5.5 Political and Policy Impacts Migration influences international relations, national security, and domestic policies. Governments often face challenges balancing humanitarian concerns with border control and economic needs.
6. Managing Migration Effective migration management requires coordinated policies that balance economic benefits with social integration. Key strategies include: Strengthening legal migration channels to reduce irregular movements. Promoting regional cooperation and bilateral agreements. Protecting migrants’ rights through labor laws and social inclusion programs. Addressing root causes of forced migration, such as poverty and conflict. Investing in education and skill development in origin countries. Encouraging sustainable urban planning to accommodate internal migration.
Conclusion Migration is a dynamic and complex process that mirrors the global interdependence of the modern era. Whether driven by economic necessity, social aspirations, political unrest, or environmental changes, migration remains a defining feature of human development. While it offers immense opportunities for cultural exchange, innovation, and economic growth, it also poses serious challenges related to integration, inequality, and policy governance. To ensure that migration contributes positively to sustainable development, both sending and receiving nations must adopt inclusive, humane, and forward-looking policies. The focus should be on maximizing the benefits of migration while minimizing its negative consequences. As climate change, technological transformation, and global inequality continue to shape human mobility, understanding migration trends becomes more essential than ever. Migration is not merely about movement; it is about resilience, adaptation, and the unending quest for a better life. References International Organization for Migration (IOM). (2023). World Migration Report 2023. Geneva: IOM Publications. United Nations Department of Economic and Social Affairs (UN DESA). (2022). International Migration Highlights 2022. Castles, S., de Haas, H., & Miller, M. J. (2020). The Age of Migration: International Population Movements in the Modern World (6th ed.). London: Macmillan. Todaro, M. P., & Smith, S. C. (2020). Economic Development. Pearson Education. UNHCR. (2024). Global Trends: Forced Displacement in 2024. Geneva. Skeldon, R. (2018). Migration and Development: A Global Perspective. Longman. World Bank. (2021). Migration and Remittances Factbook 2021. Washington, D.C. Massey, D. S., Arango, J., Hugo, G., Kouaouci, A., Pellegrino, A., & Taylor, J. E. (1998). Worlds in Motion: Understanding International Migration at the End of the Millennium. Oxford University Press. Black, R., & Collyer, M. (2014). Forced Migration and Global Politics. John Wiley & Sons. Lee, E. S. (1966). “A Theory of Migration.” Demography, 3(1), 47–57.
Migration is the movement of individuals from their regular abode to another, with a temporary or permanent relocation in a place of abode. A key demographic process with immense consequences for societies across the world, migration occurs in several forms, with the main ones being internal migration, whereby individuals relocate within a nation, and international migration, whereby individuals cross international borders. Internal migration can take the form of rural-urban migration and interstate relocation, while international migration can be prompted by economic ambition, flight from hostilities, reunification with family, or environmental stress.
It is crucial to understand migration since it defines economic frameworks, social formations, political processes, and environmental regimes. It also affects labour markets, cultural interchanges, urbanization processes, demographic alignments, and policymaking processes. The report extends to deliver a detailed analysis on causes and multi-dimensional effects of human movement, with relevant country and worldwide illustrations. The main goals are to study the process of migration in a detailed manner and to showcase its economic-social and political effects.
Understanding Migration
It is a complex process with several major ideas:
Emigration is the act of leaving one’s country or place of origin.
Immigration is the act of settling into a new territory to live.
Push–Pull Theory asserts that migrants are attracted by positive factors such as work, security, or schooling, and pushed by adverse factors such as poverty, joblessness, or war.
The migration flows have specific patterns:
Rural-urban movement is prevalent in developing nations, led primarily by industrialization and economic growth in urban areas.
South-North migration, or migration from less prosperous developing countries to higher income developed countries, is extensive globally.
Seasonal and circular migrants are frequent workers in construction and agriculture.
It is deeply linked with globalization, which has developed inter-connected economies and societies; conflict and persecution are still powerful motivators; and the new challenge posed by climate change is ever more rendering environments inhospitable, compelling millions to move.
Causes Of Migration
Economic Causes
Economic impulses are prime motivators for migrants. A majority migrate in search of jobs to get away from unemployment, poverty, and underemployment in rural or economically stagnant areas. Significant interregional or international wage gaps are excellent motivators for migrants. In India, for example, vast rural poverty and farm modernization have reduced labor requirements, compelling many migrants to urban centres like Mumbai, Delhi, and Bengaluru, where industrial and service sectors have higher-wage opportunities. Urban industrialization, higher incomes, and increased occupational selection are the attractors. Remittances back home also significantly raise rural incomes, also highlighting economic imperatives to migrate.
Social Causes
Social motivations comprise improved education and health care, family reunification, as well as marriage. Cities have schools, higher-order medical facilities, and enhanced infrastructure that draw families and the young with ambitions for mobility. Improved telecommunication technologies have enabled migrants to sustain contact across distance, making social migration possible. In India, women mostly migrate for marriage, while men move mostly for work reasons, indicating gendered social motivations. Migration is also a consequence of a desire for a higher standard of living, social liberation, and enhanced personal security.
Political Reasons
Political unrest, violent conflicts, and persecution are main push factors. Wars such as the Syrian civil war, ethnic conflicts, and authoritarian repression have led millions to become refugees or asylum seekers. Political reasons leading to forced migration typically conclude in humanitarian crises, with displaced persons fleeing for asylum in proximal or distant countries. Geopolitical tensions and stringent immigration policies also spill into migration. Political refugees experience long displacement with challenging assimilation into receiving states.
Environmental Causes
Man-made and natural environmental changes like droughts, floods, cyclones, and long-term consequences of climate change like desertification and rising ocean levels have become significant migration forces. Coastal villages in Bangladesh, for example, are threatened with rising ocean levels rendering territories impassable, while drought in Africa and southern Asia has devastated farming communities, prompting migration. Environmental degradation often fosters economic frailties, creating compounding push forces. Migration is either seasonal or definitive based on the recovery potential. This side of migration is bound to escalate with climate change gathering steam.
Technological and Global Considerations
Technological advances in transport and communication make migration easier by cutting costs and risks. Greater mobility across the globe by air transport and road network, and the potential to sustain social networks across distance by internet and cellular phones, make migrating easier. Global labour markets are more linked together, with institutional and informal avenues assisting individuals to acquire work overseas. Social media also influence individuals’ aspirations and preferences, and inform migration flows more and more.
Effects of Migration
Economic Impacts
Economic consequences of migration are inconclusive:
Benefits for origin regions: Reduced surplus labour, reduced unemployment, inflows of remittances augment family incomes, education budgets, and domestic investment. Returing migrants will usually bring enhanced skills and new technologies.
Negative for origin jurisdictions: Brain drain or loss of skilled workers harms long-run potential and human capital, particularly in education and health facilities.
Beneficial to destination regions: Immigrants fill key gaps in labour, support aging societies, activate goods and services, provide tax revenues, and boost economic growth.
Negative for destination locations: Resource and service pressure (shelter, health facilities, schools), job competition above all in the low-skill segments, and exploitive or informal working arrangements are possible consequences.
Social Implications
Migrants bring with them cultural diversity, adding destination societies with new languages, cuisine, religions, and customs. Cultural diversity can promote tolerance and world awareness, and migrants can enjoy enhanced accessibility to higher-quality social services. Social problems can also be generated, such as social exclusion, discrimination, xenophobia, and cultural disputes. Migrants can experience identity crises or alienation, and rapid changes can also put pressure on social cohesion as well. Out-migration in the source regions can also change family structures and impose a greater social burden on staying family members, also primarily women.
Demographic Implications
It alters demographic outlines significantly. Urban centres bulge, at times, more than infrastructure can sustainably support. Rural areas are common with aging populations, as a consequence of their children moving away, slowing economic vigor and distorting dependency rates. Gender disparities can also result, in cases where migration is differential by sex. They have effects on electoral politics, resource distributions, and social planning at the region and national levels.
Abiotic Impacts
It contributes to a shortage of houses and more slums, increased pollution, sanitary problems with waste, water shortages, and green spaces degradation. Expansion due to migration frequently occurs without sufficient planning for cities, therefore putting stress on the environment. In contrast, depopulation in non-urban areas can leave room for natural regeneration while also lessening maintenance and care for farmed land, contributing further to degradation. Impacts on the environment are significantly dependent on both scale of migration and policy effectiveness.
Political and Policy Implications
Migration requires holistic policy responses with a focus on border control, integration, labour rights, and humanitarian protection. Recipient countries are torn between social cohesion and migrants’ inclusion. Global cooperation is critical for refugee protection and governing labour migration. Incompetent handling of migration in a balanced manner can lead to a risk of a nationalist backslash, social tensions, and a humanitarian disaster. Policies must focus on migrants’ rights, sustainable urbanisation, and climate resilience.
Case Studies / Examples
Internal Migration in India
India’s fast-paced rural-urban migration is a prime example of modern demographic transition. Approximately 30 million individuals migrate every year from rural interior districts to urban metropolises in response to economic emergencies and improved employments opportunities. Cities such as Mumbai, Delhi, and Bengaluru have witnessed infrastructure failure, widespread-slum expansion, and growing requirements for water supply and sanitation facilities. Migrants provide crucial labour force in construction, service, and manufacturing activities. Female migrants, under-represented and under-documented, experience problems such as under-employment and exposure to risk but also achieve new levels of autonomy. Policy measures have been responses such as affordable habitation schemes and urban renewal programs, though problems linger.
Syrian Refugee Crisis
Since 2011, Syria’s civil conflict ignited one of history’s biggest forced migrations. More than six million Syrians were made refugees in states within close proximity and far away, with millions internally displaced. The migration has had colossal humanitarian, political, and social effects on hosting states such as Turkey, Lebanon, and Germany. Barriers to assimilation are faced by refugees, and hosting states are exposed to tensions in accommodation, schooling, and health infrastructure. Depopulation and brain drainage afflict areas in Syria. Global responses are relief, resettlement, and rule-of-law regimes based on refugee protection, but the crisis is not solved.
Conclusion
It is a multifaceted and multidimensional process that is even driven by changing economic, social, political, and environmental forces. Even its outcomes reflect both opportunities — economic expansion, cultural diversity, and skill upgrading — and challenges — social friction, environmental pressure, and policy problems.
By dealing with migration, balanced territorial development, inclusive integration policies, migrants’ rights protection, and climate adaptation are key. Seeing migration as a dynamic force that shapes human geography offers key knowledge for sustainable development in a growingly interdependent world.
References
Black, R., Biao, X., Collyer, M., Engbersen, G., Heering, L., & Markova, E. (2006). Migration and development: Causes and consequences. The Dynamics of International Migration and Settlement in Europe, 41, 41-63.
Afsar, R. (1994). Internal migration and women: An insight into causes, consequences and policy implications. The Bangladesh Development Studies, 22(2/3), 217-243.
Ritchey, P. N. (1976). Explanations of migration. Annual review of sociology, 2, 363-404.
Drishti IAS. (2025).
Reasons and effects of. UN DESA. (2023).
World Migration Report. International Organization for Migration.
Government of India.
National Sample Survey: Patterns of Migration.
UNHCR. 2025. Reports on Syria Refugee. European Parliament. (2024).
Exploring Migration Causes. Internet Geography. 2022.
This detailed essay provides an in-depth examination of essential demographic measures that shape population structures and social characteristics across diverse societies worldwide. It emphasizes the significance of understanding the age-sex composition, the utility of the age-sex pyramid as a visual analytical tool, and the importance of various social indicators such as marital status, caste, regional distribution, and literacy levels. The analysis aims to synthesize theoretical frameworks with empirical data, facilitating informed policy-making and socio-economic planning. The discussion highlights how these demographic indicators influence population growth, social stratification, and development trajectories, underscoring their relevance in contemporary demographic studies and policy formulation. This essay serves as a foundational resource for demographers, policymakers, social scientists, and development practitioners seeking to understand the complex dynamics of population structures and their implications for sustainable development.
2. Introduction
Population studies are fundamental to understanding the social, economic, and health dynamics of societies. They encompass a wide array of measures that describe the composition and structure of populations, which are crucial for effective policy-making, resource allocation, and development planning. Among these measures, the age-sex structure provides vital insights into demographic momentum, potential growth, and aging trends. The population pyramid, a graphical representation of this structure, visually depicts the distribution of different age groups by sex, revealing underlying demographic trends and social patterns.
In addition to age and sex, other social indicators such as marital status, caste, regional distribution, and literacy levels play a significant role in shaping demographic patterns and social stratification. Marital status influences fertility rates and household structures, while caste and regional factors reflect social inequalities and access to resources. Literacy levels serve as a proxy for human capital and socio-economic development, impacting health outcomes, employment opportunities, and social participation. This essay systematically examines these measures, their interrelations, and their implications for development and policy-making.
3. Measures of Age-Sex Structure
3.1 Understanding Age-Sex Composition
The age-sex structure of a population is a fundamental demographic indicator that describes the distribution of individuals across various age groups and by gender. It influences population growth rates, dependency ratios, and social dynamics. A well-structured age-sex profile helps in understanding demographic momentum, potential for future growth, and the aging process within a society. This measure is crucial for planning in sectors such as healthcare, education, employment, and social security, as it provides insights into the current and future needs of the population.
3.2 Age-Sex Pyramid: A Visual Tool
The age-sex pyramid is a graphical representation that provides a snapshot of a population at a specific point in time. It consists of horizontal bars representing different age groups, with males on one side and females on the other. The shape of the pyramid offers insights into demographic trends: a broad base indicates high birth rates and a youthful population, while a narrow top suggests aging populations. Variations such as a constricted middle or irregular shapes can reveal issues like gender imbalances, migration effects, or mortality patterns. The pyramid’s shape is instrumental in demographic analysis, policy planning, and understanding social dynamics.
3.3 Population Composition and Its Significance
Population composition encompasses various demographic characteristics, including age, sex, marital status, caste, religion, literacy, and regional distribution. Analyzing composition helps in assessing socio-economic status, health needs, and development potential. For example, a youthful population may necessitate investments in education and employment, whereas an aging population might require healthcare and social security support. Regional disparities in composition can highlight inequalities and guide targeted interventions. Understanding these components is essential for designing effective social policies and development programs.
3.4 Marital Status and Its Demographic Significance
Marital status is a crucial social indicator that influences fertility, household structures, and social stability. It is typically categorized as single, married, widowed, divorced, or separated. Variations in marital status across regions and social groups impact population growth and social cohesion. Higher marriage rates often correlate with higher fertility, affecting population size and structure. Understanding marital patterns helps in designing policies related to family planning, social security, and health services. It also provides insights into social stability and changing cultural norms.
4. Caste, Regional Distribution, and Population Dynamics
Caste and regional factors significantly shape population distribution and social stratification. In countries like India, caste systems influence social mobility, access to resources, and demographic patterns. Regional disparities reflect differences in economic development, healthcare access, cultural practices, and historical contexts. Analyzing these factors helps identify marginalized groups, regional development needs, and social inequalities, guiding equitable policy formulation. Recognizing the influence of caste and regional differences is vital for promoting social justice and inclusive growth.
4.1 Literacy Level and Socioeconomic Development
Literacy is a key indicator of human capital and socio-economic development. Higher literacy levels are associated with better health outcomes, increased economic productivity, and greater social participation. Demographic studies often correlate literacy rates with fertility, mortality, and migration patterns, emphasizing the role of education in shaping population dynamics. Improving literacy levels is essential for sustainable development, reducing inequalities, and fostering social cohesion. Education policies aimed at increasing literacy can significantly influence demographic trends and overall societal progress.
4.2 Additional Points on Demographic Measures
Beyond the core measures, several other demographic indicators are vital for a comprehensive understanding of population dynamics. These include:
Migration Patterns: Internal and international migration significantly impact regional population distribution, labor markets, and urbanization trends. Migration can lead to demographic shifts, influence age-sex composition, and alter social structures.
Fertility and Mortality Rates: These fundamental indicators determine population growth or decline. Fertility rates reflect reproductive behavior, while mortality rates indicate health standards and healthcare effectiveness.
Dependency Ratios: These ratios compare the working-age population to dependents (young and old), providing insights into economic productivity and social support systems.
Urbanization Trends: Rapid urban growth affects demographic patterns, infrastructure needs, and social services, often leading to increased demand for housing, transportation, and healthcare facilities.
5. Discussion
The interplay of age-sex structure, population composition, marital status, caste, regional distribution, and literacy levels creates a complex demographic landscape. Regions with high literacy and advanced healthcare tend to have aging populations with declining fertility rates, reflecting demographic transition. Conversely, areas with limited access to education and healthcare often exhibit high birth rates and youthful populations, leading to rapid growth.
Marital status influences fertility and family size, which directly impact population growth rates. Socio-economic disparities, caste, and regional differences further exacerbate inequalities, affecting access to education, healthcare, and employment opportunities. These factors collectively shape social stratification and influence demographic trends. Recognizing these interrelations is vital for designing targeted policies that promote equitable development, social stability, and sustainable population growth.
6. Conclusion
Demographic measures such as the age-sex pyramid, population composition, marital status, caste, regional distribution, and literacy levels are essential tools for understanding population dynamics. They provide critical insights into growth patterns, social structure, and development needs. A systematic and comprehensive analysis of these indicators enables policymakers to address demographic challenges effectively, ensuring sustainable development and social equity. Future research should focus on integrating these measures with technological advancements and data analytics to enhance demographic planning, policy formulation, and resource management.
7. References
Andreev, E. M., Shkolnikov, V. M., & Begun, A. Z. (2002). Algorithm for decomposition of differences between aggregate demographic measures and its application to life expectancies, healthy life expectancies, parity-progression ratios and total fertility rates. Demographic research, 7, 499-522.
Carmichael, G. A. (2016). Fundamentals of demographic analysis: Concepts, measures and methods. Switzerland: Springer.
United Nations. (2019). World Population Prospects 2019. United Nations Department of Economic and Social Affairs.
United Nations Development Programme. (2020). Human Development Report 2020.
Singh, S. (2018). Demographic Transition and Population Growth. Journal of Population Studies.
Government of India. (2021). Census of India 2011. Office of the Registrar General & Census Commissioner.
This essay examines the profound impact of Mughal and British rule on the urban development, architecture, and socio-cultural identity of Indian cities. The Mughal emperors introduced geometric city planning, monumental architecture, and cosmopolitan marketplaces, creating integrated urban centers defined by gardens, forts, and bustling bazaars. In contrast, British colonialists imposed rational grid layouts, segregated neighborhoods, and modern infrastructure, fundamentally restructuring city landscapes through administrative and sanitary reforms. By comparing planning concepts, architectural styles, social organization, and enduring legacies, this essay highlights how the interplay of these two eras produced India’s unique urban morphology which came out as a blend of symbolic harmony and functional order that continues to shape the physical and cultural character of modern Indian cities.
1. INTRODUCTION
The cities of India are living palimpsests-layers of history, culture, and power inscribed upon their streets, monuments, and patterns of life. Over centuries, various dynasties, empires, and colonial regimes have contributed to their form and identity, but none more profoundly than the Mughals and the British. Each of these powers envisioned the city as a reflection of their ideals: for the
Mughals, it was a symbol of imperial glory, divine harmony, and aesthetic perfection; for the British, it became an instrument of control, order, and modernization. The Mughal period introduced a distinctly Indo-Islamic urban culture that celebrated geometry, balance, and environmental integration, visible in grand cities like Fatehpur Sikri, Agra, and Shahjahanabad. The British, arriving centuries later, reinterpreted urbanism through the lens of Western rationality, introducing wide avenues, civic institutions, and infrastructural systems that marked the onset of modern urban planning in India. Together, these two periods produced a remarkable dual legacy of the coexistence of historical beauty and colonial order-that continues to define the spatial and cultural character of Indian cities today.
2. Discussion
2.1 Mughal Influence [ Integration of power, Aesthetics and Culture]
The Mughal emperors (16th-18th century) were visionary urban planners who infused Indian cities with a blend of Persian, Central Asian, and indigenous Indian elements. They sought to create imperial capitals that were not just centres of governance but also expressions of cosmological order, grandeur, and cultural integration. Cities like Agra, Fatehpur Sikri, Lahore, and Shahjahanabad (Old Delhi) epitomize this vision.
Mughal urbanism prioritized symmetry and geometry like fortified walls and monumental gateways defined city boundaries, while axial avenues aligned palaces, mosques, and bazaars to create a hierarchical spatial order. The Persianinspired Charbagh gardens formed core elements, integrating nature, water, and architecture to symbolize paradise on earth and provide environmental comfort. Waterworks such as canals, tanks, and stepwells further enhanced urban functionality and aesthetics.
Architecturally, Mughal cities were dominated by grand constructions using red sandstone and white marble. Notable features included domes, minarets, arches, jharokhas (projecting balconies), and chhatris (elevated pavilions), manifesting an Indo-Islamic style marked by intricate ornamentation and monumentality. The Red Fort and Jama Masjid in Delhi, the Taj Mahal and Agra Fort in Agra, and the Shalimar Gardens in Lahore remain testaments to this era’s artistic and urban achievements.
Beyond architecture, Mughal cities were vibrant trade and craft centres, attracting artisans, scholars, and merchants from across Asia. Urban life was relatively integrated, with markets and neighbourhoods accommodating diverse religious and ethnic communities, fostering a cosmopolitan culture that underpinned both economic prosperity and social cohesion.
2.2 British Influence [ Rational Planning, Segregation and Modernity]
Contrasting with Mughal organic and symbolic city forms, British colonialism (18th-20th century) introduced rational, functional, and segregated urban models aligned with administrative control, military strategy, and commercial expansion. The British developed key presidency towns, for example, Calcutta (Kolkata), Bombay (Mumbai), and Madras (Chennai) by often expanding preexisting settlements or creating entirely new urban quarters.
British urban planning favoured gridiron layouts with wide, straight roads, clear zoning, and enforced segregation between Europeans and indigenous populations, embodied in the “White Town” and “Black Town” duality. Administrative buildings, cantonments, and civil lines were carefully laid out, with emphasis on sanitation, public health, and civic order. Public parks, railway stations, and colonial civic institutions like town halls and courts became prominent features of the urban landscape.
Architecturally, British cities displayed neo-classical, Gothic Revival, and IndoSaracenic styles that symbolized imperial power while incorporating local motifs. Buildings such as the Victoria Memorial in Kolkata, Gateway of India in Mumbai, and Rashtrapati Bhavan in New Delhi display this hybrid grandeur. The creation of New Delhi as the colonial capital in the early 20th century epitomized British urban ambitions with monumental axes, hexagonal road grids, and imposing government complexes designed by architects like Edwin Lutyens and Herbert Baker.
Railway expansion, port development, and telegraph networks spurred industrial growth and connected colonial cities to global trade circuits. However, British urban policies often neglected Indian quarters, maintaining social segregation and reinforcing racial hierarchies.
2.3 Comparative Insights
The Mughal and British periods reflect divergent urban philosophies. Mughals emphasized symbolic imperialism, integration, and environmental harmony, while the British stressed administrative efficiency, segregation, and modern infrastructure. Mughal cities blended religious, commercial, and residential uses in hierarchical, organic patterns; British cities introduced zoning, gridiron layouts, and clear social separation. Architecturally, the Mughals emphasized Indo-Islamic synthesis; the British created eclectic hybrids with European forms and Indian motifs. Despite differences, both eras profoundly shaped Indian urban identity. Mughal heritage endures in the lively bazaars, gardens, and forts of historical cores, while British legacies structure metropolitan governance, transportation, and commercial activities, visible in central business districts and civic institutions.
Conclusion
The Mughal and British influences form intertwined yet distinct chapters in the urban history of India. Mughal cities reflected the grandeur of imperial power, artistic refinement, and cultural synthesis. Their urban form was characterized by symmetry, geometric planning, and monumental architecture that embodied both aesthetic unity and functional harmony. Features such as fortified walls, axial streets, grand mosques, bustling bazaars, and lush gardens created an environment that celebrated inclusivity and cosmopolitanism. Cities like Agra,
Delhi, and Fatehpur Sikri showcased how Mughal urbanism integrated Islamic, Persian, and Indian traditions, producing a vibrant and human-scaled urban experience.
In contrast, British colonial cities represented an entirely different set of priorities rooted in administration, control, and economic exploitation. The British introduced grid layouts, civil lines, cantonments, and segregated zones that physically and socially divided colonial elites from the indigenous population. Cities such as Bombay (Mumbai), Calcutta (Kolkata), and Madras (Chennai) became symbols of modernization and infrastructural progress, featuring railways, ports, and civic buildings in the neoclassical style. Yet, they also reflected deep spatial and racial hierarchies. Together, Mughal and British influences created a rich, layered urban morphology that continues to shape the cultural, architectural, and social identity of Indian cities today. Understanding this composite legacy is vital for informed urban conservation, sustainable development, and culturally rooted planning in contemporary India.
References
1. Iftikhar, R. (2016). Urban formation and cultural transformation in Mughal India. International Planning History Society Proceedings.
Population studies form a central component of social science research because they deal with the most fundamental unit of society — people. By examining how populations grow, decline, move, and change their internal composition, population studies provide the empirical basis for planning public services, designing economic policies, and understanding social change.
This document presents a comprehensive, plain-language exploration of population studies and human dynamics. It is written to be accessible for students, planners, and professionals who require a thorough overview without dense academic referencing. The chapters that follow cover theoretical foundations, measurement techniques, key demographic indicators, contemporary global and regional trends, migration and urbanization, population composition and pyramids, population policies, interactions with the environment, and challenges for the twenty-first century.
Each section includes clear explanations, real-world illustrations, and practical implications for policy and planning. Readers will leave with a solid grasp of demographic concepts and how those concepts translate into action at the local, national, and international levels.
2. Concept of Population
In demography, the term ‘population’ denotes all individuals living in a defined geographic area at a given point in time. This definition can be adapted to specific analytical needs: a population may be residents of a city, a cohort born in the same year, or a group defined by shared characteristics such as occupation or health status.
Population studies therefore require clarity about the unit of analysis. For instance, a study of ‘urban population’ may focus on city-dwellers’ living conditions, while a study of ‘working-age population’ may examine labor market dynamics. A population is usually described in terms of size (how many), distribution (where they live), and composition (who they are). Size is a raw count; distribution maps where people live; composition breaks the population down by age, sex, education, marital status, and socioeconomic attributes.
These three descriptive pillars make population data actionable for decision-makers. Size alerts planners to the volume of needs; distribution identifies spatial priorities; composition reveals the types of services required. For example, a municipality with a large proportion of elderly residents will prioritize healthcare and accessible infrastructure, while one with a youth bulge may invest more in education and job creation.
3. Scope and Importance of Population Studies
Population studies address multiple interlocking questions about humans and their environments. They are interdisciplinary by necessity, drawing from sociology, economics, geography, public health, and environmental science. Key topics include fertility (how many children are born), mortality (how many people die), and migration (how people move).
Beyond these core processes, demographers study population distribution and density, household structure, population aging, fertility preferences, and the social determinants of health. The importance of population studies cannot be overstated. Governments use population data to allocate budgetary resources, locate hospitals and schools, design pension systems, and formulate immigration rules. Planners use population projections to size water systems, roads, and housing stocks.
Businesses use demographic profiles to select market segments and locate retail outlets. Non-governmental organizations depend on population indicators to target interventions such as vaccination campaigns, maternal health programs, and livelihood projects. Researchers rely on demographic measures to evaluate long-term trends such as urbanization, aging, and the demographic dividend. In short, population studies inform virtually every domain of collective decision-making.
4. Sources of Population Data
Accurate data underpins all credible population analysis. Different sources offer complementary strengths and limitations. Familiarity with these sources allows analysts to choose the most appropriate data for a given task.
National Censuses: Large-scale enumeration typically carried out every ten years. Censuses aim for complete counts and provide detailed demographic, social, and housing information. They are the backbone of national population statistics but are expensive and infrequent.
Vital Registration Systems: Systems that record births, deaths, marriages, and divorces. When complete and timely, vital registration provides continuous tracking of vital events and helps compute indicators like crude birth rate and infant mortality rate. Completeness varies across countries.
Household Surveys: Surveys such as demographic and health surveys, labor force surveys, and household income surveys deliver regular, sample-based estimates of demographic indicators and often include rich socioeconomic data. Their reliability depends on sample design and implementation.
Administrative Data: Records generated by government programs like education enrollment, tax records, and national ID systems. These are useful for near-real-time monitoring but may suffer from coverage gaps and privacy considerations.
Special Studies and Research Projects: Targeted studies — for example, migration mapping, fertility preference studies, or longitudinal cohort studies — provide depth on particular questions that broader sources may not cover.
5. Population Growth and Trends
Population growth is the result of the interaction between fertility, mortality, and migration. Historically, the global population growth rate accelerated in the twentieth century due to dramatic declines in mortality following advances in medicine, sanitation, and food production. This ‘health transition’ meant more children survived into adulthood and life expectancy increased.
However, fertility rates in many parts of the world have since declined, producing a range of outcomes: some countries maintain steady growth, others are rapidly expanding, and some are experiencing stagnation or decline. Trends vary markedly by region: many countries in sub-Saharan Africa continue to see high fertility and young populations; much of Europe, East Asia, and parts of the Americas face aging populations and low birth rates.
Analysts monitor not only absolute population size but also growth momentum, age structure, and spatial patterns. ‘Growth momentum’ refers to continued population growth because of a large cohort of young people, even if fertility falls. Spatially, population growth is often uneven — urban areas tend to grow faster than rural ones due to migration and natural increase, creating pressures on city infrastructure and services.
6. Population Theories
6.1 Malthusian Theory and Its Legacy
Thomas Malthus argued in the late 18th century that population growth, if left unchecked, would outstrip food production and lead to famine, disease, and conflict. Malthusian theory emphasized natural limits and the potential for scarcity.
While critics point out that technological advances in agriculture (the Green Revolution) and industrial organization have historically expanded food supply beyond Malthus’s arithmetic assumptions, the core insight — that resources, environment, and population interact — remains influential. Modern ‘neo-Malthusian’ perspectives focus on environmental carrying capacity, resource depletion, and the ecological consequences of large populations.
6.2 Marxian and Structural Perspectives
Marxian perspectives challenge the idea that population itself is the primary problem. Instead, they emphasize social and economic systems that produce inequality and misallocation of resources. Under this view, poverty and famine often result from structural arrangements, distributional conflicts, and policy failures, not simply from an excess of people. This approach leads to different policy prescriptions: instead of population control alone, advocates call for redistribution, agricultural reform, and social safety nets to ensure equitable access to resources.
6.3 Demographic Transition Model (DTM)
The Demographic Transition Model describes how countries move from high birth and death rates to low birth and death rates as they industrialize and develop. The model typically identifies several stages: a pre-transition stage (high fertility and mortality), a transition stage (mortality declines followed by fertility decline), and a post-transition stage (low fertility and mortality, leading to slower growth or stabilization).
The DTM provides a useful framework for understanding general patterns, but it is not deterministic. Cultural, policy, and economic differences can alter the timing and path of demographic change. For example, some countries experience rapid fertility decline due to targeted family planning and female education, while others maintain high fertility despite economic growth.
7. Fertility and Mortality
Fertility and mortality are fundamental demographic processes. Fertility measures include the Total Fertility Rate (TFR) — the average number of children a woman would have over her lifetime at current age-specific fertility rates — and crude birth rate (CBR), which is births per 1,000 population per year. Mortality measures include crude death rate (CDR) and life expectancy at birth, along with infant and under-five mortality rates which capture child survival conditions.
Factors influencing fertility are diverse: socio-economic status, female education, child mortality rates, cultural norms, contraceptive availability, and government policies all play roles. Mortality is influenced by healthcare access, nutrition, sanitation, disease environment, conflict, and age structure.
Public interventions aimed at reducing mortality — such as immunization programs, basic sanitation, and maternal care — have historically driven large gains in life expectancy. Understanding the interplay between fertility and mortality helps explain the pace and nature of population change. For instance, a rapid fall in mortality accompanied by only a slow decline in fertility can produce a ‘population explosion’ as seen in many countries during the twentieth century.
8. Migration and Urbanization
Migration reshapes population size and composition across places. It is driven by push factors (poverty, conflict, environmental degradation) and pull factors (jobs, education, better services). Migration can be temporary or permanent, internal or international, voluntary or forced.
Urbanization — the rise in the share of people living in cities — is closely linked to migration. Rural-to-urban migration often fuels city growth, while natural increase (births minus deaths) also contributes. Urbanization brings economic opportunities and innovation but also concentrates problems like housing shortages, traffic congestion, pollution, and informal settlements.
8.1 Types of Migration
Internal migration includes movements within national borders, commonly rural-to-urban or between cities for employment. International migration crosses borders and includes labor migrants, refugees, family reunification, and highly skilled professionals.
Circular migration involves repeated movements between origin and destination, often tied to seasonal work. Each type has different implications: internal migrants may influence urban labor markets and housing demand, while international migration raises questions about integration, remittances, and transnational ties.
8.2 Urbanization and Its Impacts
Rapid urban growth transforms economies and landscapes. On the positive side, cities concentrate labor and capital, enabling economies of scale, better access to services, and cultural exchange. Clusters of industries and services foster innovation and higher productivity.
However, when urban growth outpaces planning, it leads to slums, inadequate infrastructure, and environmental degradation. Managing urban growth requires investment in affordable housing, public transport, waste management, and inclusive governance. Moreover, peri-urban expansion changes land use and can produce conflicts over resources and livelihoods.
9. Population Distribution and Density
Population distribution answers the question: where do people live? Patterns are shaped by physical geography (climate, water availability, topography), economic opportunities, historical settlement patterns, and policy decisions. Densely populated areas tend to be river valleys, fertile plains, and coastal zones that historically supported agriculture and trade. Sparse regions include deserts, high mountains, and extreme climates.
Population density — measured as people per square kilometer or mile — is a blunt but useful indicator for planning infrastructure and services. High-density cities demand vertical expansion, multi-modal transport, and carefully managed public spaces, while low-density rural regions present different challenges, such as providing dispersed public services efficiently.
10. Population Composition
Composition refers to the internal structure of a population by age, sex, education, occupation, and other attributes. Age structure is especially informative: it determines dependency ratios (the ratio of non-working age to working-age population) and signals future social service needs. A common visual tool is the population pyramid — a bar chart that displays age groups by sex.
A broad-based pyramid indicates a young population with high fertility; a rectangular shape suggests low fertility and low mortality typical of developed countries; a top-heavy pyramid signals population aging.
Other compositional characteristics — such as educational attainment, urban/rural residence, and employment sectors — influence economic potential and social needs. For example, a population with rising educational attainment can support more complex economic activities, but only if the economy can create matching jobs.
11. Methods of Population Analysis
Demographers use several quantitative and qualitative methods to analyze population dynamics. Key quantitative methods include the cohort-component method for projections, life table analysis for mortality and survival probabilities, and measure construction for fertility and mortality indicators.
The cohort-component method projects future populations by age and sex by applying age-specific fertility, mortality, and migration rates to a base population. This method is flexible and widely used by national statistical offices for medium- and long-term planning.
Life tables convert age-specific mortality rates into survival probabilities and are critical for calculating life expectancy. Qualitative methods — such as focus group discussions, household interviews, and ethnographic fieldwork — provide contextual understanding of fertility decisions, migration motivations, and social norms.
Mixed-methods approaches that combine statistical trends with qualitative insights are particularly valuable for policy-relevant research.
12. Key Demographic Indicators and How to Interpret Them
Understanding a core set of indicators is essential for interpreting population data. Below are commonly used measures and what they reveal:
Total Fertility Rate (TFR): The average number of children a woman would have over her reproductive lifetime given current age-specific fertility rates. A TFR of around 2.1 is often called ‘replacement level’ in many populations.
Crude Birth Rate (CBR): Births per 1,000 population in a year. Useful for quick comparisons but sensitive to population age structure.
Crude Death Rate (CDR): Deaths per 1,000 population in a year. Like CBR, it depends on age structure and may be high in aging populations even with good health services.
Infant Mortality Rate (IMR): Deaths of infants under one year per 1,000 live births. A key indicator of child health and the performance of health systems.
Life Expectancy at Birth: The average number of years a newborn is expected to live under current mortality conditions. It summarizes overall mortality conditions in a single figure.
Dependency Ratio: Ratio of dependents (young and old) to working-age population; high ratios imply greater economic pressure on the productive population.
Population Growth Rate: The annual percentage change in the population resulting from natural increase and net migration.
13. Population Policies and Planning
Governments adopt population policies to influence demographic processes or to respond to demographic trends. Policies may be pronatalist (encouraging higher fertility), antinatalist (encouraging lower fertility), or neutral but adaptive (providing services for current demographic realities).
Examples of pronatalist policies include child allowances, parental leave, and subsidized childcare. Antinatalist measures have included family planning services, education campaigns, and in extreme historic cases, legal restrictions. Adaptive policies focus on infrastructure development, pension reform, and healthcare expansion to accommodate an aging population or rapid urban growth.
Effective policy-making depends on accurate data, transparent institutions, and participatory approaches that respect human rights. Coercive policies undermine trust and can have long-term social costs, so modern population policy emphasizes voluntarism, access to information, and broad-based social development.
14. Population and Environment
Population dynamics have significant environmental consequences. More people generally imply more consumption of land, water, energy, and materials, and greater generation of waste and emissions. However, the relationship between population and environment is mediated by consumption patterns and technology.
High-income populations often have disproportionately large environmental footprints per capita. Environmental challenges linked to population include deforestation for agriculture and housing, loss of biodiversity, urban air and water pollution, and increased greenhouse gas emissions.
Rapid population growth in ecologically fragile areas can exacerbate land degradation and water scarcity. Sustainable development frameworks therefore emphasize not just population numbers, but sustainable consumption, efficient technologies, and equitable resource governance.
Policies that combine family planning, education (especially for women), renewable energy adoption, and sustainable urban design can help reduce the environmental impacts of population change.
15. Case Studies and Illustrations
Concrete examples help translate abstract demographic concepts into real-world insights. The following short case studies illustrate common demographic scenarios and policy responses.
Case Study: The Youth Bulge and Economic Opportunity Many countries in the global South exhibit a ‘youth bulge’ — a disproportionately large cohort of young people. If harnessed through education, skills training, and job creation, a youth bulge can yield a demographic dividend: accelerated economic growth resulting from a high ratio of workers to dependents.
However, if economies fail to provide productive work, high youth unemployment can lead to social unrest and wasted human potential. Policy responses include investing in secondary and tertiary education, vocational training linked to market needs, entrepreneurship support, and macroeconomic policies that stimulate job-rich growth.
Case Study: Population Aging and Welfare Systems Several developed and some middle-income countries face rapid population aging due to sustained low fertility and improved survival. Aging increases demand for healthcare, long-term care, and pensions, while shrinking the share of workers paying taxes.
Responses include raising the retirement age, reforming pension systems to ensure sustainability, investing in ‘aging in place’ infrastructure, and encouraging labor force participation among older adults. Integrating technology into elder care and preventive health measures can also alleviate pressures on healthcare systems.
Case Study: Informal Settlements in Rapidly Growing Cities When urban growth outstrips housing supply and planning capacity, informal settlements expand.
These are characterized by insecure tenure, inadequate sanitation, and overcrowding. Interventions that have shown promise include slum upgrading programs that provide tenure security, incremental housing improvements, community-led sanitation projects, and participatory land-use planning.
Successful approaches work in partnership with local communities, combine physical upgrades with livelihood and social services, and ensure long-term affordability.
16. Challenges and Future Prospects
Looking ahead, demographers and policymakers face multiple intertwined challenges. Climate change will increasingly interact with population dynamics, through climate migration, effects on agricultural productivity, and pressures on coastal cities from sea-level rise.
Advances in healthcare and biotechnology may alter mortality and morbidity patterns in unpredictable ways. Demographic uncertainty complicates long-range planning. Policymakers must prepare flexible systems that can adapt to a range of futures.
Investing in human capital — education and health — remains the most robust strategy for enhancing societal resilience. Equally important are inclusive institutions and policies that reduce inequalities and ensure that demographic change translates into broadly shared development gains.
17. Practical Implications for Urban and Regional Planners
Population studies directly inform planning practice. Planners use demographic projections to estimate future demand for housing, water, transportation, and social services. Some practical recommendations include: • Integrate demographic analysis into all stages of planning: baseline studies, scenario development, and monitoring. • Pay special attention to age structure: a young population needs schools and job programs; an aging population needs accessible infrastructure and healthcare. • Monitor migration flows and their drivers to anticipate housing and labor market shifts. • Design flexible, modular infrastructure that can be scaled up or repurposed as demographic conditions change. • Engage communities in participatory planning to ensure that demographic diversity is reflected in design choices.
18. Research and Data Needs
To improve policy relevance, population research should prioritize the following: • Strengthening civil registration and vital statistics to provide timely data on births, deaths, and causes of death. • Enhancing the frequency and geographic detail of household surveys to capture subnational dynamics. • Investing in longitudinal cohort studies to understand life-course determinants of fertility, health, and migration. • Combining traditional data sources with new data streams (e.g., mobile phone data, satellite imagery) while addressing privacy and ethical concerns. • Promoting capacity-building in statistical offices and universities so that demographic analysis informs policy at all levels.
19. Conclusion
Population studies illuminate the contours of human dynamics and provide essential information for effective governance, development, and environmental stewardship. By tracking how people reproduce, die, and move, demographers offer insights that matter for classrooms and clinics, for city streets and national budgets.
The diverse challenges of the twenty-first century — from climate change to technological disruption — mean that demographic knowledge is more important than ever.
A constructive way forward combines accurate measurement, humane policy design, and investments in education and health. With these foundations, demographic change can be a source of opportunity rather than crisis.
20. Appendix: Glossary of Key Terms
Population Density: Number of people per unit area, an indicator of how crowded a place is.
Cohort: A group of people who experience a particular event in the same time period, often used for birth cohorts.
Demographic Dividend: The economic growth potential that can result from shifts in a population’s age structure, typically when the working-age population grows relative to dependents.
Dependency Ratio: A measure of the proportion of dependents (young and old) relative to the working-age population.
Life Table: A table that shows, for a cohort, the probability of surviving to each age.
Net Migration: The difference between the number of immigrants and emigrants in a population over a period of time.
Replacement Level Fertility: The TFR at which a population exactly replaces itself from one generation to the next, without migration; usually around 2.1 in many settings.
20. Links and References
Duncan, S. R., Duncan, C. J., & Scott, S. (2001). Human population dynamics. Annals of Human Biology, 28(6), 599-615.
Hassan, F. A. (2002). Population dynamics. In Companion Encyclopedia of Archaeology (pp. 672-713). Routledge.
Lee, R. D. (1987). Population dynamics of humans and other animals. Demography, 24(4), 443-465.
Demographic variables are the statistical characteristics that describe human populations in terms of their size, structure, and dynamics. They help in analysing patterns of birth, death, migration, education, income, and social behaviour across different regions and time periods. This essay discusses the major categories of demographic variables—basic, socio-economic, socio-cultural, process, migration, composition, health, environmental, and political—and explains how each contributes to understanding population change and development. By linking these variables to urban and regional planning, the essay highlights their role in shaping sustainable cities, equitable policies, and informed governance. Ultimately, demographic variables serve as essential tools for understanding the human condition and its evolution in response to social, economic, and environmental forces.
Introduction:
Demography, derived from the Greek words demos (people) and graph (to write), is the scientific study of human populations—their size, distribution, structure, and changes over time. It examines how populations evolve through births, deaths, and migration, and how these changes affect societies, economies, and environments. Within this discipline, demographic variables are the measurable attributes used to describe populations and analyse trends. They provide the empirical foundation upon which population projections, planning strategies, and social policies are built.
The study of demographic variables is central to urban and regional planning. Population characteristics influence the demand for housing, transport, education, healthcare, employment, and public infrastructure. For instance, a youthful population requires schools, universities, and job creation, whereas an ageing population demands healthcare services and accessible urban design. Similarly, migration patterns influence city growth, density, and spatial structure. Thus, an understanding of demographic variables enables planners and policymakers to make informed and sustainable decisions that align with societal needs.
This essay aims to examine the key demographic variables in detail, classify them into meaningful categories, and discuss their significance in understanding population dynamics and guiding socioeconomic and spatial development.
Discussion:
1. Basic Demographic Variables
Basic demographic variables form the foundation of population studies. They describe fundamental personal characteristics such as age, sex, marital status, and household type.
Age: Age is one of the most critical demographic variables because it determines the population’s structure and productivity. The distribution of age groups (children, working-age adults, and elderly) affects labour force participation, dependency ratios, and the type of services required. For example, a high proportion of young people indicates future labour potential but also a greater burden on educational and childcare systems.
Sex (Gender): The sex composition of a population is expressed through the sex ratio, usually measured as the number of females per 1,000 males. Gender balance affects marriage patterns, labour markets, and social stability. In many developing countries, skewed sex ratios reflect gender discrimination and selective birth practices.
Marital Status: This variable classifies individuals as single, married, divorced, or widowed. It has implications for fertility levels, household formation, and housing demand.
Household Size and Type: Households can be nuclear, joint, or single-person, and their size influences housing needs, consumption patterns, and community planning.
Together, these variables shape the composition and social organization of populations, providing the basis for more complex demographic analysis.
2. Socio-Economic Variables
Socio-economic variables describe the economic and social dimensions of individuals and groups. They reveal inequalities in access to resources and opportunities, influencing fertility, mortality, and migration behaviours.
Education and Literacy Level: Education enhances skills, productivity, and awareness. Literate populations have lower fertility rates, better health outcomes, and higher income levels. Literacy also empowers women, enabling them to participate in decision-making and formal employment.
Occupation: Occupation reflects the nature of work performed—manual, professional, or managerial—and provides insight into the economic structure of a population. Occupational distribution also indicates the stage of economic development, such as agricultural, industrial, or service-dominated economies.
Income: Income determines the standard of living and access to essential goods and services. Higher income levels often correlate with lower fertility and mortality, as well as improved housing and nutrition.
Employment Status: The employment rate shows the proportion of the working-age population engaged in economic activity. High unemployment can lead to migration and social unrest, while high employment fosters stability and growth.
Housing Conditions: Housing is a key indicator of quality of life. Variables such as tenure (owned or rented), size, and access to amenities reveal disparities in living standards.
Access to Basic Services: Availability of clean water, sanitation, electricity, and internet connectivity reflects the level of infrastructure development and directly influences health and well-being.
Socio-economic variables thus connect demography with development, highlighting the interdependence of population characteristics and economic progress.
3. Socio-Cultural Variables
Culture and social identity strongly shape demographic behaviour. Socio-cultural variables explain how traditions, values, and social structures influence fertility, marriage, and migration.
Religion: Religious beliefs often affect reproductive behaviour, gender roles, and population policies. For instance, some religions encourage large families, while others promote family planning.
Caste and Ethnicity: In countries like India, caste and ethnicity determine access to education, employment, and social mobility. They also affect spatial segregation and policy targeting.
Language: Language defines cultural identity and social integration. Multilingual societies often experience internal migration and cultural diversity, influencing planning decisions for education and communication.
Customs and Traditions: Social customs determine age at marriage, family size, and gender expectations. Traditional norms can either support or hinder modernization and population control measures.
Understanding socio-cultural variables is crucial for designing inclusive policies that respect diversity while promoting equity.
4. Demographic Process Variables
Demographic processes—fertility, mortality, and migration—are the mechanisms through which populations change over time.
Fertility Rate: The total fertility rate (TFR) measures the average number of children a woman would bear during her lifetime. It is influenced by education, income, health, and cultural factors.
Mortality Rate: Mortality measures the frequency of deaths in a population. High mortality rates often indicate poor healthcare and living conditions.
Birth Rate and Death Rate: These annual rates show natural population increase or decrease.
Life Expectancy: Represents the average number of years an individual is expected to live. Higher life expectancy reflects better healthcare, nutrition, and living standards.
Together, these variables explain the natural growth or decline of populations and provide critical input for health and social planning.
5. Migration and Mobility Variables
Migration refers to the movement of people from one place to another, temporarily or permanently. It reshapes the demographic, social, and economic landscape of both origin and destination regions.
Place of Birth and Residence: Distinguishes migrants from natives in population data.
Migration Rate: Measures the volume of migration in or out of an area.
Type of Migration: Classified as rural-to-urban, urban-to-rural, intra-state, inter-state, or international.
Reason for Migration: Includes employment, education, marriage, displacement, or conflict.
Duration of Stay: Determines whether migration is temporary or permanent.
Migration affects urbanization, labour supply, housing demand, and cultural diversity. In developing countries, rapid rural-to-urban migration often leads to informal settlements and planning challenges.
6. Population Composition Variables
These variables describe how a population is structured in terms of its demographic characteristics.
Dependency Ratio: The ratio of dependents (under 15 and over 60) to the working-age population (15–59). A high ratio means a greater economic burden on the workforce.
Sex Ratio: Indicates gender balance in a society and helps identify gender-based inequalities.
Population Density: Refers to the number of people per unit area. High densities indicate urban concentration, while low densities show rural dispersion.
Urban–Rural Distribution: Reflects the level of urbanization and infrastructure concentration.
Population Growth Rate: The percentage increase or decrease in population over a specific period, combining both natural growth and migration.
These indicators help planners assess service needs, design infrastructure, and allocate resources efficiently.
7. Health and Well-being Variables
Health variables describe the physical and mental condition of a population, which directly impacts productivity and quality of life.
Nutritional Status: Evaluated through dietary intake, BMI, and child malnutrition rates.
Disease Prevalence: Identifies the spread of communicable and non-communicable diseases.
Health Insurance Coverage: Determines access to medical care and financial protection.
Disability Status: Highlights the proportion of people with physical or mental disabilities requiring special support.
Health indicators are essential for planning hospitals, healthcare staff, and preventive programs.
8. Environmental and Geographic Variables
Environmental factors influence where and how populations live.
Settlement Type: Urban, suburban, rural, or peri-urban classifications determine density and land use.
Climatic and Environmental Conditions: Affect agriculture, housing design, and migration.
Access to Natural Resources: Availability of water, land, and energy shapes economic activities and settlement patterns.
Understanding the environmental context of demographic variables ensures that development plans are sustainable and resilient to climate change.
9. Political and Legal Variables
These variables capture the political and institutional framework governing populations.
Citizenship or Nationality: Defines an individual’s legal belonging and rights within a country.
Voting Eligibility: Determines participation in democratic processes.
Legal Status of Migrants: Distinguishes between citizens, refugees, asylum seekers, and undocumented persons, affecting access to services and protection.
Political variables influence population inclusion, migration policies, and rights-based planning.
Demographic variables collectively offer a comprehensive picture of human populations — their characteristics, behaviour, and evolution. They are not isolated indicators but interdependent elements shaping the dynamics of growth, distribution, and well-being. In planning and governance, demographic analysis helps determine the need for infrastructure, education, employment, healthcare, and housing. It also assists in anticipating challenges such as ageing populations, youth unemployment, or rapid urbanization.
By studying demographic variables such as age, fertility, migration, education, and income, societies can identify inequalities and design targeted interventions. The integration of demographic data with spatial planning ensures that development is both inclusive and sustainable. In an era of globalization and environmental uncertainty, understanding demographic variables is crucial for building resilient communities and promoting balanced regional development.
References:
United Nations (2022). World Population Prospects.
Weeks, John R. (2015). Population: An Introduction to Concepts and Issues. Cengage Learning.
Government of India (2011 & 2021). Census of India Reports.
National Family Health Survey (NFHS-5), Ministry of Health and Family Welfare (2020).
Todaro, Michael P. & Smith, Stephen C. (2020). Economic Development. Pearson Education.
United Nations Development Programme (UNDP). Human Development Reports.
Chandna, R.C. (2021). Geography of Population: Concepts, Determinants and Patterns. Kalyani Publishers.
Sharma, P.R. (2018). Population and Settlement Geography. Rawat Publications.
Urbanization has blurred the traditional divide between rural and urban areas. This change has created transitional spaces that challenge the old split. This article looks at urban centers, the rural-urban continuum, and their connections. It argues that today’s settlements exist on a spectrum rather than as isolated areas. They have mixed land uses, changes in job types, and shared infrastructure.
Using examples from India, such as Bhopal and Gurugram, the article shows how peri-urban growth reflects this continuum. It stresses the importance of understanding and planning for these mixed areas to achieve balanced and sustainable regional development.
2. Introduction
Urbanization has become one of the most important trends of the 21st century. The spread of cities, changes in villages, and the development of transitional spaces have blurred the traditional lines between rural and urban. In the past, settlements were seen in a straightforward rural-urban dichotomy, with villages representing agriculture and simplicity and cities symbolizing industry and modern life. However, development, migration, and technology have made this binary less useful for describing the complex relationships that exist today.
In the study of human settlements and regional planning, three related concepts stand out: Urban Centers,Rural-Urban Dichotomy, and the Rural-Urban Continuum. Urban centers act as the main areas of economic and administrative activity, while the continuum shows the smooth gradation connecting rural and urban regions. This article will explore these ideas in depth, considering their evolution, connections, and effects on urban and regional planning in India and elsewhere.
3. Understanding Urban Centers
An urban center is a defined area marked by a high population density, a concentration of economic activities, and urban infrastructure like roads, public services, and buildings. Urban centers act as main points for trade, governance, and culture. They are more than just settlements; they drive growth and attract people and investment from surrounding areas.
3.1Types of Urban Centers
Urban centers can be divided into categories based on size, function, and influence:
3.1.1 Metropolitan Cities:
Large cities with populations over one million, such as Delhi, Mumbai, and Bengaluru. These cities serve as economic and cultural hubs on a national or regional level.
3.1.2 Medium and Small Towns:
Places like Bhopal, Indore, or Jabalpur that serve regional roles and provide essential services to nearby rural communities.
3.1.3 Satellite Towns and Suburban Centers:
Smaller towns or urban areas close to big cities (e.g., Gurugram near Delhi, Navi Mumbai near Mumbai), developed to reduce pressure on metropolitan cores.
3.2 Functions of Urban Centers
Urban centers have many roles: administrative (capitals and municipal centers), commercial (markets and trade hubs), industrial (manufacturing areas), cultural (educational and heritage sites), and service-oriented (healthcare, finance, information technology). They function as Central Places, a concept introduced by Walter Christaller in his Central Place Theory (1933), where settlements are arranged in a hierarchy to supply goods and services to surrounding regions.
3.3 Hierarchy and Influence
Urban centers exist in a hierarchical network: small towns serve local populations, while large metropolitan areas impact entire states or even countries. For instance, Bhopal serves as the administrative and service center for central India, providing jobs, education, and healthcare to people beyond its borders.
However, the growth of urban centers also leads to challenges like overcrowding, poor infrastructure, pollution, and inequality. These problems emphasize the need for a broader view, which includes both the city and its surrounding area. This transition is addressed by the rural-urban continuum.
4. The Rural-Urban Dichotomy
The rural-urban dichotomy is a classic approach that separates human settlements into two distinct categories: rural and urban. This classification depends on differences in occupation, lifestyle, population density, and infrastructure.
4.1Basis of Dichotomy
4.1.1 Economic:
Rural areas mainly rely on agriculture and related activities.
Urban areas focus on industry, services, and the tertiary sector.
4.1.2 Social:
Rural societies are usually homogeneous, community-focused, and traditional.
Urban societies are diverse, individualistic, and modern.
4.1.3 Physical:
Rural settlements show scattered patterns and low density.
Urban areas are compact, dense, and well-developed.
4.1.4 Functional:
Villages act as production sites for raw materials.
Cities serve as centers for processing, distribution, and administration.
4.2 Critique of the Dichotomy
While the dichotomy offered clarity in earlier analyses, it has grown increasingly outdated. The rise of technology, transport networks, and communication has connected rural and urban areas like never before. Rural residents often commute to urban centers for jobs, education, and healthcare, while urban residents depend on rural areas for food, land, and leisure.
Moreover, modern development has created hybrid spaces— areas that are neither fully rural nor entirely urban. These transitional spaces challenge the dichotomy and have prompted scholars like Sorokin and Zimmerman (1929) to propose the idea of a Rural-Urban Continuum.
5. The Rural-Urban Continuum
The Rural-Urban Continuum shows a gradual transition from purely rural to purely urban forms rather than a strict separation. It acknowledges that settlements exist on a spectrum, with intermediate stages that merge rural and urban traits.
5.1 Conceptual Background
Put forth by Pitirim Sorokin and Carle Zimmerman, the continuum model highlights that social, economic, and spatial characteristics change progressively. Instead of viewing villages and cities as opposites, they are seen as part of an ongoing urbanization process.
5.2 Indicators of the Continuum
5.2.1 Occupational Transformation:
The movement from agricultural jobs to non-agricultural roles in peri-urban areas.
5.2.2 Infrastructure and Services:
Villages close to cities often have better roads, electricity, and educational facilities similar to urban areas.
5.2.3 Migration and Commuting:
Daily travel for work and education strengthens connections.
5.2.4 Land Use Patterns:
Agricultural land is converted for housing, industries, and institutions on city outskirts.
5.2.5 Cultural and Lifestyle Changes:
Rural populations adopt urban habits, media consumption, and aspirations.
5.3 Spatial and Functional Dynamics
Urban growth creates peri-urban areas—transitional zones between city boundaries and rural regions. These areas show mixed land use, rapid real estate development, and demographic change. They also represent the most dynamic elements of the urban system.
For example, in Bhopal neighborhoods like Kolar, Misrod, and Ayodhya Bypass have changed from agricultural villages to mixed-use residential and commercial suburbs. Similarly, Gurugram near Delhi shows how rural landscapes can develop into modern urban centers in a short time.
Globally, this trend is evident in London’s greenbelt villages, Jakarta’s metropolitan fringe, and Shanghai’s suburban corridors, which all blur the boundaries between rural and urban areas.
5.4 Implications
The continuum approach has significant implications for planning:
It requires integrated rural and urban policies.
Governance must address transitional areas where administrative boundaries are ambiguous.
Infrastructure planning must ensure continuity across the urban-rural gradient.
This perspective focuses on regional systems of settlements, emphasizing connection and mutual dependence rather than isolated urban centers.
6. Relationship Between Urban Centers and the Continuum
Urban centers act as growth poles that drive development in surrounding areas. Through transportation, trade, and information networks, they extend their reach into rural regions, forming a continuous zone of interaction. Meanwhile, rural areas provide labor, raw materials, and land for urban expansion, sustaining city economies.
This mutual dependence creates city regions or metropolitan areas, where various settlements—rural, semi-urban, and urban—operate as an integrated system. For instance, the Delhi Metropolitan Region includes parts of Haryana and Uttar Pradesh, demonstrating how rural areas are drawn into urban spheres of influence.
7. Policy and Planning Implications
In India, understanding the rural-urban continuum is essential for effective regional and urban planning. Government initiatives increasingly recognize this relationship:
Smart Cities Mission (2015): Aims to develop sustainable urban infrastructure while encouraging regional integration.
Shyama Prasad Mukherji Rurban Mission (2016): Focuses on bridging the rural-urban gap by providing urban-level facilities in rural clusters.
AMRUT (Atal Mission for Rejuvenation and Urban Transformation): Aims for infrastructure continuity in medium-sized towns.
Planners must embrace integrated regional planning to ensure balanced growth across rural and urban areas.
This includes:
Creating infrastructure corridors connecting villages and towns.
Managing land use changes sustainably.
Strengthening local governance in peri-urban regions.
Encouraging economic diversity to avoid overreliance on cities.
Such strategies align with the URDPFI Guidelines (2014) in India, which stress a regional approach and functional integration in urban development.
8. Challenges and Future Perspectives
Despite acknowledging the continuum, several challenges remain:
Unplanned Urban Sprawl: Rapid growth without proper infrastructure planning results in congestion and environmental damage.
Service Disparities: Transitional areas often lie outside municipal boundaries, lacking sanitation, waste management, and adequate governance.
Land Conflicts:Converting agricultural land for urban use generates socio-economic tensions.
Future planning must prioritize sustainable urban-rural integration, using technology such as GIS mapping, satellite imagery, and spatial analytics to oversee and manage growth. The concept of Smart Regions—combining rural productivity with urban services—represents the next step in spatial planning.
8. Conclusion
The study of human settlements has shifted from treating villages and cities as separate entities to recognizing the continuous, interconnected spectrum between them. Urban centers serve as growth hubs, but their health relies on resources and labor from surrounding rural areas. The traditional rural-urban dichotomy fails to capture this complexity, while the rural-urban continuum offers a more realistic and dynamic framework.
Understanding this continuum is vital for planners, policymakers, and geographers. It fosters balanced regional development, prevents uncontrolled sprawl, and promotes equitable access to infrastructure and opportunities. Ultimately, the future of human settlement lies not in separating rural and urban spaces but in encouraging their coexistence.
Ministry of Rural Development (MoRD). (2016). Shyama Prasad Mukherji Rurban Mission (SPMRM) Framework for Implementation. Government of India. (https://rurban.gov.in/)
This essay explores the Census definition of urban places in India—towns, cities, town groups, urban agglomerations, standard urban areas, metropolises, megalopolises, etc.—highlighting their classifications as per the Census and URDPFI Guidelines. The discussion includes an examination of the functional classification of urban places, their evolution, planning implications, and the need for nuanced classifications considering India’s rapid urbanization. The conclusion offers insight into the role of functional classification in urban and regional planning, supported by extensive references.
1. INTRODUCTION
India stands at a critical juncture in its urban transformation, with 377 million people constituting 31.16% of the total population living in urban areas according to the Census of India 2011. This demographic shift stands for not merely a statistical transition but a fundamental restructuring of the nation’s socio-economic landscape. The process of urbanization in India, however, presents unique complexities that distinguish it from global urban patterns, causing sophisticated definitional frameworks and classification systems to capture its multifaceted nature.
The significance of accurately defining and classifying urban areas extends beyond academic discourse into the realm of practical governance and policy implementation. Urban definitions decide resource allocation, infrastructure planning, administrative jurisdiction, and the provision of essential services to millions of citizens. The dramatic increase in the number of towns from 5,161 in 2001 to 7,935 in 2011 underscores the dynamic nature of India’s urban landscape and highlights the challenges inherent in keeping relevant and responsive classification systems. Particularly noteworthy is the proliferation of census towns, which grew from 1,362 in 2001 to 3,894 in 2011, standing for a new form of urbanization that challenges traditional administrative boundaries and governance structures.
The Census of India, conducted by the Office of the Registrar General and Census Commissioner, employs specific criteria to delineate urban areas, distinguishing between statutory towns and census towns while introducing the concept of urban agglomerations to capture continuous urban spreads. Complementing this statistical framework, the Urban and Regional Development Plans Formulation and Implementation (URDPFI) Guidelines 2015, developed by the Town and Country Planning Organisation under the Ministry of Housing and Urban Affairs, provide a comprehensive planning framework that integrates census definitions with spatial planning hierarchies.
This essay critically examines the census definitions of urban places in India and explores the hierarchical classification system spanning from basic towns to megalopolitan regions. The study analyses statutory provisions, census methodologies, and planning guidelines to understand how urban places are named, categorized, and functionally classified. Furthermore, it investigates the alignment between administrative classifications and functional realities of urban areas, drawing upon primary government sources including Census 2011 data and URDPFI Guidelines. Through this analysis, the essay looks to illuminate the complexities of urban definition in the Indian context and its implications for effective urban governance and sustainable development planning.
2. DISCUSSION
2.1 Census Definitions of Urban Areas in India
The Census of India employs a dual approach to find urban areas, recognizing both administrative recognition and demographic characteristics as valid criteria for urban classification. This framework encompasses three distinct categories: statutory towns, census towns, and outgrowths, each serving specific purposes in capturing the diverse manifestations of urbanization across the country.
Statutory towns represent places formally recognized under law by state or union territory governments, possessing local governance bodies such as municipal corporations, municipalities, cantonment boards, or notified town area committees. According to the 2011 Census, India had 4,041 statutory towns, reflecting an increase from 3,799 in 2001. These towns derive their urban status from legal notification rather than demographic characteristics, and their boundaries are administratively determined. The statutory recognition ensures the establishment of formal governance structures responsible for urban service delivery, infrastructure development, and local administration under the framework of the 74th Constitutional Amendment Act, 1992.
In contrast, census towns represent a demographic approach to urban identification. Census towns are settlements not statutorily notified as urban but whose populations have attained urban characteristics. The Census of India applies three specific criteria for census town designation: a minimum population of 5,000 persons, at least 75 percent of the male working population engaged in non-agricultural pursuits, and a population density of at least 400 persons per square kilometer. The number of census towns witnessed remarkable growth from 1,362 in 2001 to 3,894 in 2011, reflecting rapid peri-urban transformation. This phenomenon highlights the emergence of functionally urban settlements that lack formal urban governance structures, creating significant challenges for service provision and infrastructure planning.
The third category, outgrowths, represents areas of high-density urban settlement spatially adjacent to statutory towns that are governed by rural authorities. Outgrowths are characterized as urban settlements contiguous to another urban area possessing urban characteristics but not qualified as independent towns. These areas form integral components of urban agglomerations, bridging the administrative divide between formally recognized urban areas and their peripheral extensions. The identification of outgrowths enables the Census to capture continuous urban spreads that transcend rigid administrative boundaries, providing a more realistic representation of functional urban regions.
2.2 Hierarchical Classification of Urban Places
The Census of India employs a comprehensive hierarchical classification system to categorize urban settlements based on population size, spatial characteristics, and functional complexity. This classification framework extends from individual towns to complex metropolitan formations, providing a structured understanding of India’s diverse urban landscape.
At the foundational level, towns are classified into six distinct categories based on population thresholds. Class I cities comprise populations of 100,000 and above, while classifications descend progressively through Class VI towns with populations less than 5,000. This six-tier classification system enables differentiated planning approaches and resource allocation strategies tailored to settlement size and administrative capacity. Class I cities, comprising the largest urban centres, account for a substantial proportion of India’s urban population and economic activity, while smaller Class IV, V, and VI towns serve as critical links between rural hinterlands and larger urban centres.
Urban agglomerations represent a significant conceptual advancement in capturing functional urban regions that transcend administrative boundaries. An urban agglomeration constitutes a continuous urban spread encompassing a town and its adjoining urban outgrowths, or two or more physically contiguous towns together with any adjoining urban outgrowths. The 2011 Census identified 475 urban agglomerations across India, reflecting the spatial coalescence of multiple urban units into integrated functional regions. This classification acknowledges the reality of urban sprawl and the functional integration of adjacent settlements despite administrative fragmentation.
Metropolitan areas constitute the next hierarchical tier, defined as urban agglomerations with populations exceeding one million. The 2011 Census recorded 53 million-plus urban agglomerations or cities, collectively hosting approximately 42.3 percent of India’s total urban population. These metropolitan regions serve as primary engines of economic growth, innovation hubs, and centres of demographic concentration, necessitating specialized governance mechanisms through Metropolitan Development Authorities.
At the apex of the urban hierarchy stand megacities and emerging megalopolitan formations. Megacities are defined as urban agglomerations exceeding 10 million inhabitants, with Greater Mumbai (18.4 million), Delhi (16.3 million), and Kolkata constituting India’s three megacities as per the 2011 Census. Beyond individual megacities, the concept of megalopolis encompasses networks of interconnected metropolitan regions forming polycentric urban corridors. Emerging megalopolitan formations in India include the Delhi-Chandigarh industrial corridor, the Mumbai-Pune economic region, and the Chennai-Bangalore technology belt, representing functionally integrated multi-metropolitan systems that transcend traditional urban boundaries and administrative jurisdictions.
2.3 URDPFI Guidelines Framework
The Urban and Regional Development Plans Formulation and Implementation (URDPFI) Guidelines, released in 2014 and formally launched in 2015, represent a comprehensive policy framework developed by the Town and Country Planning Organisation (TCPO) under the Ministry of Housing and Urban Affairs. These guidelines supersede the Urban Development Plans Formulation and Implementation (UDPFI) Guidelines of 1996, responding to significant developments in urban planning necessitated by rapid population growth, economic globalization, and advances in information and communication technologies. The URDPFI Guidelines are intended to be comprehensive instruments for promoting balanced and orderly regional and urban planning and development, providing frameworks, techniques, norms, standards, and options for resource mobilization.
A fundamental principle embedded in the URDPFI Guidelines is the establishment of a hierarchical planning structure that integrates multiple spatial scales. The guidelines propose different plan categories including regional plans at inter-state, inter-district, and district levels, and development plans covering planning areas including municipal jurisdictions. This multi-tiered approach enables coordinated planning across various governmental levels, ensuring coherence between regional development strategies and local implementation mechanisms. The framework recognizes the necessity of integrating census definitions with spatial planning processes, facilitating the translation of statistical classifications into actionable development plans.
The URDPFI Guidelines explicitly acknowledge the constitutional framework established by the 74th Constitutional Amendment Act of 1992, which mandated decentralized urban governance through municipalities. The guidelines emphasize the roles of Metropolitan Planning Committees and District Planning Committees in coordinating spatial planning across administrative jurisdictions. Furthermore, the framework introduces comprehensive standards for urban development, including infrastructure provision, land use zoning, environmental protection, and sustainable development principles. Notably, the URDPFI Guidelines recommend 10 to 12 square meters of open space per person in urban areas, reflecting an enhanced focus on liveability and environmental quality. The guidelines thus serve as the primary policy instrument linking census-based urban classifications with practical spatial planning and development implementation across India’s diverse urban settlements.
2.4 Functional Classification of Urban Places
Beyond administrative and demographic classifications, urban places in India can be categorized according to their dominant economic and social functions. Functional classification categorizes cities based on their dominant roles, such as administrative, industrial, or cultural functions, facilitating urban planning and resource allocation. This approach recognizes that urban centres develop specialized roles within regional and national economic systems, though most large cities exhibit multi-functional characteristics.
Administrative towns serve primarily as seats of governance, including state capitals like Chandigarh and Gandhinagar, district headquarters, and municipal administrative centres. These towns concentrate government offices, public institutions, and related service infrastructure. Industrial towns, exemplified by Jamshedpur, Bhilai, and Bokaro, emerged around major manufacturing establishments, particularly in steel, heavy engineering, and textile sectors. Their spatial organization and demographic composition reflect industrial dominance in local economies.
Transport and communication hubs constitute another functional category, with port cities such as Mumbai, Chennai, and Visakhapatnam serving as critical nodes in national and international trade networks. Railway junction towns like Kharagpur and Itarsi developed specifically around transportation infrastructure. Educational and cultural centres, including university towns like Aligarh, Varanasi, and Shantiniketan, derive their primary identity from academic and cultural institutions. Religious and pilgrimage centres such as Haridwar, Puri, and Tirupati attract millions of visitors annually, with urban economies structured around religious tourism.
Mining towns like Dhanbad, Raniganj, and Kolar developed around mineral extraction activities, while resort and recreational towns like Shimla, Darjeeling, and Ooty serve primarily tourist functions. However, defining the functional role of any town remains challenging because most towns perform multiple functions simultaneously, particularly in metropolitan areas where economic diversification creates complex functional profiles transcending simple categorical classifications.
3. CONCLUSION
The examination of census definitions and functional classifications of urban places in India reveals a sophisticated yet complex framework for understanding and managing the nation’s urban transformation. The Census of India’s dual approach, distinguishing between statutory towns and census towns while incorporating urban agglomerations, provides comprehensive coverage of diverse urbanization patterns. The hierarchical classification system, extending from basic towns through Class I cities to metropolitan areas, megacities, and emerging megalopolitan formations, offers structured mechanisms for differentiated policy responses and resource allocation strategies.
The remarkable growth of census towns from 1,362 to 3,894 between 2001 and 2011 underscores the phenomenon of urbanization beyond administrative recognition, presenting significant governance challenges. These settlements possess urban demographic characteristics yet lack formal municipal structures, creating gaps in service delivery and infrastructure provision. The URDPFI Guidelines 2015 are crucial policy instruments that bridge census classifications with spatial planning frameworks, integrating the 74th Constitutional Amendment’s decentralization provisions with contemporary urban development needs.
Functional classifications complement administrative hierarchies by recognizing the economic and social specializations of urban centres, though metropolitan complexity increasingly defies singular categorization. Moving forward, India’s urban framework must address the governance deficit in census towns, accommodate peri-urban transformation, and develop dynamic classification systems responsive to rapid urbanization. The integration of census definitions, hierarchical classifications, and functional understandings stays essential for effective urban governance, sustainable development planning, and fair resource distribution across India’s expanding and diversifying urban landscape. Future census exercises must refine methodologies to capture emerging urban forms while keeping definitional consistency for longitudinal analysis.
REFERENCES (10 References)
Office of the Registrar General & Census Commissioner, India. (2011). Census of India 2011: Provisional population totals – Urban agglomerations and cities. Ministry of Home Affairs, Government of India. Retrieved from https://censusindia.gov.in
Office of the Registrar General & Census Commissioner, India. (2011). Census of India 2011: Primary census abstract for towns and urban agglomerations. Ministry of Home Affairs, Government of India. Retrieved from https://censusindia.gov.in
Town and Country Planning Organisation. (2015). Urban and Regional Development Plans Formulation and Implementation (URDPFI) Guidelines. Ministry of Housing and Urban Affairs, Government of India. Retrieved from https://mohua.gov.in
Office of the Registrar General & Census Commissioner, India. (2001). Census of India 2001: Provisional population totals – Rural-urban distribution. Ministry of Home Affairs, Government of India.
Ministry of Housing and Urban Affairs. (1996). Urban Development Plans Formulation and Implementation (UDPFI) Guidelines. Government of India.
Pradhan, K. C. (2013). Unacknowledged urbanisation: The new census towns of India. Economic and Political Weekly, 48(36), 43-51.
Denis, E., Mukhopadhyay, P., & Zérah, M. H. (2012). Subaltern urbanisation in India. Economic and Political Weekly, 47(30), 52-62.
Kundu, A. (2011). Trends and processes of urbanisation in India. Urbanisation and Emerging Population Issues Working Paper 6. International Institute for Environment and Development (IIED) and United Nations Population Fund (UNFPA).
Bhagat, R. B. (2011). Emerging pattern of urbanisation in India. Economic and Political Weekly, 46(34), 10-12.
Government of India. (1992). The Constitution (Seventy-Fourth Amendment) Act, 1992. Ministry of Law and Justice. Retrieved from https://legislative.gov.in
Migration is a transformative force that reshapes societies, economies, and geographies. In India, internal migration—particularly from rural to urban areas—is driven by a complex interplay of push and pull factors. Push factors such as agrarian distress, unemployment, poverty, environmental degradation, and lack of basic services compel individuals to leave their native villages. Simultaneously, urban centers exert a magnetic pull through promises of better employment, education, healthcare, infrastructure, and social mobility. This essay explores the multifaceted nature of migration, analyzing its patterns, typologies, and temporal dimensions. It delves into the socio-economic and environmental drivers behind migration and examines its profound impacts on both urban and rural development. Urban areas benefit from labor influx and cultural diversity but face challenges like overcrowding, informal settlements, and strained infrastructure. Rural regions, while gaining remittances and returning skills, suffer from depopulation, gender imbalances, and economic stagnation. Through case studies and statistical insights, the essay emphasizes the need for balanced regional development, inclusive policy frameworks, and sustainable planning. Understanding migration not only reveals the aspirations and struggles of millions but also offers pathways to build resilient, equitable, and interconnected communities across India.
Introduction
Migration is the movement of people from one place to another, often from rural to urban areas in India. It is driven by a combination of push factors (forces that drive people away from rural areas) and pull factors (attractions of urban areas). It reflects deep socio-economic and environmental disparities. On the rural side, push factors act as forces of repulsion, compelling individuals and families to leave their native villages. Agricultural distress is a major contributor, with small landholdings, low productivity, and heavy dependence on unpredictable monsoons making farming unsustainable. The lack of non-agricultural employment opportunities leads to widespread unemployment and underemployment, leaving many without viable income sources. Poverty and indebtedness further exacerbate the situation, as families struggle to maintain basic livelihoods. Environmental stressors such as floods, droughts, soil erosion, and declining groundwater levels make rural life increasingly precarious. Social challenges, including caste-based discrimination and inadequate access to education and healthcare, limit upward mobility and quality of life. Additionally, conflict and displacement caused by insurgencies or land acquisition for infrastructure projects like dams and mining operations force many to migrate involuntarily.
In contrast, urban areas present a set of pull factors that attract migrants with the promise of a better future. Cities offer diverse employment opportunities in industries, construction, services, information technology, and transportation, often accompanied by higher wages and perceived improvements in living standards. Educational institutions such as colleges, universities, and coaching centers provide access to academic advancement. Urban healthcare facilities, markets, and communication networks offer modern services that are often unavailable in rural settings. The potential for social mobility, including escape from rigid caste and community structures, is another powerful motivator. Moreover, the availability of modern amenities—electricity, reliable transport, entertainment, and digital connectivity—makes urban life appear more desirable and progressive. Together, these factors create a powerful incentive for rural populations to migrate in search of opportunity, security, and a better quality of life.
According to the Census of India 2011 and various NSSO surveys, migration continues to be a significant demographic phenomenon in India, involving nearly 37% of the total population — approximately 450 million people. Migration in the country largely occurs within rural areas, with rural-to-rural movements accounting for about 55% of all migration. This is followed by rural-to-urban migration (around 22%), reflecting the steady pull of cities as centers of economic opportunity, while urban-to-urban and urban-to-rural movements make up smaller proportions. The pattern of migration also shows a clear gender divide. Women migrate predominantly for social reasons, particularly marriage, which constitutes nearly 70% of female migration. In contrast, men are more likely to migrate for economic purposes such as employment, business, or seeking better livelihood opportunities.
At the state level, certain regions act as major sources and destinations of migration. States like Bihar, Uttar Pradesh, Jharkhand, Odisha, and Rajasthan experience high rates of out-migration due to limited local employment opportunities and agrarian distress. On the other hand, economically advanced states and urban centers such as Delhi, Maharashtra (notably Mumbai and Pune), Gujarat (particularly Surat and Ahmedabad), and Karnataka (Bengaluru) attract large numbers of migrants seeking jobs and improved living conditions. In recent years, there has also been an emerging trend of inter-state and international migration among skilled professionals, especially in sectors like information technology, healthcare, and education. This shift reflects the growing mobility of India’s educated workforce and the increasing role of migration in shaping both the country’s urbanization patterns and its labor market dynamics.
Migration has far-reaching impacts on both urban and rural regions in India, influencing economic growth, social structures, and patterns of development. In urban areas, migration contributes significantly to economic expansion by providing a steady supply of affordable labor essential for industries, construction, transportation, and domestic services. Migrants play a vital role in driving urban productivity and fostering cultural diversity, as they bring with them new traditions, cuisines, and ideas that enrich the social fabric of cities. However, this rapid inflow of people also creates serious challenges. Overcrowding in major cities leads to housing shortages and the proliferation of slums and informal settlements, such as Dharavi in Mumbai. The growing population puts immense pressure on urban infrastructure, including water supply, sanitation, transportation, and healthcare facilities. Additionally, limited job opportunities result in high levels of informal employment, while competition for resources can sometimes lead to social tensions or conflicts between migrants and local residents.
At the same time, migration profoundly affects rural areas, which are often the source regions. The outflow of migrants generates significant economic benefits through remittances, which improve household income, housing quality, healthcare access, and educational opportunities. These remittances often stimulate local economies and help reduce poverty. Moreover, return migrants contribute to rural development by bringing back valuable skills, ideas, and technologies acquired in cities or abroad. Migration also helps ease demographic pressure on limited agricultural land. Nevertheless, there are also several negative consequences. The departure of young and skilled workers can lead to a “brain drain,” leaving behind an aging population and creating a gender imbalance, as male out-migration results in the feminization of agriculture, with women taking on more agricultural and household responsibilities. Over time, this can weaken traditional social ties and cultural practices, leading to a decline in community cohesion. Furthermore, an overdependence on remittances can make rural households economically vulnerable if migrants face job losses or crises in destination areas.
Overall, migration serves as both a driver and a challenge to India’s development. While it stimulates economic growth, promotes cultural exchange, and supports rural livelihoods, it also highlights the urgent need for balanced regional development, better urban planning, and policies that ensure both source and destination regions benefit equitably from the movement of people.
Migration, urbanization, and development in India are closely interconnected, forming a dynamic and interdependent nexus that shapes the country’s social and economic transformation. Migration is one of the primary forces driving urbanization, as millions of people move from rural to urban areas in search of better employment opportunities, education, healthcare, and improved living standards. This continuous flow of people fuels the expansion of cities, stimulates economic activity, and contributes to the diversification of urban economies. At the same time, migration reinforces the rural–urban continuum, highlighting the deep interdependence between villages and cities. Rural areas rely on urban centers for access to markets, employment opportunities, modern services, and remittances sent by migrants that sustain rural livelihoods. Conversely, cities depend on rural regions for essential resources such as food, labor, raw materials, and the cultural diversity that migrants bring with them.
However, this relationship also presents significant challenges. The uneven pace of development between rural and urban areas often leads to distress migration, where people are compelled to leave their villages due to poverty, unemployment, and lack of basic amenities. This type of migration can strain urban infrastructure and contribute to the growth of informal settlements, while leaving rural areas depopulated and economically weaker. To address these issues, India needs balanced regional development policies that create livelihood opportunities and improve infrastructure in rural regions while ensuring sustainable urban growth. Strengthening small and medium towns, improving rural industries, and enhancing connectivity between villages and cities can help reduce migration pressures and promote more equitable development. Ultimately, managing this migration–urbanization–development nexus effectively is key to achieving inclusive, sustainable, and regionally balanced growth in India.
Discussion
Push and Pull Factors Shaping Internal Migration Patterns in India : Internal migration—the movement of people within national borders—represents one of the most significant demographic processes shaping India’s social and economic landscape. Push and pull factors create complex migration patterns that transform both rural and urban areas. These factors don’t operate in isolation but form an interconnected web of influences that motivate millions of Indians to relocate annually in search of better opportunities or to escape challenging conditions. By examining these dynamics, we gain crucial insights into how population movements reflect and respond to broader socioeconomic inequalities across regions.
Push factors are negative circumstances that compel people to leave their places of origin. In India’s rural contexts, several significant push factors contribute to the steady flow of migration toward urban centers. Economic distress and the lack of sustainable livelihood opportunities remain among the most significant push factors driving migration from rural India. Agriculture, which continues to employ a large share of the rural population, is no longer able to provide a stable and sufficient source of income for many households. One major issue is agricultural underemployment — the seasonal nature of farming means that many rural workers have jobs only during specific periods of the year, leaving them underutilized or jobless for months. Additionally, land fragmentation caused by generations of property division has resulted in increasingly smaller plots of land that are often economically unviable to cultivate. This limits productivity and reduces the potential for agricultural profitability. Moreover, income instability has become a persistent problem, as farmers remain highly dependent on uncertain factors such as rainfall, fluctuating crop prices, and rising input costs for seeds, fertilizers, and irrigation. These vulnerabilities make rural livelihoods precarious and push many to seek alternative means of survival in urban areas.
The story of Rajesh, a small farmer from Bihar who owned just one acre of land, reflects the lived reality of countless rural households. After suffering consecutive poor harvests and struggling to feed his family of five, Rajesh made the difficult decision to migrate to Delhi in search of work. His journey underscores a harsh truth—migration in such contexts is not a matter of choice or ambition but a compulsion born out of necessity. For many like Rajesh, leaving their villages behind becomes the only viable way to cope with persistent rural distress and pursue a more secure livelihood, even if it means facing uncertainty and hardship in the city.
In addition to economic hardship, inadequate infrastructure and poor access to essential services serve as major push factors driving migration from rural to urban areas in India. Many rural regions continue to suffer from significant gaps in healthcare, education, and basic amenities, creating an environment where sustaining a decent quality of life becomes increasingly difficult. Healthcare disparities are particularly stark — rural residents often face limited access to hospitals, doctors, and medicines, forcing them to travel long distances to urban centers for even basic treatment. This lack of timely medical care not only endangers lives but also places additional financial and emotional strain on families. Similarly, educational deficiencies are widespread, as many villages lack quality schools, trained teachers, and higher education institutions. Parents aspiring for better futures for their children often see migration as the only option to access better educational opportunities in towns and cities.
The gap in basic amenities further exacerbates the situation. Irregular electricity supply, inadequate drinking water systems, poor sanitation, and unreliable transportation infrastructure collectively diminish the standard of living in rural areas. These deficits make urban life, despite its challenges, appear more attractive and promising. The disparity is particularly evident in regions such as eastern Uttar Pradesh, where access to healthcare facilities is reported to be up to five times lower than in the state’s urban centers. For families in such areas, migration is not merely a pursuit of prosperity but often a response to pressing needs for survival, health, and dignity. This stark contrast between rural deprivation and urban opportunity continues to be a powerful force shaping India’s migration patterns and urban growth.
Environmental factors and natural disasters have become increasingly important drivers of internal migration in India, intertwining with economic and social challenges to shape movement patterns across the country. Climate change is a major catalyst, as shifting rainfall patterns, rising temperatures, and frequent extreme weather events disrupt traditional agricultural practices and make farming increasingly unpredictable. These environmental changes directly threaten the livelihoods of millions who depend on agriculture, livestock, and natural resources for survival. Natural disasters such as floods, droughts, and cyclones can devastate entire communities in a matter of days, destroying homes, crops, and infrastructure, and forcing people to relocate—sometimes permanently. Additionally, resource depletion, including declining groundwater levels, soil degradation, and deforestation, has further eroded the sustainability of rural economies, leaving communities with fewer means to sustain themselves locally.
The consequences of these pressures are clearly visible in various parts of India. In the coastal regions of Odisha and West Bengal, recurring cyclones such as Fani and Amphan have created a steady flow of environmental migrants moving inland in search of safety and stability. Similarly, in Maharashtra’s drought-prone districts, prolonged water scarcity and failed monsoons have compelled thousands of families to abandon their ancestral homes and migrate to more water-secure urban and semi-urban areas. These patterns underscore how environmental degradation and natural disasters not only displace populations but also accelerate broader social and economic transformations, intensifying rural–urban migration trends across India.
At the same time, the pull factors associated with migration play a critical role in shaping these movements. Urban centers offer a promise of greater livelihood opportunities, better wages, improved access to healthcare and education, and more reliable infrastructure. For many rural families facing environmental uncertainty, cities symbolize stability and the hope of rebuilding their lives. Thus, while environmental stress acts as a push factor, the perceived economic and social advantages of urban areas serve as powerful pull factors, collectively driving the ongoing migration flows within India.
While push factors drive people away from rural areas, pull factors actively attract them to specific destinations, particularly urban centers. These positive forces create magnetic appeal for potential migrants.
The pursuit of better economic opportunities and employment prospects remains the most powerful pull factor driving migration from rural to urban areas in India. Cities are widely perceived as spaces of economic advancement, offering individuals and families the possibility of improving their living standards and achieving upward mobility. One of the main attractions is the higher wage potential — urban jobs often pay two to three times more than comparable work in rural areas, providing a significant financial incentive for migration. Moreover, urban economies are characterized by job diversity, offering a broad range of employment opportunities across both formal and informal sectors. From industrial and construction work to services, retail, and domestic labor, cities can accommodate workers with varying levels of education and skill. In contrast to the uncertainties of agricultural livelihoods, non-agricultural employment in urban areas often provides more stable and predictable income, which helps families plan for the future and invest in health, housing, and education.
This trend is particularly visible in India’s rapidly expanding metropolitan regions. The construction boom in cities such as Bengaluru, Mumbai, and Gurgaon has generated massive demand for labor, attracting thousands of migrants each year. Similarly, the manufacturing hubs of Gujarat and Tamil Nadu draw workers from economically weaker states like Bihar, Uttar Pradesh, and Odisha, where limited job options and agricultural distress push people to seek work elsewhere. Even within the informal sector — including street vending, domestic work, and small-scale services — urban employment often ensures a more consistent source of income than rain-dependent farming in drought-prone rural regions. Thus, the economic pull of cities continues to act as a powerful magnet, shaping migration flows and reinforcing India’s ongoing urbanization and socio-economic transformation.
Another significant pull factor driving migration toward urban areas in India is the superior availability of infrastructure and public services that greatly enhance the quality of life. Cities generally provide far better access to essential services compared to rural regions, making them attractive destinations for individuals and families seeking improved living conditions. Healthcare access is one of the most notable advantages — urban centers are home to a higher concentration of hospitals, clinics, and medical specialists, ensuring timely and advanced healthcare that rural populations often lack. This is particularly crucial for families dealing with chronic or serious health conditions, who may choose to migrate specifically to access specialized treatment.
Urban areas also offer educational opportunities that are far superior to those available in most rural districts. Quality schools, colleges, technical institutes, and universities are concentrated in metropolitan regions, attracting ambitious students from smaller towns and villages who aspire to pursue higher education and professional careers. Furthermore, transportation networks in cities — including buses, metros, and railways — make mobility easier and more affordable, enabling people to access employment, education, and healthcare efficiently. In addition, urban centers provide better utilities and housing infrastructure, with more reliable electricity, piped water supply, and diverse housing options ranging from affordable rentals to formal housing societies.
For many rural households, the contrast between inadequate rural infrastructure and the relative convenience of urban living serves as a decisive factor in migration. Cities symbolize progress, connectivity, and opportunity — not only as centers of employment but also as spaces offering access to the basic services and facilities necessary for a dignified and modern life. This superior urban infrastructure continues to attract migrants from across the country, reinforcing the steady growth and expansion of India’s cities.
Beyond economic and infrastructural advantages, social and cultural attractions play a significant role in drawing people toward cities in India. Urban areas often represent spaces of freedom, diversity, and opportunity — qualities that strongly appeal to individuals, especially the youth, from conservative or traditional rural settings. One of the most compelling aspects of city life is the greater personal freedom it offers. Unlike rural communities, where social norms and expectations can be rigid and community surveillance intense, cities tend to have more liberal and individualistic environments. This relative anonymity allows people to express themselves more freely, pursue varied lifestyles, and make independent choices regarding education, career, and relationships.
Cities also provide access to rich cultural and recreational opportunities that enhance quality of life. The presence of theatres, art galleries, music festivals, sports venues, restaurants, and diverse entertainment options creates a vibrant social atmosphere unavailable in most rural areas. Moreover, expanded social networks in cities allow people to connect with individuals from different regions, languages, and backgrounds, fostering broader perspectives and sometimes enhancing social mobility and professional opportunities. This exposure to diversity often becomes an enriching experience, encouraging personal growth and cultural exchange.
For many young adults from conservative rural communities, the cultural vibrancy and openness of cities like Mumbai, Delhi, and Kolkata hold immense appeal. These urban centers symbolize modernity, creativity, and change — offering an escape from the monotony or restrictions of rural life. As a result, migration is not only an economic or survival strategy but also a quest for identity, freedom, and a more fulfilling social existence in an increasingly urbanized India.
Internal migration in India defies simple categorization, manifesting in various forms that reflect the complexity of migrants’ circumstances and motivations.
Migration in India can be categorized into different typologies based on the motivations driving individuals to move, highlighting the diversity of migration experiences and the underlying socio-economic factors. Survival migration occurs when people are compelled to relocate due to immediate threats to life or livelihood, such as natural disasters, floods, droughts, or acute economic distress. In these cases, migration is often urgent and unplanned, leaving individuals and families with few resources or alternatives. Subsistence migration, on the other hand, takes place when origin locations can no longer provide the minimum requirements necessary to maintain basic living standards, such as food, shelter, or employment, forcing households to seek sustenance elsewhere.
Sponsored migration refers to movements facilitated by existing networks of earlier migrants, who provide crucial support such as information about opportunities, temporary accommodation, and employment connections. These networks reduce the risks associated with migration and make the transition to a new location smoother. Finally, voluntary migration is driven primarily by choice rather than necessity, as individuals or families move to pursue better educational, professional, or lifestyle opportunities. The contrast between these typologies is evident in real-life examples: a farmer from drought-affected Marathwada represents survival migration, compelled to leave his village to secure basic survival, whereas an educated professional relocating from a small town to Hyderabad’s thriving tech sector exemplifies voluntary migration, motivated by career advancement and improved living standards. While both are internal migrants, their experiences, available resources, challenges, and long-term trajectories differ dramatically, illustrating the complex and multifaceted nature of migration in India.
The temporal dimensions of migration add another layer of complexity to understanding population movements in India, as the duration and pattern of relocation vary widely across different groups. Seasonal migration is a temporary movement closely tied to agricultural or industrial cycles, where individuals travel for work during specific periods and return to their place of origin afterward. This type of migration is particularly prevalent in sectors such as construction and agriculture, with an estimated 100 million seasonal migrants moving across India each year. For instance, construction workers from Odisha often travel to Kerala during the dry season to take advantage of employment opportunities, returning home during the monsoon months to engage in farming or attend to family responsibilities.
Circular migration involves repeated movement between source and destination areas, often over several years, without the intention of permanent relocation. Migrants in this category maintain strong ties with their place of origin while continuously participating in labor markets elsewhere. In contrast, permanent migration entails a one-way relocation with the explicit goal of establishing a new residence, often accompanied by long-term social, economic, and cultural integration into the destination region. Another pattern, step migration, describes gradual movement through a series of locations, typically progressing from smaller towns or villages to larger urban centers, often in search of better opportunities and improved living conditions. These temporal patterns illustrate that migration in India is not a uniform process but rather a dynamic spectrum of movements shaped by economic cycles, social networks, and individual aspirations, each with distinct implications for both origin and destination regions.
The temporal dimensions of migration introduce an important perspective on population movement in India, highlighting how the duration and recurrence of relocation influence both migrants’ lives and the regions they connect. Seasonal migration represents a widespread and largely cyclical pattern, closely tied to agricultural or industrial work schedules. Individuals engage in temporary relocation during periods of peak labor demand, returning to their home villages once the season ends. This pattern is particularly common in construction, agriculture, and allied sectors, with estimates suggesting that nearly 100 million seasonal migrants move within India annually. A clear example is construction workers from Odisha who travel to Kerala during the dry season for employment and return home during the monsoon to participate in farming or manage family obligations. Such movements allow households to supplement income without permanently leaving their community, but they also reflect the vulnerability of workers to irregular employment and economic precarity.
Circular migration extends this concept by involving repeated movement over years, with migrants maintaining ongoing economic and social ties to their places of origin while continually seeking employment in destination areas. In contrast, permanent migration represents a one-way relocation, often motivated by long-term economic, educational, or social goals, requiring migrants to integrate into new communities, adapt to urban lifestyles, and establish stable livelihoods. Step migration illustrates a more gradual process, where individuals move through a hierarchy of settlements — from small villages to towns, and eventually to large cities — leveraging each step to access better opportunities and gradually improve their socio-economic position. Collectively, these temporal patterns underscore that migration in India is far from homogeneous; it is a dynamic and multi-layered phenomenon shaped by economic cycles, environmental pressures, social networks, and personal aspirations. Understanding these temporal dimensions is crucial for designing policies that address both the opportunities and vulnerabilities associated with migration, ensuring that the benefits are shared equitably between origin and destination regions.
Internal migration in India produces a complex balance of impacts that extend across economic, social, cultural, and infrastructural dimensions, affecting both the regions migrants leave and those they move to. At the origin, migration often alleviates labor pressure and provides households with financial lifelines through remittances, which are frequently invested in education, healthcare, housing, and small-scale businesses. These inflows can stimulate local economies and improve living standards for families remaining in rural areas. However, the departure of productive and skilled workers can also create challenges, such as reduced agricultural output, “brain drain,” and the feminization of rural labor, which may increase the burden on women and compromise long-term rural development.
In destination regions, migrants contribute significantly to economic growth by supplying labor across formal and informal sectors, fostering urban dynamism, and enriching cultural diversity. Their presence facilitates the exchange of ideas, traditions, and skills, strengthening social networks and promoting innovation. At the same time, rapid in-migration can strain urban infrastructure, housing, and public services, leading to overcrowding, the proliferation of informal settlements, and increased demand on healthcare, education, and transportation systems. Social tensions may also arise between migrant and local populations, challenging urban cohesion and governance.
Overall, internal migration generates both opportunities and vulnerabilities, creating a complex interplay of benefits and costs. While it supports economic growth, cultural exchange, and household resilience, it also exposes gaps in infrastructure, governance, and social protection. Understanding these multifaceted impacts is essential for policymakers to design strategies that maximize the positive contributions of migration while mitigating its adverse consequences, ensuring that both sending and receiving regions can thrive in a sustainable and inclusive manner.
The economic impacts of internal migration in India are wide-ranging and extend far beyond the individual migrants themselves, influencing both sending and receiving regions. One of the most significant contributions is remittances, with migrants estimated to send around ₹1.5 trillion annually to rural households, providing a crucial source of income that supports basic needs, education, healthcare, and housing improvements. These remittances often act as a catalyst for local economic development, enabling families to invest in human capital and improve their standard of living. Migration also affects labor markets by alleviating surpluses in rural areas, where underemployment and seasonal work are common, while simultaneously meeting the high demand for labor in urban centers, particularly in construction, manufacturing, services, and informal sectors. This redistribution of labor can enhance overall economic efficiency and productivity at a regional and national level.
However, migration also has potential downsides for rural economies. The outflow of productive workers, particularly young and skilled individuals, can reduce agricultural output, slow local development, and create gaps in essential services. Over time, this concentration of human capital in urban areas can exacerbate regional inequalities, as already-developed regions continue to attract resources and talent while rural areas lag behind. Despite these challenges, studies consistently show that households receiving remittances are more likely to invest in education, healthcare, and housing compared to non-migrant households, highlighting migration’s role as both a survival strategy and an economic development mechanism. In essence, migration functions as a double-edged economic force—simultaneously alleviating rural pressures, fueling urban growth, and shaping regional disparities.
Internal migration in India has profound social and cultural impacts, reshaping the dynamics of both sending and receiving communities. In many rural areas, migration is predominantly male-driven, leaving behind households headed by women. This shift often reshapes gender roles and responsibilities, with women taking on greater authority in decision-making, household management, and financial planning. For example, studies in Kerala have shown that women in families with migrant men increasingly manage family resources, make key household decisions, and oversee agricultural or small-scale economic activities, highlighting the empowerment potential embedded in migration.
Migration also facilitates cultural exchange, as individuals bring ideas, traditions, practices, and innovations from their home regions to urban centers, contributing to the social diversity and vibrancy of cities. Migrant communities often form cultural enclaves in destination areas, such as Mumbai or Delhi, preserving regional languages, festivals, cuisine, and social networks while simultaneously integrating into the broader urban fabric. However, rapid in-migration can create social cohesion challenges, particularly in cities where resources are scarce or competition for jobs and housing is intense. In some cases, this can lead to nativist sentiments or tensions between local residents and migrant populations. Overall, migration acts as both a driver of cultural enrichment and social transformation, reshaping family structures, expanding social networks, and contributing to the evolving mosaic of India’s urban and rural societies.
Large-scale internal migration in India places significant infrastructural and service provision pressures on destination areas, particularly rapidly growing cities. One of the most visible consequences is housing strain, as the influx of migrants often outpaces the development of formal residential infrastructure. This has led to the expansion of informal settlements and slums, where living conditions are overcrowded, unsafe, and lacking basic amenities. For instance, nearly half of Mumbai’s population resides in such informal settlements, reflecting the city’s inability to keep pace with the demand generated by in-migration.
In addition to housing, public services such as healthcare, education, and transportation are frequently overburdened. Urban hospitals and clinics struggle to provide timely care, schools face overcrowding, and public transit systems are stretched beyond capacity, reducing accessibility and efficiency for both migrants and long-term residents. Rapid population growth also complicates urban planning and sustainable development, as cities struggle to expand infrastructure, manage waste, and provide reliable water and electricity systems. Delhi’s water supply network, originally designed for a much smaller population, is now under significant stress due to millions of migrants settling in the National Capital Region over recent decades. These challenges highlight the urgent need for proactive urban planning, inclusive housing policies, and scalable service delivery mechanisms to ensure that cities can accommodate migration sustainably while maintaining quality of life for all residents.
Effective migration policy in India requires a balanced approach that recognizes migration as an inevitable aspect of economic and social development while striving to maximize its benefits and minimize associated costs. One key strategy involves origin-focused interventions that address the push factors compelling people to leave their home regions. Strengthening rural economies through agricultural modernization, rural industrialization, and the promotion of non-farm livelihoods can create sustainable employment opportunities locally, reducing the necessity for migration driven by economic distress. Similarly, service equalization—improving access to quality healthcare, education, and basic infrastructure in rural areas—can help narrow the gap between urban and rural living standards, making remaining in the village a viable option for families. Addressing environmental vulnerabilities is also critical; climate resilience initiatives such as water management, soil conservation, and disaster preparedness can mitigate environment-driven migration caused by floods, droughts, or resource depletion. Programs like the Mahatma Gandhi National Rural Employment Guarantee Act (MGNREGA) provide minimum employment guarantees in rural areas, directly reducing distress migration by offering a stable source of income. Complementary efforts to establish educational and healthcare hubs in rural regions further help prevent service-seeking migration, enabling households to access essential services without relocating to urban centers. Collectively, these origin-focused policies aim to create conditions where migration becomes a choice rather than a necessity, empowering communities while easing pressure on cities.
Given the inevitability of migration, destination-focused approaches are essential to ensure that urban areas can accommodate incoming populations sustainably while maximizing their contributions to local development. One key strategy is inclusive urban planning, which incorporates migration projections into infrastructure development, public services, and transportation systems to anticipate demand and prevent congestion. Housing policy is equally important, with cities needing to develop affordable and safe residential options to prevent the proliferation of informal settlements and slums. Integration programs further support migrants by facilitating access to social protection, education, healthcare, and other essential services, helping them establish stable lives and contribute effectively to the urban economy.
Some cities in India have already implemented innovative strategies in this regard. For example, Surat in Gujarat has embraced migrant-inclusive urban planning, recognizing that in-migration fuels local economic growth and contributes to the city’s dynamism. Similarly, several states are piloting mobile ration card systems, which allow migrants to access food subsidies and social welfare benefits regardless of their current location, addressing one of the major barriers to migrant welfare. By combining proactive planning, affordable housing initiatives, and targeted integration measures, destination-focused policies aim to transform migration from a source of urban strain into an opportunity for sustainable economic growth, social inclusion, and improved quality of life for both migrants and long-term residents.
A rights-based approach to migration is essential for improving outcomes for migrants and ensuring that their movement contributes positively to both origin and destination communities. Central to this approach is the protection of labor rights, guaranteeing that migrant workers receive equal treatment, fair wages, safe working conditions, and access to social security benefits. Equally important is the development of portable social protection systems, which allow benefits such as food subsidies, pensions, and healthcare entitlements to follow migrants across state and district boundaries, reducing the vulnerability associated with relocation. Initiatives like the One Nation, One Ration Card scheme represent significant progress in this area, enabling migrants to access subsidized food regardless of where they settle in India.
Beyond economic and social protections, political representation is a critical component of a rights-based framework. Mechanisms that allow migrants to participate in local governance and decision-making processes in both their origin and destination communities can strengthen inclusion, accountability, and social cohesion. Despite these advancements, significant gaps remain in ensuring migrants’ full access to healthcare, education, housing, and political participation, particularly for those in informal employment or unplanned settlements. Addressing these gaps requires coordinated policy action across multiple levels of government, reinforced by legal protections and institutional support. By embedding migration policies within a rights-based framework, India can not only safeguard the dignity and well-being of migrants but also harness their potential as active contributors to regional development and social progress.
Internal migration in India functions as both a response to structural inequalities and a powerful mechanism for social and economic transformation. The push factors—such as limited livelihood opportunities, inadequate infrastructure, environmental pressures, and social constraints—drive people away from rural areas, while urban centers attract migrants with better employment prospects, services, and cultural opportunities. These movements not only reflect existing disparities but also actively reshape them, concentrating human capital, labor, and consumption in cities while leaving rural areas with evolving demographic and social structures. Recognizing the complex interplay of causes and consequences is critical for designing policies that maximize the benefits of migration, such as economic growth, cultural exchange, and human capital development, while minimizing its challenges, including urban congestion, service strain, and social inequality.
Looking ahead, technology is likely to profoundly influence internal migration patterns. The expansion of remote work, digital education platforms, and e-governance can allow individuals to access urban-quality opportunities without physically relocating, potentially reducing distress-driven rural-to-urban migration. Improved rural connectivity—through broadband, transportation, and financial inclusion—may encourage hybrid or circular migration models, where migrants can maintain ties to their origin communities while participating in urban labor markets. Despite these innovations, the traditional rural-to-urban migration pathway is likely to remain dominant for many sectors that require physical presence, such as construction, manufacturing, and informal services. What may emerge, however, are more diversified migration patterns, including town-to-town, rural-to-rural, and stepwise migrations facilitated by technology, which allow households to optimize economic and social outcomes. Ultimately, technology offers the potential to make migration less a necessity and more a strategic choice, enabling individuals to pursue better livelihoods while contributing to balanced regional development and reducing pressure on overburdened urban centers.
Push and Pull Factors Shaping External Migration Patterns in India: Immigration has long been a defining force in shaping societies, economies, and cultures across the world. The phenomenon is driven by a complex interplay of push and pull factors that influence individuals and families to relocate from one region or country to another. Understanding these dynamics provides critical insight into how migration reshapes demographic structures, influences urban and rural development, and drives socio-economic transformation over time. Push factors refer to the unfavorable conditions in a person’s home country that compel them to leave. Among the most significant are war, conflict, famine, and food insecurity. Armed conflicts displace millions, forcing individuals to flee in search of safety, political stability, and basic human security. Similarly, famine and food shortages drive large-scale migrations as people escape regions where survival becomes difficult. Economic hardship also plays a central role—limited job opportunities, poverty, and unemployment push individuals to seek better prospects abroad. Political instability, persecution, and discrimination based on religion, ethnicity, or ideology further contribute to migration, as people leave their homelands to find freedom, security, and acceptance elsewhere. Environmental disasters such as droughts, floods, or earthquakes also serve as major push factors, especially when they disrupt livelihoods and make entire regions uninhabitable.
On the other hand, pull factors are the favorable conditions that attract migrants to new destinations. Economic opportunities stand as one of the most powerful motivators—higher wages, job security, and career growth encourage people to move to regions with stronger economies. Educational prospects also play a crucial role, particularly for families seeking better futures for their children. Access to quality institutions, advanced programs, and global exposure makes education a major draw for migration. Family reunification policies further encourage movement, as individuals seek to join relatives who have already settled abroad, creating established networks that ease integration. Moreover, the promise of a better quality of life—including access to healthcare, safety, social services, and personal freedom—motivates countless migrants to relocate. These pull factors collectively shape the demographic and cultural landscape of destination countries, influencing their economies and social dynamics.
Immigration has historically transformed urban areas, each era leaving its unique mark. In the early 1900s, massive waves of European immigrants arrived in major cities like New York and Chicago, contributing to industrial growth and the creation of vibrant cultural enclaves. The 1950s saw post-war economic expansion, offering abundant job opportunities that attracted immigrants and supported rapid urbanization. By the 1980s, growing immigration increased housing demand, straining urban infrastructure and affordability while enhancing cultural diversity. In the 2020s, ongoing immigration continues to reshape city demographics—introducing new ideas, cuisines, and traditions, but also creating challenges such as overcrowding and pressure on social services. Despite these issues, urban areas benefit significantly from immigration through economic growth, innovation, and a dynamic multicultural environment.
While cities are often the primary destinations for immigrants, rural areas also experience notable impacts. Immigration can revitalize declining rural communities by introducing new labor forces and boosting agricultural productivity. Migrants contribute to sustaining local economies, filling essential labor gaps, and preventing population decline in aging regions. Rural areas often offer more affordable living conditions, which can attract both immigrants and return migrants seeking stability and open space. However, challenges remain, including the integration of newcomers into small, close-knit communities and the provision of adequate services to support growing populations.
Throughout history, immigration has evolved in response to global economic and political shifts. During the 19th century, massive European immigration to the United States spurred urban expansion and industrial growth. The early 20th century witnessed the Great Migration, where millions of African Americans moved from rural Southern states to Northern industrial cities, reshaping urban demographics and cultural identity. In the post–World War II era, economic reconstruction efforts across Europe and North America attracted waves of immigrants seeking employment and stability, leading to both urban diversification and rural rejuvenation. In the 21st century, immigration has become more globalized, involving refugees fleeing conflict zones, skilled professionals seeking opportunities in advanced economies, and migrants revitalizing rural regions facing depopulation.
The dynamics of immigration reveal how deeply interconnected economic, political, and social factors shape the movement of people. Both push and pull forces continue to influence migration patterns, driving change in urban growth, rural revitalization, and global cultural exchange. Understanding these dynamics is essential for policymakers, planners, and communities alike to harness immigration’s transformative potential while addressing its challenges. Ultimately, migration is not just a story of movement—it is a story of resilience, adaptation, and human aspiration for a better life.
Conclusion
Migration in India is a deeply embedded socio-economic phenomenon that reflects both the aspirations and adversities of its people. It is not merely a movement from one place to another, but a response to structural inequalities, environmental vulnerabilities, and the pursuit of dignity and opportunity. The push factors—ranging from economic hardship and environmental stress to social exclusion—highlight the urgent need for rural revitalization and inclusive growth. Conversely, the pull of urban centers underscores the importance of equitable access to services, infrastructure, and employment.
The impacts of migration are far-reaching. Urban areas thrive on the labor and cultural contributions of migrants, yet grapple with challenges like housing shortages, informal employment, and social tensions. Rural regions benefit from remittances and returning knowledge, but face demographic decline, feminization of agriculture, and erosion of traditional social structures. These dualities demand a holistic policy approach that bridges the rural–urban divide.
To manage migration effectively, India must invest in sustainable urban planning, strengthen rural economies, and enhance connectivity between regions. Policies should support small and medium towns, promote rural entrepreneurship, and ensure that migrants have access to rights, services, and social protection. Migration should be recognized not as a problem to be solved, but as a dynamic process that, if guided wisely, can drive national development, foster innovation, and build inclusive societies.
Ultimately, the migration–urbanization–development nexus is central to India’s future. By addressing the root causes of migration and leveraging its potential, India can create a more balanced, resilient, and humane developmental trajectory—one that honors the journeys of its people and builds bridges between its villages and cities.
References
Here are 15 authoritative and relevant sources that support and expand upon the themes discussed in your essay on migration trends and their impact on urban and rural development in India:
Crude and age specific mortality rates are important factors for the study of epidiemology and also to understand the demographic characteristics of a particular area, city, district, state or country. It is a very important as well as useful in accounting various demographic characteristics and also to identify where it is lacking and the reason behind its lacking. Through this life expectancy, longevity, migration, standardization can be done which is useful in calculating various other forms of demography and will help in understanding a lot of factors. Crude mortality rate means the TOTAL NUMBER OF DEATHS IN PARTICULAR POPULATION (MOSTLY ACCOUNTABLE IN A POPULATION OF 1000 PEOPLE) while age specific mortality rate is defined as the TOTAL NUMBER OF DEATHS IN A PARTICULAR AGE GROUP TO THE TOTAL NUMBER OF PERSONS IN THAT AGE GROUP IN A POPULATION OF 1000 PEOPLE. Life table helps in the calculation of CRUDE DEATH RATES and is helpful in estimating the overall death rates and also the causes behind it. AGE SPECIFIC DEATH RATE is calculated between the beginning of age ‘x’ upto the beginning of age ‘x+1’.
Keywords: Crude death death, Age specific death rate, demography, population.
Introduction:
The public health department demands of including mortality rates which gives an overview of the well being of the population. These mortality rates identifies the state of well being of various sociodemographic groups around a particular region, state, city, district or even country. Like in case of India the census is responsible for conducting various surveys on various socio-demographic characteristics like birth rate and their types, age sex composition etc. in this the crude mortality rate and the age specific mortality is also accountable and is essential for explanation of various problems and also the criteria for ending up those problems. Actually mortality is dependent on various factors like age, gender, ethnicity and place of residence. Usually it is seen that the females live more than the males due to various hormonal activities and also the physical condition. Like the old aged people and children and infants are prone to more to mortality than the middle aged people. Like in 1971 the crude death rate is only 7 per 1000 population and urban estimates are lower than the rural estimates as it has more advanced infrastructure and hospitals and healthcare facilities.
Discussions:
There are various aspects to discuss about the Crude Mortality Rate and the Age Specific Mortality Rate like what are the meaning of those, what is the importance of these two, why one should study them, what is the reason behind studying them, etc. These questions can be answered as well as understood easily if case studies between the Developed, Developing and Under-developed countries will be provided. From each types two countries will be chosen and further discussions will be made according to that. In Developed Countries, USA and Italy will be taken into discussions and likewise in Developing countries, India and Brazil and in Under-developed countries, Afghanistan and Ethiopia will be taken into action to understand the two concepts, Crude Mortality and Age Specific Death Rate.
DEVELOPED COUNTRIES
USA:
Crude Mortality Rate is very much high in the USA. It is 923 deaths per 1,00,000 population. Major reasons behind the deaths are heart diseases(highest), cancer, accidents(unintentional injuries), stroke(cerebrovascular diseases), chronic lower respiratory diseases, Alzheimer’s disease, diabetes, Nephrone related diseases and chronic liver diseases and cirrhosis. Moreover, during the pandemic Covid-19 the number of deaths are very high(49,932 deaths). Why this happens and how is the infrastructure related to all these will be discussed.
Life expectancy in US in the year 2023 was 78.4 years an increase of 0.9 years from the previous year of 2022. Age adjusted death rate was reduced from 6.0% from 798.8 deaths per 1,00,000 population in 2022 to 750.5 in 2023. The Age Specific Death Rate decreases for all the age groups between 5yrs and also the elderly people. The death rate decreased from 3.9% for age group 5-14yrs, 3.4% for 15-24yrs, 9.4% for 25-34yrs, 7.1% for 35-44yrs, 9.2% for 45-54yrs, 9.3% for 55-64yrs, 8.5% for 65-74yrs, 7.7% for 75-84yrs and 0.7% for 85 and older. There was a distortion in this death rates during the outbreak of Covid-19 like the elderly and the children death rates are higher as their immunity is much more less than the mid aged persons and the youth. It is seen that the death of males from heart disease is more than the females. In Covid-19 also the ratio is same, while in the case of Alzheimer’s and dementia related diseases the female death rate is more than males. It happens because females have various responsibilities to manage like managing the household, taking care of the kids, dropping them to school, managing own work and office, taking care of the husband and the family.
ITALY:
Crude Death Rate in Italy is relatively lower than other countries. It is 11.20% in the year of 2023. This happens as it has better infrastructure, healthcare facilities, and also less societal norms. This country has also less amount of pollution as it used more number of NMT or Non Motorised Vehicles like cycles, EV vehicles or buses and also walking. They also used public mode of transport and as a result pollution is less and mortality rate is also less. But regarding all this the death rate which is there is due to the old aged problems, any accidents etc. The death rate is highest in this country during the outbreak of Covid-19, the death rate is one of the highest during that time as the number of old aged people are more and the pandemic is more effecting the old aged people than the other age groups.
The population growth rate is -0.2% which means population is declining and there can be various reasons behind it like high mortality rate or low birth rate with standard mortality rate or high birth rate and high mortality rate. The reasons behind it has to be identified. From the graph it is analysed that the male population is significantly decreasing in the year 2050, this can be done by population forecasting method. Again the life expectancy for female is 84.3yrs whereas the life expectancy for the male is 80yrs only which is again same as the life expectancy of USA. The deaths due to stroke is more in females than in males. The death from lung cancer is relatively higher in males from which an assumption can be made that males smoke more than the females. In 2021 the main cause of deaths of all age groups is Covid-19.
DEVELOPING COUNTRIES
INDIA:
In India the crude mortality rate is significantly decreasing in the past few decades which shows us that the infrastructure has been improved and also the societal characteristics and tantrums have been removed. This decreasing mortality rate increases during the time of Covid-19 and after recovering the outbreak it again decreases.
We all know that India is a diverse country with various states, languages, cultures, social belief. So the age specific mortality is different for different for different states. Like in the states of Bihar and Jharkhand the mortality rates for female and children is higher which shows that the infrastructure and the healthcare facilities are not upto the mark and as a result death happens. This also can be happened that various females can die during the time of giving birth as the facilities which are required for saving both the child and the mother is not there. Then comes the old age population whose death rate is higher after the female and child death rate.
BRAZIL:
In Brazil also the crude mortality rate is also decreasing in the past few decades which shows again that the infrastructure and other healthcare as well as other facilities also improved and also the societal pressure and tantrums are also decreased. There is a distortion of this trend during the outbreak of Covid-19 as the mortality rate increases during that time and after that the trend becomes equal that is it is decreasing.
The population growth rate is 0.4% which is acceptable and that means that the birth and the mortality rates are balanced and the role of infrastructure in balancing the population growth is immense. The maximum population lies between the age groups of 15-64yrs and the least population is between 0-14yrs. By 2050 it is seen from the graphical projection and the population forecasting that the youth population including both males and females decreases whereas the population of the old aged people like above 85+ increases, this indicates that the birth rate will go beyond the death rate and as a result the population will get decreased.
UNDER-DEVELOPED COUNTRIES
AFGHANISTAN:
In Afghanistan also the death rate decreases that is very common in all of the above countries which are discussed but one peculiar thing about this country is that the death rate remains decreasing even at the time of outbreak of Covid-19, this indicates that the number of affected person is much more less than the other countries like Italy, USA, India and Brazil and other countries also because the death rate all over the World increases but here it decreases it indicates that the infrastructure and also the center of power is much more powerful to fight against the outbreak of this pandemic.
The population growth rate is 2.2%, it is quite high with respect to the other countries because of the social tantrums as well as the infrastructure and also center of power. The growth rate is high because the infrastructure is poor and also they do not have the proper facilities which should be provided to a particular citizen. And the government there also do not take any measures regarding the control of birth rate like in various European Countries they have rules that a particular family will not have more than 2 children but such kind of rule is not there and we all know that Afghanistan is mainly a Muslim dominated country so there are also social cultures regarding controlling of the fertility rate.
ETHIOPIA:
In Ethiopia, like in Afghanistan also the death rate is also decreasing. The death rate is very high during the 1960s but it gradually starts decreases and also the same peculiar thing is happened here that the outbreak or the death rate due to Covid-19 is also less compared to the other European and American countries, this implies that the immunity system of this country is more higher than the other countries and as it is an under developed country so the infrastructure facilities is also not very advanced or so much up to date. So the immunity alone is responsible for saving the country from the spread of Covid-19.
The population growth is 2.6% and it is the highest among the above four discussed countries and this happens because the literacy rate is very much less and as a result they don’t have enough learning that the more number of children will create only trouble. They only understand that if there are more number of children then the number of earning members will be more and as a result they can live their life easily. The death rate is highest by lower respiratory diseases in males and this happens because of malnutrition and lack of healthcare facilities.
Conclusion:
Crude Death Rate (CDR) and Age-Specific Death Rate (ASDR) are both vital indicators used in demographic and public health studies to assess mortality patterns within a population. The CDR measures the total number of deaths per 1,000 individuals in a given year, providing a broad overview of mortality. However, it does not account for the age structure of the population, which can lead to misleading comparisons, especially between countries or regions with significantly different age distributions.Age-Specific Death Rate (ASDR), on the other hand, measures mortality rates within specific age groups. This allows for a more detailed and accurate understanding of mortality risks and patterns. ASDR is particularly useful in identifying vulnerable age groups, evaluating the impact of health interventions, and developing targeted public health policies.While the CDR is useful for general assessments and trend analysis over time, ASDR is essential for more nuanced evaluations and effective decision-making. Together, both indicators complement each other and provide a comprehensive picture of mortality in a population. Understanding and analyzing both rates is crucial for health planning, resource allocation, and improving population health outcomes across different age groups.
A settlement is a place where people live, work, and interact, ranging from small villages to large cities. The evolution of settlements reflects changes in society, economy, technology, and environment over time.
1️⃣ Evolution of Settlements
The evolution of settlements can be categorized historically and functionally:
a) Historical Phases
Prehistoric Settlements:
Small, temporary, or semi-permanent settlements.
Nomadic or tribal communities near water and fertile land.
Example: River valley settlements in the Indus Valley and Nile Valley.
Ancient Settlements:
Larger, permanent, and fortified towns.
Centers of trade, religion, and administration.
Example: Harappa, Mohenjo-Daro, Pataliputra.
Medieval Settlements:
Towns around forts, castles, temples, or trade centers.
Organic, irregular street patterns due to topography and defense needs.
Example: Jaipur (planned) vs. Varanasi (organic growth).
Modern Settlements:
Planned cities, industrial towns, and urban agglomerations.
Structured streets, zoning, and organized utilities.
A Development Plan is a long-term, statutory plan prepared for a town, city, or region to guide future growth and development in a systematic and sustainable manner. It provides a framework for physical, social, economic, and environmental development.
1️⃣ Definition
According to Town and Country Planning Act (India):
“A Development Plan is a plan prepared under the provisions of the Act for regulating the development of land and buildings in a city or town, specifying the areas to be developed, the uses to which the land may be put, and the facilities and amenities to be provided.”
Key Points:
Long-term perspective (typically 15–20 years).
Statutory and legally enforceable.
Provides guidelines for zoning, infrastructure, housing, and social amenities.
2️⃣ Purpose of a Development Plan
The main purposes of a Development Plan are:
Purpose
Description
Guiding Land Use
Allocate land for residential, commercial, industrial, institutional, and recreational purposes.
Infrastructure Planning
Plan for roads, water supply, sewerage, electricity, and communication systems.
Population Accommodation
Anticipate future population growth and housing needs.
Environmental Management
Preserve open spaces, green belts, water bodies, and prevent environmental degradation.
Urban Growth Regulation
Control unplanned development, urban sprawl, and encroachments.
Economic & Social Development
Support industries, commerce, employment, education, and healthcare facilities.
Legal Framework
Provide a statutory basis for approving building plans, land subdivisions, and development projects.
3️⃣ Process of Preparation of a Development Plan
The preparation of a Development Plan involves several stages, integrating technical analysis, legal requirements, and public participation:
Step 1: Data Collection and Analysis
Collect demographic, economic, social, and physical data.
Survey land use, existing infrastructure, transport networks, and environmental features.
Assess current and projected population, housing, and employment needs.
Step 2: Forecasting and Projection
Predict population growth, urban expansion, and infrastructure demand.
Estimate future land requirements for various uses.
Step 3: Formulation of Policies and Objectives
Define development objectives (housing, transport, industry, environment).
Establish zoning policies, density regulations, and land use priorities.
Step 4: Draft Plan Preparation
Prepare draft land use maps, road networks, public facilities, and amenities layout.
Identify growth areas, redevelopment zones, and restricted zones.
Step 5: Public Consultation and Review
Publish draft plan for public inspection and suggestions.
Conduct stakeholder meetings, public hearings, and expert reviews.
Revise draft based on feedback and legal requirements.
Step 6: Approval and Notification
Submit plan to Town Planning Authority / Municipal Authority.
Obtain formal approval from State Government or competent authority.
Officially notify the plan, making it legally binding.
Step 7: Implementation and Monitoring
Implement the plan through zoning regulations, building approvals, infrastructure projects, and development schemes.
Regular monitoring and periodic revisions (usually every 5–10 years) to adapt to changing conditions.
4️⃣ Key Features of a Development Plan
Statutory and legally enforceable.
Long-term vision (15–20 years).
Integrates land use, infrastructure, and social amenities.
Ensures orderly, sustainable, and inclusive development.
Supports economic growth, social welfare, and environmental protection.
✅ Key Takeaways:
A Development Plan is essential for regulating urban growth, providing infrastructure, and improving quality of life.
It is prepared through a structured process of data collection, analysis, policy formulation, public consultation, and legal approval.
Effective implementation ensures sustainable, planned, and equitable development of towns and cities
Planning in India uses various types of plans to guide development at national, regional, city, and local levels. Each plan serves a specific purpose and scale, ensuring coordinated and systematic development.
1️⃣ Master Plan
Definition:
A Master Plan is a long-term, comprehensive plan for the overall development of a city or town, usually covering 15–20 years.
Transportation networks, utilities, and infrastructure.
Population projections and housing requirements.
Environmental considerations and open spaces.
Example:
Master Plan of Delhi 2041
Pune Development Plan
2️⃣ City Development Plan (CDP)
Definition:
A City Development Plan is a strategic urban planning document prepared under the Jawaharlal Nehru National Urban Renewal Mission (JNNURM) and other schemes.
Focus:
Economic growth, urban infrastructure, and governance.
Social development and poverty alleviation programs.
City-specific programs for water, sanitation, housing, and transport.
Objective:
Facilitate sustainable and inclusive urban development.
3️⃣ Structure Plan
Definition:
A Structure Plan is a medium- to long-term plan that provides a framework for physical development of urban areas. It guides the detailed local plans (e.g., land-use zoning).
Focus:
Population distribution and settlement patterns.
Transportation and major infrastructure corridors.
Land-use distribution and environmental protection.
Example:
Structure plans prepared for fast-growing metropolitan regions.
4️⃣ District Plan
Definition:
A District Plan focuses on planning at the district level, integrating urban, rural, and regional development objectives.
Focus:
Development of towns and villages within the district.
Resource allocation, infrastructure, and social services.
Coordination between local bodies and regional planning authorities.
5️⃣ Action Area Plan
Definition:
An Action Area Plan is a short-term, site-specific plan within a city or town, aimed at immediate development or redevelopment.
Focus:
Implementation of specific projects (roads, parks, housing).
Development of priority zones or wards.
Addresses local needs and urgent interventions.
6️⃣ Subject Plan
Definition:
A Subject Plan deals with a specific sector or theme, such as transport, housing, water supply, or environmental management.
Focus:
Sector-specific infrastructure and service planning.
Integration with regional or city-wide plans.
Can be short-, medium-, or long-term.
Examples:
Transport Master Plan
Water Supply and Sewerage Plan
Solid Waste Management Plan
7️⃣ Comprehensive Planning
Definition:
Comprehensive Planning integrates all sectors, spatial, social, economic, and environmental considerations to guide development holistically.
Focus:
Long-term vision for the city or region.
Coordination of land use, transport, housing, utilities, and environment.
Inclusive and sustainable growth strategies.
8️⃣ Zonal Plans
Definition:
Zonal Plans are sub-area plans that focus on specific zones or wards within a city or region.
Focus:
Detailed land use, development control, and infrastructure planning.
Implementation of local development projects.
Supports the Master Plan and Structure Plan.
9️⃣ Hierarchy and Integration of Plans
Plan Type
Scope
Purpose / Focus
Master Plan
City / Town
Long-term, overall development, land use, population, infrastructure
City Development Plan
City
Strategic urban growth, governance, economic & social development
Structure Plan
City / Metropolitan Area
Framework for detailed planning, settlement patterns, transport
District Plan
District
Coordination of urban and rural development at district level
Action Area Plan
Specific area / ward
Short-term, site-specific development interventions
Subject Plan
Sector-specific
Planning for transport, water, housing, environment
Comprehensive Planning
City / Region
Holistic integration of all sectors and long-term vision
Zonal Plan
Zone / Ward
Detailed planning and implementation for a specific sub-area
✅ Key Points:
Planning in India is multi-layered and sector-specific, ensuring coordination from national/regional vision to local implementation.
Master Plans and Structure Plans provide long-term frameworks, while Action Area and Zonal Plans deal with immediate, site-specific interventions.
Subject Plans integrate sectoral priorities, and Comprehensive Plans ensure holistic, sustainable, and inclusive development.
🌱 Development, Growth, and Sustainable Development
Understanding these concepts is essential for planners, policymakers, and environmental managers to guide economic, social, and environmental progress.
1️⃣ Growth
Definition:
Growth refers to an increase in quantitative aspects of the economy, such as GDP, industrial production, income, or population.
Key Features:
Measurable and numerical (e.g., GDP growth rate, industrial output).
Focuses on economic expansion, not necessarily social welfare or environmental health.
Can occur without improving quality of life or reducing inequality.
Example:
Rapid industrial production in a city without adequate housing, sanitation, or environmental safeguards.
2️⃣ Development
Definition:
Development is a broader concept that includes economic growth plus improvements in social, environmental, and institutional conditions.
Key Features:
Qualitative and quantitative improvements.
Enhances human well-being, health, education, and quality of life.
Focuses on equity, justice, and opportunity in addition to economic indicators.
Example:
Urban development projects that provide affordable housing, clean water, schools, and parks alongside economic growth.
3️⃣ Sustainable Development
Definition:
The Brundtland Commission (1987) defines Sustainable Development as:
“Development that meets the needs of the present without compromising the ability of future generations to meet their own needs.”
Key Principles:
Environmental Sustainability: Protect natural resources, biodiversity, and ecosystems.
Economic Sustainability: Promote long-term economic growth without overexploitation.
Social Sustainability: Ensure equity, inclusion, and improved quality of life for all.
Features:
Integrates economic, social, and environmental planning.
Focuses on long-term impacts rather than short-term gains.
Requires participatory planning and policy coordination.
Examples in Planning Context:
Green buildings and eco-friendly urban designs.
Renewable energy integration in cities and industries.
Sustainable agriculture practices to protect soil and water.
Waste management and pollution control initiatives.
4️⃣ Comparison: Growth vs Development vs Sustainable Development
Aspect
Growth
Development
Sustainable Development
Nature
Quantitative
Quantitative + Qualitative
Balanced economic, social, environmental
Focus
Economy / GDP
Quality of life, well-being
Present needs + Future generations
Scope
Narrow
Broader (social + economic)
Broadest (social + economic + environmental)
Example
Industrial output increase
Affordable housing + schools
Eco-friendly city with renewable energy, clean water, and public transport
5️⃣ Relevance in Planning
Growth provides resources for development but may lead to inequality and environmental degradation if unchecked.
Development ensures equity, welfare, and social improvement alongside economic growth.
Sustainable development ensures long-term viability of cities, regions, and natural resources.
✅ Key Takeaways:
Planning must aim for sustainable development, balancing economic growth, social equity, and environmental protection.
Policies should ensure that development today does not harm the ability of future generations to meet their needs.
Planning is a multidisciplinary activity that involves organizing resources, land, infrastructure, and policies to achieve sustainable development. Different fields of planning focus on specific aspects of human settlements, infrastructure, and environmental management.
1️⃣ Urban Planning
Definition:
Urban planning deals with the design, development, and management of cities and towns to ensure efficient land use, infrastructure provision, and quality of life.
Create livable, sustainable, and well-functioning cities.
2️⃣ Regional Planning
Definition:
Regional planning focuses on large geographic areas, such as districts, states, or economic regions, integrating urban, rural, and natural resource development.
Focus Areas:
Balanced economic and social development.
Identification of growth centers and corridors.
Land and resource allocation across urban and rural areas.
Promote equitable growth and reduce regional disparities.
3️⃣ Environmental Planning
Definition:
Environmental planning ensures that development projects are sustainable, minimizing adverse impacts on natural resources and ecosystems.
Focus Areas:
Conservation of water, forests, soil, and biodiversity.
Pollution control: air, water, and noise.
Waste management and sanitation planning.
Climate change adaptation and disaster management.
Objective:
Achieve sustainable development while protecting natural resources.
4️⃣ Transport Planning
Definition:
Transport planning involves designing and managing transport systems to facilitate efficient movement of people and goods.
Focus Areas:
Road, rail, metro, and public transport systems.
Traffic management and pedestrian facilities.
Freight transport and logistics planning.
Integration of transport with land use and urban planning.
Objective:
Provide efficient, safe, and sustainable mobility for urban and regional populations.
5️⃣ Other Specialized Fields of Planning
Field
Definition / Focus
Housing & Infrastructure Planning
Provision of affordable housing, utilities, and civic services.
Industrial & Economic Planning
Allocation of industrial zones, promotion of employment and investment.
Social Planning
Education, healthcare, community welfare, and social equity.
Disaster & Risk Management Planning
Mitigation, preparedness, and response strategies for natural and man-made disasters.
Tourism Planning
Development of tourist infrastructure and sustainable tourism management.
Energy Planning
Efficient energy production, distribution, and renewable energy integration.
6️⃣ Integration Across Fields
Planning fields overlap and complement each other.
Example: Urban planning incorporates transport, environmental, and social planning.
Example: Regional planning integrates economic, transport, and environmental planning to ensure balanced development.
✅ Key Point: Effective planning requires a multidisciplinary approach, coordinating multiple fields to create sustainable, functional, and inclusive human settlements.
Planning in India is structured in a hierarchical system, from broad national or regional frameworks to site-specific local plans. This ensures integration across levels and sectors while addressing local, regional, and national development objectives.
1️⃣ Regional Plan
Definition:
A regional plan is a long-term plan that focuses on the development of a large area such as a district, state, or a cluster of districts, integrating urban, rural, and environmental planning.
Objectives:
Allocate land and resources efficiently across regions.
Promote balanced economic development and reduce regional disparities.
Identify growth centers and corridors for urban and industrial development.
Features:
Covers large geographic areas (state, region, or metropolitan region).
Provides framework for sub-regional and local plans.
Addresses land use, transport, infrastructure, and natural resource management.
2️⃣ Sub-Regional Plan
Definition:
A sub-regional plan focuses on a smaller part of a region, such as a district or cluster of towns, detailing development policies within the regional framework.
Objectives:
Identify specific growth centers and development nodes.
Plan for infrastructure, transportation, and land use at a sub-regional level.
Coordinate urban and rural development within the sub-region.
Features:
More detailed than a regional plan.
Links regional planning objectives with local-level plans.
Focuses on functional areas, transport corridors, and resource allocation.
3️⃣ Sector Plans
Definition:
Sector plans focus on specific sectors or themes, such as transport, housing, industry, water supply, or energy, across a region or city.
Objectives:
Improve efficiency and coordination of sector-specific development.
Integrate sectoral policies with spatial and regional planning.
Features:
Can be regional, sub-regional, or local in scope.
Provide guidelines for sector-specific infrastructure development.
Often include transport master plans, water supply schemes, or energy plans.
4️⃣ Spatial Plans
Definition:
Spatial plans (also called land-use or urban plans) organize the physical layout of land and infrastructure for settlements, towns, or cities.
Objectives:
Allocate land for residential, commercial, industrial, and recreational purposes.
Plan transport networks, open spaces, and public facilities.
Ensure efficient, equitable, and sustainable land use.
Features:
Translate policy goals into physical form.
Include master plans, zoning regulations, and detailed development plans.
Often cover municipal or town areas.
5️⃣ Town Planning Schemes (TPS)
Definition:
A Town Planning Scheme is a detailed local-level plan prepared for a specific area within a town or city, usually under the Town and Country Planning Act.
Objectives:
Reorganize land parcels for planned development.
Provide roads, parks, and civic amenities.
Compensate landowners for land acquired for public use while allowing development potential for private plots.
Features:
Area-specific and legally enforceable.
Includes land pooling, road layout, drainage, and public facilities.
Bridges the gap between master plans and on-ground implementation.
6️⃣ Hierarchy Summary
Level
Scope
Focus
Example
Regional Plan
Large region/state
Broad development, land use, growth centers
Delhi NCR Regional Plan
Sub-Regional Plan
District or cluster of towns
Sub-regional growth nodes, infrastructure
Pune Metropolitan Region Plan
Sector Plan
Specific sector
Transport, housing, industry, water
Mumbai Transport Master Plan
Spatial Plan
Town or city
Land-use allocation, infrastructure layout
Master Plan of Bangalore
Town Planning Scheme
Specific locality/ward
Detailed land development, roads, parks
TPS in Jaipur or Ahmedabad
✅ Key Points:
Planning is hierarchical and integrated, from broad regional frameworks to local-level implementation.
Regional plans set macro-level objectives.
Sub-regional and sector plans refine strategies.
Spatial plans and town planning schemes implement detailed land use and infrastructure plans.
This hierarchy ensures coordination, efficiency, and sustainable development across scales.
In recent decades, India has witnessed major urban planning initiatives aimed at creating sustainable, livable, and efficient cities. These initiatives often combine modern planning principles, technology, infrastructure development, and environmental considerations. The following case studies highlight contemporary planning approaches and their outcomes.
1. Chandigarh – Planned Modernist City
Background:
Designed by Le Corbusier in the 1950s as the new capital of Punjab and Haryana.
Objective: Provide a modern administrative and residential city post-independence.
Planning Features:
Sectoral Planning: City divided into sectors, each self-sufficient with schools, markets, and parks.
Green Spaces: Extensive use of parks, gardens, and tree-lined avenues.
Zoning: Separation of residential, commercial, and administrative zones.
Wide Roads and Grid System: Facilitates traffic circulation and orderly expansion.
Significance:
Chandigarh remains a model of modernist urban planning, blending functionality, aesthetics, and climate-responsive design.
Inspired subsequent planned cities in India, including Gandhinagar and Navi Mumbai.
2. Navi Mumbai – Satellite Town Planning
Background:
Developed in 1972 by CIDCO to decongest Mumbai and create organized residential and industrial zones.
Planning Features:
Sectoral Planning: Residential, commercial, and industrial sectors with planned civic amenities.
Transport Infrastructure: Wide roads, bridges, and rail connectivity integrated with public transport corridors.
Environmental Planning: Parks, green belts, and sustainable drainage systems.
Significance:
Successfully redirected population growth from Mumbai, providing a model for satellite cities in India.
Demonstrates integration of urban growth with infrastructure planning.
3. Smart Cities Mission – Pan-India Initiative
Background:
Launched by the Government of India in 2015, targeting 100 cities for smart, sustainable development.
Planning Features:
ICT Integration: Smart traffic management, e-governance, and public safety systems.
Infrastructure Upgrades: Water supply, waste management, renewable energy, and road networks.
Citizen-Centric Planning: Focus on livability, mobility, and economic opportunity.
Case Examples:
Pune Smart City: Intelligent traffic signals, GIS-based waste management, and pedestrian-friendly streets.
Ahmedabad Smart City: Integrated public transport system, solar-powered street lighting, and smart governance platforms.
Serves as an example of government-driven, functional city planning.
8. Jamshedpur – Industrial Township Planning
Background:
Developed in the early 20th century by Tata Steel as a model industrial city.
Planning Features:
Zoned Layout: Industrial zones, residential areas for employees, and civic amenities separated.
Green Spaces: Parks, gardens, and tree-lined streets.
Social Infrastructure: Schools, hospitals, and community centers integrated.
Significance:
Early example of planned industrial urban development in India.
Combines industry, residential living, and social infrastructure efficiently.
Key Takeaways from Contemporary Planning Initiatives
Sectoral and Master Planning: Ensures organized land use and infrastructure provision.
Sustainability: Emphasis on green spaces, renewable energy, and eco-friendly design.
Technology Integration: Smart city projects utilize ICT, GIS, and IoT for urban management.
Transit-Oriented Development: Metro and public transport corridors influence urban growth and density.
Public-Private Partnerships: Cities like Lavasa demonstrate private sector involvement in planning.
Conclusion
Contemporary urban planning initiatives in India reflect a blend of historical lessons, modernist principles, and technological innovation. Cities like Chandigarh, Navi Mumbai, New Town Kolkata, Gandhinagar, and Jamshedpur serve as examples of planned development, while Smart Cities and metro-based TOD projects highlight the role of technology, sustainability, and citizen-centric approaches. These initiatives provide a roadmap for the future of Indian urbanism, emphasizing livability, efficiency, and resilience.
The urban form—the physical layout and structure of cities—is directly influenced by technological advancements. Technology affects transportation, communication, construction, utilities, and urban management, reshaping cities over time. From ancient settlements to modern megacities, each technological breakthrough has left a mark on how cities are planned, built, and function.
1. Transportation Technology and Urban Form
Early Transport Innovations
In pre-industrial cities, urban form was compact, walkable, and oriented along rivers or trade routes.
Streets were narrow, and settlements were densely packed around marketplaces and defensive structures.
Railways (19th Century)
Railways enabled suburban expansion, creating railway towns and commuter belts.
Cities developed linear growth patterns along railway lines.
Example: Suburbs around London, Mumbai, and Kolkata expanded due to rail connectivity.
Automobiles (20th Century)
Introduction of cars led to wider streets, arterial roads, and highways.
Encouraged urban sprawl, low-density residential areas, and decentralized city layouts.
Example: Post-WWII American cities (Los Angeles) expanded horizontally due to car dependency.
Public Transit Systems
Metro, bus rapid transit (BRT), and light rail systems reshaped dense urban cores.
Encouraged transit-oriented development (TOD) with mixed-use clusters around stations.
Example: Delhi Metro has influenced high-rise, mixed-use corridors in the National Capital Region.
Impact: Technology in transportation determines city density, shape, and connectivity, influencing both vertical and horizontal urban expansion.
2. Construction Technology and Urban Form
Steel and Reinforced Concrete
Enabled high-rise buildings and skyscrapers, concentrating population and commercial activity vertically.
Cities could grow upwards instead of outwards, changing urban skylines.
Example: Mumbai, New York, and Dubai.
Prefabrication and Modular Construction
Accelerates housing and infrastructure development.
Leads to planned neighborhoods and satellite towns with uniform layouts.
Building Services Technology
Elevators, HVAC systems, and fire safety technology make high-density vertical living feasible.
Urban cores are increasingly mixed-use, with residential, commercial, and office towers.
Impact: Construction technology has allowed cities to accommodate growing populations in limited space, changing the form from low-rise sprawl to vertical density.
3. Communication Technology and Urban Form
Telegraph and Telephone
Early communication technology facilitated administrative and commercial centralization in urban cores.
Internet and Digital Technology
Enabled remote work and e-commerce, reducing the dependency on city centers.
Led to polycentric cities with multiple activity hubs rather than a single central business district (CBD).
Example: IT hubs in Bangalore, Hyderabad, and Pune have developed tech parks and suburban office clusters.
Impact: Communication technology influences location of employment, retail, and services, shaping urban density and functional distribution.
4. Utilities and Infrastructure Technology
Water Supply, Sewage, and Electricity
Advanced utility networks allow high-density residential areas far from natural water sources.
Enable the development of modern planned cities with systematic grids, parks, and open spaces.
Smart City Technologies
Sensors, IoT, and GIS-based urban management optimize traffic flow, waste management, energy use, and public services.
Urban form is increasingly designed around data-driven infrastructure, such as intelligent transport corridors and energy-efficient buildings.
Impact: Utilities and smart infrastructure make cities more efficient, resilient, and sustainable, influencing urban layouts and livability.
5. Industrial Technology and Urban Form
Industrial Revolution
Factories concentrated near transport hubs, shaping urban cores around industrial activity.
Workers’ housing, markets, and civic amenities emerged in proximity to industrial zones.
Example: Manchester (UK), Jamshedpur (India).
Post-Industrial Economy
Shift from manufacturing to service-based and knowledge economies transformed former industrial zones into commercial and residential areas.
Urban form became mixed-use and service-oriented, with adaptive reuse of industrial structures.
Impact: Industrial technology determines zoning, density, and functional distribution in cities.
6. Technology in Urban Planning and Design
GIS, Remote Sensing, and Modeling
Planners use geospatial data to optimize land use, traffic management, and environmental protection.
Influences urban form by identifying growth corridors, flood-prone zones, and optimal residential and commercial layouts.
Computer-Aided Design (CAD) and Simulation
Facilitates efficient urban design, infrastructure planning, and disaster management.
Supports 3D visualization, zoning analysis, and scenario modeling for sustainable city layouts.
Impact: Planning technology allows for scientific and precise urban design, shaping urban form based on data and simulation rather than intuition alone.
7. Summary of Technological Impacts on Urban Form
Technology
Impact on Urban Form
Railways
Linear city expansion, suburban growth
Automobiles
Urban sprawl, arterial roads, decentralized development
Technology has profoundly reshaped urban form, influencing density, layout, functionality, and aesthetics of cities. Transportation and construction technologies determine whether cities grow horizontally or vertically, while communication and planning technologies influence functional distribution and spatial organization. Utilities and smart infrastructure improve livability and sustainability, and industrial technology shapes economic and social zoning. Collectively, these innovations have transformed cities from compact, walkable settlements to complex, multifunctional, and globally connected urban regions.
New towns in India refer to planned urban settlements developed to address issues such as urban congestion, industrial growth, population pressure, and administrative needs. Unlike organically evolved cities, new towns are designed from scratch based on modern planning principles, incorporating zoning, infrastructure, transportation, public amenities, and open spaces.
1. Objectives of Developing New Towns in India
Relieve congestion in existing metropolitan areas (e.g., Mumbai, Kolkata).
Promote industrial and economic growth by creating hubs for manufacturing and services.
Implement modern urban planning principles (grid layouts, sectorization, zoning).
Provide affordable housing and better civic amenities.
Facilitate regional development and balanced population distribution.
2. Planning Principles for New Towns
Zoning: Residential, commercial, industrial, and recreational areas clearly segregated.
Transportation: Wide roads, public transit corridors, and pedestrian-friendly spaces.
Green Spaces: Parks, gardens, and green belts to ensure environmental sustainability.
Utilities and Infrastructure: Provision of water supply, drainage, electricity, and sewage systems.
Self-Containment: New towns often aim to be self-sufficient, providing employment, education, and healthcare locally.
Established: 1972 by CIDCO (City and Industrial Development Corporation)
Purpose: To decongest Mumbai and provide organized residential, commercial, and industrial spaces.
Planning Features:
Sector-based development with wide roads and dedicated residential/commercial zones.
Well-planned public transport, schools, hospitals, and parks.
Industrial zones in Vashi, Panvel, and Turbhe.
Significance: One of India’s largest planned cities, serving as a model for satellite city planning.
B. Chandigarh (Punjab & Haryana)
Established: 1950s, designed by Le Corbusier
Purpose: Capital city for Punjab and Haryana post-independence.
Planning Features:
Sector-based layout, each sector self-sufficient with markets, schools, and parks.
Wide boulevards, green belts, and open spaces integrated with modernist architecture.
Administrative and government sectors distinctly separated from residential zones.
Significance: Iconic example of modernist planning and urban design in India.
C. Durgapur (West Bengal)
Established: 1955, as an industrial town under the Durgapur Development Authority.
Purpose: Promote steel and heavy industries as part of post-independence industrialization.
Planning Features:
Residential, industrial, and civic zones clearly demarcated.
Planned civic amenities, parks, and public utilities.
Significance: Early example of a planned industrial township in eastern India.
D. Bhilai (Chhattisgarh)
Established: 1955, with the Bhilai Steel Plant as the core industrial activity.
Purpose: Industrial hub for steel production and supporting townships.
Planning Features:
Township planned for employees of the steel plant with housing, schools, and recreational facilities.
Separate industrial, residential, and administrative zones.
Significance: One of India’s earliest planned industrial towns integrating industrial growth and urban living.
E. Gandhinagar (Gujarat)
Established: 1960s as the capital of Gujarat.
Purpose: Replace Ahmedabad as the administrative capital with a planned city.
Planning Features:
Sectoral planning with residential, commercial, and administrative areas.
Wide avenues, parks, and water bodies.
Emphasis on green belts and modern civic amenities.
Significance: Example of post-independence administrative planning.
F. Greater Noida (Uttar Pradesh)
Established: 1991 by the Greater Noida Industrial Development Authority.
Purpose: To decongest Delhi and promote industrial and IT development.
Planning Features:
Wide roads, sectoral planning, IT and industrial zones.
Modern infrastructure including universities, sports complexes, and metro connectivity.
Significance: One of India’s fastest developing satellite cities, emphasizing modern urban infrastructure.
G. New Town Kolkata (West Bengal)
Established: 1990s, developed by West Bengal Housing Infrastructure Development Corporation (WBHIDCO).
Purpose: Modern IT, residential, and commercial hub on the outskirts of Kolkata.
Planning Features:
Sector-based planning, with IT parks, residential zones, and civic amenities.
Emphasis on sustainable urban design and public transportation.
Significance: Example of a planned knowledge and business city in India.
4. Characteristics Common to Indian New Towns
Master Planning: Detailed layouts prepared by town planning authorities.
Zoning: Separation of land uses for residential, commercial, industrial, and recreational purposes.
Infrastructure and Utilities: Proper provision of water supply, drainage, electricity, and sewage systems.
Environmental Consideration: Parks, lakes, and green belts integrated for ecological balance.
Transport Connectivity: Roads, railways, and public transport networks incorporated into design.
Self-Containment: Inclusion of schools, hospitals, markets, and recreational facilities within sectors or zones.
5. Significance of New Towns in India
Helped reduce pressure on mega-cities like Mumbai, Delhi, and Kolkata.
Facilitated industrialization and economic growth through planned industrial zones.
Introduced modern urban planning principles in India, serving as models for future cities.
Promoted organized, sustainable, and livable urban environments.
Conclusion
New towns in India represent the country’s commitment to planned urban growth, balancing industrial, residential, and administrative needs. Cities like Navi Mumbai, Chandigarh, Durgapur, Bhilai, Gandhinagar, Greater Noida, and New Town Kolkata showcase the application of modern planning principles, including sectoral layouts, green belts, zoning, and civic amenities. These towns not only alleviate pressures on existing urban centers but also provide a template for sustainable urban development in India.
The Greek civilization stands as one of the most influential in world history. Emerging around 2000 BCE and flourishing between 800 BCE and 146 BCE, ancient Greece laid the intellectual, political, and cultural foundations of what we now call Western civilization. The Greeks made remarkable contributions to philosophy, democracy, art, architecture, literature, and science, shaping the way humanity thinks, governs, and expresses itself. Their legacy continues to inspire modern political systems, education, and cultural ideals.
Ancient Greece was not a single unified empire but a collection of city-states (poleis) scattered across the mountainous Greek mainland, the Aegean islands, and the western coast of Asia Minor (modern-day Turkey). The rugged terrain and numerous islands encouraged the development of independent communities, each with its own government, traditions, and identity. The Aegean Sea served as a natural highway, connecting Greece with Egypt, Mesopotamia, and the wider Mediterranean world, fostering trade and cultural exchange.
The earliest Greek civilizations were the Minoan Civilization (c. 2700–1450 BCE) on the island of Crete and the Mycenaean Civilization (c. 1600–1100 BCE) on the mainland. The Minoans, known for their palace at Knossos, were skilled traders and seafarers. The Mycenaeans, on the other hand, were warriors who built fortified cities like Mycenae and Tiryns. The legendary Trojan War, immortalized by Homer’s epics — The Iliad and The Odyssey — reflects this heroic age.
After the decline of the Mycenaeans, Greece entered a period known as the Dark Age (1100–800 BCE), marked by reduced trade and population decline. However, this period also laid the groundwork for cultural revival and the rise of the Classical Greek civilization.
Rise of the City-States (Polis)
By the 8th century BCE, Greek society was organized into city-states (poleis) such as Athens, Sparta, Corinth, and Thebes. Each polis was politically independent, with its own government, army, and laws, yet shared a common language, religion, and cultural identity. The Greeks referred to themselves as Hellenes and their land as Hellas.
Two of the most famous city-states, Athens and Sparta, represented contrasting political and social systems.
Athens developed the world’s first democracy, where citizens (free men) participated directly in decision-making through assemblies.
Sparta, by contrast, was a military oligarchy, emphasizing discipline, strength, and loyalty to the state.
Despite their differences, both city-states contributed significantly to Greek political and cultural achievements.
Political and Social Organization
Greek civilization experimented with various forms of governance — monarchy, oligarchy, tyranny, and democracy. Athens’ democratic system under leaders like Solon, Cleisthenes, and Pericles became a model for later societies. Citizens debated and voted on laws, emphasizing civic responsibility and public participation — the foundation of modern democratic ideals.
Society in Greece was divided into citizens, metics (foreign residents), and slaves. Women generally had limited rights, though in Sparta they enjoyed more freedom and responsibility compared to other city-states. Education and intellectual growth were highly valued, especially in Athens, where philosophy, science, and the arts flourished.
Religion and Mythology
Religion played a central role in Greek life, shaping their values, festivals, and art. The Greeks were polytheistic, believing in a pantheon of gods and goddesses who lived on Mount Olympus. The most important deities included Zeus (king of the gods), Hera, Poseidon, Athena, Apollo, Artemis, Aphrodite, and Ares. Each city-state often honored a patron deity — for example, Athens was dedicated to Athena, the goddess of wisdom.
Greek mythology explained natural phenomena, human behavior, and the origins of the world through stories filled with gods, heroes, and moral lessons. Myths such as those of Hercules, Perseus, Theseus, and Odysseus continue to captivate audiences today and influenced Western literature and art.
Philosophy and Intellectual Contributions
One of Greece’s greatest achievements was its intellectual revolution. Greek philosophers sought rational explanations for the world, moving away from mythological thinking.
Socrates emphasized ethics and the pursuit of truth through questioning (Socratic method).
Plato, his student, founded the Academy and explored ideas of justice, politics, and metaphysics in works like The Republic.
Aristotle, Plato’s student, founded the Lyceum and made foundational contributions to logic, biology, ethics, and politics.
These thinkers laid the foundations of Western philosophy and science, influencing medieval scholars and the Renaissance.
The Greeks also advanced mathematics (Pythagoras, Euclid), medicine (Hippocrates), and astronomy. They sought to understand the natural world through observation and reasoning — the earliest form of scientific inquiry.
Art, Architecture, and Literature
Greek art and architecture reflected balance, harmony, and proportion — ideals that became central to Western aesthetics.
In architecture, the Doric, Ionic, and Corinthian styles defined temples such as the Parthenon on the Acropolis of Athens.
Sculpture achieved naturalism and beauty, depicting the human body with perfect proportion and movement — as seen in works like Discobolus (the Discus Thrower) and the Venus de Milo.
Greek literature also flourished. The epics of Homer, the tragedies of Aeschylus, Sophocles, and Euripides, and the comedies of Aristophanes explored themes of heroism, fate, morality, and politics. Greek theater, performed in open-air amphitheaters, was both a form of entertainment and a means of public reflection on social and ethical issues.
The Hellenic and Hellenistic Periods
The Classical Period (5th–4th centuries BCE) was Greece’s golden age, marked by the leadership of Pericles in Athens, the construction of the Parthenon, and the flourishing of art, philosophy, and democracy. However, constant warfare, such as the Peloponnesian War (431–404 BCE) between Athens and Sparta, weakened the Greek states.
In the 4th century BCE, Alexander the Great of Macedon united Greece and created one of the largest empires in history, stretching from Greece to Egypt and India. His conquests spread Greek language, art, and ideas across Asia and the Mediterranean, beginning the Hellenistic Period (323–146 BCE). This era blended Greek and Eastern cultures, producing advancements in science, art, and architecture — seen in cities like Alexandria.
Legacy and Influence
The legacy of Greek civilization is profound and enduring. The Greeks introduced ideas that remain central to modern thought and governance:
Democracy and citizenship in political life.
Rational philosophy and scientific inquiry.
Classical art and architecture emphasizing beauty, symmetry, and proportion.
Literary forms such as epic poetry, drama, and comedy.
Olympic Games, celebrating physical excellence and unity.
Greek thought profoundly influenced Roman civilization, which adopted and spread Greek culture throughout Europe. During the Renaissance, Greek ideas about humanism, reason, and beauty were rediscovered and became the foundation of modern Western civilization.
Conclusion
The Greek civilization remains a cornerstone of human achievement — a culture that elevated reason, beauty, and civic responsibility to ideals still admired today. Through their innovations in politics, philosophy, art, and science, the Greeks sought to understand both the world and humanity’s place within it. From the democratic debates of Athens to the philosophical inquiries of Aristotle, their spirit of inquiry and creativity continues to guide the modern world.
In truth, the story of Greece is the story of civilization itself — the birth of freedom, thought, and the enduring pursuit of knowledge and excellence.
Effective management of urban areas requires coordinated governance, planning, and development initiatives to ensure sustainable growth, efficient services, and improved quality of life for citizens.
1️⃣ Urban Governance
Urban governance refers to the systems, policies, and institutions that regulate and manage cities and towns, including service delivery, development planning, and citizen engagement.
Key Features of Urban Governance
Decentralization: Delegating powers to municipal authorities for better local decision-making.
Transparency & Accountability: Policies and processes should be transparent, with mechanisms to hold officials accountable.
Citizen Participation: Involving communities in planning and decision-making.
Coordination Across Departments: Ensures infrastructure, social services, and economic development are integrated.
The development of civilization marks one of the most significant transformations in human history. From small groups of hunter-gatherers to large, organized societies with cities, writing systems, and complex governance, the journey of civilization is a story of adaptation, innovation, and cultural evolution. The earliest civilizations emerged around fertile river valleys, where favorable geographical and climatic conditions supported agriculture, trade, and social organization. Understanding these early civilizations from a global perspective reveals not only the shared features of human progress but also the regional diversity that shaped the world’s cultural heritage.
A civilization is generally defined as an advanced stage of human social and cultural development characterized by urbanization, surplus food production, organized governance, social hierarchy, technological advancement, and the development of writing and art. The word “civilization” originates from the Latin term civitas, meaning “city,” reflecting the central role of urban settlements in civilizational growth. The emergence of civilization was made possible through the Neolithic Revolution (around 10,000 BCE), when humans shifted from nomadic lifestyles to settled agricultural communities. This transformation laid the foundation for surplus production, population growth, and specialized labor.
Global Development of Early Civilizations
Civilizations arose independently in various parts of the world between 3500 BCE and 1500 BCE. Despite being separated by vast distances, these early centers shared similar developmental patterns — dependence on agriculture, trade networks, and centralized governance. The four major ancient river valley civilizations are:
Mesopotamian Civilization (Tigris and Euphrates Rivers, Iraq)
Egyptian Civilization (Nile River, Egypt)
Indus Valley Civilization (Indus River, India–Pakistan region)
Chinese Civilization (Yellow River or Huang He, China)
Each of these civilizations developed unique political, social, and technological systems but also exhibited interconnections through trade and cultural diffusion.
Mesopotamian Civilization
Mesopotamia, often called the “Cradle of Civilization,” emerged between the Tigris and Euphrates Rivers around 3500 BCE. The fertile plains of this region (modern-day Iraq) allowed for surplus agricultural production, which supported the growth of cities like Uruk, Ur, and Babylon. Mesopotamians invented the world’s first writing system — cuneiform — used for record-keeping and administration. They also made advances in mathematics, astronomy, and architecture, building monumental ziggurats and developing early forms of law, such as the Code of Hammurabi. Mesopotamia’s city-states laid the foundation for governance, religion, and trade in the ancient world.
Egyptian Civilization
Developing along the Nile River around 3100 BCE, the Egyptian civilization thrived due to the river’s predictable flooding, which enriched the soil and supported stable agriculture. The Nile served as a natural highway for communication and trade, uniting Upper and Lower Egypt under the first pharaoh, Narmer (Menes). Egyptian society was highly organized, with a powerful centralized government led by divine kings. The Egyptians made remarkable achievements in engineering, medicine, art, and writing, particularly through the construction of the pyramids and the development of hieroglyphic script. Their religious beliefs in the afterlife shaped monumental architecture and artistic expression.
Indus Valley Civilization
The Indus Valley Civilization (c. 2600–1900 BCE), also known as the Harappan Civilization, developed along the Indus River and its tributaries in modern-day India and Pakistan. It was among the most advanced urban cultures of its time, with well-planned cities like Harappa and Mohenjo-Daro featuring grid layouts, drainage systems, and standardized bricks. The Harappans engaged in extensive trade with Mesopotamia and produced high-quality crafts, pottery, and jewelry. Although their script remains undeciphered, archaeological evidence suggests a society with social equality, organized governance, and emphasis on sanitation and urban planning — an early model of sustainable development.
Chinese Civilization
In East Asia, the Yellow River (Huang He) Valley saw the rise of Chinese civilization around 2000 BCE. The fertile loess plains supported agriculture, primarily millet and later rice cultivation. Early Chinese dynasties such as the Xia, Shang, and Zhou laid the groundwork for China’s cultural and political traditions. The Chinese developed oracle bone script, the earliest known form of Chinese writing, and made advancements in bronze casting, silk production, and military organization. The philosophical systems of Confucianism and Daoism, which evolved later, were deeply influenced by the early societal and natural relationships established in this riverine culture.
Other River-Based and Parallel Civilizations
Beyond these four, other civilizations developed independently around the world, often along rivers or fertile regions. The Mesoamerican civilizations (Olmec, Maya, Aztec) flourished in Central America, while the Andean civilizations (Inca) developed in South America. In Africa, the Nok and Kushite cultures rose, and in Europe, the Minoans and Mycenaeans established early complex societies. These regions, though geographically distant, demonstrate that human societies universally sought fertile land, stable food sources, and trade routes as foundations for cultural growth.
Significance and Legacy
River valley civilizations not only shaped their immediate regions but also influenced global human development. They introduced systems of governance, law, trade, writing, and art that became the bedrock of later empires and modern societies. Their innovations in irrigation, urban planning, and metallurgy transformed human capacity to manipulate the environment. Moreover, the cultural and technological exchanges among these civilizations laid the groundwork for globalization in the ancient world.
Conclusion
The development of civilization from a global perspective highlights humanity’s shared journey toward progress, adaptation, and cultural expression. River valley civilizations represent the earliest experiments in organized human life, where environmental advantages nurtured complex societies. Though they eventually declined due to natural and social factors, their legacies endure — in language, architecture, governance, and philosophy. The story of these civilizations reminds us that human advancement is deeply rooted in our relationship with nature, cooperation, and the quest for knowledge — a foundation upon which modern civilization continues to build.
Planning approaches determine how decisions are made, implemented, and integrated in development projects, whether urban, regional, or rural.
1️⃣ Top-Down Approach
Definition:
A Top-Down approach is a centralized planning method where decisions and policies are made by higher authorities (national or state governments) and implemented downwards at local levels.
Key Features:
Feature
Description
Decision-making
Made by central/state authorities or experts.
Implementation
Local authorities or communities follow instructions.
Focus
Large-scale, strategic, and macro-level objectives.
Participation
Minimal local participation; community often informed rather than consulted.
Planning Horizon
Long-term and often formalized.
Advantages:
Clear vision and centralized control.
Efficient resource allocation for large projects.
Easier coordination across regions.
Disadvantages:
May not reflect local needs and priorities.
Risk of public resistance if local conditions are ignored.
Can lead to inequality or inefficient use of resources.
Examples:
National Five-Year Plans in India.
Large infrastructure projects like dams, highways, or metro systems planned centrally.
2️⃣ Bottom-Up Approach
Definition:
A Bottom-Up approach is a decentralized planning method where local communities and stakeholders actively participate in decision-making. Plans emerge from the needs, priorities, and insights of the people directly affected.
Key Features:
Feature
Description
Decision-making
Initiated at local/community level; integrated upwards.
Implementation
Local people are directly involved in execution.
Focus
Micro-level, site-specific, and context-sensitive projects.
Participation
High; encourages community ownership and engagement.
Planning Horizon
Short- to medium-term, flexible.
Advantages:
Reflects local needs, culture, and priorities.
Encourages community ownership and sustainability.
Flexible and adaptive to local conditions.
Disadvantages:
May lack broader strategic coordination.
Resource limitations at local level.
Risk of fragmentation if not aligned with regional/national policies.
Examples:
Participatory rural development programs (e.g., MGNREGA projects).
Village-level planning under Gram Panchayats.
Local urban neighborhood development initiatives.
3️⃣ Comparison of Top-Down and Bottom-Up Approaches
Aspect
Top-Down
Bottom-Up
Decision-making
Centralized
Decentralized
Participation
Low
High
Scale
Macro-level
Micro-level
Flexibility
Rigid
Flexible
Community Ownership
Low
High
Example
National infrastructure projects
Village development plans
4️⃣ Integrated Approach
In practice, effective planning often combines both approaches:
Top-Down: Provides vision, resources, and regulatory framework.
Bottom-Up: Ensures local relevance, participation, and sustainability.
Example:
Urban master plans developed centrally but incorporating ward-level participatory planning.
National rural employment schemes designed centrally but executed through Gram Panchayat participation.
✅ Key Takeaways:
Top-Down: Efficient for large-scale, strategic planning but may ignore local needs.
Bottom-Up: Responsive to local needs and participatory but may lack macro coordination.
Best Practice: Integrate both approaches to combine vision, resources, and local relevance.
Town and Country Planning (TCP) is a branch of planning concerned with the systematic arrangement of land, infrastructure, and services in urban and rural areas to ensure orderly growth, efficient use of resources, and improved quality of life.
It integrates social, economic, and physical planning principles to achieve sustainable development at local, regional, and national levels.
1️⃣ Definitions of Town and Country Planning
Royal Town Planning Institute (RTPI), UK:
“Town planning is the art and science of ordering the use of land and the design of the urban environment, including the network of streets, the arrangement and design of buildings, and the provision of open spaces and public amenities.”
Indian Context:
“Town and country planning is the process of preparing, implementing, and controlling plans for the physical development of towns, cities, and rural areas, integrating social, economic, and environmental considerations.”
Key Points in Definitions:
TCP is systematic and future-oriented.
Concerned with land-use regulation, infrastructure provision, and urban-rural integration.
Seeks efficient, equitable, and sustainable development.
2️⃣ Goals of Town and Country Planning
The overarching goals of TCP focus on creating livable, functional, and sustainable communities:
Goal
Description
Orderly Development
Prevents haphazard growth and unplanned urban sprawl.
Efficient Land Use
Optimizes use of land for residential, commercial, industrial, and recreational purposes.
Economic Growth
Promotes industrial, commercial, and agricultural development.
Social Equity
Ensures equitable access to housing, health, education, and amenities.
Environmental Sustainability
Conserves natural resources, reduces pollution, and maintains green spaces.
Disaster Resilience
Plans for flood, earthquake, and other hazards in settlement layouts.
Integration of Urban & Rural Areas
Balances development between towns, cities, and rural settlements.
3️⃣ Objectives of Town and Country Planning
Land-Use Regulation
Zoning residential, commercial, industrial, and recreational areas.
Protecting agricultural and ecologically sensitive lands.
Infrastructure Development
Ensuring adequate water supply, drainage, electricity, transport, and communication networks.
Housing and Community Facilities
Provision of affordable housing, schools, hospitals, parks, and social amenities.
Urban-Rural Integration
Promote balanced development of cities, towns, and villages.
Reduce migration pressure on cities by improving rural livelihoods.
Environmental Protection
Promote green belts, open spaces, and sustainable resource management.
Economic and Industrial Development
Allocate land for industries, commercial zones, and marketplaces.
Support employment and economic opportunities.
Traffic and Transportation Planning
Organize roads, highways, public transport, and pedestrian systems.
Future-Oriented Growth
Anticipate population growth and urban expansion.
Prepare master plans and development frameworks for long-term planning.
4️⃣ Summary
Town and Country Planning is a multidisciplinary, systematic process to manage physical, social, and economic development of settlements.
Goals: Ensure orderly growth, social equity, economic development, and environmental sustainability.
Objectives: Include land-use regulation, infrastructure provision, housing, industrial development, and urban-rural integration.
✅ Key Point: TCP is both preventive (avoids chaos and congestion) and promotive (enables efficient and sustainable development).
India’s rapid population growth, urbanization, and socio-economic disparities have created distinct challenges in urban and rural areas. Planners need to address these problems for sustainable development.
1️⃣ Urban Problems
Urban areas, especially megacities and rapidly growing towns, face multiple issues due to overpopulation, unplanned growth, and resource pressure.
🔹 Key Problems
Problem
Description
Planning Concern
Overcrowding & High Population Density
Cities are overpopulated, leading to congestion and pressure on services.
India’s planning challenges are diverse, reflecting the contrast between urban growth pressures and rural development needs. Effective planning requires context-specific strategies for cities, towns, and villages.
1️⃣ Urban India: Cities and Towns
Urban areas include metropolitan cities, medium-sized towns, and emerging settlements. Rapid urbanization has created several planning challenges:
🔹 Key Planning Concerns
Aspect
Planning Concerns
Population Growth & Density
Overcrowding, pressure on housing and public services.
Housing & Slums
Shortage of affordable housing; rise of informal settlements.
Infrastructure & Utilities
Water supply, sewage, electricity, waste management often insufficient.
Transportation & Mobility
Traffic congestion, lack of public transport, parking issues.
Environmental Concerns
Air and water pollution, urban heat islands, loss of green spaces.
Economic & Social Services
Unequal access to healthcare, education, employment opportunities.
Land Use & Zoning
Unplanned urban sprawl, encroachment on open spaces and agricultural land.
🔹 Planning Strategies for Urban Areas
Prepare master plans and city development plans.
Develop affordable housing schemes and slum redevelopment projects.
Expand public transport networks and pedestrian-friendly spaces.
Create green belts, parks, and sustainable drainage systems.
Promote mixed-use development to reduce commute and improve livability.
2️⃣ Rural India: Villages and Countryside
Rural areas form the backbone of India, with agriculture, small-scale industries, and local markets. Planning concerns differ from urban areas:
🔹 Key Planning Concerns
Aspect
Planning Concerns
Agriculture & Land Use
Land fragmentation, soil degradation, irrigation needs.
Housing & Settlement Patterns
Quality of housing, access to safe water and sanitation.
Basic Infrastructure
Roads, electricity, healthcare, schools, and communication facilities.
Livelihood & Employment
Dependence on agriculture; need for rural industries and skill development.
Social Development
Education, health awareness, gender equity, and social inclusion.
Environmental Sustainability
Water conservation, forestry, soil management, disaster resilience.
🔹 Planning Strategies for Rural Areas
Develop village master plans and Gram Panchayat development plans.
Promote rural roads, electrification, water supply, and sanitation.
Support agriculture modernization and non-farm employment.
Urbanization refers to the increase in the proportion of population living in urban areas and the expansion of towns and cities in terms of population and built-up area. India has witnessed rapid urban growth over the last few decades due to economic, social, and demographic changes.
1️⃣ Trends and Patterns of Urbanization
Population Shift:
In 1951, only ~17% of India’s population lived in urban areas.
By 2021, the urban population increased to ~35% and continues to rise.
City Size Distribution:
Mega cities: Population > 10 million (e.g., Mumbai, Delhi).
Metropolitan cities: Population 1–10 million.
Medium and small towns: Population <1 million—rapid growth in Tier-II and Tier-III cities.
Regional Patterns:
Highly urbanized states: Maharashtra, Tamil Nadu, Gujarat, Kerala.
Low urbanization: Bihar, Odisha, Uttar Pradesh.
Urban growth is often concentrated in coastal areas and industrial belts.
2️⃣ Causes of Urbanization in India
Cause
Description
Economic Opportunities
Industrialization, service sector growth, IT hubs attract migrants.
Rural-Urban Migration
Search for employment, education, healthcare, and better living standards.
Population Growth
Natural increase contributes to expanding urban population.
Infrastructure & Connectivity
Better transport, roads, and communication promote urban growth.
Government Policies
Industrial estates, SEZs, and urban development projects encourage migration to cities.
3️⃣ Impacts of Urbanization
🔹 Positive Impacts
Economic growth: Concentration of labor, industries, and services.
Improved access to education, healthcare, and amenities.
Cultural and social interaction; cosmopolitan urban culture.
🔹 Negative Impacts / Challenges
Urban Sprawl: Unplanned expansion of cities into surrounding rural areas.
Housing Shortage & Slums: High-density informal settlements due to demand-supply gap.
Traffic Congestion & Pollution: Air, water, and noise pollution due to vehicles and industries.
Infrastructure Strain: Inadequate water supply, sanitation, electricity, and waste management.
Social Inequality: Gaps between rich and poor, informal economy, and marginalization.
4️⃣ Planning Implications of Urbanization
Urbanization requires effective urban planning to ensure sustainable, equitable, and efficient cities:
Land Use Planning: Zoning for residential, commercial, industrial, and recreational areas.
Transport & Connectivity: Roads, public transit, and non-motorized transport networks.
Human civilization has always been closely associated with cities. Cities are not just physical spaces; they are reflections of culture, economy, technology, governance, and values of the societies that created them. The study of historical cities is essential in understanding how urban forms evolved, what principles guided their planning, and how those principles can still inform modern planning practice.
Historical cities are settlements that emerged in ancient or medieval times, often as centers of administration, trade, culture, or religion. Their planning reflects both functional needs (defense, commerce, water supply) and symbolic meanings (religion, cosmology, social hierarchy). From the Indus Valley cities of Harappa and Mohenjo-Daro to medieval European towns, Islamic cities, and ancient Chinese capitals, each provides insights into planning traditions.
2. Key Historical Examples and Principles
a) Indus Valley Civilization (Harappa and Mohenjo-Daro, c. 2500 BCE)
Grid Iron Pattern: Streets were laid out in a north-south, east-west orientation.
Standardized Housing: Uniformity in residential blocks, with variation only in size.
Water Management: Advanced drainage systems, wells, and bathing areas.
Public Spaces: Granaries, citadels, and assembly halls served as community hubs.
Principle:Order, hygiene, and functionality.
b) Ancient Egyptian Cities
Oriented along the Nile River, which provided water and transport.
Temples and pyramids dominated the urban landscape, symbolizing religion and power.
Settlements developed near fertile floodplains, with planned layouts for workers’ villages (e.g., Deir el-Medina).
Principle:Religious centrality and alignment with natural geography.
c) Greek Cities (Athens, Miletus, c. 5th century BCE)
Hippodamian Plan: Introduced by Hippodamus of Miletus, featuring a rectangular grid.
Agora: Central public square for markets, politics, and social life.
Acropolis: Elevated sacred area with temples.
Emphasis on civic life, philosophy, and democracy.
Principle:Balance of civic, sacred, and residential functions.
d) Roman Cities
Expanded grid plan with Cardo (north-south) and Decumanus (east-west) as main streets.
Forum: Administrative and commercial hub.
Infrastructure: Aqueducts, amphitheaters, baths, roads, and fortifications.
New towns were often established as military colonies.
Principle:Utility, connectivity, and grandeur.
e) Medieval European Cities
Organic Growth: Streets were often winding, adapted to terrain and defense.
Central Cathedral and Market Square: Spiritual and economic life revolved around them.
Fortifications: City walls and gates provided protection.
Guild-based neighborhoods: Craftsmen and traders settled in clusters.
Principle:Defense, community identity, and centrality of religion.
f) Islamic Cities (Baghdad, Cairo, Delhi, c. 8th–16th centuries)
Central Mosque and Bazaar (Suq): Spiritual and commercial focus.
Citadel or Palace: Political authority emphasized.
Narrow, Shaded Streets: Adapted to hot climates.
Residential Privacy: Houses oriented inward with courtyards.
Principle:Integration of religion, commerce, and environment.
g) Chinese Cities (Chang’an, Beijing)
Based on geomancy (Feng Shui) and cardinal orientation.
Central Axis: Palaces, administrative centers, and ceremonial spaces aligned on it.
Walled cities with gates at cardinal points.
Hierarchical zoning: Emperor’s palace at center, then officials, merchants, and workers.
Principle:Cosmic order, hierarchy, and symbolism.
h) Indian Medieval Cities (Varanasi, Jaipur, Shahjahanabad)
Varanasi: Organic growth along the Ganges, religious ghats dominating spatial form.
Jaipur (1727): Planned on gridiron pattern with wide streets, bazaars, and public squares, influenced by Vastu Shastra.
Shahjahanabad (Old Delhi, 17th century): Red Fort, Jama Masjid, Chandni Chowk bazaar at the heart; enclosed by walls and gates.
Principle:Blend of cosmology, commerce, and defense.
3. General Planning Principles of Historical Cities
Across civilizations, certain common principles emerge:
Centrality of Power and Religion – Palaces, temples, mosques, or cathedrals were focal points.
Geometry and Order – Grid patterns in Indus Valley, Greek, Roman, and Jaipur cities.
Defense and Security – Walls, citadels, moats in medieval Europe and Islamic cities.
Adaptation to Climate and Geography – Courtyards in hot climates, shaded narrow lanes, riverside settlements.
Integration of Public Spaces – Agoras, forums, bazaars, ghats as centers of community life.
Hierarchy and Zoning – Clear division of spaces for rulers, priests, merchants, workers.
Infrastructure Focus – Drainage, water supply, roads, markets, storage facilities.
Symbolism and Identity – Cities often reflected cosmology, religion, or imperial power.
4. Lessons for Modern Planning
Historical cities remind us that planning must go beyond physical design. They show the importance of:
Human-scale design (walkability, community interaction).
Integration of culture and identity into urban spaces.
Environmental adaptation (use of natural resources sustainably).
Resilient infrastructure (water systems, defenses, transport networks).
Inclusive public spaces where social, cultural, and economic life thrives.
Conclusion
Historical cities are living archives of human ingenuity, resilience, and cultural expression. Their planning was guided by principles of functionality, symbolism, and adaptability. By studying Harappa’s drainage, Athens’ civic spaces, Rome’s infrastructure, Baghdad’s bazaars, or Jaipur’s grids, modern planners can learn how to design cities that are sustainable, inclusive, and culturally rooted. While times have changed, the underlying planning principles of historical cities remain deeply relevant to the challenges of today’s urbanization.
Academic life is not merely about memorizing textbooks, attending lectures, or submitting assignments. It is a journey of self-discovery, critical thinking, creativity, and joy in learning. Shashikant Nishant Sharma has beautifully articulated this philosophy through what he calls the “Think, Write, and Dance Principles.” These principles are not rigid rules but flexible guiding ideas that can transform the way scholars, students, and researchers approach their studies and intellectual growth.
1. The Principle of Thinking
At the heart of every academic pursuit lies thinking. Thinking is the raw material of knowledge. It is what turns information into understanding and data into wisdom.
Critical Thinking: Scholars must learn not to accept everything at face value. Questioning assumptions, testing evidence, and looking for alternative perspectives are essential habits.
Creative Thinking: Academic life is not only about analysis but also about imagination. Creativity allows us to connect different fields, generate new ideas, and propose innovative solutions.
Reflective Thinking: Reflection enables students to learn from past mistakes, understand their learning style, and set goals for improvement.
“Thinking is like planting seeds. The more carefully you nurture them, the richer will be the harvest of your academic journey.”
Practical ways to adopt this principle:
Start a “thinking journal” where you write down questions that come to mind during lectures.
Dedicate 15–20 minutes daily to silent reflection on what you studied.
Discuss ideas with peers to expand your intellectual horizons.
2. The Principle of Writing
Writing is the bridge between thought and communication. Without writing, even the best ideas may remain buried in the mind. Shashikant Nishant Sharma emphasizes writing as an essential discipline for academic success.
Clarity of Expression: Writing forces you to organize your ideas logically. It sharpens your understanding.
Habit Formation: Regular writing—whether essays, research papers, or even short reflections—trains your mind to think systematically.
Knowledge Sharing: Writing is not just personal; it is also a contribution to the wider academic community. When you write, you leave behind knowledge for others to build upon.
Practical ways to adopt this principle:
Keep a daily or weekly academic diary summarizing what you learned.
Practice writing small essays on topics beyond the syllabus.
Publish or share your work (blogs, class magazines, research forums).
“What is not written is often forgotten. Writing makes your thoughts immortal.”
3. The Principle of Dancing
The most unique and refreshing part of Sharma’s framework is the idea of dancing. At first, it may seem symbolic, but it carries profound meaning. “Dance” here refers to the joy of learning, the rhythm of effort, and the celebration of creativity.
Balance and Flow: Just as dance requires balance and rhythm, so does academic life. There must be a harmony between study, rest, and reflection.
Joyful Engagement: Scholars should not treat studies as a burden. Learning should feel like dancing—an act of joy, expression, and freedom.
Celebrating Progress: Every small achievement—completing a project, mastering a concept, presenting in class—should be celebrated like a dancer celebrating a graceful performance.
Practical ways to adopt this principle:
Take breaks to recharge and enjoy activities beyond academics (music, sports, art).
Celebrate small victories with friends or mentors.
Approach assignments with creativity—add visuals, stories, or metaphors to make them lively.
“Dance reminds us that academic life is not just about reaching goals but enjoying every step of the journey.”
Integrating the Principles: A Scholar’s Lifestyle
The real power of the Think, Write, and Dance Principles lies in their integration. Imagine a daily routine like this:
Morning: Spend time thinking deeply about a problem or concept.
Afternoon: Convert those reflections into written notes, essays, or research drafts.
Evening: Engage in a joyful, creative activity—whether literal dance, music, or a celebration of what you achieved.
This cycle ensures that learning is holistic, sustainable, and fulfilling. It prevents burnout, keeps the mind active, and nurtures the soul.
Why Scholars Should Adopt These Principles
They promote balance between intellectual rigor and personal well-being.
They encourage creativity in academic work, moving beyond rote learning.
They transform study from a duty into a joyful journey.
They align with the modern need for interdisciplinary and innovative approaches.
They build habits that last a lifetime, beyond the classroom and into professional and personal life.
Conclusion
Shashikant Nishant Sharma’s Think, Write, and Dance Principles are more than academic strategies—they are a philosophy of life. They remind scholars that learning is not confined to exams or degrees but is a lifelong rhythm of reflection, expression, and celebration. By thinking deeply, writing clearly, and dancing joyfully, every student can make their academic journey both productive and fulfilling.
“To think is to discover, to write is to preserve, and to dance is to celebrate the beauty of learning.”
Distribute text and visuals evenly across the page.
Example: On one page, write text on the left and place a map/sketch on the right.
(ii) Alignment
Keep text aligned properly (left, center, or justified).
Example: Use left-aligned paragraphs with right-aligned image captions.
(iii) Hierarchy
Use clear headings, subheadings, and bullet points.
Example: Headings in bold/large size, sub-points in smaller font.
(iv) Contrast
Highlight key facts or quotes using boxes, bold text, or different colors.
Example: A quote like “Cities are the engines of growth” inside a colored box.
(v) Repetition
Maintain a consistent style across pages (same font for headings, same bullet style).
Example: Use the same border design or title placement on each page.
(vi) Proximity
Group related content together.
Example: Keep history paragraphs together and tourist attractions in one section instead of scattering.
(vii) White Space
Do not fill the page fully with text—leave margins, gaps, or empty areas.
Example: Write a paragraph in the center with wide borders on all sides.
(viii) Simplicity
Avoid over-decoration. Use neat boxes, underlines, or bullet points.
Example: Draw a simple city skyline outline at the bottom of the page.
(ix) Movement/Flow
Arrange text and visuals so that the reader’s eyes naturally flow across the page.
Example: Write in a “Z-pattern” where the eye moves left to right, then diagonally down.
(x) Unity
All elements should look connected. Use same color pencils for diagrams, same heading style.
Example: If you choose blue for location maps, use the same shade for other illustrations.
4. Page-by-Page Composition Plan
Here’s how you can structure the 5 content pages using the design principles:
Page 2: Location
Heading at top (Hierarchy).
Map of your city (Balance with text).
Box with quick facts (Contrast).
Clean alignment left for text.
Page 3: History
Timeline diagram with arrows (Movement).
Small illustrations (fort, temple, etc.).
Group events into 3 sections (Proximity).
White space around the diagram.
Page 4: Importance of the City
Use two columns (Alignment & Balance).
Left: Economic role (bullets).
Right: Cultural/educational role (short paras).
Repeat icon style for industries, schools, etc. (Repetition).
Page 5: Tourist Attractions
Large heading in creative style (Hierarchy).
Pictures or hand-drawn sketches of attractions.
Use boxes for each place with captions.
Contrast important site names with bold/highlight.
Page 6: Likes & Dislikes (Planner’s Perspective)
Use two boxes side by side: “What I Like” and “What I Dislike.”
Add a quote about sustainable cities.
Suggest improvements in bullet points.
Leave some empty margin (White Space).
5. Cover Letter (Page 1)
Your cover letter should look professional. It must contain:
Title of Assignment (My City from a Planner’s Perspective).
Your Name, Roll Number, Subject/Department.
Date of submission.
A short statement like: “This assignment is submitted as part of the Mini Test Cum Assignment to explore my city from the lens of planning, highlighting its location, history, importance, tourism, and challenges.”
Keep it center-aligned, simple, and neat.
6. Tips for Illustrations & Diagrams
You don’t need to paste printed pictures—simple line diagrams drawn with pencil and colored lightly will be better.
Examples:
Sketch a city map with rivers, roads, and main landmarks.
Draw monuments as outline sketches.
Show traffic problems with arrows and vehicles.
Use bar graphs (population growth, tourists per year).
7. Writing Style
Use clear and simple English (avoid long complicated sentences).
Write in paragraphs and bullet points.
Add quotes or proverbs about cities (e.g., “A developed city is not one where the poor own cars, but one where the rich use public transport.”).
Keep grammar and spelling correct.
8. Evaluation Basis
Your teacher will likely evaluate based on:
Content Quality (coverage of all sections).
Composition Skills (use of layout principles).
Creativity (drawings, diagrams, color use).
Neatness & Presentation (no overwriting, proper alignment).
Personal Reflection (your likes/dislikes with planner’s vision).
9. Word Count & Time Management
Each page should have 300–400 words approx., so overall 1500–1800 words.
Keep time for drawing maps/diagrams (don’t leave it for last minute).
10. Conclusion
This assignment is not only about describing your city but also about experimenting with design and composition. The 10 layout principles will help you learn how to present content in a visually appealing and structured way. If followed properly, your work will look professional, planner-oriented, and creative.
The census is one of the most vital tools in understanding the demographic, social, and economic profile of a country. Conducted periodically, usually every ten years, the census is a complete enumeration of the population, households, and their characteristics. For planners, it provides an indispensable database that informs decision-making across urban, regional, social, economic, and environmental planning. The classification systems, standardized definitions, and structured datasets of a census ensure that the information collected can be used for long-term development strategies, policy formulation, and spatial planning.
Census Classification
Census classification refers to the way population and related attributes are grouped, segmented, and organized to ensure accurate analysis. Some of the major classifications include:
Population Classification
Rural vs. Urban: Based on criteria like population size, density, and occupational structure. In India, for example, a settlement is considered urban if it has at least 5,000 inhabitants, a density of 400 persons per sq. km, and 75% of the male workforce engaged in non-agricultural activities.
Household vs. Institutional Population: Census classifies individuals living in normal households separately from those living in institutions such as hostels, prisons, or ashrams.
Resident Status: Usual residents vs. migrants, classified by place of birth or last residence.
Social Classification
By age, sex, marital status, literacy, education, religion, caste, and language. These classifications highlight the social structure and diversity of a population.
Economic Classification
Work participation, occupation, industry, and employment status. Populations are divided into main workers, marginal workers, and non-workers.
Housing and Amenities Classification
Type of housing (kutcha, pucca, semi-pucca), ownership status, availability of basic amenities like drinking water, electricity, toilets, and access to communication facilities.
Geographical Classification
Data is categorized into various spatial levels such as state, district, sub-district (tehsil/taluka), town, ward, and village. This hierarchical spatial classification ensures planners can use data at different scales.
Key Definitions in Census
Household: A group of persons who normally live together and take their meals from a common kitchen.
Census House: A building or part of a building with a separate main entrance, used for living, shop, or office purposes.
Usual Resident: A person who has stayed in a place for at least six months or intends to stay there for six months or more.
Urban Area: Defined by population size, density, and proportion of non-agricultural workers, or statutory notification (municipality, corporation, cantonment board).
Rural Area: All areas not classified as urban.
Main Worker: A person who works for six months or more in the reference year.
Marginal Worker: A person who works for less than six months in the reference year.
Literacy: A person aged seven years or above who can read and write with understanding in any language.
Such standardized definitions ensure comparability of data across regions and over time.
Use of Census Data for Planners
Census data plays a pivotal role in planning processes at all levels—national, regional, and local. The following are key areas where planners make extensive use of census information:
Urban and Regional Planning
Census data helps in identifying the size, growth rate, and distribution of population in urban and rural areas. This allows planners to prepare master plans, regional plans, and city development plans.
It aids in the classification of settlements, identification of urban sprawl, and the planning of new towns and satellite towns.
Housing and Infrastructure Development
Data on housing stock, household size, and availability of amenities helps in forecasting housing demand. Planners can prioritize provision of water supply, sanitation, electricity, and transport.
Information about slum populations helps in designing urban renewal and slum improvement projects.
Transport and Mobility Planning
Data on workforce participation and place of work-residence helps in transport planning, route optimization, and forecasting traffic demand.
Social Planning
Census data on literacy, education, caste, and religion enables planners to design programs for education, health, and social equity.
Data on age structure helps in planning for schools, universities, and facilities for the elderly population.
Economic and Employment Planning
Workforce participation data allows planners to assess the labor supply for industries, services, and agriculture.
Migration data helps in understanding labor mobility and designing employment programs.
Environmental and Resource Planning
Population density and growth trends help in identifying pressure on land and natural resources. This informs sustainable development policies and conservation efforts.
Policy Formulation and Governance
Census provides a factual basis for resource allocation, political representation, and welfare schemes. For instance, delimitation of constituencies, distribution of funds, and targeted poverty alleviation programs are based on census counts.
Conclusion
The census is not merely a headcount of people; it is a comprehensive socio-economic survey that provides the bedrock for planning. The classifications and definitions embedded in census methodology ensure consistency and reliability of data. For planners, it is both a diagnostic tool and a forecasting instrument—helping to understand past trends, current realities, and future needs. In an era of rapid urbanization, growing inequality, and environmental challenges, census data remains indispensable for evidence-based, sustainable, and inclusive planning.
🏙️ Planning Process and Levels of Planning in India
Planning in India is a systematic approach to achieve balanced development across economic, social, and physical dimensions. It involves a sequence of steps and operates at multiple administrative levels.
1️⃣ Planning Process in India
The planning process is cyclical and iterative, involving analysis, formulation, implementation, and evaluation.
🔹 Steps in the Planning Process
Goal Setting
Identify national or regional objectives: economic growth, employment, housing, infrastructure, social equity.
Example: Eliminate rural-urban disparities, provide affordable housing.
Data Collection and Analysis
Collect demographic, economic, environmental, and spatial data.
Use tools like Census, GIS, remote sensing, and surveys.
Forecasting and Projection
Predict population growth, urban expansion, resource needs, and economic trends.
Helps in anticipating future demands for housing, transport, energy, and public services.
Plan Formulation
Prepare plans based on analysis and projections.
Decide policies, strategies, and programs for development.
Example: Master plans for cities, industrial development plans.
Approval and Resource Allocation
Plans are approved by relevant authorities (central, state, local).
Allocate financial, human, and material resources for implementation.
Implementation
Execute projects, policies, and programs.
Involves coordination between government departments, private sector, and communities.
Monitoring and Evaluation
Check progress against targets.
Evaluate impact on economy, society, and environment.
Adjust plans as necessary (feedback mechanism).
2️⃣ Levels of Planning in India
Planning in India operates at three main levels:
🔹 a) National Level
Focus: Overall development strategy for the country.
Responsible Body: Planning Commission (historically), now NITI Aayog.
Key Plans:
Five-Year Plans (historically, till 2017)
National Development Agenda, Sustainable Development Goals (SDGs)
Example: Policies on industrialization, infrastructure, energy, health, and education.
🔹 b) State Level
Focus: Regional development within a state.
Responsible Body: State Planning Departments / State Development Authorities.
Key Plans:
State Five-Year Plans (aligned with national plan)
Regional plans for urban and rural areas
Example: Industrial corridors, state highways, irrigation projects.
🔹 c) Local / Urban Level
Focus: City, town, or village-specific planning.
Responsible Body: Municipal Corporations, Panchayati Raj Institutions, Development Authorities.
Key Plans:
Master plans / city development plans
Local area plans, slum redevelopment, housing schemes
Example: Master Plan of Delhi, Smart City Projects, local parks, and streetscapes.
3️⃣ Integration Across Levels
National policies guide state and local plans.
State plans adapt national goals to regional realities.
Local plans implement policies in a practical and site-specific manner.
Feedback from local implementation informs state and national revisions.
4️⃣ Summary Table
Level
Focus
Responsible Body
Example
National
Country-wide strategy
NITI Aayog / Former Planning Commission
National Infrastructure Plan
State
Regional development
State Planning Departments
Industrial corridors, state highways
Local
City/town/village plans
Municipalities, Panchayats
Master plans, housing schemes, smart city projects
✅ Key Points:
Planning in India is systematic, hierarchical, and iterative.
Three levels ensure plans are strategic (national), regional (state), and site-specific (local).
Successful planning requires integration, coordination, and continuous monitoring.
In acoustics, dead spots (also called acoustic nulls or dead zones) are locations in a room or space where sound is noticeably weaker or almost inaudible compared to surrounding areas. These occur due to the cancellation of sound waves from reflections, standing waves, or interference patterns.
Causes of Dead Spots
Standing Waves (Room Modes): When sound waves reflect off walls, ceilings, and floors, they interact with the direct sound. At certain frequencies, destructive interference occurs, cancelling out sound energy at specific points in the room.
Phase Cancellation: If two sound waves of the same frequency but opposite phase overlap, they cancel each other out, creating a quiet or “dead” area.
Poor Speaker Placement: Placing speakers near walls or corners can create uneven sound distribution, with dead spots in the middle or edges of the room.
Room Shape and Materials: Odd-shaped rooms, parallel reflective walls, or materials that excessively absorb certain frequencies can all contribute to dead spots.
Examples
In a concert hall, some seats may have weaker bass response due to standing wave cancellation.
In a recording studio, a mix engineer sitting at the wrong spot may not hear certain frequencies accurately.
In a home theater, bass “disappears” at some seats while booming in others.
How to Minimize Dead Spots
Acoustic Treatment: Use bass traps, diffusers, and absorbers to reduce reflections and smooth out standing waves.
Speaker Placement: Experiment with moving speakers away from walls and corners.
Listener Positioning: Avoid sitting in the exact center of a room, where nulls are most common.
Multiple Subwoofers (for low frequencies): Helps distribute bass more evenly across the space.
Room Shape Design: Concert halls and auditoriums are carefully designed to reduce such effects.
👉 Dead spots aren’t complete silence—they’re frequency-dependent. A location might sound fine at midrange but have no bass, which is why they are particularly noticeable with low-frequency sounds.
Would you like me to also make a diagram showing how standing waves create dead spots in a room?
A life table is a demographic tool that provides a systematic description of mortality, survival, and expectation of life at different ages in a population. It is constructed using age-specific mortality rates and helps to estimate measures like life expectancy, survival probabilities, and death probabilities at each age or age interval. There are two main types: Complete Life Table and Abridged Life Table.
1. Complete Life Table
Definition: A complete life table shows mortality and survival data for every single year of age, starting from birth (age 0) up to the maximum attainable age (often 100+).
Structure: It has entries for each exact age (0, 1, 2, 3 … up to the last age group).
Detail level: Provides fine-grained detail about the probability of death (qₓ), number surviving (lₓ), and life expectancy (eₓ) at each exact age.
Advantage: Useful for very precise demographic and actuarial calculations such as insurance premiums, pension schemes, and health risk assessments.
Limitation: Requires detailed and reliable age-specific mortality data, which may not always be available, especially in developing countries.
Example: If we construct a complete life table for India and at age 25, the table shows:
Out of 100,000 live births (l₀ = 100,000), about l₂₅ = 95,200 survive to exact age 25.
The probability of death between ages 25 and 26 (q₂₅) might be 0.0021 (i.e., 2.1 deaths per 1000).
Life expectancy at age 25 (e₂₅) could be 47.8 years.
2. Abridged Life Table
Definition: An abridged life table groups ages into wider intervals (commonly 5-year intervals such as 0–4, 5–9, 10–14, etc.) instead of providing values for each single year.
Structure: Usually constructed with 5-year or 10-year age intervals, though the first age interval (0–1, 1–4) is often broken into smaller parts due to higher infant mortality.
Detail level: Less detailed than a complete life table but easier to construct and interpret.
Advantage: Requires less detailed data, can be built with smaller population samples or incomplete mortality data. Suitable for census-based or survey-based population studies.
Limitation: Less precise because it averages mortality experience over age intervals.
Example: In an abridged life table for India:
Age group 20–24 may show probability of dying (q₂₀–₂₄) as 0.008 (i.e., 8 deaths per 1000 over 5 years).
Life expectancy at exact age 20 (e₂₀) may be estimated as 51.5 years.
The table skips intermediate ages (21, 22, 23, 24), treating them as part of the group.
3. Key Differences at a Glance
Aspect
Complete Life Table
Abridged Life Table
Age intervals
Single year (0, 1, 2, …)
Multi-year (often 5-year groups)
Detail
Very detailed, precise
Less detailed, approximate
Data requirement
Needs full age-specific mortality data
Can be constructed from limited data
Use
Actuarial science, insurance, medical research
Census analysis, demographic surveys, broad planning
Example output
Probability of death at exact age 25
Probability of death for 20–24 as a group
Conclusion
A complete life table is more precise but data-intensive, best suited for actuarial and insurance purposes.
An abridged life table is more practical for countries or studies with limited demographic data, commonly used in population censuses and health surveys.
Both are crucial tools in demography, each serving different analytical and policy needs.
Natural resources are elements of the natural environment that are utilized to meet human needs—such as water, land, forests, minerals, soil, and energy sources. Proper planning ensures efficient use, conservation, and sustainability of these resources in settlements and urban development.
1️⃣ Types of Natural Resources in Planning Context
The conservation of wildlife and biodiversity has become a matter of global concern due to the rapid increase in illegal wildlife trade and species extinction. To address this, the international community established CITES – the Convention on International Trade in Endangered Species of Wild Fauna and Flora. CITES is a legally binding international agreement that aims to ensure that international trade in specimens of wild animals and plants does not threaten their survival.
CITES was adopted on 3 March 1973 in Washington, D.C., and it came into force on 1 July 1975. Today, it has more than 180 member countries (called Parties), including India, which became a Party in 1976. Although CITES is legally binding, it does not replace national laws. Instead, it provides a framework for countries to regulate and monitor international wildlife trade.
Important Aspects of CITES
Objectives The primary objective of CITES is to prevent overexploitation of species through international trade. It ensures that trade in plants and animals is legal, sustainable, and traceable. By regulating trade, CITES protects endangered species from extinction while allowing controlled trade in species that are not under severe threat.
Appendices of CITES CITES classifies species into three appendices based on the degree of protection they need:
Appendix I: Includes species threatened with extinction. International trade in these species is strictly prohibited except for non-commercial purposes such as scientific research. Examples: Tigers, Asiatic lions, elephants, giant pandas, and gorillas.
Appendix II: Includes species not necessarily threatened with extinction but which may become so if trade is not regulated. Trade is allowed but requires export permits and monitoring. Examples: Indian star tortoise, certain orchids, and some reptile species.
Appendix III: Includes species that are protected in at least one country, which has requested other CITES Parties for assistance in controlling trade. Examples: Certain species of turtles and birds listed by specific countries.
Regulation of Trade CITES establishes a system of permits and certificates to regulate trade. Export, import, and re-export of species listed in the appendices are allowed only when accompanied by valid permits issued by the designated national authorities.
National Authorities Each Party designates two key authorities:
Management Authority: Issues permits and ensures implementation.
Scientific Authority: Provides advice on whether trade in a particular species is sustainable. In India, the Directorate of Wildlife Preservation serves as the CITES Management Authority.
Impact on Wildlife Protection CITES has played a crucial role in reducing illegal trade of species such as ivory, rhino horn, and exotic birds. It has also promoted international cooperation in conservation efforts. India, for instance, has banned trade in tiger parts and ivory under CITES obligations.
Challenges Despite its success, CITES faces challenges such as wildlife smuggling, weak enforcement in some countries, lack of awareness, and the growing demand for exotic pets and medicinal plants. Ensuring compliance and strengthening capacity in developing countries remain ongoing tasks.
Conclusion
CITES is a landmark international agreement that plays a pivotal role in conserving biodiversity by regulating the global wildlife trade. Its key aspects—classification of species into appendices, regulation through permits, and cooperation among member countries—make it an essential tool in protecting endangered flora and fauna. However, its success depends on strong national enforcement, global cooperation, and public awareness. In today’s context of rising illegal trade and biodiversity loss, CITES remains one of the most important international frameworks for wildlife conservation.
Conservation of biodiversity requires not only protecting core natural habitats but also creating transitional areas where human activities can coexist with ecological balance. One of the most effective tools for this purpose is the establishment of buffer zones. These zones play a crucial role in minimizing human pressures on sensitive ecosystems and ensuring long-term biodiversity conservation.
Definition of Buffer Zones
A buffer zone is a region that surrounds or lies adjacent to a protected area, such as a national park, wildlife sanctuary, or biosphere reserve. It serves as a transitional area between strictly protected core zones and regions of human settlement or intensive land use. Buffer zones allow limited, regulated human activities while simultaneously protecting the integrity of the core habitat.
According to UNESCO’s Man and the Biosphere (MAB) Programme, biosphere reserves consist of three zones:
Core Zone – Strictly protected natural ecosystem.
Buffer Zone – Surrounds the core zone, permitting research, education, and limited sustainable use.
Transition Zone – Outermost area where communities practice sustainable livelihoods.
Thus, the buffer zone acts as a protective shield for the core biodiversity-rich area.
Importance of Buffer Zones in Protecting Biodiversity
Protection Against Human Pressure Buffer zones reduce the direct impact of human activities such as agriculture, grazing, logging, or settlement on sensitive ecosystems. By serving as a barrier, they minimize disturbances like noise, pollution, and encroachment into core conservation areas.
Habitat Connectivity and Wildlife Corridors Many species require large areas for survival and migration. Buffer zones act as corridors linking fragmented habitats, enabling safe movement of species like elephants, tigers, and migratory birds. This connectivity prevents genetic isolation and supports healthy populations.
Support for Research and Education Scientific research, environmental education, and eco-tourism are permitted in buffer zones. This not only enhances public awareness about conservation but also reduces pressures on the strictly protected core zones. For instance, eco-tourism in buffer areas of Kaziranga National Park in Assam helps in both awareness generation and revenue creation.
Sustainable Livelihoods for Communities Buffer zones allow local communities to carry out regulated activities such as collection of non-timber forest produce, handicraft-making, organic farming, and eco-tourism. This reduces conflict between conservation authorities and local populations, fostering community participation in biodiversity protection.
Mitigation of Human–Wildlife Conflicts Buffer zones act as “safety nets” that prevent direct encounters between wildlife and human settlements. By providing regulated grazing lands, water sources, and fodder, they reduce crop raiding and livestock predation by wild animals.
Pollution Control and Environmental Services Buffer zones often consist of vegetation that absorbs pollutants, prevents soil erosion, and reduces runoff into rivers and lakes. Wetlands and forested buffer areas play an important role in filtering water and maintaining ecological balance.
Climate Change Adaptation Buffer zones enhance ecosystem resilience by allowing species to shift their ranges in response to climate change. They provide additional habitats for species under stress from rising temperatures or changing rainfall patterns.
Examples in India
The Nilgiri Biosphere Reserve has buffer zones where sustainable agriculture and eco-tourism are promoted, reducing pressures on core forests.
The Sundarbans Biosphere Reserve uses buffer zones to regulate fishing and forest produce collection, thereby protecting mangroves and tigers.
Conclusion
Buffer zones are essential components of modern conservation strategies. They act as protective shields for core biodiversity areas, enable habitat connectivity, provide livelihood opportunities, and reduce human–wildlife conflicts. By balancing conservation with sustainable development, buffer zones foster harmony between people and nature. In the long run, strengthening buffer zones is vital to ensure the protection of biodiversity, ecological processes, and the well-being of human communities dependent on natural resources.
Biodiversity, the variety of life on Earth, is fundamental for maintaining ecological balance and providing essential resources for human survival. However, increasing habitat loss, pollution, climate change, and overexploitation have led to alarming rates of biodiversity decline. Conservation efforts are therefore not limited to ecological measures but also require social and economic strategies to ensure community participation, sustainable livelihoods, and long-term success.
Social Strategies for Conserving Biodiversity
Community Participation Active involvement of local communities is crucial for biodiversity conservation. Indigenous people often possess traditional ecological knowledge about sustainable resource use. Initiatives like Joint Forest Management (JFM) in India empower local communities to protect forests while deriving benefits such as fuelwood and non-timber forest produce.
Environmental Education and Awareness Education creates awareness about the importance of biodiversity and the threats it faces. Schools, NGOs, and government campaigns promote conservation values through eco-clubs, biodiversity parks, and awareness drives. Festivals and traditions linked to sacred plants and animals also reinforce conservation ethics.
Traditional Knowledge and Practices Indigenous practices, such as maintaining sacred groves in Meghalaya or protecting sacred species like the Tulsi plant, contribute significantly to conservation. Documenting and integrating this traditional knowledge into modern conservation strategies ensures sustainability.
Legislation and Policy Support Strong legal frameworks support biodiversity conservation. In India, the Wildlife Protection Act (1972), Biological Diversity Act (2002), and establishment of protected areas (national parks, sanctuaries, biosphere reserves) reflect the social commitment to biodiversity.
Social Incentives and Recognition Recognizing and rewarding communities for their conservation efforts builds social responsibility. The Bishnoi community in Rajasthan is an example where religious and social values have led to strong protection of flora and fauna.
Economic Strategies for Conserving Biodiversity
Sustainable Use of Resources Conservation must go hand in hand with livelihoods. Promoting sustainable forestry, fisheries, and agriculture ensures that natural resources are used without exhausting them. For instance, organic farming reduces chemical use and protects soil biodiversity.
Eco-Tourism Eco-tourism generates income while promoting conservation. Tourists visiting national parks, wildlife sanctuaries, or biosphere reserves provide revenue that supports local communities and park management. The Kaziranga National Park in Assam is a successful example where eco-tourism supports both conservation and local economies.
Payment for Ecosystem Services (PES) Communities protecting forests and watersheds can be compensated for the ecological benefits they provide, such as carbon sequestration, clean water, and soil conservation. This economic incentive motivates conservation at the grassroots level.
Alternative Livelihoods To reduce pressure on forests and wildlife, alternative income sources such as handicrafts, bee-keeping, and medicinal plant cultivation are encouraged. This reduces dependence on unsustainable hunting, logging, or grazing.
Conservation Funding and International Support Financial mechanisms such as the Global Environment Facility (GEF), biodiversity funds, and carbon credits provide monetary support for conservation projects. Corporate Social Responsibility (CSR) initiatives also channel funds for biodiversity-friendly projects.
Market-Based Approaches Promoting biodiversity-friendly products through certification schemes such as organic labels or Fair-Trade certification encourages consumers to support conservation with their purchasing power.
Conclusion
The conservation of biodiversity cannot succeed through ecological measures alone—it requires strong social strategies such as community participation, education, and traditional practices, as well as economic strategies like sustainable resource use, eco-tourism, alternative livelihoods, and conservation funding. Together, these approaches align human welfare with environmental protection, ensuring that biodiversity conservation becomes both a social responsibility and an economic opportunity. By combining cultural values with economic incentives, societies can protect biodiversity while fostering sustainable development.
The term biosphere reserve refers to a protected area recognized under UNESCO’s Man and the Biosphere (MAB) Programme, which began in 1971. Biosphere reserves aim to conserve biodiversity, promote sustainable development, and support scientific research and education. They are special regions that represent unique ecosystems of global significance, where human activity and nature coexist in balance. India has established several biosphere reserves such as Nilgiri, Sundarbans, Nanda Devi, and Gulf of Mannar, many of which are also part of the UNESCO World Network of Biosphere Reserves.
The main characteristics of biosphere reserves can be understood under the following headings:
1. Conservation of Biodiversity
The foremost characteristic of biosphere reserves is the protection of biological diversity. They are designed to conserve:
Genetic diversity: safeguarding varieties of crops, medicinal plants, and animal breeds.
Species diversity: protecting endangered, endemic, and keystone species.
Ecosystem diversity: conserving forests, wetlands, mountains, coastal areas, and grasslands. For example, the Sundarbans Biosphere Reserve conserves the unique mangrove ecosystem and species like the Royal Bengal Tiger.
2. Zonation System
A distinctive feature of biosphere reserves is their division into three zones for different levels of protection and use:
Core Zone: A strictly protected area where human activity is not allowed. It conserves ecosystems and species in their natural state.
Buffer Zone: Surrounds the core zone. Limited human activities like research, education, and sustainable resource use are permitted.
Transition Zone: The outermost zone where communities live and practice sustainable agriculture, forestry, and eco-friendly development. This zonation system balances conservation with human needs, making biosphere reserves unique.
3. Sustainable Development
Unlike national parks and sanctuaries, biosphere reserves are not only about protection but also about promoting sustainable livelihoods for local people. Activities such as organic farming, eco-tourism, and traditional resource use are encouraged in the transition zones. This ensures that conservation efforts benefit both nature and communities.
4. Research and Monitoring
Biosphere reserves serve as “living laboratories” for ecological and social research. Scientists study ecosystem functions, climate change impacts, sustainable practices, and human–nature interactions in these areas. Regular monitoring of biodiversity helps in developing better conservation strategies.
5. Education and Awareness
Another characteristic of biosphere reserves is their role in spreading environmental education and awareness. They encourage local participation, community training, and student exposure to biodiversity. This helps people understand the value of conservation and adopt eco-friendly lifestyles.
6. Integration of Culture and Nature
Biosphere reserves acknowledge the close link between cultural traditions and biodiversity. Many reserves protect sacred groves, indigenous practices, and traditional knowledge. For example, the Nanda Devi Biosphere Reserve in Uttarakhand not only conserves Himalayan biodiversity but also protects the cultural heritage of local communities.
7. International Recognition
Many biosphere reserves are part of the UNESCO World Network of Biosphere Reserves, which promotes global cooperation in conservation and sustainable development. This gives international recognition to local conservation efforts and allows sharing of knowledge across countries.
Conclusion
Biosphere reserves are unique protected areas that combine conservation, sustainable development, and scientific research. Their key characteristics include biodiversity protection, zonation into core–buffer–transition areas, promotion of sustainable livelihoods, integration of cultural values, and international cooperation. Unlike conventional protected areas, they aim to strike a balance between nature conservation and human needs. In the context of increasing biodiversity loss and climate change, biosphere reserves play a crucial role in maintaining ecological balance while ensuring that human societies continue to thrive in harmony with nature.
Biodiversity conservation can be carried out through different strategies, broadly categorized into species-based and ecosystem-based approaches. The species-based approach focuses on protecting and managing individual species that are threatened, endangered, or of special ecological, cultural, or economic importance. It emphasizes direct action to prevent the extinction of specific species and to restore their populations to sustainable levels.
Key Features of the Species-Based Approach
Identification of Target Species The first step is to identify species that are endangered, threatened, or vulnerable. For example, the tiger, Asiatic lion, snow leopard, and gharial in India have been recognized as priority species for conservation.
Legal Protection Laws and regulations are framed to protect these species from hunting, poaching, and trade. In India, the Wildlife Protection Act of 1972 provides legal safeguards to species listed under its schedules.
Captive Breeding and Reintroduction Many species are bred in captivity under controlled conditions and later reintroduced into the wild. For instance, the captive breeding program for the gharial has helped revive its population in Indian rivers.
Recovery Programs Special recovery programs are launched to monitor and improve the population status of threatened species. The Project Tiger (1973) and Project Elephant (1992) are examples of species-based initiatives in India.
Awareness and Community Involvement Education and awareness campaigns encourage communities to participate in species conservation. Sacred species like the cow or peepal tree are often protected due to cultural values, reflecting traditional species-based conservation practices.
Advantages of the Species-Based Approach
Focused Protection: Provides targeted conservation measures to prevent extinction of critically endangered species.
Flagship and Keystone Species: Protecting iconic species like tigers or elephants indirectly conserves their habitats and many associated species.
Public Support: Charismatic species attract public attention and funding, making conservation campaigns more effective.
Scientific Knowledge: Provides detailed information about the biology, ecology, and behavior of species, useful for long-term management.
Disadvantages of the Species-Based Approach
Narrow Focus This approach emphasizes a few selected species, often charismatic or economically valuable, while ignoring less attractive but ecologically vital species such as amphibians, reptiles, or insects.
Neglect of Ecosystems Focusing only on individual species may overlook the broader ecosystem and habitat that sustain them. Without habitat protection, long-term conservation is unsustainable.
High Cost and Resource Demand Species-based conservation requires intensive monitoring, breeding, and management, which is expensive and resource-intensive. Limited funds may restrict efforts to a few species, leaving many others unprotected.
Risk of Failure in Captive Breeding Captive breeding programs may face challenges such as inbreeding, loss of natural behavior, and failure of reintroduced species to survive in the wild.
Human–Wildlife Conflicts Focusing on large species like elephants or tigers sometimes leads to conflicts with local communities, as these animals may damage crops, livestock, or even cause human casualties.
Short-Term Approach Species-based measures may temporarily improve numbers, but without addressing underlying causes like habitat destruction, climate change, or pollution, extinction risks remain.
Conclusion
The species-based approach of conserving biodiversity plays an important role in preventing the extinction of threatened species and in raising awareness about conservation. Programs like Project Tiger and captive breeding initiatives have achieved notable successes. However, this approach has limitations because it often neglects ecosystems as a whole and may be expensive and selective. For sustainable biodiversity conservation, species-based strategies must be integrated with ecosystem-based approaches that protect habitats and ecological processes, ensuring the survival of all life forms, not just a few iconic species.
Extinction is the permanent disappearance of a species from Earth. It is a natural process that has occurred throughout geological history, as seen in the extinction of dinosaurs about 65 million years ago. However, in the present age, human activities have accelerated extinction rates to alarming levels, far exceeding the natural background rate. The loss of species threatens not only biodiversity but also the ecological balance and resources essential for human survival. The major causes of extinction can be grouped into natural and anthropogenic factors.
1. Habitat Loss and Fragmentation
The most significant cause of species extinction is the destruction of natural habitats. Expanding agriculture, deforestation, mining, urbanization, and infrastructure projects reduce the living space for wildlife. Habitat fragmentation isolates populations, making them more vulnerable to genetic decline and inbreeding. For instance, the fragmentation of tiger habitats in India has led to declining populations and increased human–wildlife conflicts.
2. Overexploitation
Overhunting, overfishing, and overharvesting of plants and animals for food, medicine, timber, and trade have driven many species to extinction. The dodo bird of Mauritius was hunted to extinction in the 17th century. Similarly, excessive hunting of passenger pigeons in North America wiped out the species. In India, species like the Indian bustard and pangolin are critically endangered due to hunting and trade.
3. Pollution
Pollution of air, water, and soil has severely impacted species survival.
Industrial effluents and sewage degrade aquatic habitats, leading to fish kills and loss of aquatic biodiversity.
Pesticides and chemicals poison ecosystems, affecting birds and insects (e.g., the decline of vultures in India due to diclofenac poisoning).
Plastic pollution in oceans entangles marine species like turtles, dolphins, and seabirds. Pollution not only kills directly but also reduces reproduction and weakens species over time.
4. Climate Change
Global warming and climate change are altering habitats and species distribution. Rising temperatures, melting ice caps, sea-level rise, and shifting rainfall patterns force species to adapt, migrate, or perish. Polar bears are threatened as Arctic ice melts, while coral reefs are bleaching due to ocean warming and acidification. Species with narrow ecological ranges, such as alpine plants, face higher extinction risks as their habitats shrink.
5. Invasive Species
The introduction of non-native species often threatens local biodiversity by outcompeting, preying upon, or spreading diseases among native species. For example, the brown tree snake introduced to Guam caused the extinction of several bird species. In India, invasive weeds like Lantana camara and Eichhornia (water hyacinth) have degraded habitats, pushing native species towards decline.
6. Diseases
Emerging infectious diseases, often linked to human activities and climate change, pose new threats to wildlife. For example, the chytrid fungus has caused the extinction of several amphibian species worldwide. Similarly, rinderpest outbreaks historically wiped out populations of wild ungulates in Africa.
7. Small Population Size and Genetic Factors
Species with small populations face extinction risks due to inbreeding, reduced genetic diversity, and inability to adapt to environmental changes. Such populations are also vulnerable to random events such as natural disasters. The cheetah, for example, has very low genetic diversity, making it highly susceptible to diseases and habitat changes.
Conclusion
The extinction of species is driven by a combination of human-induced and natural factors. Habitat destruction, overexploitation, pollution, climate change, invasive species, diseases, and genetic problems all contribute to biodiversity loss. The rapid rate of extinction in the modern era is largely due to human pressures on ecosystems. Preventing extinction requires global cooperation in habitat conservation, pollution control, sustainable use of resources, and protection of endangered species. Conserving species is not only an ethical responsibility but also essential for maintaining ecological balance and ensuring the survival of humankind.
Habitat is the natural environment where a species lives, finds food, reproduces, and interacts with other organisms. The survival of all species depends on the availability and stability of their habitats. However, rapid human activities and environmental changes have led to widespread habitat loss, which is considered the most significant threat to global biodiversity. When natural habitats are destroyed, fragmented, or degraded, species face declining populations, loss of genetic diversity, and even extinction. Below are the major factors causing habitat loss.
1. Deforestation
One of the leading causes of habitat loss is large-scale deforestation. Forests are cleared for timber, fuelwood, agriculture, and urban expansion. This drastically reduces the living space for countless species. For example, the destruction of tropical rainforests in the Amazon and Southeast Asia has endangered species such as orangutans, jaguars, and countless insects. In India, forest clearance in the Western Ghats and Northeast threatens elephants, tigers, and endemic plants.
2. Agricultural Expansion
The growing demand for food has led to the conversion of natural habitats into farmland. Intensive monoculture farming, shifting cultivation, and slash-and-burn practices degrade habitats. Use of chemical fertilizers and pesticides further contaminates ecosystems, reducing biodiversity. Wetlands and grasslands have particularly suffered as they are drained or ploughed for crop cultivation.
3. Urbanization and Infrastructure Development
Rapid urban growth and industrialization result in the destruction of habitats. Expansion of cities, construction of roads, railways, dams, and mining activities fragment natural landscapes. This isolates animal populations, restricts migration routes, and disrupts ecological processes. For instance, highways in forested areas often cut off elephant corridors in central and southern India, leading to human–wildlife conflicts.
4. Overexploitation of Resources
Unsustainable exploitation of forests, fisheries, and minerals depletes natural habitats. Excessive hunting, logging, and overfishing not only remove species but also alter the ecological balance of habitats. Coral reefs, for example, are being degraded by destructive fishing practices and coral mining. Similarly, mangroves are cleared for aquaculture and firewood, destroying habitats for fish, crabs, and migratory birds.
5. Pollution
Pollution is a major factor contributing to habitat degradation and loss.
Air pollution damages forests and freshwater systems through acid rain.
Water pollution from industrial effluents, sewage, and agricultural runoff leads to eutrophication and dead zones in lakes, rivers, and seas.
Soil pollution caused by pesticides and heavy metals reduces soil fertility and affects microorganisms. Plastic pollution in oceans has destroyed habitats of marine species like turtles and seabirds.
6. Climate Change
Global warming and climate change are altering habitats at an unprecedented rate. Rising temperatures, melting glaciers, sea-level rise, and changing rainfall patterns are shifting species ranges and shrinking habitats. Coral reefs are bleaching due to higher sea temperatures. Polar bears are losing their Arctic ice habitats, while Himalayan species are forced to move to higher altitudes.
7. Invasive Species
The introduction of non-native species into ecosystems often threatens native biodiversity. Invasive plants and animals compete for resources, alter habitat conditions, and sometimes prey on native species. For example, the introduction of water hyacinth in Indian lakes has choked freshwater habitats, while invasive predators like cats and rats have devastated island bird populations worldwide.
Conclusion
Habitat loss is primarily driven by human activities such as deforestation, agriculture, urbanization, and pollution, compounded by global challenges like climate change and invasive species. It disrupts ecological processes, reduces biodiversity, and threatens ecosystem services vital to human well-being. Protecting habitats through afforestation, sustainable land use, pollution control, and wildlife corridors is essential to prevent further biodiversity decline. Safeguarding habitats is not only about conserving species but also about ensuring the stability of life-support systems on Earth.
Biodiversity is not only the foundation of ecosystems but also the basis of environmental stability. It plays a critical role in regulating and maintaining the quality of essential natural resources—soil, air, and water. Healthy ecosystems depend on the presence of diverse plants, animals, and microorganisms that interact to perform ecological functions. These processes sustain life on Earth and ensure human well-being.
1. Biodiversity and Soil Quality
Soil is the lifeline of agriculture and terrestrial ecosystems. Its fertility and structure depend heavily on biodiversity.
Decomposition and Nutrient Cycling: Microorganisms such as bacteria, fungi, and actinomycetes decompose organic matter, converting dead plants and animals into humus. This process releases essential nutrients like nitrogen, phosphorus, and potassium back into the soil, making them available for plant growth.
Soil Formation: Lichens and mosses colonize bare rocks and break them down into soil particles, initiating soil formation. Burrowing animals like earthworms and ants further enhance soil aeration and mixing.
Soil Fertility: Nitrogen-fixing bacteria (e.g., Rhizobium in legume roots, Azotobacter in the soil) enrich the soil with nitrogen. Mycorrhizal fungi form associations with plant roots, improving nutrient uptake.
Erosion Control: Plant roots bind soil particles and reduce erosion by water and wind. Vegetative cover in forests and grasslands prevents land degradation.
Thus, biodiversity sustains soil fertility, structure, and productivity.
2. Biodiversity and Air Quality
Air quality is maintained by the balance of gases in the atmosphere, a process strongly influenced by biodiversity.
Photosynthesis and Oxygen Supply: Green plants, algae, and phytoplankton absorb carbon dioxide during photosynthesis and release oxygen, maintaining the oxygen–carbon dioxide balance necessary for life. Forests, often called the “lungs of the Earth,” play a crucial role in regulating air composition.
Carbon Sequestration: Forests, grasslands, and marine ecosystems store large amounts of carbon in biomass and soils, reducing greenhouse gases and mitigating climate change.
Pollutant Absorption: Plants act as natural filters by trapping dust, smoke, and other airborne particles. Certain species also absorb harmful gases like sulfur dioxide and nitrogen oxides.
Odor and Toxin Control: Wetland vegetation and microorganisms can absorb foul-smelling gases and neutralize toxins, improving local air quality.
Without biodiversity, the natural regulation of atmospheric gases and pollutants would collapse, leading to poor air quality and climate imbalance.
3. Biodiversity and Water Quality
Water quality is closely linked to biological processes in aquatic and terrestrial ecosystems.
Filtration and Purification: Wetlands, mangroves, and riparian vegetation act as natural water filters. They trap sediments, absorb nutrients, and filter pollutants before they reach rivers, lakes, or groundwater.
Decomposition of Organic Waste: Aquatic microorganisms and invertebrates break down organic matter, preventing water bodies from becoming polluted and oxygen-depleted.
Nutrient Cycling in Aquatic Systems: Algae, aquatic plants, and microbes recycle nutrients in lakes, rivers, and oceans, maintaining water productivity without excessive nutrient buildup.
Flood Regulation: Forests and wetlands absorb rainwater, recharge groundwater, and reduce runoff, preventing siltation and maintaining water clarity.
Buffer Against Pollution: Mangroves and estuaries act as buffers by absorbing heavy metals and toxic compounds, thereby protecting coastal water quality.
Through these functions, biodiversity ensures safe and clean water for human use and aquatic life.
Conclusion
Biodiversity is central to the maintenance of soil, air, and water quality. Microorganisms enrich soil and recycle nutrients; plants and forests regulate air composition and absorb pollutants; wetlands, aquatic species, and vegetation purify water and prevent pollution. In short, biodiversity acts as nature’s life-support system, maintaining the very resources essential for survival. Protecting biodiversity is therefore not just about saving species—it is about safeguarding the ecological processes that keep soil fertile, air breathable, and water pure for present and future generations.
Biodiversity, or the variety of life on Earth, plays a central role in sustaining human societies. One of its most direct contributions is the provision of food resources, which form the basis of nutrition, health, and livelihoods. From staple crops to fruits, vegetables, livestock, fish, and wild foods, biodiversity ensures both the quantity and quality of human diets. The diversity of plants and animals used for food also provides resilience against environmental stresses, pests, and diseases, making biodiversity indispensable for food security.
1. Plant Biodiversity as a Food Source
Plants form the primary source of human nutrition by supplying carbohydrates, proteins, fats, vitamins, and minerals. Agricultural biodiversity, which includes cultivated crops and their wild relatives, has developed over centuries through domestication and selective breeding.
Staple Crops: Cereals like rice, wheat, maize, millet, and barley form the foundation of global food supplies. India, for example, relies heavily on rice and wheat as staples. The genetic diversity within these crops allows for the development of varieties suited to different climates, soils, and resistance to pests.
Fruits and Vegetables: A wide variety of fruits such as mango, banana, apple, and citrus, along with vegetables like tomato, brinjal, spinach, and okra, provide essential micronutrients that prevent malnutrition and deficiency diseases.
Legumes and Oilseeds: Pulses like lentils, chickpeas, and beans are rich in protein, while oilseeds such as mustard, groundnut, and sunflower provide edible oils.
Wild Plants: Many communities, especially indigenous groups, depend on wild edible plants, tubers, and herbs as supplementary food sources. These not only diversify diets but also serve as survival foods during famine or drought.
Thus, plant biodiversity contributes directly to both staple food production and nutritional diversity.
2. Animal Biodiversity as a Food Source
Animals provide protein-rich foods that are critical for human health. Animal biodiversity encompasses domesticated livestock, poultry, aquaculture species, and wild animals that contribute to diets.
Livestock and Poultry: Domesticated animals such as cattle, buffalo, goats, sheep, pigs, and poultry supply meat, milk, eggs, and dairy products. India, being one of the largest milk producers, owes this to its rich diversity of cattle and buffalo breeds.
Fisheries: Oceans, rivers, and lakes provide fish, which are vital sources of protein and omega-3 fatty acids. In India, fish such as rohu, hilsa, and catla are important components of diets in coastal and riverine communities.
Wild Animals and Insects: In many tribal and rural societies, hunting of small wild animals, collection of honey, and even consumption of edible insects form part of traditional diets. This reflects the cultural significance of animal biodiversity in food systems.
3. Biodiversity and Food Security
Biodiversity enhances food security by ensuring a range of options and reducing dependence on a few species. Genetic diversity within crops and livestock allows adaptation to changing climatic conditions, diseases, and pests. For example, drought-resistant rice or pest-resistant maize varieties are developed by utilizing genetic diversity. Similarly, traditional breeds of livestock are often more resilient to local conditions compared to exotic breeds.
4. Cultural and Nutritional Importance
Different communities and regions have food traditions deeply rooted in biodiversity. Traditional diets based on local crops, spices, and livestock not only reflect cultural heritage but also ensure balanced nutrition. For instance, the Mediterranean diet with olives and seafood or Indian cuisine with pulses and spices highlights the role of biodiversity in enriching diets.
Conclusion
Biodiversity is the foundation of the world’s food systems, providing both plant-based and animal-based nutrition. It ensures food availability, dietary diversity, and resilience against environmental stresses. By conserving crop varieties, livestock breeds, fisheries, and wild species, humanity safeguards its food security and cultural heritage. Protecting biodiversity, therefore, is not only an ecological necessity but also a critical step in ensuring that present and future generations have access to safe, nutritious, and diverse food.


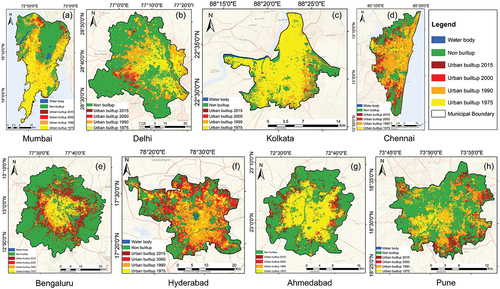


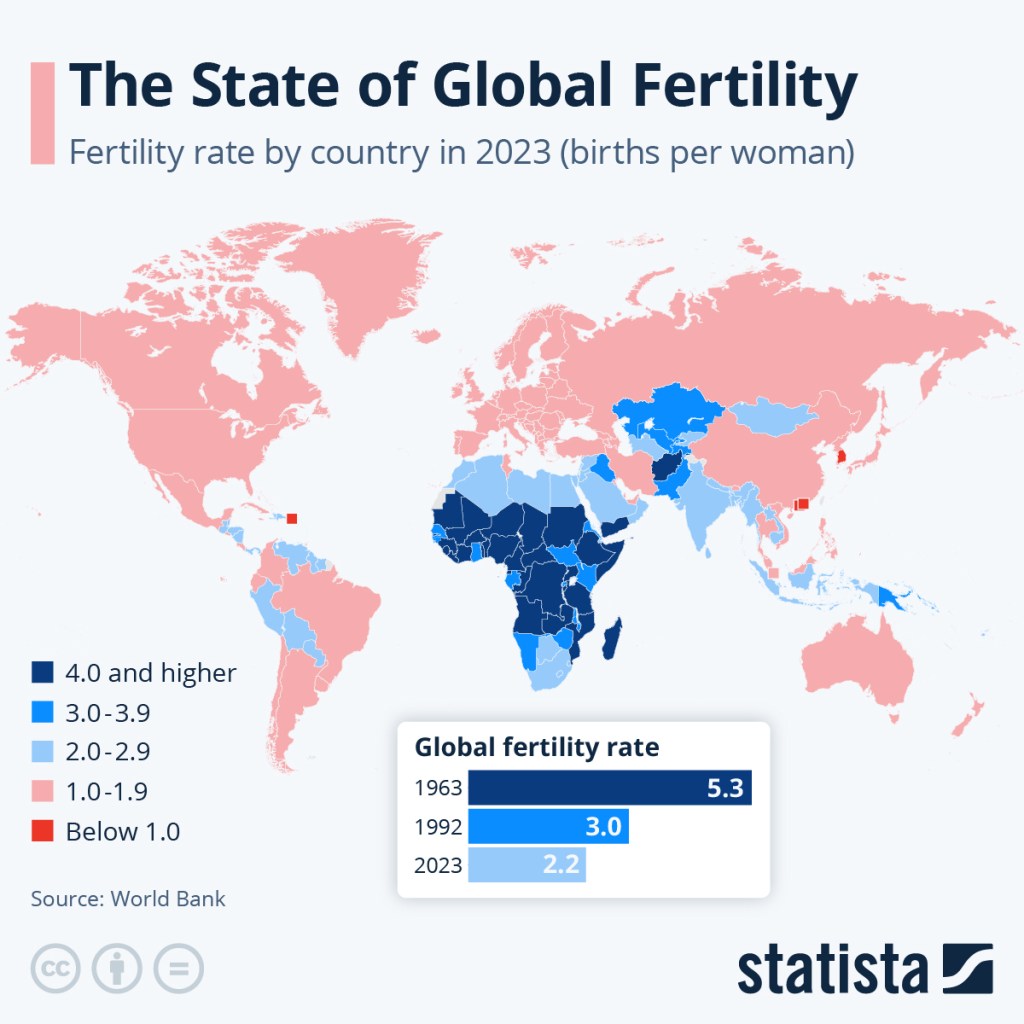

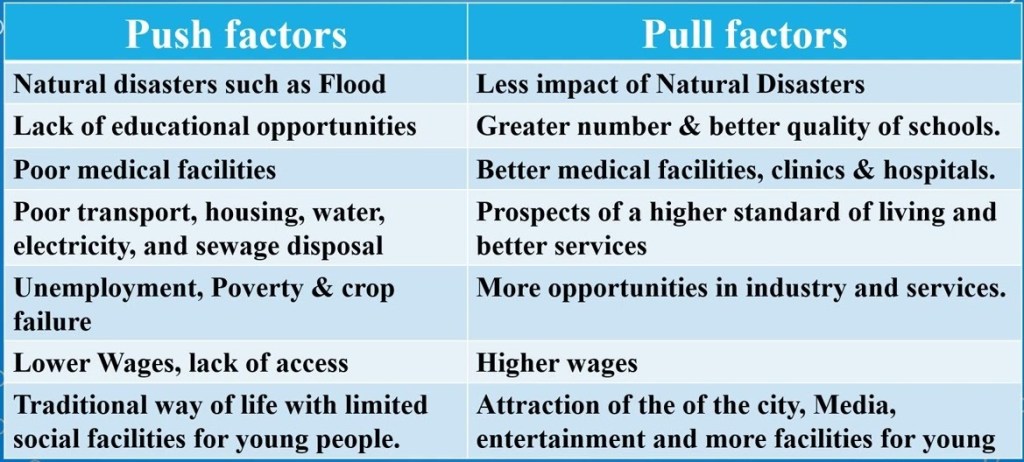
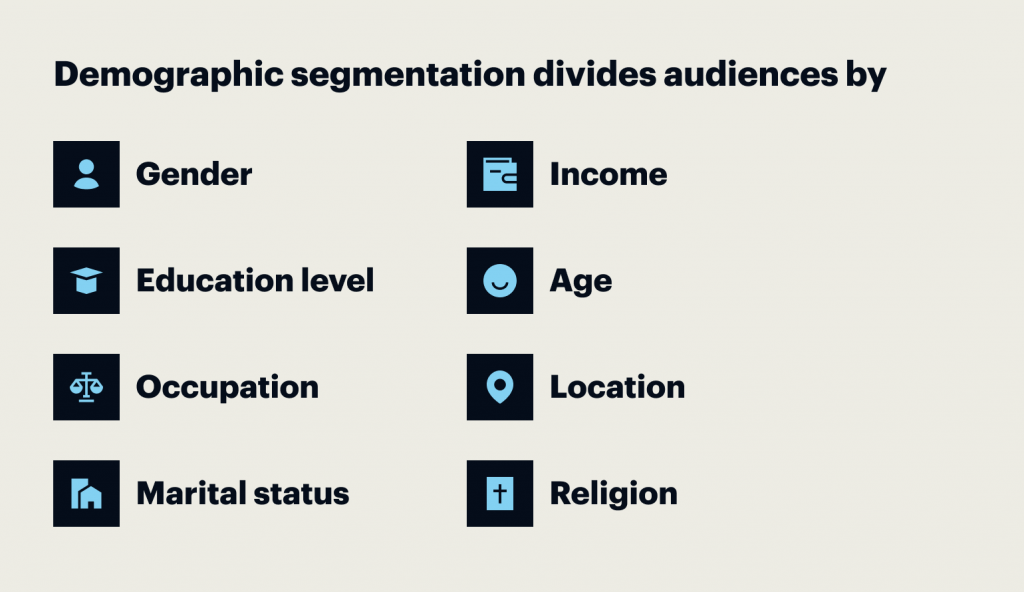


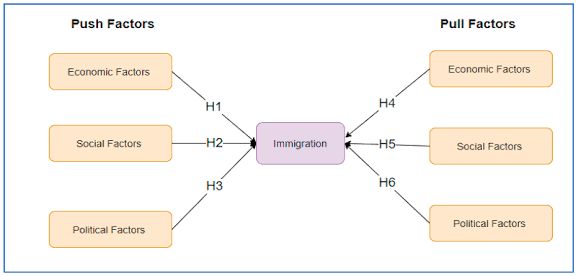


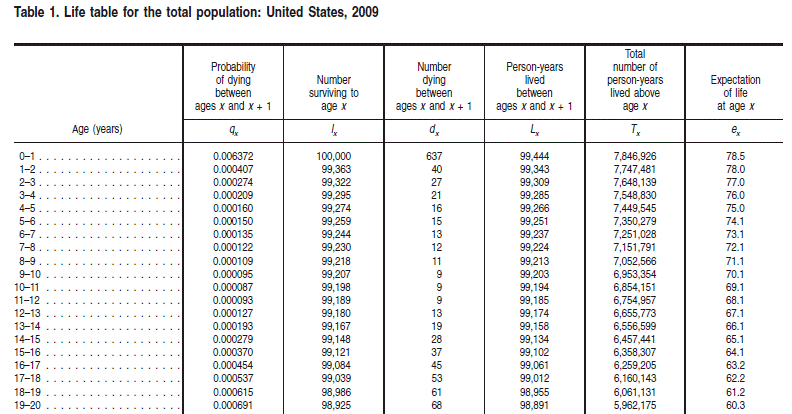

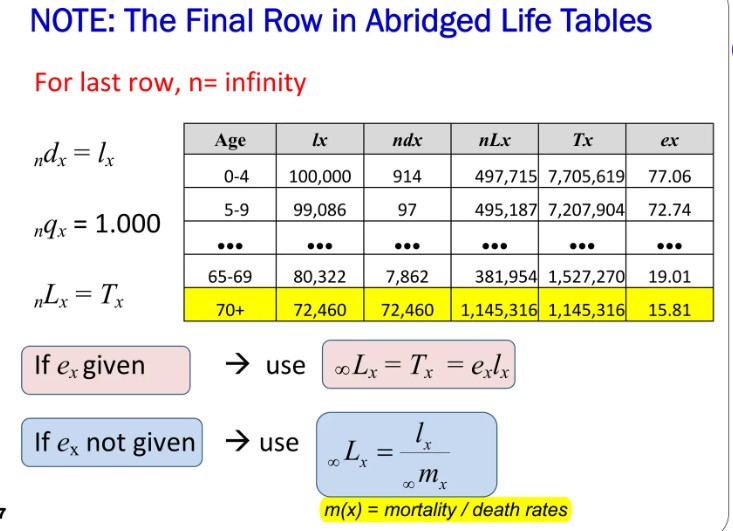


You must be logged in to post a comment.