Mortality, defined as the incidence of death within a population, is a critical indicator of public health and social well-being. Over time, mortality trends have shown a general decline globally, particularly due to advancements in medicine, sanitation, nutrition, and public health infrastructure. However, disparities persist due to a combination of biological and social determinants.
1. Biological Factors Affecting Mortality
Biological factors refer to innate or genetically influenced aspects that contribute to mortality. These include:
Genetics: Inherited conditions like sickle cell anemia, cystic fibrosis, or certain cancers influence life expectancy. Genetic predisposition can also affect how one responds to diseases or environmental hazards.
Age: Mortality rates vary significantly by age group. Infants and the elderly often have higher mortality rates due to weaker immune systems and greater vulnerability to diseases.
Sex/Gender (Biological Aspect): Biologically, women tend to live longer than men globally. This is attributed to hormonal differences (e.g., estrogen may offer some protection against heart diseases), genetic factors (e.g., two X chromosomes), and risk behavior tendencies often higher in males.
Health Conditions: Chronic conditions like hypertension, diabetes, and obesity increase the risk of premature death. Infectious diseases also remain leading causes of death in many developing countries.
2. Social Factors Influencing Mortality
Social determinants of health play a powerful role in shaping mortality patterns across populations. These include:
A. Gender and Mortality
Women typically live longer than men, but may experience more non-fatal chronic conditions. Men’s higher mortality is linked to occupational hazards, higher rates of risky behaviors (e.g., smoking, alcohol use), and lower rates of healthcare utilization.
Maternal mortality is a significant concern in many low-income countries, where inadequate healthcare access during pregnancy and childbirth remains a major issue.
Gender-based violence, discrimination, and access to education and healthcare also skew mortality rates differently for men and women in various regions.
B. Race and Ethnicity
Racial disparities in mortality are evident in many countries. For example, in the United States, Black Americans have higher mortality rates than White Americans, particularly from preventable or manageable conditions such as heart disease, cancer, and homicide.
Causes include systemic racism, historical disadvantages, economic inequality, and reduced access to quality healthcare, nutritious food, and safe living environments.
Indigenous populations across the world (e.g., Native Americans, Aboriginal Australians) often suffer higher mortality due to poverty, marginalization, and reduced access to health services.
C. Social Structure and Class
Socioeconomic status (SES) is one of the most powerful predictors of mortality. Individuals from lower-income groups face higher mortality rates due to factors like poor housing, underemployment, lack of insurance, and environmental hazards.
Education: Those with higher educational attainment often have lower mortality due to better health literacy, more stable employment, and healthier lifestyles.
Inequality in wealth distribution is associated with poorer overall public health outcomes, even in economically advanced societies.
D. Lifestyle and Behavioral Factors
Diet, physical activity, and substance use directly influence mortality. Tobacco use alone is responsible for over 8 million deaths annually worldwide. Poor diet and sedentary behavior contribute to obesity and cardiovascular disease.
Mental health: Depression, anxiety, and other disorders, if unaddressed, can lead to higher suicide rates and risky behaviors increasing mortality risk.
Health-seeking behavior: Individuals who delay or avoid medical help due to cultural, psychological, or economic reasons are at greater risk of preventable mortality.
E. Occupational Hazards
Manual labor and high-risk jobs, often held by lower-income or less educated individuals, are associated with higher mortality. Examples include construction, mining, fishing, and factory work.
Workplace stress, long working hours, exposure to hazardous materials, and lack of health insurance all exacerbate mortality risks.
The COVID-19 pandemic also highlighted occupational disparities—essential workers (often from minority and lower-income backgrounds) faced greater exposure and mortality risk.
F. Social Status and Marginalization
Social capital—the strength of social networks and community ties—can impact health outcomes. Isolation and lack of support are linked to higher mortality, especially among the elderly.
Discrimination and stigma—based on gender identity, sexual orientation, caste, religion, or immigration status—can lead to chronic stress and reduced access to healthcare, ultimately increasing mortality.
Conclusion: Intersecting Factors and Policy Implications
Mortality is not merely a biological inevitability but is deeply shaped by intersecting social, economic, and environmental conditions. Understanding mortality trends through a multifactorial lens helps:
Governments prioritize investments in public health, sanitation, and education.
Healthcare systems target interventions toward vulnerable groups.
Researchers design equitable health policies and interventions.
Communities advocate for structural reforms to reduce health disparities.
Reducing mortality disparities requires a holistic approach—one that integrates biomedical interventions with social justice, economic reform, and inclusive policy frameworks.
Thomas Robert Malthus (1766–1834) was an English cleric, scholar, and economist known for his influential theories on population dynamics. His work “An Essay on the Principle of Population” (1798) laid the foundation for demographic studies and influenced generations of economists, policymakers, and scientists. Malthus proposed that population growth, if left unchecked, would inevitably outstrip food production, leading to famine, disease, and societal collapse. This essay explores Malthus’s principles of population, the stages of population growth, and examines them with suitable justifications and examples from history and contemporary society.
Malthusian Principles of Population
Malthus’s population theory revolves around two key principles:
Population Grows Geometrically (Exponential Growth) According to Malthus, human populations tend to grow in a geometric progression (i.e., 1, 2, 4, 8, 16…), doubling every 25 years if unchecked. This rapid growth, he argued, is driven by humans’ natural reproductive tendencies.
Food Supply Grows Arithmetically (Linear Growth) In contrast, Malthus believed that agricultural production increases only in an arithmetic progression (i.e., 1, 2, 3, 4, 5…), limited by land availability, soil fertility, and technological constraints. Therefore, food production cannot keep up with population growth over time.
From this imbalance, he concluded that population growth would eventually surpass the means of subsistence unless checked by “positive” and “preventive” checks.
Malthusian Checks on Population
Malthus identified two types of checks to control population growth:
Preventive Checks – These are voluntary measures to limit reproduction, including:
Moral restraint (delaying marriage, celibacy)
Birth control (although not explicitly supported by Malthus)
Societal norms limiting family size
Positive Checks – These are natural consequences that increase the death rate:
Famine
Disease (e.g., plague, cholera)
War
Natural disasters
These checks are nature’s way of restoring the balance between population and resources when preventive measures fail.
Criticism and Relevance of Malthusian Theory
Although revolutionary, Malthus’s theory was criticized for being too pessimistic and for underestimating human innovation. Critics, particularly during and after the Industrial Revolution, pointed out that technological advancements in agriculture (e.g., mechanization, fertilizers, GMOs) have allowed food production to keep pace with or even exceed population growth.
Yet, Malthus’s ideas remain relevant in specific contexts:
In Sub-Saharan Africa, many countries still face challenges like food insecurity and high fertility rates.
The Rwanda genocide (1994) is often cited as a tragic example where high population density, land scarcity, and poverty contributed to conflict.
The concept of “carrying capacity” in environmental science, often linked to Malthusian ideas, is used to evaluate the sustainable limits of ecosystems.
Stages of Population Growth: The Demographic Transition Model (DTM)
Although Malthus did not describe population change in stages, modern demography interprets his insights within the Demographic Transition Model (DTM). The DTM outlines five stages of population growth, reflecting changes in birth and death rates over time.
Stage 1: High Stationary Stage
High birth rate and high death rate result in slow population growth.
Pre-industrial societies with poor healthcare, sanitation, and food security.
Example: Medieval Europe, tribal communities in pre-modern Africa or South America.
Justification: High mortality from diseases, famines, and wars limits population expansion.
Stage 2: Early Expanding Stage
High birth rate remains, but death rate declines due to improvements in health, hygiene, and food availability.
Leads to population explosion.
Example: Many African countries today (e.g., Niger, Democratic Republic of Congo).
Justification: Access to vaccinations, clean water, and better nutrition reduces infant mortality, but cultural norms still favor large families.
Stage 3: Late Expanding Stage
Birth rates begin to fall, while death rates continue to decline, slowing population growth.
Transition toward urbanization and industrialization.
Example: India, Egypt, and parts of Southeast Asia.
Justification: Increased education, especially for women, access to contraception, and changes in societal values lead to smaller families.
Stage 4: Low Stationary Stage
Low birth and death rates stabilize the population.
Seen in highly industrialized nations.
Example: United States, United Kingdom, Australia.
Justification: Better living standards, high cost of child-rearing, and career prioritization lead to low fertility rates.
Stage 5: Declining Stage (Optional/Controversial)
Birth rate falls below death rate, leading to population decline.
Aging populations and shrinking workforce become major concerns.
Example: Japan, Germany, South Korea.
Justification: High levels of urbanization, economic pressures, and lifestyle preferences result in fewer children.
Contemporary Relevance and Neo-Malthusianism
While classical Malthusian predictions did not fully materialize, the Neo-Malthusian school emerged in the 20th century, stressing concerns about overpopulation and environmental degradation. The Club of Rome’s “Limits to Growth” (1972) echoed Malthusian themes, warning about finite resources and ecological collapse.
Today, global challenges such as:
Climate change
Water scarcity
Urban overcrowding
Food insecurity in conflict zones
…have revived interest in Malthusian thinking, especially in policymaking, urban planning, and sustainability discourse.
Conclusion
Thomas Malthus’s population theory, though developed over two centuries ago, continues to influence how we understand demographic dynamics and resource management. His core idea—that unchecked population growth has limits—remains a foundational concern in today’s globalized world. While technological advancement has postponed the crises Malthus envisioned, uneven development and ecological limits reinforce the importance of balancing population growth with sustainable resource use. The Demographic Transition Model helps contextualize his theory across different stages of development, reminding us that demographic change is not only inevitable but also manageable through informed policy, education, and innovation.
References
Malthus, T. R. (1798). An Essay on the Principle of Population.
UN Department of Economic and Social Affairs, Population Division (2024).
World Bank. (2023). Fertility Rate and Demographic Indicators.
Dehalwar, K., & Sharma, S. N. (2023). Fundamentals of research writing and uses of research methodologies. Edupedia Publications Pvt Ltd.
Dehalwar, K., & Sharma, S. N. (2024). Social Injustice Inflicted by Spatial Changes in Vernacular Settings: An Analysis of Published Literature.
Dehalwar, K. (2015). Basics of environment sustainability and environmental impact assessment. Edupedia Publications Pvt Ltd.
Dehalwar, K., & Sharma, S. N. (2023). Fundamentals of Area Appreciation and Space Perceptions.
Sharma, S. N., & Dehalwar, K. (2023). Fundamentals of Planning and Design of Housing.
Embarking on a PhD is much more than a research endeavor—it’s an emotional and intellectual expedition. The journey is not a straight line but a progression through different zones that shape your development as a scholar. Understanding these zones—Comfort, Fear, Learning, and Growth—can help you reflect, adapt, and thrive. Let’s explore each one and how to navigate them.
1. The Comfort Zone: Where Everything Feels Safe but Stagnant
At the beginning of your PhD—or even during the long, quiet research phases—it’s easy to settle into the comfort zone. This is the space of familiarity, predictability, and low risk.
Here, you do what you know:
You read the same familiar authors.
You engage with ideas that don’t challenge you.
You hesitate to speak up in seminars or share your work.
This zone feels safe, but it’s deceptive. Staying too long here can lead to intellectual stagnation and a false sense of progress. You might feel “busy,” but you’re not necessarily growing.
Signs you’re stuck:
You avoid presenting your work.
You rarely ask questions in research meetings.
You haven’t written or submitted anything new.
You’re not pushing your intellectual boundaries.
How to break out: Take small steps:
Attend a journal club.
Present just one slide in a research seminar.
Read something outside your primary topic.
Engage in a new conversation that challenges your assumptions.
Stretching your comfort zone incrementally is the key to unlocking progress.
2. The Fear Zone: When Self-Doubt Takes the Lead
Almost every PhD student enters the fear zone at some point. This is the stage where anxiety, uncertainty, and imposter syndrome creep in.
You begin to question:
“Is my idea good enough?”
“Will I be rejected?”
“Am I behind compared to others?”
You might endlessly revise a paper not because it’s not ready—but because you’re not ready. You delay submissions. You shy away from your supervisor. The what ifs become louder than your goals.
Signs you’re in the fear zone:
You revise endlessly but never submit.
You compare yourself constantly to others.
You avoid discussing your work.
You assume you’re not good enough.
How to move forward:
Submit anyway. Feedback is part of the process.
Share your fears with peers or supervisors—you’ll realize they’re common.
Accept that fear signals care—it means your work matters to you.
Don’t let fear paralyze you. Let it push you toward the learning that follows.
3. The Learning Zone: Where Real Progress Begins
If comfort is stillness and fear is hesitation, the learning zone is momentum. This is where your PhD starts to take form—not just in output, but in confidence.
Here’s what changes:
You submit papers—some are accepted, others aren’t.
You attend conferences not just to listen, but to present.
You try new tools (like R, Zotero, or NVivo) to refine your work.
You explore collaborations across departments or even countries.
You begin to see research as a journey. You seek feedback instead of fearing it. You’re not perfect, but you’re productive.
Signs you’re in the learning zone:
You attend and present at academic events.
You explore new methods or technologies.
You maintain a pipeline of papers at various stages.
You talk with researchers beyond your department.
How to stay here:
Be consistent, not perfect.
Track progress: one small win each week adds up.
Reflect: What did I learn this month? Who did I learn it from?
The learning zone isn’t about having all the answers—it’s about being curious enough to keep asking questions.
4. The Growth Zone: Where Research Becomes Impact
This is where your PhD transforms from personal development to public contribution. In the growth zone, your work has purpose beyond the thesis.
You start connecting your research to real-world challenges. Whether it’s policy, society, or industry—you now see your research as a piece of a larger puzzle.
You publish not just to graduate, but to inform. You apply for grants. You mentor juniors. You’re invited to speak, review, or teach. Feedback is no longer threatening—it’s a valuable tool.
Signs you’re in the growth zone:
Your work addresses real-world or interdisciplinary issues.
You publish in respected journals.
You collaborate with industry or global teams.
You contribute to grant proposals or research policy.
You’re invited to review or speak.
How to stay here:
Stay purpose-driven, not output-obsessed.
Keep learning—but also keep teaching.
Don’t forget your why. Let it guide your next steps.
You might not live in the growth zone every day—but once you’ve been here, you’ll know what you’re striving for.
Final Thoughts: All Zones Are Natural
It’s important to remember: you’ll pass through all these zones—sometimes more than once. You are not failing if you’re in the comfort zone. You are not weak if you’re struggling in fear.
What matters is that you don’t get stuck.
The PhD journey is less about perfection and more about progress.
So here’s the simplest goal:
Move. Learn. Grow.
Pause today and ask yourself:
Where am I right now?
What’s one small step I can take this week?
Every slide presented, every draft submitted, every conversation initiated—it all counts. Your growth is happening, even when you don’t see it.
Stay honest. Stay brave. Keep moving forward.
Your PhD is not just a degree—it’s your transformation.
References
Gould, J. (2015). How to build a better PhD. Nature, 528(7580), 22.
Bunton, D. (2005). The structure of PhD conclusion chapters. Journal of English for academic purposes, 4(3), 207-224.
Dehalwar, K. (2015). Basics of environment sustainability and environmental impact assessment. Edupedia Publications Pvt Ltd.
Dehalwar, K., & Sharma, S. N. (2023). Fundamentals of research writing and uses of research methodologies. Edupedia Publications Pvt Ltd.
Hockey, J. (1991). The social science PhD: A literature review. Studies in Higher Education, 16(3), 319-332.
Kumar, G., Vyas, S., Sharma, S. N., & Dehalwar, K. (2025). Urban growth prediction using CA-ANN model and spatial analysis for planning policy in Indore city, India. GeoJournal, 90(3), 139.
Sharma, S. N., & Dehalwar, K. (2023). Fundamentals of Planning and Design of Housing.
Sharma, S. N., & Dehalwar, K. (2025). A Systematic Literature Review of Transit-Oriented Development to Assess Its Role in Economic Development of City. Transportation in Developing Economies, 11(2), 23.
Sharma, S. N., Singh, S., Kumar, G., Pandey, A. K., & Dehalwar, K. (2025, June). Role of Green Buildings in Creating Sustainable Neighbourhoods. In IOP Conference Series: Earth and Environmental Science (Vol. 1519, No. 1, p. 012018). IOP Publishing.
Sharma, S. N., & Dehalwar, K. (2025). Assessing the Transit-Oriented Development and Travel Behavior of the Residents in Developing Countries: A Case of Delhi, India. Journal of Urban Planning and Development, 151(3), 05025018.
Sharma, S. N., Singh, D., & Dehalwar, K. (2024). Surrogate safety analysis-leveraging advanced technologies for safer roads. Suranaree Journal of Science and Technology, 31(4), 010320.
Van Rooij, E., Fokkens-Bruinsma, M., & Jansen, E. (2021). Factors that influence PhD candidates’ success: the importance of PhD project characteristics. Studies in Continuing Education, 43(1), 48-67.
Traditional four‑step models aggregate trips and treat demand as static, making them ill‑suited for today’s dynamic mobility landscape. Activity‑based approaches overcome these limits by simulating what people actually do—their daily activity programmes—and deriving the travel those activities generate. One of the earliest and most influential of these systems is ALBATROSS – A Learning‑Based Transportation Oriented Simulation System, developed at Eindhoven University of Technology for the Dutch Ministry of Transport at the turn of the century. Over 25 years the platform has matured from a proof‑of‑concept scheduler into a multi‑day, multi‑agent laboratory used for policy design across Europe and beyond. journals.sagepub.comjournals.sagepub.com
2 Conceptual Foundations
ALBATROSS is rule‑based rather than utility‑maximising. The system first mines activity‑diary data with the CHAID decision‑tree algorithm, extracting a hierarchy of “if‑then” rules (e.g., if female, full‑time worker, weekday → schedule work between 08:00–16:30). During simulation each synthetic agent consults this rule base when deciding
Whether to perform an activity,
Where to do it,
With whom,
When and for how long, and
Which mode/route to use.
Logical, spatial, temporal and institutional constraints (e.g., shop opening hours, maximum travel time budgets) are enforced by a dedicated repair agent that reschedules infeasible programmes until a coherent 24‑h agenda emerges. The micro‑simulation then translates the agenda into time‑stamped trips, producing OD matrices, route flows and emissions inventories that can feed meso‑ or microsimulation assignment models. journals.sagepub.com
Rule‑base extracted from Dutch National Travel Survey; single‑day forecasts; validation on Eindhoven region. journals.sagepub.com
Transferability Tests (2002)
Rules trained in one town applied to two others; 75–90 % accuracy in activity participation & timing, demonstrating spatial transferability. journals.sagepub.com
FEATHERS Integration (~2008)
Scheduler embedded in Flemish FEATHERS framework; added population synthesis, assignment and emission calculators for policy analysis in Belgium. mdpi.com
Scenario Engine (2012)
Used to explore ageing‑population scenarios, adjusting life‑cycle parameters and leisure propensities. link.springer.com
ALBATROSS IV (2018)
Multiday horizon; life‑trajectory events, weather sensitivity, EV choice, car‑sharing, MaaS, energy modules, parallel computing (40× faster). trid.trb.org
2020‑24 Extensions
Real‑time calibration with smartphone GPS, synthetic social networks, API hooks for dynamic traffic assignment and digital‑twin dashboards (ongoing PhD and Horizon Europe projects). intechopen.com
5 Applications in Travel Prediction
5.1 Urban Pricing & Demand‑Management
Dutch metropolitan authorities employ ALBATROSS to test cordon tolls, parking pricing and speed‑limit schemes. Simulations capture peak‑spreading and inter‑modal shifts more realistically than four‑stage models because agents can re‑time or chain activities.
5.2 Infrastructure & Service Planning
By feeding ALBATROSS output OD matrices into dynamic assignment models (e.g., PTV Visum, Aimsun), planners evaluate queue‑lengths and unreliability on future corridors, supporting phased rail upgrades and BRT projects.
5.3 Socio‑Demographic Scenarios
The ageing‑population study showed that postponing retirement age by five years increases AM peak trips by only 2 % but raises midday leisure travel 15 %, demanding off‑peak service adjustments rather than additional peak capacity. link.springer.com
5.4 New Mobility Services
ALBATROSS IV embeds choice sets for car‑sharing, demand‑responsive transit and Mobility‑as‑a‑Service bundles. Policy labs in Utrecht and Antwerp evaluate subscription tariffs and station‑based EV fleets, projecting up to 8 % private‑car VKT reduction under high adoption. trid.trb.org
5.5 Energy & Emissions Accounting
The integrated fuel‑and‑emission ledger combined with activity diaries produces hourly emission profiles, enabling low‑emission‑zone design and benchmarking against EU Fit‑for‑55 targets.
5.6 Transferability to Emerging Contexts
While most case studies are European, the rule‑based architecture is data‑agnostic. Pilot calibrations using Delhi’s 2018 household survey demonstrate that 60 % of rules remain valid after re‑estimation of only time‑window parameters—promising for quick deployment in TOD influence zones such as Mukundpur or Dwarka.
6 Validation & Performance
Activity participation: Mean Absolute Error (MAE) ≈ 3 % by activity purpose.
Start‑time distributions: Kolmogorov‑Smirnov D ≤ 0.08 across three Dutch cities.
Mode splits: Within ±4 % of observed for work, education, shopping.
Rule logic may “lock‑in” past behaviour; limited behavioural dynamics without re‑training
Fast microsimulation—suitable for scenario sweeps
Less grounded in micro‑economic theory than utility‑based models
Modular—can slot into land‑use, energy, emissions pipelines
Constraint repair can fail under extreme counterfactuals, needing manual tuning
8 Future Research Directions
Hybrid ML + Rule Systems: Use gradient‑boosted trees or graph neural nets to update rule probabilities on streaming data.
Real‑time Digital Twins: Fuse ALBATROSS with mobile‑phone OD inference for 15‑minute rolling forecasts of transit loads.
Equity‑Aware Modules: Embed gender‑, income‑ and accessibility‑explicit welfare indicators to align with SDG 11.
Integration with Dynamic Traffic Assignment (DTA): Tight coupling to day‑to‑day traffic flow signals to study shock propagation (e.g., metro shutdowns, extreme weather).
Deployment in Global South: Rapid calibration toolkits and open‑source rule libraries to help cities like Delhi, Jakarta and Lagos leapfrog from four‑stage models to activity‑based analytics.
9 Conclusion
ALBATROSS pioneered rule‑based activity scheduling and remains a versatile engine for travel prediction. Its data‑driven rule hierarchies offer transparency and computational efficiency, while successive versions have incorporated multiday dynamics, new mobility options and environmental accounting. Real‑world applications—from Dutch toll pilots to Belgian EV scenarios—show that ALBATROSS can reproduce complex behavioural responses and guide evidence‑based transport policy. As richer data streams and real‑time digital twins become mainstream, ALBATROSS’s modular design positions it well to remain at the heart of next‑generation travel‑prediction ecosystems—helping planners shape sustainable, equitable and resilient mobility futures.
References
Application of Albatross for Scenario Development: Future Travel Behavior in an Ageing Population. (2012). In T. Arentze & H. Timmermans, Springer Geography (pp. 147–171). Springer Netherlands. https://doi.org/10.1007/978-94-007-2518-8_8
Arentze, T., Hofman, F., Van Mourik, H., & Timmermans, H. (2000). ALBATROSS: Multiagent, Rule-Based Model of Activity Pattern Decisions. Transportation Research Record: Journal of the Transportation Research Board, 1706(1), 136–144. https://doi.org/10.3141/1706-16
Arentze, T., Hofman, F., Van Mourik, H., & Timmermans, H. (2002). Spatial Transferability of the Albatross Model System: Empirical Evidence from Two Case Studies. Transportation Research Record: Journal of the Transportation Research Board, 1805(1), 1–7. https://doi.org/10.3141/1805-01
Recent Progress in Activity-Based Travel Demand Modeling: Rising Data and Applicability. (2021). In A. Tajaddini, G. Rose, K. M. Kockelman, & H. L. Vu, Models and Technologies for Smart, Sustainable and Safe Transportation Systems. IntechOpen. https://doi.org/10.5772/intechopen.93827
Sharma, S. N., & Dehalwar, K. (2025). Assessing the Transit-Oriented Development and Travel Behavior of the Residents in Developing Countries: A Case of Delhi, India. Journal of Urban Planning and Development, 151(3), 05025018. https://doi.org/10.1061/JUPDDM.UPENG-5468
Sharma, S. N., Kumar, A., & Dehalwar, K. (2024). The Precursors of Transit-oriented Development. Economic & Political Weekly, 59(14), 16–20. https://doi.org/10.5281/zenodo.10939448
Citing research papers is a fundamental part of academic writing. Whether you are writing a term paper, thesis, dissertation, journal article, or conference paper, proper citation ensures your work is credible, ethical, and built upon established knowledge. Failure to cite sources appropriately can lead to accusations of plagiarism and academic dishonesty. This article provides a comprehensive guide on how to cite a research paper correctly, with examples, citation styles, tips, and tools.
1. Why Citation Matters
Citing a research paper serves several important purposes:
Acknowledgment: It gives credit to the original author(s) for their work and ideas.
Transparency: It allows readers to trace the origin of facts, arguments, or data.
Support: It strengthens your arguments by backing them with scholarly evidence.
Citing is not just about formality; it’s about engaging in a scholarly conversation with the research community.
2. When to Cite
You should cite a research paper (or any source) in your own paper when:
You quote directly from another source.
You paraphrase or summarize someone else’s ideas.
You use data, figures, or tables from other research.
You refer to findings, theories, or arguments proposed in a previous study.
You want to critique, compare, or contrast previous literature.
However, common knowledge (e.g., “The Earth revolves around the sun”) does not need citation.
3. Choosing the Right Citation Style
Different disciplines use different citation styles. The most commonly used styles include:
APA (American Psychological Association): Used in social sciences, education, and psychology.
MLA (Modern Language Association): Used in literature, humanities, and arts.
Chicago/Turabian: Used in history, fine arts, and some social sciences.
IEEE (Institute of Electrical and Electronics Engineers): Used in engineering and computer science.
Harvard Style: Common in many fields in UK and Commonwealth countries.
Check your journal’s or institution’s guidelines before starting. Each style has its own format for in-text citations and references.
4. In-Text Citation: How to Cite Within the Body
Citations in the body of your paper are known as in-text citations. Their purpose is to briefly identify the source of the information and link it to a more detailed reference at the end of the paper.
a. APA Style (Author-Date)
Example: Urban heat islands significantly affect city temperatures (Oke, 1982).
b. MLA Style (Author-Page)
Example: “The city breathes differently in summer” (Oke 45).
c. Chicago Style (Footnote)
Example: The phenomenon of urban heat islands is well-documented.¹ ¹Timothy R. Oke, Boundary Layer Climates (London: Routledge, 1982), 45.
d. IEEE Style (Numbered)
Example: As shown in previous studies [1], temperature anomalies are common in urban cores.
Paraphrased content still needs citation—even if the wording is your own.
5. Reference List or Bibliography
This section comes at the end of your paper and provides complete details of each source cited in the text. The format depends on the citation style.
a. APA Style
Oke, T. R. (1982). Boundary Layer Climates. Routledge.
b. MLA Style
Oke, Timothy R. Boundary Layer Climates. Routledge, 1982.
c. Chicago Style
Oke, Timothy R. Boundary Layer Climates. London: Routledge, 1982.
d. IEEE Style
[1] T. R. Oke, Boundary Layer Climates, London: Routledge, 1982.
Ensure consistency throughout the paper. Every in-text citation must match a reference entry.
6. Citing Online Research Papers
Online research papers—whether open-access or behind paywalls—must be cited with attention to the source URL or DOI.
MLA: Srivastava, Amit. “Smart Mobility in Indian Cities.” Journal of Urban Studies, vol. 25, no. 3, 2023, pp. 45–58. doi:10.1234/jus.2023.00321.
If no DOI is available, include the full URL and the access date if required.
7. Quoting, Paraphrasing, and Summarizing
a. Quoting
Use the exact words from the source within quotation marks.
“The smart city concept remains vaguely defined” (Mehta, 2020, p. 112).
b. Paraphrasing
Rewriting the original idea in your own words.
Mehta (2020) notes that there is no universally accepted definition of the smart city model.
c. Summarizing
Condensing the main idea of a larger section or paper.
Recent literature outlines multiple challenges in operationalising the smart city framework (Mehta, 2020).
Avoid overusing direct quotes—paraphrasing shows your understanding and is preferred in most academic contexts.
8. Avoiding Common Mistakes
Do not mix citation styles. Choose one and follow it consistently.
Always cite the original source rather than citing another author’s mention of it (unless you’re citing a secondary source explicitly).
Be careful with auto-generated citations—double-check them for accuracy.
Avoid citing too few or too many papers. Strike a balance between showing your literature awareness and making an original contribution.
9. Using Citation Management Tools
There are many tools to help you organize and generate citations:
Zotero (Free and open-source; great for browser capture and Word integration)
Mendeley (Popular among STEM fields)
EndNote (Commercial but powerful; widely used in academia)
CiteThisForMe and EasyBib (Online tools for quick citation generation)
Google Scholar (Provides citation formats in multiple styles—click the “cite” icon under each result)
These tools can save time, especially when dealing with large numbers of references, and reduce human error.
10. Final Tips for Ethical and Effective Citation
Stay organized: Start collecting citations while reviewing literature.
Take notes: Write down the context in which you plan to use each paper.
Use a citation tracker: Keep a spreadsheet or use software to track what you’ve cited and where.
Follow journal guidelines: Each publisher may have unique formatting rules.
Lastly, always err on the side of over-citing rather than under-citing. It shows respect for intellectual property and safeguards your work from plagiarism.
Conclusion
Citing research papers while writing your own paper is an essential skill that reflects your academic integrity, diligence, and respect for scholarship. It ensures that your contributions are contextualized within the broader body of knowledge, and that your readers can follow your intellectual journey. By understanding when and how to cite, choosing the correct style, and using helpful tools, you can produce clear, ethical, and well-structured academic writing.
Let your citations tell the story of how your research is part of a larger academic conversation—and let them empower your arguments, not just support them.
References
Dehalwar, K., & Sharma, S. N. (2023). Fundamentals of research writing and uses of research methodologies. Edupedia Publications Pvt Ltd.
Dehalwar, K., & Sharma, S. N. (2024). Politics in the Name of Women’s Reservation. Contemporary Voice of Dalit, 2455328X241262562.
Jain, S., Dehalwar, K., & Sharma, S. N. (2024). Explanation of Delphi Research Method and Expert Opinion Surveys.
Kumar, G., Vyas, S., Sharma, S. N., & Dehalwar, K. (2023). Planning and Development of Housing in Urban Fringe Area: Case of Bhopal (MP). GIS Business, 18(1), 1-14.
Sharma, S. N., Dehalwar, K., & Singh, J. (2024). Emerging techniques of solid waste management for sustainable and safe living environment. In Solid Waste Management: Advances and Trends to Tackle the SDGs (pp. 29-51). Cham: Springer Nature Switzerland.
Sharma, S. N., & Dehalwar, K. (2025). Assessing the Transit-Oriented Development and Travel Behavior of the Residents in Developing Countries: A Case of Delhi, India. Journal of Urban Planning and Development, 151(3), 05025018.
Sharma, S. N., & Dehalwar, K. (2025). A Systematic Literature Review of Transit-Oriented Development to Assess Its Role in Economic Development of City. Transportation in Developing Economies, 11(2), 1-21.
The Figure-Ground Theory is a foundational concept in urban design that helps in analyzing and understanding the relationship between built forms (figures) and the open spaces (grounds) that surround and define them. Rooted in principles of Gestalt psychology and architectural morphology, this theory provides a visual and analytical method to interpret the urban fabric by distinguishing solid mass (buildings) from voids (open spaces). It plays a crucial role in understanding spatial organization, connectivity, enclosure, and the overall quality of urban environments.
1. Origin and Conceptual Basis
The term “figure-ground” was originally used in Gestalt psychology, where it referred to the human perception of visual elements as either the object of focus (figure) or the background (ground). In urban design, this concept was adopted and developed most notably by theorists like Colin Rowe and Fred Koetter, especially in their influential work “Collage City” (1978), where they emphasized the importance of the figure-ground diagram as a tool for analyzing urban space.
In an urban context:
Figure = The built elements, such as buildings, monuments, or blocks.
Ground = The open space around and between these built forms, including streets, plazas, parks, and courtyards.
2. Purpose and Utility in Urban Design
Figure-ground theory serves multiple purposes in the practice and pedagogy of urban design:
A. Analyzing Spatial Hierarchy
The theory reveals how different types of spaces are ordered within a city — from tightly enclosed courtyards to wide open plazas. It helps in understanding:
Public vs. Private space
Dominant vs. Subordinate structures
Primary vs. Secondary networks (e.g., major streets vs. alleys)
B. Understanding Urban Morphology
Through figure-ground diagrams, designers and planners can trace the evolution of urban form, assess the compactness or sprawl of development, and evaluate density and grain (fine or coarse) of urban patterns.
C. Evaluating Connectivity and Accessibility
The layout of built forms and open spaces reveals how pedestrian and vehicular flows operate. A balanced figure-ground relationship enhances walkability, visual continuity, and social interaction, while imbalances may cause segregation, inaccessibility, or monotony.
D. Guiding Urban Design Interventions
By studying figure-ground relationships, designers can:
Identify underutilized spaces for infill or revitalization.
Propose new developments that respect or enhance existing spatial structure.
Create more legible, coherent, and meaningful urban environments.
3. Figure-Ground Diagram as a Tool
The figure-ground diagram is the primary tool used to visualize and interpret this theory. It typically involves a black-and-white map:
Black (or solid color) = Built forms (figure)
White (or negative space) = Open spaces (ground)
This simplified abstraction helps:
Strip away non-essential elements to focus purely on spatial relationships.
Compare urban blocks across different cities or historical periods.
Assess enclosure, openness, and edge conditions.
Example:
A traditional European city center (like Rome or Paris) often shows a high degree of figure-ground balance — with a dense network of built forms interspersed with well-defined open squares and streets.
A modernist development (such as Le Corbusier’s Radiant City) often shows dispersed buildings floating in open space, resulting in a lower figure-ground ratio and reduced spatial definition.
4. Applications and Implications
A. Historic Preservation and Urban Infill
Figure-ground studies can help preserve the character of historic cores by guiding sensitive infill projects that maintain the existing spatial grain and hierarchy.
B. Transit-Oriented Development (TOD)
TOD areas often require compact, connected, and mixed-use urban forms. Figure-ground theory can be used to ensure appropriate density, enclosure, and human-scale design in such developments.
C. Urban Legibility and Imageability
According to Kevin Lynch’s concepts in “The Image of the City,” figure-ground relationships contribute to how clearly people can read and navigate the city. Strong spatial definition improves the mental map of urban dwellers.
D. Sustainable and Livable Design
Well-proportioned built-to-open space ratios can influence microclimate, social interaction, safety, and walkability, all of which contribute to urban sustainability and livability.
5. Limitations and Critiques
While figure-ground theory is a powerful tool, it also has limitations:
Over-simplification: It reduces complex spatial realities to binary visuals, ignoring building heights, uses, and materials.
Contextual Blindness: It may not capture the socio-cultural dynamics, economic conditions, or lived experiences of urban space.
Static Representation: The diagrams are snapshots in time and do not reflect temporal changes, such as seasonal use or day-night variation.
To overcome these, figure-ground analysis is often supplemented with section drawings, land-use maps, 3D models, and behavioral studies.
6. Conclusion
The Figure-Ground Theory remains a core analytical framework in urban design. It distills the city into its fundamental spatial components — solids and voids — enabling planners and designers to read, compare, and shape urban form with greater clarity. Though simple in its graphic expression, it offers deep insights into the organization, legibility, and quality of urban spaces. When integrated with other design tools and socio-cultural analysis, it becomes an invaluable method for crafting cities that are both functional and humane.
References
Grossberg, S. (1994). 3-D vision and figure-ground separation by visual cortex. Perception & psychophysics, 55(1), 48-121.
Hebbert, M. (2016). Figure-ground: History and practice of a planning technique. Town Planning Review, 87(6), 705-728.
Roberts, L. D. (1986). The figure-ground model for the explanation of the determination of indexical reference. Synthese, 441-486.
Wever, E. G. (1927). Figure and ground in the visual perception of form. The American Journal of Psychology, 38(2), 194-226.
The 74th Constitutional Amendment Act, 1992 was a landmark reform in India’s urban governance landscape. It provided constitutional status to Urban Local Bodies (ULBs) like Municipal Corporations, Municipal Councils, and Nagar Panchayats, recognizing them as the third tier of government.
The 12th Schedule of the Constitution, added through this amendment, lists 18 functional items that Municipalities are responsible for. These functions ensure a decentralized, participatory, and efficient framework for urban governance.
🔰 Overview of the 18 Functions in the 12th Schedule
1. Urban Planning Including Town Planning
Urban planning involves formulating land-use policies, zoning regulations, master plans, and development control to guide the orderly growth of urban areas. ULBs play a pivotal role in preparing and implementing Development Plans and Town Planning Schemes in alignment with state-level urban policy.
2. Regulation of Land Use and Construction of Buildings
Municipalities regulate building permits, enforce development control norms, ensure adherence to zoning regulations, and prevent unauthorized constructions. This ensures planned development, safety, and optimized land use.
3. Planning for Economic and Social Development
ULBs contribute to local economic development by supporting markets, industries, and small businesses, while also implementing welfare programs in health, education, housing, and skill development to address urban poverty and inequality.
4. Roads and Bridges
Maintenance, construction, and widening of municipal roads, flyovers, footpaths, and bridges fall under the municipality’s domain. They ensure connectivity, road safety, and traffic decongestion within city limits.
5. Water Supply for Domestic, Industrial, and Commercial Purposes
Municipalities manage water sourcing, treatment, and distribution. They ensure equitable access to potable water and promote water conservation, leak management, and metering systems.
6. Public Health, Sanitation, Conservancy, and Solid Waste Management
ULBs oversee disease control, public health campaigns, sanitation drives, street cleaning, and integrated solid waste management. Effective service delivery in this function is crucial for urban hygiene and environmental health.
7. Fire Services
Fire safety is a municipal mandate, involving provision of fire stations, emergency response teams, fire-fighting infrastructure, and regulatory checks for fire compliance in buildings and public spaces.
8. Urban Forestry, Protection of the Environment, and Promotion of Ecological Aspects
Municipalities are expected to implement urban greening programs, manage green belts and biodiversity parks, and enforce environmental regulations like air and noise pollution control.
9. Safeguarding the Interests of Weaker Sections of Society Including the Handicapped and Mentally Retarded
ULBs must ensure inclusive policies that support vulnerable groups through social housing, accessible infrastructure, education, and special assistance programs.
10. Slum Improvement and Upgradation
A key function of ULBs is improving the quality of life in urban slums by providing basic services, upgrading housing, implementing in-situ redevelopment projects, and promoting livelihood opportunities.
11. Urban Poverty Alleviation
Municipalities run programs like skill development, self-employment schemes, microfinance, shelter homes, and targeted subsidies for urban poor, often under centrally or state sponsored schemes like NULM.
12. Provision of Urban Amenities and Facilities such as Parks, Gardens, Playgrounds
Recreational infrastructure like parks and playgrounds enhances urban livability. ULBs are tasked with creating and maintaining these public spaces for community health and well-being.
13. Promotion of Cultural, Educational, and Aesthetic Aspects
ULBs support the arts, preserve heritage sites, and organize cultural events. They also promote urban aesthetics through design guidelines and beautification projects.
14. Burials and Burial Grounds; Cremations, Cremation Grounds; and Electric Crematoriums
ULBs are responsible for the management of public burial and cremation facilities, including upkeep, hygiene, and promoting eco-friendly alternatives like electric crematoriums.
15. Cattle Pounds; Prevention of Cruelty to Animals
Municipalities manage cattle pounds, enforce regulations against stray animals, and work with NGOs to promote animal welfare and sterilization programs.
16. Vital Statistics Including Registration of Births and Deaths
The registration of births, deaths, and marriages is a legal function of municipalities, which also act as custodians of this crucial demographic data.
17. Public Amenities Including Street Lighting, Parking Lots, Bus Stops, and Public Conveniences
ULBs ensure the provision and maintenance of basic civic infrastructure that supports mobility and public hygiene, especially in crowded urban environments.
18. Regulation of Slaughter Houses and Tanneries
Municipalities regulate these units to ensure hygiene, compliance with environmental laws, and humane practices, along with zoning to prevent nuisance in residential areas.
🏙️ Conclusion: A Pillar of Decentralized Urban Governance
The 12th Schedule empowers Urban Local Bodies to function as effective self-governing institutions. However, success depends on financial devolution, technical capacity, and accountability mechanisms. As Indian cities face rapid urbanization, fulfilling these 18 functions through participatory and sustainable governance models is essential to build inclusive, resilient, and liveable urban futures.
References
Datta, A. (1994). Institutional aspects of urban governance in India. Indian Journal of Public Administration, 40(4), 616-632.
Idiculla, M. (2023). The Travails of Urban Planning in India: An Examination of the Planning Law Regime of Bangalore. The Chinese Journal of Comparative Law, 11(1), cxad002.
Kumbhar, S. Urban Governance in India. Constitutional Government and Democracy in India| For UG, PG & aspirants of State and Civil Service Exams| By Pearson, 311.
Kundu, D. (2020). Urbanisation in India: Towards a national urban policy framework and smart cities. Developing National Urban Policies: Ways Forward to Green and Smart Cities, 89-119.
Rao, P. S. N. Urban Decentralisation and Regional Planning in India: Negotiating State-Local Relations.
Sivaramakrishnan, K. C. (2013). Revisiting the 74th Constitutional Amendment for better metropolitan governance. Economic and Political Weekly, 86-94.
The Digital Object Identifier (DOI) system is a standardized method used for identifying and accessing digital content, especially in academic and professional publishing. A DOI provides a persistent, unique alphanumeric string that is permanently assigned to a piece of intellectual property—such as a research paper, book, thesis, dataset, or report—so it can be reliably cited and accessed online.
🔹 What is a DOI?
A DOI is a unique identifier for a digital object. It serves two main purposes:
Identification – Each DOI is unique and assigned only to one content item.
Persistent Linking – The DOI provides a permanent web link to the content, even if the content’s location (URL) changes over time.
🔹 Structure of a DOI
A DOI usually looks like this: 10.1234/abcd5678
10 is the DOI prefix, which indicates the DOI system.
1234 is the registrant code (unique to the publisher or assigning organization).
abcd5678 is the suffix, chosen by the publisher to identify a specific item.
Permanent Accessibility: Unlike URLs that can become obsolete, DOIs always redirect to the latest location of the resource.
Accurate Citation: Academic publishers, universities, and researchers use DOIs in citations to ensure content can always be accessed and verified.
Content Integrity: DOIs are part of a global infrastructure managed by trusted organizations, adding credibility to the research.
Interoperability: DOIs are used across systems (CrossRef, DataCite, ORCID, Scopus, Web of Science, etc.) for indexing, linking, and managing scholarly content.
🔹 Who Issues DOIs?
DOIs are issued by Registration Agencies (RAs) accredited by the International DOI Foundation (IDF). The two most prominent RAs are:
CrossRef – For scholarly and journal articles, books, conference proceedings, etc.
DataCite – For datasets and research data.
These agencies work with publishers and institutions who register content and assign DOIs.
🔹 Use of DOI in Citations
A research article citation using DOI may look like this:
Using DOI instead of a simple web address ensures that even if the article moves to a different website, the DOI link will still direct the reader correctly.
Increased Discoverability: Indexed in academic databases like Google Scholar, Scopus, Web of Science.
Citation Tracking: Enables tools to track how often and where your work is cited.
Research Impact: Helps build author profiles with verified publication records (ORCID integration).
Global Reach: DOIs are recognized and accessed worldwide, enhancing the visibility of the content.
Credibility: Publication with DOI is often seen as a sign of legitimacy and academic integrity.
🔹 Getting a DOI for Your Work
Authors and researchers typically get a DOI when they publish with:
Academic journals that are CrossRef members
Book publishers who assign DOIs
Institutional repositories (like university archives)
DOI services like Zenodo, Figshare, or through EduPub, Pen2Print, or IJR Journal (as you may be working with)
🔹 Examples of Platforms Using DOI
Google Scholar – indexes and links using DOIs
ORCID – links publications to authors via DOI
CrossRef Metadata Search – searches articles using DOIs
Scopus/Web of Science – bibliographic databases using DOIs for citation tracking
🔹 Final Thoughts
A DOI is more than just a digital label—it’s a critical infrastructure for ensuring trust, accessibility, and continuity in academic publishing. Whether you’re an author, publisher, or researcher, embracing the DOI system ensures your work remains citable, discoverable, and permanent in the digital academic landscape.
The Global Initiative of Academic Networks (GIAN) is a flagship scheme by the Ministry of Education, Government of India, launched in 2015‑16, with a brief pause during COVID, and now in its Phase 4indiascienceandtechnology.gov.in+15legacyias.com+15drishtiias.com+15. Here’s an in-depth breakdown:
Bridge knowledge gaps: Offer Indian students and faculty exposure to the latest global developments in niche fields, with emphasis on real-world applications and hands-on learning. aspireias.com+2drishtiias.com+2gian.iitkgp.ac.in+2
Course duration: Short-term programs—1 week (12–14 hrs) or 2 weeks (20–28 hrs), with both in-person and hybrid/virtual options. gktoday.in+5legacyias.com+5jnu.ac.in+5
Funding model: Visiting experts receive travel support + honorarium:
Implementation committees: Includes a national-level Implementation Committee headed by Secretary (HE, MoE), sectional committees categorizing topics (e.g., Physical Sciences, Management, Humanities), and a pool of reviewers. gian.iitkgp.ac.in+1aspireias.com+1
Brand ambassadors: Eminent global academics (e.g., Manjul Bhargava, Princeton) promote and enrich the scheme. gktoday.in+1gian.iitkgp.ac.in+1
📊 5. Impact & Reach
Course rollout: As of March 2025, 2,163 courses approved across India (with 1,848 completed). gian.iitkgp.ac.in
Global diversity: Visiting experts predominantly from the US (41%), followed by UK, Germany, Canada, France, Italy, Nordic countries, China, Japan, Taiwan, ASEAN, etc. drishtiias.com+1iaspoint.com+1
May 2025: A 15-day GIAN course on Sustainable Urbanism at NIT-Patna with international experts, emphasizing practical interdisciplinary training. timesofindia.indiatimes.com
📈 7. Future Expansion
Phase‑4 rollout is underway (from Dec 2023), with plans to:
Skill enrichment: Indian students and faculty gain exposure to cutting-edge, applied knowledge directly from international experts.
Collaborative research: Opens avenues for co-authored research, joint projects, and networking.
Global academic profile: Reinforces India’s position in the international academic ecosystem, building capabilities and fostering innovation.
✅ Summary Table
Aspect
Details
Launched
2015–16
Hosts
IITs, IIMs, IISc, IISERs, NITs, IIITs, select State universities
Visitors
Global scientists & entrepreneurs
Course length
1 week (12–14 hrs) or 2 weeks (24–28 hrs)
Honoraria
US$ 8k / 12k + travel & incidentals
Funding allocated
₹126 crore (~US$ 15M)
Courses approved
2,163 (1,848 completed)
Intl. experts
~41% US, rest from Europe & Asia
Phase 4
Active since late 2023
🔚 Conclusion
GIAN is a well-structured and impactful initiative, positioning India as a hub for global academic collaboration. With robust institutional frameworks, financial backing, and expanding participation from both Indian and international academics, it’s playing a key role in fostering quality education, research, and innovation.
A tagline is more than just a catchy phrase or a marketing gimmick—it’s a critical element of branding that can shape public perception, influence behavior, and enhance an organization’s identity. Whether it’s a commercial company, a non-profit organization, an educational institution, or a startup, a well-crafted tagline communicates a core message and connects with audiences on an emotional or intellectual level. In today’s competitive landscape, where attention spans are short and the noise is constant, the importance of a strong tagline cannot be overstated.
1. Defines and Reinforces Brand Identity
A tagline serves as a verbal logo—a succinct expression of the company’s mission, values, or promise. It complements the brand name and visually presented logo to complete the brand’s identity. For instance, Nike’s “Just Do It” embodies action, empowerment, and motivation. Similarly, NGOs use taglines like “Because Every Life Matters” to emphasize humanitarian values and social commitment.
A powerful tagline can answer questions like:
What does this organization stand for?
What kind of impact does it aim to create?
Why should people care?
2. Enhances Brand Recall
Taglines are designed to be memorable. A well-written tagline sticks in the minds of people long after they see or hear it. This is crucial for brand recall, especially when competing for attention in a crowded market or cause-driven space. Short, rhythmic, and emotionally resonant taglines are more likely to be remembered and repeated.
In the case of an NGO, a memorable tagline can help keep the cause alive in public consciousness, increasing the chances of engagement, volunteering, or donations.
3. Builds Emotional Connection
A tagline has the power to evoke emotions, which plays a significant role in consumer and donor decision-making. While products or services address practical needs, taglines tap into aspirations, hopes, and values. For a company, this could be about innovation, sustainability, or customer focus. For an NGO, it could be about justice, compassion, or empowerment.
By striking an emotional chord, taglines build trust and affinity, making people more likely to support, share, or advocate for the brand.
4. Differentiates from Competitors
A tagline provides a chance to highlight what makes a brand unique. In sectors where multiple entities offer similar services or advocate for similar causes, a tagline can be the differentiator. It communicates what’s distinctive about the organization in a succinct, engaging way.
For example:
For-profit: “Think Different” (Apple) separated Apple from the generic PC crowd.
Non-profit: “Be the Change” (inspired by Gandhi’s quote) invites personal responsibility and action, often used by social justice campaigns.
5. Provides Consistency in Messaging
A tagline offers a consistent anchor point for all communication efforts. It helps ensure that across advertising, social media, events, and public speeches, the core message remains aligned. This consistency builds familiarity and reinforces brand positioning over time.
For NGOs, consistent use of a tagline across campaigns and reports can build a strong narrative and help supporters instantly identify the organization and its cause.
6. Boosts Marketing and Outreach
A strong tagline is a marketer’s asset. It:
Adds power to advertising campaigns.
Helps in social media virality.
Enhances storytelling.
Increases the impact of public service announcements or product promotions.
When included on websites, banners, flyers, and digital content, taglines act as hooks that capture interest and prompt further exploration.
7. Inspires Internal Stakeholders
Taglines are not only for external audiences. Internally, a well-articulated tagline can serve as a motivational motto. Employees, volunteers, partners, and stakeholders rally around it, especially when it encapsulates the organization’s mission or vision in a meaningful way.
It can instill pride, direction, and a shared sense of purpose within teams—something particularly important for NGOs and social enterprises driven by mission rather than profit.
8. Facilitates Brand Expansion and Endurance
A timeless and versatile tagline allows a brand to grow and evolve without losing its essence. It can remain relevant even as products, services, or projects diversify. A tagline like “Connecting People” (Nokia) transcends individual products and applies broadly to the company’s evolving portfolio.
For NGOs, a broad tagline such as “Transforming Lives” can stay relevant across different programs—from education to healthcare to environmental advocacy.
Crafting an Effective Tagline
To harness all these benefits, crafting an effective tagline involves:
Clarity – Avoid jargon. Keep it simple.
Brevity – Ideally under 7 words.
Relevance – Reflect your mission, product, or impact.
Emotion – Use words that stir feeling.
Originality – Stand out from competitors.
Timelessness – Avoid trends that may fade quickly.
Conclusion
A tagline is more than a clever phrase—it is a strategic communication tool that can shape identity, inspire trust, and drive engagement. For companies, it enhances branding and customer loyalty. For NGOs, it encapsulates purpose and fuels advocacy. Whether you are launching a startup, building a global brand, or leading a grassroots movement, a compelling tagline is your chance to make a lasting first impression—and a powerful final echo.
This news update highlights the role of G20 nations in enhancing disaster risk reduction. G20 countries play a crucial role in addressing and mitigating the impact of disasters globally. Here we examines the key initiatives and strategies employed by G20 nations in disaster risk reduction, including policy frameworks, financial commitments, and collaboration mechanisms. It explores the importance of strengthening resilience, promoting early warning systems, and improving disaster preparedness and response capacities. Furthermore, the abstract emphasizes the significance of international cooperation and knowledge sharing in tackling the complex challenges posed by disasters. The aim is to provide insights and recommendations for enhancing global disaster risk reduction efforts.
The G-20 meeting, which included the Disaster Risk Reduction Working Group (DRRWG), highlighted significant opportunities for improving disaster risk reduction worldwide. Participants from various countries, including government officials, industry experts, private sector representatives, and stakeholders, gathered in Mumbai to explore innovative approaches and financing methods for sustainable development. By identifying opportunities and proposing measures, the experts aimed to minimize the impact of disasters on vulnerable communities. Given the increasing number of disasters and climate change-related risks, which result in an Annual Average Loss of $218 billion or 9% of average annual infrastructure investment, the second meeting of the DRRWG in the G-20 becomes highly significant. This meeting provides an opportunity to address the need for financing disaster risk reduction (DRR) through discussions on development finance. The topics covered include public and private financing, social protection, knowledge sharing, and international funding mechanisms for disaster response, recovery, and reconstruction.
Experts emphasized the importance of infrastructure risk assessment tools and data platforms, as well as the adoption of a ‘build back better’ approach that integrates ecosystem-based strategies and involves local communities. The meeting also tackled other important agendas, such as establishing national frameworks, incentivizing private investments, and supporting disaster preparedness, all contributing to the creation of a more resilient future. Comprehensive Risk Assessment is needed for conducting thorough risk assessments that encompass various hazards, vulnerabilities, and exposure levels are essential. This scientific approach helps identify high-risk areas and informs targeted mitigation efforts. Developing and implementing reliable early warning systems enables timely and effective response to potential disasters. These systems should be based on scientific data and advanced technologies to provide accurate and timely alerts to at-risk communities. Recognizing the impact of climate change on disaster risks, integrating climate change adaptation measures into disaster risk reduction strategies is crucial. This involves assessing climate-related risks, implementing adaptive measures, and promoting resilient infrastructure. Recognizing the role of ecosystems in reducing disaster risks, adopting ecosystem-based approaches is essential. Preserving and restoring natural ecosystems such as wetlands, mangroves, and forests can provide natural barriers and buffer against hazards. Implementing and enforcing robust building codes based on scientific knowledge and engineering standards is vital. This includes incorporating measures to enhance structural integrity, seismic resistance, and other relevant factors to minimize the vulnerability of buildings and infrastructure. There is urgent need for promoting scientific knowledge and awareness among the public about disaster risks, preparedness, and response measures is crucial. Effective communication strategies and educational programs can empower communities to make informed decisions and take appropriate actions. Government should focus on encouraging scientific research and development in the field of disaster risk reduction helps generate new knowledge, innovative solutions, and evidence-based practices. This includes funding research initiatives and promoting collaboration among academia, practitioners, and policymakers.
There is need to foster collaboration among governments, international organizations, civil society, academia, and the private sector. Engaging various stakeholders with scientific expertise and diverse perspectives can lead to more effective and sustainable disaster risk reduction measures. Government should promote the sharing of scientific data, information, and best practices across borders and institutions. Open access to relevant data and research findings allows for better understanding, analysis, and informed decision-making in disaster risk reduction. There is need for strengthening scientific and technical capacities at local, national, and regional levels is essential for implementing enhanced disaster risk reduction measures. This includes providing training, resources, and expertise to enable effective risk management and response capabilities within communities and institutions.
In conclusion, adopting enhanced disaster risk reduction measures in a scientific manner is crucial for building resilient communities and mitigating the impacts of disasters. By implementing comprehensive risk assessments, developing early warning systems, integrating climate change adaptation, incorporating ecosystem-based approaches, strengthening building codes, and promoting public awareness, we can make significant progress in reducing disaster risks. Furthermore, investing in research and development, fostering multi-stakeholder collaboration, promoting data sharing and open access, and focusing on capacity building are essential for advancing our understanding of disasters and implementing effective solutions. It is through the application of scientific knowledge, innovation, and collaboration that we can create a safer and more resilient future. By embracing these measures and approaches, we can minimize the devastating impacts of disasters, protect vulnerable communities, and promote sustainable development. Together, let us work towards a world where disaster risk reduction is prioritized and implemented in a scientifically sound manner, ensuring the well-being and safety of present and future generations.
References
Bose, S., & Nanthini, S. (2023). Multilateralism and Disaster Management in the Global South: A Case Study for the G20. Observer Research Foundation, 20.
Dehalwar, K., & Singh, J. (2015). Current State of Water Management System: Case Review of Bhopal, Madhya Pradesh. International Journal of Civil, Structural, Environmental and Infrastructure Engineering Research and Development (IJCSEIERD), 5(6), 35-40.
Mehraj, T., & Khaki, N. Climate Change and Disaster Risk Reduction: Role of G20 in Making Sustainable Lifestyle. Youth Participation in Disaster Risk Management and Climate Change Adaptation, 153.
Roy, L. (2024). Role of G20 in attaining sustainable development goals: a review. Edumania-An International Multidisciplinary Journal, 2(1), 60-76.
Shaw, R., & Kishore, K. (2023). Disaster risk reduction and G20: A major step forward. Progress in Disaster Science, 17, 100274.
Eco-tourism is a form of responsible travel that emphasizes exploring natural environments while minimizing negative impacts on the environment and supporting local communities. Chopta, located in the Rudraprayag district of Uttarakhand, India, is a popular destination for eco-tourism due to its beautiful landscapes and snow-capped Himalayan peaks. This mini-Switzerland of India offers a range of eco-tourism activities, including trekking, bird watching, camping, and nature walks, which provide visitors with opportunities to appreciate the natural beauty of the region while supporting local communities and conservation efforts. This abstract highlights the benefits of eco-tourism in Chopta, which include promoting sustainable development, creating economic opportunities for local communities, and conserving natural resources.
Keywords
Eco-tourism, Chopta, Rudraprayag, Destinations of Ecotourism, Mountain Trekking, Tourism
1. Introduction
Eco-tourism, also known as sustainable tourism, is a type of responsible travel that focuses on exploring and experiencing natural environments while also minimizing negative impacts on the environment and supporting local communities (Salem et al., 2020). Eco-tourism aims to promote environmental conservation, support local economies, and provide educational opportunities for visitors. Eco-tourism activities typically involve exploring natural environments, such as forests, mountains, or beaches, while minimizing impact on the environment. This may involve staying in eco-friendly accommodations, using renewable energy sources, conserving water, reducing waste, and participating in activities that do not harm the natural environment.
In addition to environmental considerations, eco-tourism also focuses on supporting local communities. This may involve hiring local guides and staff, purchasing locally produced goods, and supporting local conservation efforts (Zwirn et al., 2005). By supporting local communities, eco-tourism can help to create sustainable economic opportunities and reduce negative impacts on the environment. Overall, eco-tourism is a type of travel that promotes responsible and sustainable practices while providing visitors with opportunities to explore and appreciate natural environments. It is an important way to support conservation efforts and sustainable development, while also providing educational and enriching experiences for travelers.
In India, thenmala in Kerela -first eco-tourism resort (Rao & Pawar, 2013). And now there are many eco-tourist destinations being developed in different parts of India. India is home to a wide range of ecotourism destinations that offer visitors the opportunity to explore the country’s natural beauty while supporting sustainable development and conservation efforts. Some popular ecotourism destinations in India include:
Ladakh: This high-altitude region in the northernmost part of India is known for its stunning mountain scenery and unique culture.
Sundarbans: Located in West Bengal, the Sundarbans is the largest delta mangrove forest in the world and home to a variety of wildlife, including the Bengal tiger.
Western Ghats: This mountain range on the western coast of India is a UNESCO World Heritage Site and home to a rich biodiversity of plants and animals.
Andaman and Nicobar Islands: These islands in the Bay of Bengal are known for their pristine beaches, coral reefs, and unique wildlife.
Kaziranga National Park: Located in Assam, this national park is home to the one-horned Indian rhinoceros and other endangered species.
Kanha National Park: This national park in Madhya Pradesh is known for its population of Bengal tigers and efforts to protect the Barasingha deer.
Spiti Valley: This remote valley in the Himalayas is known for its stunning landscapes, unique culture, and opportunities for adventure activities like trekking and mountaineering.
Coorg: Located in the Western Ghats in Karnataka, Coorg is known for its coffee plantations, lush forests, and waterfalls.
These are just a few examples of the many ecotourism destinations that India has to offer. Each destination offers a unique opportunity to explore and appreciate the country’s natural beauty while supporting sustainable development and conservation efforts.
1.1. About Chopta
Chopta is a beautiful destination located in the Rudraprayag district of Uttarakhand, India. It is a popular destination for eco-tourism and attracts nature lovers, trekkers, and bird watchers from all over the world. Chopta is also known as the ‘Mini Switzerland’ of India due to its beautiful landscapes and snow-capped Himalayan peaks. Eco-tourism in Chopta is an excellent way to explore the natural beauty of the region while also supporting local communities and preserving the environment (Everand et al., 2019). Some popular eco-tourism activities in Chopta include trekking, bird watching, camping, and nature walks.
Figure 1: Morphological Map of the Chopta Valley showing glacial and para-glacial landforms
One of the most popular treks in Chopta is the Tungnath and Chandrashila Trek. This trek takes you through beautiful forests of oak, rhododendron, and deodar trees, and offers stunning views of the Himalayan peaks.
Figure 2: Map showing the trekking routes to Chandrashila and Deoriatal in Chopta Valley.
The trek is moderate in difficulty and can be completed in 2-3 days. Bird watching is another popular eco-tourism activity in Chopta. The region is home to a variety of bird species, including the Himalayan Monal, Koklass Pheasant, and Snow Partridge. You can also spot other wildlife species like musk deer, bharal, and foxes in the region. Camping is a great way to experience the natural beauty of Chopta while also minimizing your impact on the environment. There are several campsites in Chopta that offer comfortable tents, bonfires, and delicious local cuisine. Most campsites also organize nature walks and other eco-friendly activities. In addition to eco-tourism activities, Chopta is also home to several ancient temples, including the Tungnath Temple, which is the highest Shiva temple in the world (Nigam, 2002). The region also has several hot springs and waterfalls that are worth visiting.
Overall, eco-tourism in Chopta, Rudraprayag, Uttarakhand, India is an excellent way to experience the natural beauty of the region while also supporting local communities and preserving the environment.
A visitor should observe and appreciate the natural, social and cultural heritage of the area.
Exclusively assisted by the local communities living in the area.
Visitors must leave a zero carbon footprint
2. Findings and Discussion
Eco-tourism in Chopta, Rudraprayag, Uttarakhand, India is a great way to explore the natural beauty of the region while supporting local communities and conservation efforts. The region offers a variety of eco-tourism activities, including trekking, bird watching, camping, and nature walks, which provide visitors with an opportunity to experience the region’s unique biodiversity (Chaudhary et al., 2022).
One of the strengths of eco-tourism in Chopta is that it supports sustainable development and helps to create economic opportunities for local communities. By promoting responsible tourism practices, eco-tourism can help to ensure that the region’s natural resources are conserved and that local communities benefit from tourism activities (Azem & Sarker, 2013). This can help to create a sustainable economic base that supports the local population.
Another strength of eco-tourism in Chopta is that it promotes environmental conservation. By emphasizing responsible tourism practices, such as reducing waste, conserving water, and minimizing impact on natural environments, eco-tourism can help to preserve the region’s biodiversity and protect it for future generations (Chaudhary et al., 2022).
However, there are also some potential limitations to eco-tourism in Chopta. For example, as the region becomes more popular with tourists, there is a risk of over-tourism, which can have negative impacts on the environment and local communities. Additionally, some eco-tourism activities, such as trekking, can have a negative impact on the natural environment if not properly managed (Biswas, 2017).
Chopta, Rudraprayag is a popular ecotourism destination in Uttarakhand, India, known for its natural beauty and opportunities for adventure activities. Here are some of the activities that visitors can enjoy in Chopta:
Trekking: Chopta is a popular starting point for trekking expeditions to nearby mountain peaks, including Tungnath and Chandrashila. These treks offer stunning views of the Himalayas and are suitable for both novice and experienced trekkers.
Camping: Visitors can enjoy camping in Chopta, with several campsites offering tents and other camping equipment. Camping in Chopta offers a unique opportunity to connect with nature and enjoy the serene surroundings.
Bird watching: Chopta is home to a wide variety of bird species, making it a great destination for bird watching enthusiasts. The best time to visit for bird watching is during the summer months when migratory birds can also be spotted.
Wildlife spotting: Chopta is home to a variety of wildlife, including Himalayan black bears, musk deer, and snow leopards. Visitors can explore the surrounding forests and try to spot these and other animals.
Photography: The stunning landscapes of Chopta provide ample opportunities for photography, with views of snow-capped Himalayan peaks, lush forests, and meadows.
Yoga and meditation: Visitors can take advantage of the serene surroundings of Chopta to practice yoga and meditation, with several retreat centers and yoga schools offering classes.
Snow sports: During the winter months, Chopta receives snowfall, making it a popular destination for snow sports like skiing and snowboarding.
These are just a few examples of the activities that visitors can enjoy in Chopta, Rudraprayag. Each activity offers a unique opportunity to explore and appreciate the natural beauty of the region.
Here is a SWOT analysis of eco-tourism in Chopta, Rudraprayag:
Strengths:
Chopta is located in a region of stunning natural beauty, with snow-capped Himalayan peaks and a rich biodiversity.
Eco-tourism in Chopta can promote sustainable development and economic opportunities for local communities.
There is a growing interest in eco-tourism, and Chopta is well-positioned to capitalize on this trend.
Weaknesses:
Lack of infrastructure and facilities may hinder the growth of eco-tourism in Chopta.
Limited awareness among visitors of the importance of responsible tourism practices may lead to negative impacts on the environment and local communities.
There is a risk of over-tourism, particularly during peak season, which could have negative impacts on the environment and local communities.
Opportunities:
Develop eco-friendly accommodations and infrastructure to attract eco-tourists.
Promote responsible tourism practices to visitors to reduce negative impacts on the environment and local communities.
Partner with local communities to create new eco-tourism activities and support conservation efforts.
Threats:
Climate change and natural disasters could have negative impacts on the region’s biodiversity and eco-tourism industry.
The COVID-19 pandemic has led to a decline in tourism, which could impact the eco-tourism industry in Chopta.
Competition from other eco-tourism destinations could limit the growth of eco-tourism in Chopta.
3. Conclusions
In conclusion, eco-tourism in Chopta, Rudraprayag, Uttarakhand, India is a valuable way to explore the natural beauty of the region while supporting local communities and conservation efforts. However, it is important to balance the benefits of eco-tourism with potential limitations and ensure that tourism activities are managed responsibly to minimize negative impacts on the environment and local communities.
In conclusion, Eco-tourism in Chopta, Rudraprayag, Uttarakhand, India offers a unique opportunity for visitors to explore and appreciate the region’s natural beauty while supporting local communities and conservation efforts. By promoting responsible tourism practices, eco-tourism can help to create sustainable economic opportunities for local communities, while preserving the region’s natural resources and biodiversity.
However, it is important to acknowledge that eco-tourism in Chopta is not without its potential limitations, such as the risk of over-tourism and negative impacts on the environment if tourism activities are not properly managed. Therefore, it is crucial to ensure that eco-tourism in the region is managed responsibly to minimize negative impacts and to maintain the long-term sustainability of the industry.
Overall, eco-tourism in Chopta, Rudraprayag, Uttarakhand, India is a valuable way to explore and appreciate the natural beauty of the region, while supporting sustainable development and conservation efforts. With responsible management and support from local communities, eco-tourism can continue to thrive in the region and provide visitors with an enriching and sustainable travel experience.
4. Recommendations
Here are 10 recommendations for eco-tourism in Chopta, Rudraprayag, Uttarakhand, India:
Develop and implement a sustainable tourism plan that prioritizes responsible tourism practices, such as reducing waste and conserving water.
Work with local communities to promote eco-tourism and ensure that they benefit from tourism activities.
Develop eco-friendly accommodations that use renewable energy sources and promote sustainable tourism practices.
Promote local conservation efforts and work with local communities to protect the region’s biodiversity.
Offer eco-tourism activities that are designed to minimize negative impacts on the environment, such as guided nature walks and bird watching tours.
Manage trekking and camping activities responsibly to minimize negative impacts on the environment and ensure that visitors follow Leave No Trace principles.
Develop educational programs for visitors to promote environmental awareness and conservation efforts.
Encourage visitors to use eco-friendly transportation options, such as public transportation or bicycles.
Promote the use of locally produced goods and services to support the local economy.
Monitor tourism activities to ensure that they are managed responsibly and that negative impacts on the environment and local communities are minimized.
References
Azam, M., & Sarker, T. (2013). Green tourism in the context of climate change towards sustainable economic development in the South Asian Region. SSRN.
Biswas, S. N. (2017). Developing Promotional Strategy Of Ecotourism In Himalayan State: Sikkim, India. In Tourism Marketing (pp. 245-259). Apple Academic Press.
Chaudhary, S., Kumar, A., Pramanik, M., & Negi, M. S. (2022). Land evaluation and sustainable development of ecotourism in the Garhwal Himalayan region using geospatial technology and analytical hierarchy process. Environment, Development and Sustainability, 1-42.
Everard, M., Gupta, N., Scott, C. A., Tiwari, P. C., Joshi, B., Kataria, G., & Kumar, S. (2019). Assessing livelihood-ecosystem interdependencies and natural resource governance in Indian villages in the Middle Himalayas. Regional Environmental Change, 19, 165-177.
Nigam, D. (2002). Tourism, environment, and development of Garhwal Himalaya. Mittal Publications.
Rao, N. M., & Pawar, R. (2013). Assessment of community participation in ecotourism and conservation at Dandeli Wildlife Sanctuary, Karnataka, India. In National Conference on Biodiversity: Status and Challenges in Conservatio (pp. 88-93).
Salam, M. A., Lindsay, G. R., & Beveridge, M. C. (2000). Eco-tourism to protect the reserve mangrove forest the Sundarbans and its flora and fauna. Anatolia, 11(1), 56-66.
Sharma, S. N. (2013). Sustainable Development Strategies and Approaches. International Journal of Engineering and Technical Research (IJETR), 2.
Sharma, Shashikant Nishant. (2017). Challenges and Opportunities for Tourist Destination Mussoorie. Think India Quarterly, 20(4), 95–102. https://doi.org/10.5281/zenodo.7847343
Sharma, Shashikant Nishant. (2020). Challenges and Opportunities for Tourism in Dehradun. Studies in Indian Place Names, 40(93), 135–140. https://doi.org/10.5281/zenodo.7847592
Zwirn, M., Pinsky, M., & Rahr, G. (2005). Angling ecotourism: issues, guidelines and experience from Kamchatka. Journal of Ecotourism, 4(1), 16-31.
Sri Aurobindo Ghosh, also known as Aurobindo Ghose, was a profound philosopher, spiritual leader, nationalist, poet, and educationist of modern India. Born on August 15, 1872, in Kolkata, he played a significant role in India’s struggle for independence and later turned towards spiritual pursuits in Puducherry. His contributions to the field of education are immense and visionary. He believed that education should aim at the integral development of the individual — body, mind, and spirit. His educational philosophy laid the foundation of what is now called “Integral Education.”
Philosophy of Education Sri Aurobindo’s concept of education was deeply spiritual and holistic. He rejected the colonial model of education that emphasized rote learning and mechanical reproduction of knowledge. Instead, he emphasized the inner awakening of the individual. According to him, the aim of education is not merely to prepare the individual for a career but to nurture the soul, intellect, and character.
He stated:
“Education to be true must not be a machine-made fabric, but a true building or living evocation of the powers of the mind and spirit of the human being.”
His philosophy integrates elements of Indian culture, yoga, and spirituality with a rational and scientific approach to learning.
Principles of Integral Education Sri Aurobindo, along with his spiritual collaborator The Mother (Mirra Alfassa), developed the idea of Integral Education, which includes five major aspects:
Physical Education – Development of the body to make it strong and healthy.
Vital Education – Control and utilization of desires, emotions, and instincts.
Mental Education – Development of the power of concentration, reasoning, and thinking.
Psychic Education – Cultivation of the inner being and soul consciousness.
Spiritual Education – Awakening the spiritual consciousness and connecting with the divine.
This concept of education focuses not only on academic learning but on the complete and balanced growth of a human being.
Establishment of Educational Institutions One of Sri Aurobindo’s most notable contributions to education was the establishment of the Sri Aurobindo International Centre of Education (SAICE) in Pondicherry in 1952, following his vision. It was designed to implement his ideas of Integral Education. The institution does not follow the conventional system of exams, grades, and textbooks; instead, it fosters self-learning, freedom, and creativity.
Moreover, the Auroville project, initiated by The Mother in 1968 as an experimental city based on the principles of human unity and spiritual growth, reflects Sri Aurobindo’s educational ideals and continues to influence alternative education globally.
Emphasis on National Education Before his spiritual journey, during the Indian freedom struggle, Sri Aurobindo advocated for a National System of Education that would reflect India’s heritage and cultural values. He believed that British colonial education alienated Indian youth from their roots and made them mentally subservient. He called for an education system that would instill patriotism, moral strength, and national pride.
He once said,
“The first necessity is the liberation of the soul of India. That is the aim of education.”
Educational Writings Sri Aurobindo wrote extensively on education. His works such as The Human Cycle, National System of Education, Essays on the Gita, and The Synthesis of Yoga offer deep insights into the purpose and methods of true learning. His educational thoughts are not confined to the classroom; they are part of a larger vision of human evolution and consciousness.
Legacy and Relevance Today Sri Aurobindo’s educational philosophy has gained international recognition for its holistic and futuristic vision. His emphasis on self-discovery, moral development, and spiritual realization is increasingly relevant in today’s fast-paced and materialistic world. Integral Education offers an alternative to conventional models by nurturing well-rounded, compassionate, and aware individuals.
His ideas have influenced many alternative schools and educational thinkers in India and abroad. Institutions like Mirambika (Delhi), Auro Mirra International School (Bangalore), and Auroville schools carry forward his legacy.
Conclusion Sri Aurobindo Ghosh was much more than a political revolutionary; he was a visionary educator who saw education as a sacred process of unfolding the divine in the human. His contributions continue to inspire educators and institutions to look beyond marks and degrees and focus on shaping human potential. His idea of Integral Education is a timeless gift to humanity, emphasizing that the ultimate aim of education is self-realization and the transformation of society through enlightened individuals.
References
Ghosh, S., & Roy, S. (2023). An insight into Rishi Aurobindo’s thoughts on education: assimilated views. The Social Science Review A Multidisciplinary Journal, 1(2), 89-96.
Rani, C. (2017). A study of educational vision of Aurobindo Ghosh. The International Journal of Indian Psychology, 5(1), 48-51.
Sharma, S. N. Indian Knowledge Systems–A Short Review. Eduindex News
Sharma, S. N., & Adeoye, M. A. (2024). New Perspectives on Transformative Leadership in Education. EduPub. New Delhi
Transit-Oriented Development (TOD) is a planning and design strategy that promotes compact, walkable communities centered around high-quality public transportation systems. The concept has evolved over time, drawing from various urban development practices, transportation innovations, and planning philosophies. Its history can be traced through several key phases:
1. Early Inspirations (19th to early 20th Century)
The roots of TOD can be traced back to the development of rail-based suburbs in Europe and North America during the 19th century. As cities industrialized, railways and streetcars enabled the development of new residential communities beyond the congested urban core:
United Kingdom: The garden city movement led by Ebenezer Howard in the late 1800s emphasized self-contained communities with strong rail connectivity.
United States: In cities like Boston and New York, neighborhoods developed along streetcar lines, giving rise to the term streetcar suburbs.
India: Colonial-era developments such as New Delhi were also shaped by railway access and hierarchical planning.
These early examples were not called TOD, but they shared its core principle: locating housing, jobs, and services near transit.
2. Post-War Suburbanization and Auto Dependence (1945–1970s)
After World War II, especially in countries like the U.S., there was a significant shift toward automobile-centric suburban development. Public transit declined in favor of highways and low-density suburban sprawl:
Urban decentralization led to spatial separation of land uses (residential, commercial, industrial).
Public transport use declined sharply.
This period marked a retreat from TOD-like principles, as city planning favored highways and parking over compactness and accessibility.
3. Emergence of the TOD Concept (1980s–1990s)
The term “Transit-Oriented Development” was formally coined by American architect and planner Peter Calthorpe in the early 1990s. His book The Next American Metropolis (1993) outlined TOD as a response to the problems of sprawl:
He defined TOD as compact, mixed-use communities within walking distance (usually 400–800 meters) of a transit stop.
Calthorpe advocated for integrating land use and transit planning to create more sustainable and livable urban environments.
During this period, cities in the U.S., Canada, and Europe began incorporating TOD into their long-term growth strategies.
4. Global Adoption and Expansion (2000s–Present)
TOD gained global traction as cities recognized the need for sustainable urban growth:
Asia: Cities like Hong Kong, Tokyo, Singapore, and Seoul developed sophisticated TOD models with high-density developments above or around metro stations.
Europe: Many cities enhanced existing TOD frameworks with tram, metro, and cycling integration.
India: The National TOD Policy (2017) was launched by the Ministry of Housing and Urban Affairs to guide integrated land use and transport planning. Delhi, Ahmedabad, and Bengaluru have initiated TOD projects around metro corridors.
Latin America: BRT-based TOD emerged in cities like Bogotá and Curitiba.
TOD has also been integrated into climate resilience strategies and affordable housing policies.
5. Contemporary Trends and Innovations
Recent developments have further evolved TOD:
Technology Integration: Smart mobility, Mobility-as-a-Service (MaaS), and data-driven planning enhance TOD effectiveness.
First-Last Mile Solutions: Cycling, e-scooters, ride-sourcing, and pedestrian infrastructure are increasingly emphasized.
Inclusive TOD: Focus on equitable access to housing, gender-sensitive design, and affordability.
Conclusion
Transit-Oriented Development has evolved from early rail-based planning to a comprehensive urban development strategy adopted worldwide. As cities grapple with climate change, congestion, and social equity, TOD remains central to efforts to create compact, connected, and sustainable urban forms.
References
Cervero, R. (2004). Transit-oriented development in the United States: Experiences, challenges, and prospects.
Dittmar, H., & Ohland, G. (Eds.). (2012). The new transit town: Best practices in transit-oriented development. Island Press.
Knowles, R. D., Ferbrache, F., & Nikitas, A. (2020). Transport’s historical, contemporary and future role in shaping urban development: Re-evaluating transit oriented development. Cities, 99, 102607.
Lund, H. (2006). Reasons for living in a transit-oriented development, and associated transit use. Journal of the American Planning Association, 72(3), 357-366.
Sharma, S. N. (2024). Sustainable Transit-Oriented Development: A Solution to Urban Congestion. Track2Training
Sharma, S. N., & Dehalwar, K. (2025). Assessing the Transit-Oriented Development and Travel Behavior of the Residents in Developing Countries: A Case of Delhi, India. Journal of Urban Planning and Development, 151(3), 05025018.
Sharma, S. N., Kumar, A., & Dehalwar, K. (2024). The Precursors of Transit-oriented Development. EPW Economic & Political Weekly, 59(16), 14.
Lodhi, A. S., Jaiswal, A., & Sharma, S. N. (2024). Assessing bus users satisfaction using discrete choice models: a case of Bhopal. Innovative Infrastructure Solutions, 9(11), 1-27.
Schemes like PMAY-Urban (Pradhan Mantri Awas Yojana – Urban) provide direct funding to ULBs for slum redevelopment and affordable housing.
Atal Mission for Rejuvenation and Urban Transformation (AMRUT) includes provisions for basic services to slums.
Funds are often transferred through State Urban Development Departments to ULBs based on project proposals.
State Government Support:
States have their own housing boards and urban development policies. For example, Maharashtra’s Slum Rehabilitation Authority (SRA) model.
States often co-finance central schemes (e.g., PMAY-Urban follows a 60:40 Centre:State funding ratio for most states, 90:10 for NE and special category states).
ULB Own Revenues:
Property tax
User charges (for water, sanitation, etc.)
Development charges and betterment levies
Land monetization (leasing or selling municipal land)
2. Grants and Transfers
Finance Commission Grants:
The 15th Finance Commission allocates grants directly to urban local bodies, including a part for improving urban services (indirectly benefiting slums).
State Finance Commission Recommendations:
State governments allocate funds to ULBs based on their Finance Commission reports.
3. Loans and Credit Mechanisms
HUDCO (Housing and Urban Development Corporation Ltd):
Provides long-term, low-interest loans to ULBs for slum housing and basic services.
World Bank, ADB, and Multilateral Agencies:
Fund large urban development programs (e.g., Tamil Nadu Urban Development Fund).
ULBs can access these funds indirectly through state governments.
Pooled Finance Development Fund (PFDF):
Helps smaller ULBs access bond markets through pooled municipal bonds for infrastructure projects, including slum improvement.
4. Public-Private Partnerships (PPP)
Slum redevelopment projects are increasingly being implemented through PPP models, where:
Developers get rights to commercially exploit parts of land in exchange for rehabilitating slum dwellers.
Example: Mumbai’s SRA projects.
Viability Gap Funding (VGF):
Central government provides VGF to make projects commercially viable for private developers.
5. Community Participation and Beneficiary Contributions
Sweat Equity:
In situ slum redevelopment often uses community labor as a contribution to project costs.
Beneficiary Payments:
Minimal contributions are taken from slum dwellers in housing schemes (e.g., under PMAY-Urban, a nominal beneficiary share is required).
Self-Help Groups (SHGs) and Microfinance:
Used for incremental housing improvements and basic infrastructure upgradation.
6. Corporate Social Responsibility (CSR) Funds
Companies are mandated (under the Companies Act, 2013) to invest 2% of their profits into CSR activities.
Some CSR initiatives fund housing, sanitation, and education projects in slums.
7. Innovative Financing Mechanisms
Land Value Capture (LVC):
ULBs capture a share of the increase in land value resulting from infrastructure improvements.
Tools include betterment charges, transfer of development rights (TDR), impact fees.
Municipal Bonds:
Cities like Pune have raised funds through municipal bonds for water supply and sanitation, indirectly impacting slum areas.
In short, funding at ULB level for slum improvement is a mix of public funding (both Union and State), ULB internal resources, loans, PPPs, community contributions, and innovative financing models like municipal bonds and land value capture.
The Disaster Management Cycle is a continuous process of phases and activities that aim to reduce the impact of disasters, prepare for them, respond effectively during the disaster, and recover from its effects. This cycle is often depicted as a circular process, where each phase leads into the next, with ongoing learning and improvements. Here’s a detailed breakdown of each phase of the Disaster Management Cycle:
1. Mitigation (Prevention)
This phase involves measures taken to reduce or eliminate the risks of disasters. The focus is on preventing disasters from happening or minimizing their impacts when they do occur. Mitigation can include:
Risk assessment to identify vulnerable areas and people.
Implementing building codes and regulations to ensure structures can withstand disasters (e.g., earthquakes, floods).
Environmental protection efforts, like floodplain management or forest fire prevention.
Educating the public about disaster risks and prevention measures.
Planning for risk reduction, such as relocating populations from high-risk areas.
2. Preparedness (Planning and Training)
Preparedness refers to the planning, training, and coordination activities that ensure a rapid and efficient response in the event of a disaster. The goal is to enhance the ability of individuals, communities, and organizations to respond effectively. Key elements include:
Developing disaster response plans for different types of hazards.
Creating emergency response teams and training them in disaster-specific scenarios.
Establishing early warning systems to alert communities of impending disasters (e.g., tsunamis, storms).
Conducting drills and exercises to practice coordination and communication among emergency responders and communities.
Public awareness campaigns to inform people of evacuation routes, shelters, and other safety measures.
3. Response (Immediate Action)
The response phase occurs immediately before, during, and after the disaster, where the focus is on saving lives, providing basic needs, and minimizing the impact of the disaster. Actions taken include:
Search and rescue operations to locate and aid survivors.
Providing emergency shelter for displaced individuals and families.
Delivering food, water, and medical supplies to affected populations.
Setting up emergency communication networks to provide information and coordinate response efforts.
Deploying emergency personnel and equipment, including first responders, medical teams, and security forces.
Providing temporary health care, addressing injuries, and preventing the spread of diseases in disaster-affected areas.
4. Recovery (Rebuilding and Restoration)
Recovery is the process of restoring normalcy and rebuilding what was damaged or destroyed. The goal is to bring the affected communities back to a state of functional stability and ensure sustainable development. Recovery can take months to years, depending on the severity of the disaster. Key activities include:
Restoring essential services, like electricity, water supply, and sanitation.
Rebuilding infrastructure, such as roads, schools, hospitals, and homes.
Providing financial and psychological support to affected individuals and businesses.
Assessing and restoring the economy by rebuilding livelihoods and employment opportunities.
Monitoring and evaluating the recovery process to ensure that it is progressing efficiently and effectively.
Addressing long-term resilience, ensuring that communities are better prepared for future disasters by improving infrastructure, social services, and community engagement.
5. Rehabilitation (Long-term Support and Recovery)
Rehabilitation can be considered a part of the recovery process but is often a distinct phase, focusing on the longer-term social, economic, and environmental needs of the affected population. This phase seeks to help communities return to a normal or improved level of function and well-being. Activities in this phase may include:
Long-term housing reconstruction for displaced populations.
Restoring livelihoods and income generation activities for individuals and families affected by the disaster.
Addressing mental health and providing trauma support for survivors.
Rehabilitation of natural resources, such as forests, rivers, and farmlands, that may have been damaged during the disaster.
6. Learning and Adaptation (Post-Event Analysis)
While not always shown as a formal phase, learning from each disaster and adapting for future events is critical. After a disaster, governments, organizations, and communities assess their response to identify strengths and weaknesses. This phase helps to:
Conduct post-event reviews and evaluations to assess the effectiveness of response and recovery.
Identify gaps and lessons learned, which are crucial for improving disaster management strategies.
Update disaster response plans, policies, and procedures based on the lessons learned.
Integrate new technologies and strategies to improve disaster mitigation, preparedness, response, and recovery in future events.
Encourage community participation and feedback to improve local knowledge and preparedness.
The Importance of the Disaster Management Cycle
Continuity: The cycle emphasizes that disaster management is not a one-time effort. It’s an ongoing process that involves continuous improvement.
Risk reduction: By focusing on preparedness and mitigation, the cycle helps reduce the potential loss of life and property in the event of a disaster.
Efficiency: A well-planned cycle helps ensure that response and recovery efforts are swift, organized, and effective, ultimately saving lives and minimizing the impact of the disaster.
Each phase of the disaster management cycle is interconnected, and success in one phase helps improve the overall effectiveness of the entire cycle.
References
Dehalwar, K. (2015). Basics of environment sustainability and environmental impact assessment. Basics of Environment Sustainability and Environmental Impact Assessment, 1-208.
Dehalwar, K. Bridging the Gap: Community-Based and Workshop-Based Approaches to Address Rural and Urban Planning Issues.
Joyce, K. E., Wright, K. C., Samsonov, S. V., & Ambrosia, V. G. (2009). Remote sensing and the disaster management cycle. Advances in geoscience and remote sensing, 48(7), 317-346.
Rana, I. A., Asim, M., Aslam, A. B., & Jamshed, A. (2021). Disaster management cycle and its application for flood risk reduction in urban areas of Pakistan. Urban Climate, 38, 100893.
Sawalha, I. H. (2020). A contemporary perspective on the disaster management cycle. foresight, 22(4), 469-482.
Tay, H. L., Banomyong, R., Varadejsatitwong, P., & Julagasigorn, P. (2022). Mitigating risks in the disaster management cycle. Advances in Civil Engineering, 2022(1), 7454760.
In the context of rising urban traffic concerns in India, cities like Chandigarh and Kolkata have taken proactive measures to address one of the most persistent problems on their roads—overspeeding. With the growing number of vehicles and increasing traffic congestion, urban safety has become a critical issue. Authorities in both these cities have explored and implemented a range of solutions to reduce vehicle speeds and encourage safer driving behavior.
Chandigarh: A Model for Speed Management
Chandigarh, often considered one of India’s best-planned cities, has been at the forefront of urban traffic management. Recognizing the threats posed by high-speed driving—especially on wide arterial roads and sectors designed for fast movement—the Chandigarh Traffic Police initiated a comprehensive speed-calming strategy.
Key interventions included:
Installation of Speed Cameras: High-resolution automated speed detection cameras were deployed at key intersections and vulnerable points to catch violators and generate e-challans in real time.
Road Diet and Traffic Calming Measures: The city experimented with lane narrowing, installation of rumble strips, and raised pedestrian crossings. These measures aimed at naturally reducing vehicle speeds by altering driver perception and enforcing compliance.
Intensive Awareness Campaigns: Through social media, radio, and public engagement programs, the authorities educated drivers—especially young motorists—about the risks of speeding and the legal consequences.
Speed Limits and Zoning: Specific zones such as school areas, hospitals, and high-pedestrian zones were designated with reduced speed limits (20–30 km/h), and were closely monitored for enforcement.
The result was a noticeable reduction in speeding-related crashes, particularly in school zones and near marketplaces. Moreover, citizen feedback revealed improved perceptions of safety, encouraging more people to walk and cycle.
Kolkata: Integrating Safety with Urban Chaos
Kolkata presents a different urban context. With a dense urban fabric, a high reliance on public transport, and narrow, crowded streets, managing traffic speeds is both critical and challenging. The Kolkata Traffic Police adopted a multipronged approach to deal with these issues.
Key initiatives included:
Adaptive Signal Systems and Traffic-Calming Zones: The use of intelligent traffic lights helped reduce vehicle speeds without causing excessive delays. Additionally, dedicated “calm zones” were created in sensitive areas like Park Street and Esplanade.
Increased Enforcement and Penalties: Mobile speed radars and a greater number of traffic police personnel were deployed during peak hours to catch and deter speeding vehicles.
Infrastructure Modifications: Speed breakers, median barriers, and pedestrian islands were constructed in accident-prone areas to slow down traffic and make pedestrian crossings safer.
Public-Private Partnerships (PPP): Kolkata engaged with local NGOs and tech firms to roll out awareness campaigns, safety audits, and behavior-change programs, especially targeting commercial vehicle drivers and two-wheeler users.
Interestingly, the city also focused on improving the conditions of pedestrian infrastructure, which indirectly discouraged high-speed driving by giving road priority to non-motorized users.
The Way Forward
Both Chandigarh and Kolkata demonstrate how Indian cities, despite differing in scale and structure, can adopt innovative solutions to curb speeding and enhance urban road safety. What stands out is their commitment to combining enforcement with education and infrastructural adjustments. These strategies align with the Safe System Approach promoted by global traffic safety frameworks, which emphasizes shared responsibility and systemic thinking.
As India continues to urbanize and motorization rates climb, these city-led initiatives serve as important examples for others to follow. By fostering a culture of safer driving and designing roads that prioritize human life over speed, urban India can move closer to its Vision Zero ambitions—eliminating fatalities and serious injuries on roads.
References
Chakrabartty, A., & Gupta, S. (2014). Traffic congestion in the metropolitan City of Kolkata. Journal of Infrastructure Development, 6(1), 43-59.
Dehalwar, K., & Sharma, S. N. (2023). Fundamentals of Area Appreciation and Space Perceptions.
Lodhi, A. S., Jaiswal, A., & Sharma, S. N. (2024). Assessing bus users satisfaction using discrete choice models: a case of Bhopal. Innovative Infrastructure Solutions, 9(11), 1-27.
Sharma, S. N., Kumar, A., & Dehalwar, K. (2024). The Precursors of Transit-oriented Development. EPW Economic & Political Weekly, 59(16), 14.
Sharma, S. N., & Dehalwar, K. (2023). Fundamentals of Planning and Design of Housing.
Sharma, S. N., & Dehalwar, K. (2025). Assessing the Transit-Oriented Development and Travel Behavior of the Residents in Developing Countries: A Case of Delhi, India. Journal of Urban Planning and Development, 151(3), 05025018. https://doi.org/10.1061/JUPDDM.UPENG-5468
Tiwari, G., & Mohan, D. (2022). Traffic safety in India and vision zero. In The Vision Zero Handbook: Theory, Technology and Management for a Zero Casualty Policy (pp. 1-39). Cham: Springer International Publishing.
Verma, A., Sreenivasulu, S., & Dash, N. (2011). Achieving sustainable transportation system for Indian cities–problems and issues. Current Science, 1328-1339.
Functional Structuralism is a sociological theory that merges insights from both structuralism and functionalism to explain how societies function and maintain stability. This theory is concerned with how societal structures shape human behavior and how each part of society contributes to overall social stability.
Origins and Development
Functional Structuralism draws from two major theoretical traditions:
Structuralism – Emphasized by scholars like Claude Lévi-Strauss, structuralism focuses on the deep structures underlying human thought, language, and culture. It asserts that social reality is constructed through hidden, universal structures that shape people’s behavior.
Functionalism – Popularized by Émile Durkheim and later advanced by Talcott Parsons and Robert K. Merton, functionalism views society as a complex system whose parts work together to promote stability and social order.
The synthesis of these two traditions resulted in Functional Structuralism, which examines both how social structures shape behavior and how those structures function to maintain society.
Key Concepts of Functional Structuralism
1. Social Structure
Society consists of interconnected institutions (e.g., family, economy, education, religion) that provide a framework for social interactions.
These structures influence individual behavior by establishing norms, roles, and expectations.
2. Functions of Social Institutions
Each institution in society has specific functions (manifest and latent) that contribute to societal stability.
Example: The education system not only imparts knowledge (manifest function) but also reinforces social norms and prepares individuals for labor markets (latent function).
3. Equilibrium and Social Stability
Functional Structuralism assumes that societies tend to maintain equilibrium.
When a disruption occurs (e.g., a major economic crisis), other institutions adjust to restore stability.
4. Social Roles and Norms
People occupy social roles within a structured system.
These roles come with expectations that guide individual behavior and contribute to the stability of the social order.
5. Latent and Manifest Functions (Robert K. Merton)
Manifest Functions: Direct, intended outcomes of social institutions (e.g., schools educating students).
Latent Functions: Unintended, hidden consequences (e.g., schools promoting social networking).
6. Social Change and Dysfunction
While the theory primarily focuses on stability, it also acknowledges dysfunctions—elements that disrupt social order.
Example: Unemployment can be dysfunctional for economic stability, requiring new policies or structural adjustments.
Criticism of Functional Structuralism
Despite its contributions, Functional Structuralism has been criticized for:
Overemphasizing Social Stability – Critics argue that it neglects the role of conflict, power struggles, and radical social change (e.g., Karl Marx’s conflict theory).
Determinism – It assumes individuals are shaped by structures, downplaying human agency and free will.
Neglecting Micro-Level Interactions – The theory focuses on large-scale structures rather than individual interactions (unlike symbolic interactionism).
Comparison of Structuralism and Functionalism in Sociology
Aspect
Structuralism
Functionalism
Definition
Focuses on the underlying structures that shape human behavior and culture.
Views society as a system of interconnected parts working together to maintain stability.
Key Scholars
Claude Lévi-Strauss, Ferdinand de Saussure (in linguistics), Louis Althusser
Émile Durkheim, Talcott Parsons, Robert K. Merton
Focus
Deep, hidden structures (e.g., language, myths, ideologies) that shape social life.
Social functions of institutions and their contribution to societal stability.
Unit of Analysis
Structures such as language, kinship systems, and cultural codes.
Social institutions (e.g., family, education, religion, economy).
Approach
Theoretical and abstract; focuses on how deep structures organize society.
Practical and empirical; examines real-world social functions and institutions.
View of Society
A network of symbolic and cognitive structures that influence behavior.
A system of interdependent parts that function together to maintain equilibrium.
Empirical research, statistical analysis, social surveys.
Role of the Individual
Individuals are shaped by pre-existing structures; human agency is secondary.
Individuals play roles within institutions, but their behaviors are influenced by social norms.
Social Change
Change occurs when structural contradictions or shifts in deep structures take place.
Change occurs gradually as institutions adapt to maintain social order.
Criticism
Too abstract, neglects practical social interactions and conflicts.
Overemphasizes stability, underestimates power struggles and inequalities.
This table provides a clear comparative view of both theories.
Conclusion
Functional Structuralism provides a macro-level perspective on how societies maintain order and how institutions function interdependently. It remains a significant framework in sociology, particularly in understanding how social structures contribute to stability and continuity. However, contemporary sociologists often integrate insights from other perspectives, such as conflict theory and symbolic interactionism, to provide a more comprehensive understanding of society.
Writing a good article for a research journal requires a structured approach, clarity, and strong argumentation. Here’s a step-by-step guide to help you:
1. Choose a Clear and Relevant Topic
Select a research problem that is original, significant, and aligns with current discussions in your field.
Ensure your research question is specific, well-defined, and contributes to existing knowledge.
2. Conduct a Thorough Literature Review
Identify gaps in the existing literature.
Summarize key theories, methodologies, and findings related to your topic.
Cite recent and relevant studies to justify the need for your research.
3. Structure Your Paper Properly
A well-structured research article typically follows this format
Title
Be concise yet descriptive, highlighting the main idea of your research.
Avoid unnecessary jargon but ensure it captures the essence of your work.
Abstract
Write a brief summary (150–250 words) covering the research problem, methodology, key findings, and implications.
Ensure it is clear and engaging, as many readers decide to read a paper based on the abstract.
Keywords
Choose 4–6 relevant keywords that make your article easy to find in databases.
Introduction
Provide background information and set the context for your study.
Define the research problem, its significance, and research objectives.
Clearly state the research question(s) and hypothesis (if applicable).
Methodology
Explain how the research was conducted, including study design, data collection methods, and analytical techniques.
Justify why you chose specific methods and ensure reproducibility.
Results
Present your findings clearly using tables, graphs, and figures if needed.
Avoid interpretation—just report the raw data and analysis outcomes.
Discussion
Interpret the results in the context of the existing literature.
Explain how your findings contribute to knowledge and address your research questions.
Discuss any limitations and suggest areas for future research.
Conclusion
Summarize the key findings and their implications.
Avoid repeating information already stated in the discussion.
Highlight how your research advances the field.
References
Use proper citation style (APA, MLA, Chicago, or journal-specific format).
Ensure accuracy in referencing all sources used in your study.
4. Maintain Clarity and Conciseness
Write in a clear, logical, and concise manner.
Avoid jargon and overly complex sentences unless necessary.
Use active voice whenever possible.
5. Follow Journal Guidelines
Each journal has specific formatting, citation, and submission requirements—follow them strictly.
Check for word limits, font size, section requirements, and referencing styles.
6. Edit and Proofread
Revise multiple times for clarity, coherence, and grammar.
Seek feedback from colleagues or mentors.
Use tools like Grammarly, Hemingway Editor, or journal-recommended editing services.
7. Address Reviewers’ Comments Carefully
If your paper is peer-reviewed, be prepared to make revisions based on reviewers’ feedback.
Address each comment professionally and provide clear justifications for changes.
Young minds are shaping the future of geospatial technology! Join us for an insightful webinar on 28th February 2025, from 4:30 PM to 6:30 PM (IST) to explore how youth can leverage remotely sensed data and GIS analysis for sustainable development, resilience building, and urban planning.
🔹 Why Attend? ✅ Understand the significance of GIS & remote sensing in decision-making ✅ Learn about real-world applications from experts ✅ Discover opportunities for youth in geospatial sciences
Rural and urban areas present distinct but interconnected challenges that require strategic planning to ensure sustainable development, economic growth, and social equity. These issues vary based on geographical, socio-economic, and infrastructural conditions.
Rural Planning Issues
Infrastructure Deficiencies: Limited access to roads, public transportation, electricity, water supply, and sanitation facilities.
Agricultural Sustainability: Decreasing soil fertility, climate change impacts, water scarcity, and market access for farm produce.
Migration and Depopulation: Young populations migrating to urban centers for education and employment, leading to an aging rural population.
Limited Healthcare and Education Facilities: Inadequate medical and educational institutions result in lower quality of life.
Economic Stagnation: Lack of industries, poor connectivity, and insufficient government support for rural enterprises.
Land Use Conflicts: Unregulated expansion of agriculture and deforestation affecting biodiversity and ecosystem balance.
Urban Planning Issues
Traffic Congestion and Transportation Deficiencies: Poor public transit, inadequate pedestrian infrastructure, and excessive reliance on private vehicles.
Housing Shortages and Informal Settlements: Increasing urban population leading to slums and informal housing developments.
Environmental Pollution: Air, water, and noise pollution due to industrial activities and vehicular emissions.
Urban Sprawl: Unplanned expansion of urban areas leading to inefficient land use and loss of green spaces.
Social Inequality and Gentrification: Rising real estate prices pushing low-income residents to urban peripheries.
Waste Management Issues: Inefficient disposal and recycling systems causing environmental hazards.
Community-Based and Workshop-Based Methods in Planning
Community engagement is crucial in addressing both rural and urban planning challenges. Participatory planning ensures that the needs and aspirations of local populations are considered.
Community-Based Methods
These methods involve local residents in the planning and decision-making processes to ensure grassroots solutions that align with their needs. Some key community-based approaches include:
Participatory Rural Appraisal (PRA):
Engages rural communities in assessing their needs and resources.
Uses tools like mapping, ranking exercises, and problem analysis.
Community Visioning:
Involves brainstorming sessions where community members collectively shape the development vision.
Helps in long-term goal setting and planning.
Focus Group Discussions (FGDs):
Facilitates dialogues among specific groups (e.g., farmers, women, youth) to gather insights and opinions.
Stakeholder Consultations:
Engages local leaders, businesses, and civil society organizations for integrated planning.
Citizen Observatories:
Uses technology (e.g., mobile apps, GIS mapping) to collect real-time community data for planning purposes.
Co-Design Workshops:
Involves local people in designing solutions, particularly in urban redevelopment or infrastructure projects.
Workshop-Based Methods
Workshops provide a structured setting for collaborative problem-solving among stakeholders, planners, and policymakers.
Scenario Planning Workshops:
Participants develop and compare alternative future development scenarios.
Useful in climate resilience and urban expansion planning.
Design Charrettes:
Short-term intensive workshops where multidisciplinary teams work with communities to create urban or rural designs.
Deliberative Forums:
Structured discussions where diverse stakeholders debate issues and develop consensus-driven solutions.
Capacity-Building Workshops:
Training sessions that equip communities with knowledge on sustainable practices, governance, and resource management.
Policy Co-Creation Workshops:
Involves policymakers and citizens in drafting policy frameworks that reflect ground realities.
Hackathons and Innovation Labs:
Uses technology and collaborative problem-solving to develop data-driven solutions for urban and rural challenges.
Addressing Rural and Urban Planning Issues Using These Methods
The effectiveness of community-based and workshop-based methods in planning depends on their application to specific problems. Some examples include:
Improving Rural Infrastructure: Participatory mapping and stakeholder consultations help prioritize infrastructure projects like roads and irrigation.
Enhancing Public Transport: Co-design workshops with urban residents can refine public transport routes and services.
Mitigating Environmental Challenges: Citizen observatories help in real-time monitoring of pollution and waste management.
Empowering Local Economies: Capacity-building workshops support small businesses, cooperatives, and sustainable agriculture.
By integrating these participatory approaches, planners can create more inclusive and sustainable rural and urban environments, ensuring that development initiatives align with the needs of the people they serve.
A neighborhood is a geographically localized community within a city or town, characterized by social interactions, shared amenities, and common identity. Neighborhoods often serve as fundamental units of urban planning, fostering a sense of belonging and community among residents. They vary in size and structure but are typically defined by boundaries such as streets, parks, or water bodies.
A cluster refers to a group of buildings, housing units, or facilities that are closely linked spatially and functionally. Clusters can exist within a neighborhood and serve as sub-units that facilitate local interactions and connectivity. They can be designed around common open spaces, pedestrian pathways, or shared facilities to promote community engagement.
A society represents a broader social organization beyond a neighborhood or cluster. It encompasses various groups, institutions, and cultural dynamics that shape urban life. Societies include different economic, social, and cultural layers that influence neighborhood development and interactions at a macro scale.
Neighborhood Pattern and Development Strategy
1. Neighborhood Patterns
Neighborhoods are structured in different patterns based on historical evolution, urban planning principles, and socio-economic factors. Some common neighborhood patterns include:
Grid Pattern: A systematic layout of streets intersecting at right angles, promoting ease of navigation and accessibility. Found in cities like New York, it ensures uniformity and efficient land use.
Radial Pattern: Streets radiate from a central point, such as a plaza or a transport hub. This pattern is common in historical cities with a central market or administrative core.
Linear Pattern: Development follows a single axis, typically along a transportation corridor like a highway or railway.
Organic Pattern: Evolved naturally over time without strict planning, resulting in irregular street layouts and diverse land use.
Clustered Pattern: Groups of buildings or residences arranged around shared open spaces, commonly seen in gated communities or suburban developments.
2. Neighborhood Development Strategy
A neighborhood development strategy involves planning and policies that ensure sustainable growth, community well-being, and efficient land use. Key strategies include:
Mixed-Use Development: Integrating residential, commercial, and recreational spaces to reduce travel distances and enhance livability.
Transit-Oriented Development (TOD): Encouraging development near transit nodes to promote public transport use and reduce car dependency.
Walkability and Connectivity: Designing pedestrian-friendly streets, bike lanes, and pathways to improve mobility and accessibility.
Green Infrastructure: Incorporating parks, open spaces, and sustainable drainage systems to enhance environmental quality.
Affordable Housing and Inclusivity: Ensuring diverse housing options to accommodate various income groups and prevent socio-economic segregation.
Smart City Initiatives: Using technology and data-driven approaches to improve urban services and infrastructure efficiency.
Analyzing Neighborhood Development Patterns
Analyzing neighborhood development patterns involves assessing the spatial, social, and economic factors that shape urban growth. Some key aspects of analysis include:
Land Use and Zoning Analysis: Evaluating the distribution of residential, commercial, and public spaces to ensure balanced development.
Density and Housing Typologies: Examining population density and the mix of housing types (apartments, row houses, single-family homes) to determine growth trends.
Transportation and Connectivity: Studying road networks, transit accessibility, and pedestrian pathways to identify mobility challenges and opportunities.
Social Infrastructure: Assessing the availability of schools, hospitals, recreational centers, and public spaces that contribute to neighborhood well-being.
Economic Viability: Reviewing employment hubs, commercial zones, and economic activities to understand the sustainability of a neighborhood.
Environmental Considerations: Evaluating green spaces, air quality, and ecological balance to ensure sustainable urban development.
Community Participation: Understanding the role of resident engagement in shaping policies, maintaining public spaces, and fostering social cohesion.
By analyzing these factors, urban planners and policymakers can develop targeted interventions to enhance neighborhood livability, resilience, and functionality.
Difference between capacity C=1000v/s and c=S(g/C).
The two expressions you’ve mentioned relate to transportation or traffic flow, but they refer to different concepts in the context of traffic analysis. Here’s a breakdown:
This represents the capacity of a road or lane, usually expressed in terms of vehicles per second (v/s), vehicles per minute (v/min), or vehicles per hour (v/hr). In this case, C = 1000 v/s means that the maximum number of vehicles that can pass a point in one second is 1000.
This value is typically used to represent the maximum flow rate that can be sustained under ideal conditions, such as without traffic congestion, and with perfect road conditions and driver behavior.
C = S(g/C):
This expression is more of a functional relationship that might represent traffic flow under specific conditions. Here’s what it means:
S: This could represent the space headway, or the distance between successive vehicles (in meters or another unit).
g: This might represent the green time in a signal cycle (the duration during which vehicles are allowed to move through an intersection).
C: This is likely referring to the capacity in a given context, with the function g/C modifying the flow rate.
In this case, the formula suggests a relationship where the flow or capacity is dependent on the green signal time, the space headway, and the existing road capacity. It’s often used in signalized intersection analysis or queuing theory.
To summarize:
C = 1000 v/s is a direct measure of the road’s capacity, indicating the maximum traffic flow rate.
C = S(g/C) is a more complex relationship that accounts for factors like signal timing and headway between vehicles, potentially used for analyzing traffic flow at signalized intersections.
These two expressions are related, but one focuses on overall capacity under ideal conditions, while the other models traffic flow in a specific situation.
Community development is a process where local people come together to take collective action and generate solutions to common problems. It aims to build stronger and more resilient communities by enhancing economic, social, cultural, and environmental well-being. Key objectives include:
Empowerment of marginalized groups
Enhancement of social cohesion and inclusivity
Economic development and employment generation
Infrastructure and service improvements
Environmental sustainability
Approaches to Community Development
Participatory Development: Engages local stakeholders in decision-making.
Asset-Based Community Development (ABCD): Focuses on utilizing existing strengths rather than external aid.
Sustainable Development Approach: Ensures economic growth without depleting natural resources.
Rights-Based Approach: Ensures that community development aligns with human rights principles.
Challenges in Community Development
Resource Scarcity: Limited financial, human, and natural resources hinder progress.
Lack of Community Engagement: Some communities face difficulties in participation due to socio-political constraints.
Political and Bureaucratic Hurdles: Government policies and red tape can slow down initiatives.
Sustainability Issues: Ensuring long-term sustainability of projects is a challenge.
Cultural and Social Barriers: Differences in traditions and beliefs can create resistance to change.
Economic Disparities: Wealth gaps within communities affect equal participation and benefits.
Development-induced displacement occurs when communities are forced to relocate due to large-scale infrastructure projects such as dams, highways, urban expansion, and industrial zones. While these projects drive economic growth, they often disrupt the socio-cultural and economic fabric of affected communities.
Anthropo-Social Considerations
Loss of Livelihoods: Displaced communities often lose traditional jobs like farming, fishing, and artisanal work.
Cultural Disintegration: Forced relocation can sever ties with cultural heritage and social networks.
Psychological Trauma: Displacement creates emotional stress, uncertainty, and identity crises among affected people.
Social Fragmentation: Relocated communities often struggle to integrate into new areas due to differences in language, traditions, or economic conditions.
Legal and Land Ownership Issues: Many displaced individuals lack legal land ownership documents, leading to inadequate compensation.
Resettlement and rehabilitation (R&R) refer to the process of relocating displaced populations and ensuring their socio-economic restoration. Effective R&R policies mitigate the negative impacts of displacement and help communities rebuild their lives.
Key Components of Resettlement & Rehabilitation
Land and Housing Compensation: Providing fair compensation and alternative housing to displaced families.
Livelihood Restoration: Initiatives to provide employment, skill training, and business opportunities.
Infrastructure Development: Ensuring availability of roads, water supply, schools, healthcare, and community centers in resettlement sites.
Legal Protection: Safeguarding the rights of displaced people through legal provisions and frameworks.
Community Integration Programs: Encouraging social cohesion between displaced populations and host communities.
Environmental Rehabilitation: Measures to restore ecological balance post-development projects.
Challenges in Resettlement and Rehabilitation
Inadequate Compensation: Many resettled individuals receive insufficient funds for rebuilding their lives.
Poor Implementation of R&R Policies: Government initiatives often face delays and inefficiencies.
Lack of Employment Opportunities: Resettled communities may struggle with finding sustainable jobs.
Social Conflicts: Tensions between displaced groups and host communities can arise.
Health and Education Gaps: Displaced populations often experience poor healthcare and disrupted education.
Environmental Degradation: Improper planning can lead to ecological damage in resettlement zones.
Conclusion
Community development, development-induced displacement, and resettlement & rehabilitation are interrelated processes requiring a holistic approach. Sustainable development strategies must balance economic growth with social equity and environmental responsibility. Policies should prioritize community participation, fair compensation, and long-term well-being of displaced populations to ensure ethical and effective development practices.
A social group is a collection of individuals who interact with each other, share common interests, and recognize themselves as part of a collective. Social groups play a crucial role in shaping individuals’ behaviors, attitudes, and social identities. Sociologists classify social groups into different types based on the nature of relationships, functions, and influence on individuals. The three primary categories of social groups are primary groups, secondary groups, and reference groups.
1. Primary Groups
Primary groups are small, intimate, and enduring social groups that involve deep emotional bonds among members. These groups are fundamental in the socialization process and significantly impact an individual’s personality and development.
Characteristics of Primary Groups:
Small in Size: Typically consist of a limited number of members, allowing close interactions.
Personal and Intimate Relationships: Members share deep emotional connections, love, and a sense of belonging.
Long-term and Enduring: Relationships in primary groups last for an extended period, often lifelong.
Face-to-Face Interaction: Direct and frequent communication strengthens the bond.
Emotional Support: Members offer care, security, and emotional well-being to one another.
Examples of Primary Groups:
Family
Close friends
Childhood peer groups
2. Secondary Groups
Secondary groups are larger, more impersonal, and goal-oriented social groups where interactions are based on specific objectives rather than emotional ties. These groups are instrumental in achieving professional, educational, or organizational goals.
Characteristics of Secondary Groups:
Large and Formal: Membership is broader, and interactions follow established rules and norms.
Impersonal and Indirect Relationships: Members interact based on roles and responsibilities rather than personal connections.
Short-Term Associations: Membership and participation last only as long as the group’s objective is relevant.
Task-Oriented: The primary purpose of secondary groups is to achieve specific goals rather than nurture personal bonds.
Limited Emotional Involvement: Emotional connection among members is relatively low compared to primary groups.
Examples of Secondary Groups:
Workplaces and professional organizations
Schools and universities
Political parties
Religious institutions
Social clubs and associations
3. Reference Groups
Reference groups serve as a standard for individuals to evaluate their behaviors, attitudes, and values. These groups influence an individual’s self-concept, aspirations, and lifestyle choices, even if the person is not a formal member.
Characteristics of Reference Groups:
Standard for Comparison: Individuals compare themselves to reference groups to assess their own behaviors and achievements.
Aspirational Influence: People often look up to certain groups they aspire to join or emulate.
Positive and Negative Influence: Reference groups can have a constructive influence (motivating improvement) or a destructive influence (leading to harmful behaviors).
Can Be Real or Imagined: A reference group may consist of real-life individuals (e.g., a professional group) or an imagined ideal (e.g., celebrities, historical figures).
Examples of Reference Groups:
Celebrities and influencers
Professional or academic communities
Religious or cultural groups
Sports teams and athletes
Social movements and ideologies
Conclusion
Understanding different types of social groups is essential to comprehending social behavior and interactions. Primary groups foster close, emotional relationships and play a key role in socialization. Secondary groups facilitate functional and goal-oriented interactions, while reference groups influence individuals’ aspirations and self-perception. Each type of social group contributes uniquely to an individual’s social experience and development, shaping their identity and social roles within society.
Voluntary associations are organizations formed by individuals who come together to achieve a common goal without coercion. These groups operate based on shared interests, values, and objectives, and they contribute significantly to society in various sectors, including education, health, environmental protection, and social welfare.
Types of Voluntary Associations:
Charitable Organizations – Focus on providing relief and support to vulnerable populations.
Professional Associations – Represent specific professions, offering networking and policy advocacy.
Community-Based Organizations (CBOs) – Address local community needs.
Advocacy Groups – Work towards policy change and social justice.
Cultural and Recreational Associations – Promote art, culture, and sports activities.
Role and Objectives of NGOs
Non-Governmental Organizations (NGOs) are a subset of voluntary associations that operate independently of government control to address societal challenges. They play a crucial role in development and governance, particularly in countries where state capacity is limited.
Key Roles of NGOs:
Service Delivery – Providing healthcare, education, and social services.
Advocacy and Policy Influence – Shaping public policy and legislation.
Capacity Building – Strengthening local institutions and empowering individuals.
Research and Development – Conducting studies and pilot projects to test innovative solutions.
Environmental Conservation – Promoting sustainable practices and protecting natural resources.
Human Rights Protection – Defending vulnerable groups and ensuring justice.
Objectives of NGOs:
Alleviate poverty and improve living conditions.
Enhance democratic participation and governance.
Promote social equity and justice.
Support sustainable development initiatives.
Bridge gaps in government service provision.
Identifying and Involving NGOs
Engaging NGOs in planning and development requires a structured approach to ensure their effective participation.
Steps to Identify Relevant NGOs:
Sector-Specific Analysis – Identify NGOs based on their expertise (e.g., environmental conservation, urban development, or public health).
Geographical Presence – Select organizations actively working in the target area.
Reputation and Impact – Evaluate past achievements and credibility.
Government and Stakeholder Recommendations – Consider referrals from authorities and partner organizations.
Methods to Involve NGOs in Planning:
Collaborative Planning – NGOs can be included in decision-making bodies and policy forums.
Public Consultations and Workshops – Facilitating dialogue between NGOs, government, and communities.
Capacity Building Partnerships – Providing funding and technical support to NGOs for project implementation.
Monitoring and Evaluation Participation – NGOs can assist in assessing program outcomes and impact.
Operational Issues for NGOs
Despite their contributions, NGOs face several operational challenges that can impact their effectiveness.
Common Operational Issues:
Funding Constraints – Dependence on donor funding can lead to financial instability.
Regulatory Compliance – NGOs must navigate complex legal and bureaucratic requirements.
Accountability and Transparency – Ensuring responsible use of resources and demonstrating impact.
Human Resource Management – Recruiting and retaining skilled personnel.
Stakeholder Coordination – Balancing multiple interests and partnerships.
Political Interference – Governments may impose restrictions or limit NGO operations.
Exploring the Role of NGOs in Planning
NGOs contribute significantly to planning at local, regional, and national levels. They serve as intermediaries between communities and governments, ensuring that development is participatory and inclusive.
Ways NGOs Support Planning:
Community Engagement – Mobilizing local populations and amplifying their voices in planning processes.
Data Collection and Research – Providing critical insights for evidence-based planning.
Pilot and Demonstration Projects – Testing innovative models before large-scale implementation.
Policy Advocacy – Influencing policies to make planning more equitable and sustainable.
Disaster Preparedness and Response – Supporting resilience planning and emergency management.
Conclusion
Voluntary associations and NGOs are integral to the social and economic development of communities. Their role in planning is invaluable, offering innovative solutions, promoting inclusivity, and ensuring sustainable development. However, challenges such as funding, accountability, and stakeholder coordination must be addressed to maximize their impact. Effective collaboration between NGOs, governments, and private entities can lead to more holistic and impactful planning outcomes.
India has an extensive public transportation network, including metro systems, suburban rail, bus rapid transit (BRT), and other public transit services. Here’s a list of top public transport systems in India across different modes:
1. Metro Rail Systems (Rapid Transit) 🚇
Delhi Metro (Largest & most advanced metro system in India)
Mumbai Metro (Expanding network with multiple corridors)
Bengaluru Namma Metro (Well-connected metro system)
Chennai Metro (Efficient air-conditioned metro service)
Kolkata Metro (India’s first metro, now expanding)
Hyderabad Metro (One of the world’s largest PPP metro projects)
Pune Metro (Newly operational with planned expansions)
Ahmedabad Metro (Part of the Smart City development)
Lucknow Metro (Efficient transport system in Uttar Pradesh)
Jaipur Metro (Well-planned but limited network)
2. Suburban Rail Networks 🚆
Mumbai Suburban Railway (Lifeline of Mumbai, carrying over 7.5 million passengers daily)
Kolkata Suburban Railway (Extensive rail network in West Bengal)
Chennai Suburban Railway (Major suburban rail for the city)
Delhi Suburban Railway (Connects NCR regions like Gurgaon, Faridabad)
Hyderabad MMTS (Multi-Modal Transport System) (Suburban rail in Telangana)
3. Bus Rapid Transit (BRT) & City Bus Services 🚌
Ahmedabad BRTS (Janmarg) (Most successful BRT system in India)
Indore iBUS BRTS (Efficient bus rapid transit system)
Pune Rainbow BRTS (BRT corridors in Pune & Pimpri-Chinchwad)
Surat BRTS (Growing and well-managed BRT network)
Delhi DTC & Cluster Buses (Largest city bus fleet)
BEST Buses (Mumbai) (Mumbai’s iconic red buses)
BMTC (Bangalore Metropolitan Transport Corporation) (Largest city bus fleet in Karnataka)
Chennai MTC (Metropolitan Transport Corporation) (Major bus network)
Kolkata WBTC & CSTC Buses (Extensive bus network)
4. Regional & Intercity Transport 🚍
Indian Railways (IRCTC Trains) (Largest rail network for intercity transport)
State Transport Buses (MSRTC, UPSRTC, KSRTC, TSRTC, etc.)
Vande Bharat Express (Semi-High-Speed Trains) (New age express train service)
5. Water Transport 🚢
Kochi Water Metro (First water metro service in India)
Mumbai Ferry Services (Connecting Elephanta, Alibaug, and Navi Mumbai)
Kolkata Ferry Services (Hooghly river transport network)
6. Electric & Shared Mobility 🚖
Ola/Uber Ride-Sharing (Major app-based transport services)
Rapido Bike Taxis (Affordable last-mile connectivity)
E-Rickshaws (Popular in Delhi, UP, and Bihar for last-mile transport)
major Urban Planning Models, their proponents, and the year they were proposed:
1. Concentric Zone Model
Proponent: Ernest Burgess
Year: 1925
Key Idea: Cities grow in a series of concentric rings from the center outward, with the central business district (CBD) at the core.
2. Sector Model
Proponent: Homer Hoyt
Year: 1939
Key Idea: Urban growth occurs in sectors or wedges radiating outward from the CBD along transportation corridors.
3. Multiple Nuclei Model
Proponents: Chauncy Harris & Edward Ullman
Year: 1945
Key Idea: Cities develop multiple centers (nuclei) rather than a single CBD, based on specific land uses such as industrial, residential, and commercial areas.
4. Urban Realms Model
Proponent: James E. Vance Jr.
Year: 1964
Key Idea: Metropolitan areas are made up of distinct realms, each functioning independently but connected to the whole.
5. Central Place Theory
Proponent: Walter Christaller
Year: 1933
Key Idea: Explains the spatial arrangement of cities based on market areas, with larger cities providing more specialized services.
6. Rank-Size Rule
Proponent: George Zipf
Year: 1949
Key Idea: The size of a city is inversely proportional to its rank in the urban hierarchy (e.g., the second-largest city is half the size of the largest city).
7. Growth Pole Model
Proponent: François Perroux
Year: 1955
Key Idea: Economic development is concentrated in certain urban “growth poles” that drive regional development.
8. Garden City Model
Proponent: Ebenezer Howard
Year: 1898
Key Idea: Cities should be planned with self-sufficient communities, surrounded by greenbelts, combining the best of urban and rural living.
9. Radiant City (Ville Radieuse)
Proponent: Le Corbusier
Year: 1924
Key Idea: A high-density, modernist city with skyscrapers, large open spaces, and separation of functions.
10. Linear City Model
Proponent: Arturo Soria y Mata
Year: 1882
Key Idea: Cities should develop along linear corridors following transportation routes, minimizing congestion.
11. Broadacre City Model
Proponent: Frank Lloyd Wright
Year: 1932
Key Idea: Cities should have low-density suburban settlements with large land plots for each family, emphasizing individual mobility.
12. Transit-Oriented Development (TOD) Model
Proponent: Peter Calthorpe
Year: 1993
Key Idea: Urban development should be centered around high-quality public transport systems, with walkable, mixed-use communities.
13. Smart Growth Model
Proponent: Smart Growth Network (Peter Calthorpe and others)
Year: 1990s
Key Idea: Encourages compact, mixed-use, and walkable urban development to reduce urban sprawl.
14. Compact City Model
Proponent: Dantzig & Saaty
Year: 1973
Key Idea: Promotes high-density, mixed-use urban areas with reduced reliance on cars to enhance sustainability.
15. Sustainable City Model
Proponent: Brundtland Commission
Year: 1987
Key Idea: Urban planning should balance environmental, economic, and social sustainability to ensure long-term urban livability.
Toxic elements from industrial waste and pesticides.
Nitrate & Phosphate Levels
mg/kg
Excessive levels lead to soil and water contamination.
Cation Exchange Capacity (CEC)
meq/100g
Measures soil fertility and nutrient-holding capacity.
Microbial Content
CFU/g
Assesses soil health and biological activity.
🔹 Measuring Devices: Soil Test Kits, Atomic Absorption Spectroscopy (AAS).
Conclusion 📊
Each type of pollution has unique measurement parameters crucial for monitoring, control, and policy formulation. Environmental agencies use these parameters to assess pollution levels and implement mitigation strategies.
Would you like details on any specific parameter or measuring instrument? 😊
The National Action Plan on Climate Change (NAPCC) in India consists of 8 core missions, each targeting a specific aspect of climate change mitigation and adaptation.
8 Missions of NAPCC and Their Targets:
National Solar Mission (NSM) 🌞
Promote solar energy development.
Achieve 100 GW solar power capacity by 2022 (now part of a larger 500 GW renewable energy goal by 2030).
National Mission for Enhanced Energy Efficiency (NMEEE) ⚡
Improve energy efficiency in industries.
Reduce energy intensity of GDP.
Promote market-based mechanisms like Perform, Achieve & Trade (PAT) scheme.
National Mission on Sustainable Habitat (NMSH) 🏙
Improve energy efficiency in buildings.
Enhance public transport and waste management.
National Water Mission (NWM) 💧
Improve water conservation and efficiency.
Target 20% reduction in water use by 2030.
National Mission for Sustaining the Himalayan Ecosystem (NMSHE) 🏔
Protect Himalayan glaciers and biodiversity.
Enhance climate resilience for mountain communities.
National Mission for a Green India (GIM) 🌲
Increase forest cover and eco-restoration.
Target 10 million hectares of afforestation by 2030.
National Mission for Sustainable Agriculture (NMSA) 🚜
Promote climate-resilient agriculture.
Improve soil health, water efficiency, and crop diversification.
National Mission on Strategic Knowledge for Climate Change (NMSKCC) 📚
Improve climate change research and data collection.
Enhance awareness and capacity building.
These eight missions are supplemented by State Action Plans on Climate Change (SAPCCs) and additional sector-specific initiatives like Faster Adoption and Manufacturing of Electric Vehicles (FAME).
Social control is the process by which a society regulates the behavior of its members. It’s a way to maintain order and stability, and to prevent negative behavior that could harm others.
1. Understanding Social Control
Social control refers to the mechanisms, strategies, and institutions that societies use to regulate individual and group behavior to maintain order and social cohesion. It ensures that individuals conform to societal norms, values, and laws, thereby preventing deviant behavior and promoting stability. Social control is essential for the smooth functioning of a community, as it creates a balance between personal freedoms and collective interests.
2. Types of Social Control
Social control can be broadly categorized into two types:
Formal Social Control: This involves established institutions such as the legal system, law enforcement agencies, and government regulations that enforce rules through laws, policies, and punishments.
Informal Social Control: This includes unwritten norms, customs, traditions, and societal expectations that guide behavior. It operates through social institutions like family, religion, and peer groups.
3. Mechanisms of Social Control
Several mechanisms help maintain order and cohesion in communities. These include:
A. Legal and Political Mechanisms (Formal Control)
Laws and Regulations – Governments establish legal frameworks that define acceptable behavior and prescribe penalties for violations.
Law Enforcement – Police, courts, and correctional institutions ensure compliance with laws and administer justice.
Government Policies – Public policies and governance structures regulate behavior in economic, social, and political spheres.
B. Social and Cultural Mechanisms (Informal Control)
Norms and Values – Societal expectations shape behavior by defining what is considered right or wrong.
Family and Socialization – Parents, relatives, and community elders teach norms and values, reinforcing positive behaviors.
Religion and Morality – Religious institutions promote ethical behavior and instill a sense of moral responsibility.
Education – Schools and universities teach discipline, civic responsibility, and critical thinking.
Peer Pressure – Friends and social groups influence behavior through acceptance or rejection.
C. Psychological and Emotional Mechanisms
Guilt and Conscience – Internalized moral standards help individuals self-regulate behavior.
Public Opinion and Social Stigma – Fear of social rejection discourages deviant actions.
4. Importance of Social Control in Communities
Maintains Order and Stability – Prevents chaos by ensuring individuals follow common rules.
Promotes Social Cohesion – Strengthens bonds between individuals through shared values.
Protects Rights and Freedoms – Balances personal liberties with collective welfare.
Encourages Positive Behavior – Rewards compliance with norms and discourages deviance.
Conclusion
Social control is fundamental for maintaining order and cohesion in any society. Through formal institutions and informal cultural practices, communities ensure that individuals adhere to shared norms, creating a stable and harmonious social environment. Effective social control mechanisms help in the smooth functioning of society, fostering a sense of belonging and cooperation among its members.
References
Breed, W. (1955). Social control in the newsroom: A functional analysis. Social forces, 326-335.
Dehalwar, K., & Sharma, S. N. (2024). Social Injustice Inflicted by Spatial Changes in Vernacular Settings: An Analysis of Published Literature.
Horwitz, A. V. (1990). The logic of social control. Springer Science & Business Media.
Janowitz, M. (1975). Sociological theory and social control. American Journal of sociology, 81(1), 82-108.
Ross, E. A. (2017). Social control: A survey of the foundations of order. Routledge.
Settlement sociology and migration studies are two interrelated fields that explore how human populations establish communities and how migration patterns influence social, economic, and political structures. Settlement sociology focuses on the development, organization, and transformation of human settlements, while migration studies examine the movement of people across geographic spaces, whether voluntary or forced. Together, these disciplines offer insights into urbanization, rural development, demographic shifts, and policy implications.
Settlement Sociology
Settlement sociology originated as a subfield of sociology that examines how people establish and maintain communities, focusing on aspects such as economic activity, social organization, and governance structures. It encompasses both rural and urban settlements, analyzing the ways in which individuals and groups adapt to their environment and contribute to social cohesion.
Key Aspects of Settlement Sociology:
Urban and Rural Settlements: Examines the structure, function, and dynamics of different types of settlements, from small villages to large metropolitan areas.
Social Institutions: Investigates how families, educational systems, religious institutions, and economic structures shape community life.
Infrastructure and Development: Studies the role of transportation, housing, and public services in shaping settlements.
Social Integration and Conflict: Analyzes issues such as segregation, gentrification, and community resilience.
Environmental Adaptation: Looks at how human settlements evolve in response to environmental challenges and technological advancements.
Migration Studies
Migration studies focus on the movement of people within and across borders, considering economic, social, political, and environmental factors that drive migration. It explores various migration patterns, including voluntary migration for work or education, forced migration due to conflict or natural disasters, and internal migration within a country.
Types of Migration:
Internal Migration: Movement within national borders, such as rural-to-urban migration or interregional migration.
International Migration: Cross-border movement for employment, education, or asylum-seeking.
Forced Migration: Displacement due to war, persecution, natural disasters, or climate change.
Labor Migration: Migration driven by employment opportunities, often leading to remittance economies.
Return Migration: When migrants return to their place of origin after a period abroad.
Key Theories in Migration Studies:
Push-Pull Theory: Explains migration based on factors that push people away from their place of origin (e.g., poverty, conflict) and pull them toward a destination (e.g., economic opportunities, better living conditions).
Network Theory: Highlights the role of social connections and established migrant networks in facilitating migration.
World Systems Theory: Examines migration as a result of global economic inequalities and historical colonial relationships.
Transnationalism: Focuses on how migrants maintain ties with their home countries while integrating into new societies.
Interconnections Between Settlement Sociology and Migration Studies
Settlement sociology and migration studies intersect in several ways, particularly in how migration reshapes settlements and how settlement patterns influence migration flows. Key areas of intersection include:
Urbanization and Migration: Migration is a primary driver of urbanization, with cities expanding as migrants seek economic opportunities.
Social Integration of Migrants: Settlement sociology helps understand how migrants adapt to new communities, addressing issues such as cultural assimilation, discrimination, and social mobility.
Policy and Governance: Both fields inform policies on housing, labor markets, social services, and immigration regulations.
Diaspora and Transnational Communities: Migration leads to the formation of transnational communities, influencing both the origin and destination settlements.
Impact of Climate Change: Rising environmental concerns have led to increased research on climate-induced migration and its impact on settlements.
Conclusion
Settlement sociology and migration studies provide crucial insights into the evolving patterns of human habitation and movement. By understanding how communities are formed, maintained, and transformed by migration, researchers and policymakers can develop strategies to foster inclusive and sustainable societies. As migration continues to shape global demographics, interdisciplinary approaches will be essential in addressing challenges related to urbanization, social integration, and economic development.
References
Anderson, B. (2019). New directions in migration studies: towards methodological de-nationalism. Comparative Migration Studies, 7(1), 1-13.
Dehalwar, K., & Sharma, S. N. (2024). Social Injustice Inflicted by Spatial Changes in Vernacular Settings: An Analysis of Published Literature.
Levitt, P., & Jaworsky, B. N. (2007). Transnational migration studies: Past developments and future trends. Annu. Rev. Sociol., 33(1), 129-156.
King, R. (2012). Geography and migration studies: retrospect and prospect. Population, space and place, 18(2), 134-153.
Pessar, P. (2003). Engendering migration studies. Gender and US immigration: Contemporary trends, 22-42.
Nawyn, S. J. (2010). Gender and migration: Integrating feminist theory into migration studies. Sociology Compass, 4(9), 749-765.
Society is constantly evolving due to various internal and external factors. Two key concepts that help us understand these transformations are social change and social mobility. While both terms describe shifts in societal structures, norms, and individuals’ positions, they differ in scope and impact. This article explores their definitions, differences, and applications in the Indian context.
Social Change
Definition
Social change refers to significant alterations in societal structures, cultural patterns, and institutions over time. It is a broad concept that encompasses shifts in values, beliefs, technology, economic systems, and governance.
Causes of Social Change
Technological Advancements – Innovations like the internet, artificial intelligence, and digital payment systems have transformed social interactions.
Economic Changes – Industrialization and globalization have altered job markets and consumption patterns.
Political Movements – Reforms like the abolition of untouchability and reservation policies have reshaped Indian society.
Cultural and Religious Shifts – Changes in family structures, gender roles, and interfaith interactions reflect evolving societal norms.
Environmental Factors – Climate change and urbanization have led to new societal adaptations.
Examples in Indian Society
Women’s Empowerment – Increased female participation in education and workforce due to legal and social reforms.
Digital Revolution – The rise of mobile banking, e-governance, and online education.
Social Justice Movements – The Dalit movement and LGBTQ+ rights activism have changed societal perceptions and policies.
Social Mobility
Definition
Social mobility refers to the movement of individuals or groups within a society’s hierarchical structure. It can be vertical mobility (moving up or down the social ladder) or horizontal mobility (changing occupations or locations without status change).
Types of Social Mobility
Upward Mobility – Improvement in social status, often through education, employment, or political power.
Downward Mobility – Decline in social status due to economic hardship or job loss.
Intergenerational Mobility – Change in status across generations (e.g., a farmer’s child becoming a doctor).
Intragenerational Mobility – Status change within an individual’s lifetime.
Factors Influencing Social Mobility
Education – A key driver for upward mobility in India.
Caste System – Although weakening, caste still influences mobility.
Economic Opportunities – Access to capital and jobs determines movement within the social hierarchy.
Government Policies – Reservations in education and jobs support marginalized communities.
Examples in Indian Society
Reservation System – Facilitates mobility for Scheduled Castes (SC), Scheduled Tribes (ST), and Other Backward Classes (OBCs).
Entrepreneurship – The rise of self-made business leaders from diverse backgrounds.
Urban Migration – Rural populations moving to cities for better economic opportunities.
Differences Between Social Change and Social Mobility
Aspect
Social Change
Social Mobility
Definition
Transformation in societal structures and cultural patterns
Movement of individuals or groups within the social hierarchy
Scope
Broad, affects society as a whole
Individual or group-based
Causes
Technological, economic, political, cultural factors
Education, economic opportunities, policies
Timeframe
Long-term and gradual
Can be short-term or long-term
Example in India
Abolition of untouchability, digital revolution
A farmer’s child becoming an engineer
Applications in Indian Society
Education Reforms – The expansion of education has led to both social change (greater literacy and awareness) and social mobility (people improving their socio-economic status).
Economic Policies – Initiatives like Skill India and Startup India promote social mobility by offering new employment opportunities.
Urbanization – Migration to cities results in both social mobility (better jobs, income growth) and social change (modern lifestyles, nuclear families).
Caste and Gender Dynamics – Legal protections and affirmative action drive social mobility while changing societal attitudes towards caste and gender roles.
Conclusion
Social change and social mobility are interconnected but distinct phenomena shaping Indian society. While social change alters the broader societal framework, social mobility determines how individuals or groups navigate that framework. Together, they play a crucial role in fostering a more inclusive, progressive, and equitable society.
References
Dehalwar, K., & Sharma, S. N. (2024). Politics in the Name of Women’s Reservation. Contemporary Voice of Dalit, 2455328X241262562.
Dehalwar, K., & Sharma, S. N. (2023). Fate of Slums of Bhopal-A Tale of Struggle and Resilience. Think India Journal, 26(4), 12-18.
Ogbanga, M. M., & Sharma, S. N. (2024). Climate Change and Mental Heat.
Dehalwar, K., & Sharma, S. N. (2024). Social Injustice Inflicted by Spatial Changes in Vernacular Settings: An Analysis of Published Literature.
Ogbanga, M. M. (2024). Assessment of the Barriers to the Adoption of Clean Energy for Household Cooking in Okrika Local Government Area.
Ogbanga, M. M. (2024). Examining the Potential of Women Organisations in Promoting the Use of Clean Energy for Household Cooking; A Study of Okrika Local Government Area.
Ogbanga, M. M. (2024). Vulnerabilities of Youths to Climate Change Impacts: A Case Study of Phalga Local Government Area.
Social stratification is a fundamental aspect of human societies, organizing individuals based on certain hierarchical structures. Two significant systems of stratification are the caste system and the class system. While both determine social positioning and influence an individual’s life experiences, they differ in terms of mobility, rigidity, origin, and the criteria for stratification. This article explores the major differences between these two systems.
Definition and Origins
Caste System
The caste system is a hereditary form of social stratification that divides individuals into distinct, rigid groups based on birth. This system has been historically prevalent in societies such as India, Nepal, and parts of Africa. It is often linked to religious doctrines, especially in Hindu society, where it is associated with the Varna system—Brahmins (priests), Kshatriyas (warriors), Vaishyas (traders), and Shudras (laborers), with Dalits (formerly known as untouchables) outside the hierarchy.
Class System
The class system is an open form of social stratification based on economic status, occupation, education, and wealth. It is more prevalent in industrialized and capitalist societies such as the United States and Europe. Unlike the caste system, class is not strictly determined by birth but rather by achievements, opportunities, and socio-economic conditions.
Key Differences
1. Basis of Stratification
Caste System: Based primarily on birth, religion, and traditional customs.
Class System: Based on economic factors, occupation, education, and achievements.
2. Social Mobility
Caste System: Social mobility is highly restricted; individuals remain in the caste they are born into for life.
Class System: Offers greater mobility; individuals can move up or down the social hierarchy through education, occupation, and economic success.
3. Rigidity vs. Flexibility
Caste System: Highly rigid and unchangeable; inter-caste mobility is almost impossible.
Class System: More flexible; people can change their class through effort and external circumstances.
4. Endogamy vs. Exogamy
Caste System: Encourages endogamy (marriage within the same caste) to maintain social purity.
Class System: Allows exogamy (marriage between different social classes), and social mobility often occurs through marriage.
5. Legal and Social Recognition
Caste System: Legally recognized in some countries, especially where caste-based reservations exist.
Class System: Not legally recognized but exists as an economic and social reality.
6. Impact on Social Relations
Caste System: Creates social divisions with limited interaction between different castes.
Class System: Allows for interaction across classes, though economic disparities may still limit relationships.
7. Economic and Occupational Influence
Caste System: Determines occupation traditionally, with little to no choice in profession.
Class System: Individuals have the freedom to choose their professions based on their skills and interests.
Modern-Day Relevance
Caste System Today
Despite legal abolitions, caste-based discrimination persists in many societies, particularly in India and South Asia. Affirmative action policies, such as reservations in education and employment, aim to uplift marginalized groups.
Class System Today
Class divisions continue to exist in capitalist economies, where income inequality and wealth gaps influence social mobility. Governments implement taxation, social welfare, and education policies to reduce class disparities.
Conclusion
While both the caste system and the class system create hierarchical divisions in society, the former is rigid and birth-based, while the latter is flexible and achievement-based. The caste system is deeply entrenched in tradition and religion, whereas the class system is shaped by economic and social factors. Understanding these distinctions is crucial in addressing social inequality and promoting inclusivity in modern societies.
References
Dehalwar, K., & Sharma, S. N. (2024). Politics in the Name of Women’s Reservation. Contemporary Voice of Dalit, 2455328X241262562.
Dehalwar, K., & Sharma, S. N. (2024). Social Injustice Inflicted by Spatial Changes in Vernacular Settings: An Analysis of Published Literature.
Mukherjee, R. (1999). Caste in itself, caste and class, or caste in class. Economic and political weekly, 1759-1761.
Olcott, M. (1944). The caste system of India. American Sociological Review, 648-657.
Ranadive, B. T. (1979). Caste, class and property relations. Economic and Political Weekly, 337-348.
Sharma, K. L. (1984). Caste and class in India: Some conceptual problems. Sociological Bulletin, 33(1-2), 1-28.
The popular proverb, “When fishermen don’t go to sea, they mend their nets,” carries a profound lesson about preparation, diligence, and continuous improvement. It illustrates the importance of readiness for future opportunities by using periods of inactivity wisely. This adage has practical applications not only for fishermen but for anyone aspiring to achieve success in life. Success does not come by chance; it is the result of deliberate effort, preparation, and foresight.
The Meaning of the Proverb
In the life of a fisherman, the sea represents the place where he toils for his livelihood, casting nets to catch fish. However, fishing trips are not possible every day due to unfavorable weather or other conditions. During these intervals, wise fishermen repair their nets, ensuring they are strong, functional, and ready for the next venture. If they neglect this task, broken or weak nets may fail, leading to a loss of potential catch when they do return to the sea. This metaphor symbolizes that moments of rest or downtime should be used productively to prepare for future endeavors.
The Role of Preparation in Success
Success in any field requires preparation. Just as the fisherman’s net must be mended to ensure a fruitful catch, individuals must invest in self-improvement to seize opportunities when they arise. Preparation builds the foundation for success by enhancing skills, gathering knowledge, and fostering resilience. For students, preparation comes from diligent study and regular practice. For professionals, it involves continuous learning, networking, and refining their craft. The key to progress is recognizing that success is built during the moments when visible achievements seem distant.
Examples from Everyday Life
Consider the life of an athlete. A successful sportsperson does not simply rely on natural talent; they spend countless hours training, practicing techniques, and maintaining physical fitness even when no competitions are in sight. Similarly, a businessperson uses downtime to analyze market trends, refine strategies, and develop contingency plans. Those who ignore preparation risk falling behind when opportunities emerge. History is filled with examples of people who achieved greatness because they used their waiting periods to sharpen their abilities.
The Power of Reflection and Learning
Productive preparation also includes reflection. Taking time to analyze past experiences, both successes and failures, allows for greater insight and improvement. Just as a fisherman checks for weak spots in the net, individuals should evaluate their weaknesses and devise ways to overcome them. Learning from mistakes prevents repeating them, while understanding successes builds confidence for future ventures.
Resilience and Adaptability
Preparation fosters resilience, a key ingredient for success. In a rapidly changing world, being adaptable and ready for challenges is critical. The most successful individuals are those who have not only honed their skills but also anticipated potential obstacles. Like fishermen who adapt their nets for different fish or varying sea conditions, individuals must remain flexible in their strategies and continuously update their knowledge and abilities.
Conclusion
In life, success is rarely achieved by chance. It is the result of careful preparation and thoughtful action. The lesson from the fisherman’s net is a powerful reminder that moments of stillness are not wasted if they are used wisely. Preparing for success requires patience, reflection, and a relentless pursuit of improvement. Whether through learning new skills, planning for the future, or simply strengthening one’s mental and emotional resolve, the secret to success lies in making the most of every moment—even those when there is no immediate reward in sight. By mending our proverbial nets, we ensure that when the sea of opportunity calls, we are ready to answer with confidence and competence.
Spatial planning, also known as urban or regional planning, is a discipline that focuses on the organization and development of land use and physical spaces in urban and rural areas. It involves analyzing, designing, and implementing policies and strategies to guide the spatial distribution of various activities, such as housing, transportation, industry, commerce, recreation, and infrastructure. Spatial planning can be defined as the coordination of practices and policies affecting spatial organization. Spatial planning is synonymous with the practices of urban planning in the United States but at larger scales and the term is often used in reference to planning efforts in European countries.
The goal of spatial planning is to create sustainable, functional, and aesthetically pleasing environments that meet the social, economic, and environmental needs of a community or region. It takes into consideration factors such as population growth, land availability, natural resources, transportation systems, environmental impact, and social equity. Spatial planning is a public policy process that involves the public and private sectors to organize the distribution of people and activities across a region or municipality.
Spatial planning involves a comprehensive and integrated approach to land use management. It typically includes activities such as:
Analysis and assessment: Gathering and analyzing data on the existing conditions, including population demographics, land use patterns, infrastructure, and environmental resources.
Policy formulation: Developing policies, guidelines, and regulations to guide land use and development activities. This may involve zoning regulations, environmental protection measures, transportation plans, and economic development strategies.
Strategic planning: Creating long-term plans and visions for the future development of an area. This includes setting goals and objectives, identifying priority areas for development or preservation, and determining the spatial distribution of different land uses.
Plan implementation: Carrying out the proposed strategies and policies through various means, such as land acquisition, infrastructure development, building codes, and permitting processes.
Stakeholder engagement: Involving the community, interest groups, and other stakeholders in the planning process to ensure their perspectives and concerns are considered. This can include public consultations, workshops, and collaboration with local organizations.
Monitoring and evaluation: Assessing the effectiveness of implemented plans and policies, tracking changes in land use patterns, and making adjustments as needed.
Spatial planning is typically undertaken by government agencies at different levels, including local, regional, and national authorities. It often involves collaboration with various professionals, including urban planners, architects, environmentalists, economists, and social scientists.
Spatial planning aims to create livable, sustainable, and inclusive communities by carefully managing the physical environment and ensuring that land use decisions align with broader social, economic, and environmental objectives.
References
Albrechts, L. (2004). Strategic (spatial) planning reexamined. Environment and Planning B: Planning and design, 31(5), 743-758.
Faludi, A. (2000). The performance of spatial planning. Planning practice and Research, 15(4), 299-318.
Hurlimann, A. C., & March, A. P. (2012). The role of spatial planning in adapting to climate change. Wiley Interdisciplinary Reviews: Climate Change, 3(5), 477-488.
Larsson, G. (2006). Spatial planning systems in Western Europe: An overview.
Lozano-Perez, T. (1990). Spatial planning: A configuration space approach (pp. 259-271). Springer New York.
Olesen, K. (2014). The neoliberalisation of strategic spatial planning. Planning Theory, 13(3), 288-303.
Sharma, S. N., Dehalwar, K., & Singh, J. (2023). Cellular Automata Model for Smart Urban Growth Management.
Sharma, S. N. (2024). Land-Use Zones in Urban Planning. Track2Training.
Vigar, G. (2009). Towards an integrated spatial planning?. European Planning Studies, 17(11), 1571-1590.
In sociology, a settlement refers to a place where people establish a community. It encompasses the physical, social, and economic structures created by humans to live and thrive together. Settlements reflect human interaction with the environment and have evolved through history, influenced by geography, economy, technology, and culture.
Types of Settlements
Settlements are generally categorized based on size, function, and permanence.
1. Rural Settlements
Definition: Small, sparsely populated areas with primary economic activities like agriculture, fishing, or forestry.
Characteristics:
Population density is low.
Houses are often spread out.
Primary focus on agriculture and allied sectors.
Types:
Clustered or Nucleated Settlements: Houses are close together, often around a central point like a market or temple.
Dispersed Settlements: Individual farmsteads are scattered.
Linear Settlements: Develop along roads, rivers, or other linear features.
2. Urban Settlements
Definition: Larger, densely populated areas where secondary and tertiary activities dominate.
Characteristics:
High population density and infrastructure.
Diverse economic activities (industrial, commercial, services).
Types:
Towns: Smaller urban areas with limited services and industries.
Cities: Larger, more complex centers of commerce and culture.
Metropolises: Extremely large cities with significant regional or national influence.
Megalopolis: A vast urban region formed by the merging of multiple cities.
Classification by Permanence
Temporary Settlements: Structures built for short durations, often by nomadic or pastoralist groups.
Permanent Settlements: Long-lasting, structured communities with established infrastructure.
Functions of Settlements
Settlements can also be classified by the functions they perform:
Residential: Primarily for housing, e.g., suburbs.
Commercial: Focus on trade and commerce, e.g., business districts.
Industrial: Where factories and industries are located.
Administrative: Capitals or regional centers with governance structures.
Cultural or Religious: Settlements formed around temples, churches, or other cultural landmarks.
Educational: Settlements with a concentration of academic institutions.
Factors Influencing Settlement Patterns
The development and pattern of settlements are influenced by various physical and socio-economic factors:
Physical Factors:
Topography: Flat lands favor settlements; mountainous areas have dispersed patterns.
Water Supply: Proximity to rivers, lakes, or coastlines influences settlement location.
Natural Resources: Access to fertile soil, minerals, or forests promotes settlement.
Socio-Economic Factors:
Economic Activities: Industrial or commercial areas attract urban settlements.
Transportation: Regions with developed transport networks have more dense settlements.
Political Stability: Peaceful and secure regions promote larger, more permanent settlements.
Settlement Patterns
Settlement patterns describe how buildings and human activity are distributed in a particular area.
Linear Pattern: Houses or settlements are arranged along a road, river, or valley.
Circular Pattern: Found around a central point like a water body or a place of worship.
Grid Pattern: Planned settlements with streets intersecting at right angles, common in modern cities.
Irregular Pattern: Random, unplanned settlements seen in many rural areas.
Urbanization and Settlement Growth
Urbanization refers to the growth of urban settlements as populations move from rural to urban areas. This process has led to:
Expansion of cities and towns.
Increased demand for housing, infrastructure, and services.
Changes in socio-economic structures and lifestyles.
Modern Settlement Trends
Suburbanization: Movement from central urban areas to suburbs.
Gentrification: Transformation of lower-income urban areas into affluent neighborhoods.
Slums and Informal Settlements: Unplanned, overcrowded areas with poor living conditions, common in rapidly urbanizing cities.
Conclusion
Settlements are fundamental to understanding human interaction with the environment and societal organization. The study of settlements helps sociologists and planners address challenges like urban sprawl, housing shortages, and sustainable development. Settlements evolve continuously, reflecting changes in human needs, technology, and the natural world.
References
Dehalwar, K. Defining Neighbourhood, Clusters, and Society: Analyzing Neighborhood Development Patterns.
Dehalwar, K., & Sharma, S. N. (2024). Social Injustice Inflicted by Spatial Changes in Vernacular Settings: An Analysis of Published Literature.
Dehalwar, K., & Sharma, S. N. (2023). Fate of Slums of Bhopal-A Tale of Struggle and Resilience. Think India Journal, 26(4), 12-18.
Johnson, R. D., & Holbrow, C. H. (Eds.). (1977). Space settlements: A design study (Vol. 413). Scientific and Technical Information Office, National Aeronautics and Space Administration.
Myres, J. N. L. (1989). The English Settlements. Oxford University Press, USA.
Rao, H., & Kenney, M. (2008). New forms as settlements. The SAGE handbook of organizational institutionalism, 352-370.
Seto, K. C., Dhakal, S., Bigio, A., Blanco, H., Carlo Delgado, G., Dewar, D., … & Zwickel, T. (2014). Human settlements, infrastructure, and spatial planning.
Sharma, S. N. The Complex Reality of Delhi’s Slums: A Closer Look at Urban Informality.
Skempton, A. W., & MacDonald, D. H. (1956). The allowable settlements of buildings. Proceedings of the Institution of Civil Engineers, 5(6), 727-768.
The PM Gati Shakti mission, aimed at revolutionizing India’s infrastructure, faces critical challenges. Concerns include lack of transparency, inadequate financial planning, project delays, neglect of social and environmental impacts, and fragmented interagency coordination. Addressing these concerns is crucial for the scheme’s effectiveness and long-term sustainability.
The PM Gati Shakti mission, launched with much fanfare, aims to revolutionize India’s infrastructure landscape by integrating and streamlining various modes of transportation. The scheme’s overarching goal of reducing logistical costs, improving efficiency, and boosting economic growth is undeniably commendable. However, a critical analysis reveals several implementation concerns that cast doubt on the scheme’s effectiveness and long-term sustainability.
PM Gati Shakti is a recent initiative launched by the Indian government to boost the country’s infrastructure development and ensure faster and more efficient movement of goods and people. The genesis of this initiative can be traced back to the announcement made by Prime Minister Narendra Modi in his Independence Day speech on August 15, 2021.
In his speech, the Prime Minister highlighted the need for a comprehensive and integrated approach to infrastructure development that would enable the country to meet the demands of a rapidly growing economy. He emphasized the importance of creating a strong and modern infrastructure network that would connect the country’s far-flung regions and help in the efficient movement of goods and people.
To achieve this vision, the government launched the PM Gati Shakti initiative, which aims to integrate the country’s various modes of transportation, including roads, railways, waterways, and airways, into a unified and seamless network. The initiative also seeks to leverage the power of technology to create a digital infrastructure backbone that would enable better monitoring and management of the country’s infrastructure assets.
Under this initiative, the government is also working to create a National Master Plan (NMP) that would serve as a blueprint for infrastructure development in the country. The NMP would bring together various ministries and departments involved in infrastructure development and enable them to work in a coordinated and integrated manner.
In line with the Prime Minister’s vision of expanding the NMP platform for socio-economic development, Social Sector Ministries are being onboarded through a series of meetings. A recent meeting was held to review the adoption of PM Gati Shakti NMP by Social Sector Ministries/Departments, and it was emphasized that there is immeasurable potential for the adoption and augmentation of NMP in social sector planning. 14 Social Sector Ministries/Departments have been onboarded, and their individual portals have been integrated at the backend with the NMP. 61 data layers of Social Sector Ministries related to infrastructure assets have been mapped on NMP, and there is a focus on developing SOPs for data management. The meeting saw participation from all 14 Ministries/Departments, and some ministries showcased their use cases for the adoption of NMP. The Ministry of Women and Child Development has developed a mobile application for data collection regarding Anganwadi Centres, which has resulted in real-time data enrichment on the platform for infrastructure planning. The Department of School Education and Literacy is using the NMP platform to identify suitable sites for opening new schools. Other social sector Ministries are also in the process of identifying assets essential for social sector planning to be uploaded on NMP. Individual portals for 22 infrastructure and user economic ministries and all 36 States/UTs have been created and integrated with the NMP at the backend, with 1460 data layers currently integrated into NMP.
The genesis of PM Gati Shakti in India can be traced back to the Prime Minister’s vision of creating a modern and efficient infrastructure network that would serve as the backbone of the country’s economic growth. Through this initiative, the government aims to bring about a comprehensive and integrated approach to infrastructure development and create a National Master Plan that would serve as a blueprint for the country’s infrastructure development for years to come.
Lack of Clarity and Transparency:
One of the major issues with the PM Gati Shakti mission is the lack of clarity and transparency in its execution. Despite its ambitious objectives, there is a dearth of detailed information regarding the scheme’s operational framework, funding allocation, and implementation timeline. This opacity raises questions about the government’s commitment to transparency and accountability, leaving room for potential mismanagement and corruption.
Inadequate Financial Planning:
While the mission aims to bring about transformative changes, there are serious concerns about its financial viability and sustainability. The PM Gati Shakti Scheme demands substantial financial resources for the development and integration of multiple transport modes. However, the government’s allocation of funds and revenue-generation plans remain vague. Without a comprehensive and transparent financial plan, the scheme may struggle to attract investment and realize its ambitious goals.
Infrastructure Bottlenecks and Project Delays:
India’s infrastructure sector has long been plagued by bottlenecks and project delays. Unfortunately, the PM Gati Shakti Scheme does not appear to adequately address these concerns. The lack of a robust mechanism to tackle bureaucratic red tape, land acquisition challenges, and environmental clearances is a significant hurdle to the timely completion of infrastructure projects. Without addressing these issues, the scheme risks becoming yet another ambitious plan trapped in bureaucratic gridlock.
Neglecting Social and Environmental Impacts:
While the PM Gati Shakti mission emphasizes economic growth and infrastructure development, it seems to overlook the potential social and environmental impacts. The scheme’s focus on rapid expansion and integration may lead to the displacement of communities, destruction of ecosystems, and exacerbation of pollution and climate change. A comprehensive environmental and social impact assessment framework, along with community engagement, should be integral components of the scheme to ensure sustainable and inclusive development.
Fragmented Approach and Interagency Coordination:
Given the complexity and interdependence of India’s transportation systems, the PM Gati Shakti mission’s fragmented approach raises concerns about effective interagency coordination. The lack of a centralized authority responsible for integrating various modes of transport, coupled with the absence of a clear governance structure, may lead to conflicts, inefficiencies, and duplication of efforts. Without robust coordination mechanisms, the scheme’s potential benefits may remain unrealized.
Conclusion:
While the PM Gati Shakti Mission having the vision of transforming India’s transportation infrastructure is undoubtedly laudable, a critical review reveals several pressing concerns. The lack of transparency, inadequate financial planning, infrastructure bottlenecks, neglect of social and environmental impacts, and fragmented approach raise doubts about the scheme’s effectiveness and long-term sustainability. Addressing these issues is crucial for the successful implementation of the scheme and ensuring that it delivers the promised benefits to the nation and its citizens.
The Yamuna Basin, particularly in Delhi, has been plagued by recurring floods caused by heavy rains. These floods have had devastating consequences on both human lives and the environment. To mitigate the impact of such natural disasters and safeguard the well-being of the populace, immediate and proactive measures must be taken to prevent future floods.
Critical Analysis:
Inadequate Infrastructure:
One of the primary causes of flooding in the Yamuna Basin is the inadequate infrastructure in Delhi. The city’s drainage system is ill-equipped to handle heavy rainfall, resulting in the water overflowing into residential areas. Insufficient stormwater drains and poorly maintained canals exacerbate the situation, leading to widespread inundation. The lack of investment and timely upgrades in infrastructure is a critical issue that must be addressed.
Encroachment and Enclosed River Channels:
Over the years, encroachments and unauthorized construction have obstructed the natural flow of the Yamuna River. Many of the river channels have been encased and converted into concrete structures, leaving no room for the river to expand during heavy rains. This not only disrupts the river’s ecological balance but also contributes to flood-related hazards. Strict enforcement of regulations to prevent encroachments and the revival of natural river channels are essential steps towards flood prevention.
Climate Change Impact:
The impact of climate change cannot be ignored when considering the causes of flooding in the Yamuna Basin. Increasingly unpredictable weather patterns and intense rainfall events have become more frequent due to climate change. Therefore, any long-term solution must acknowledge and account for the effects of climate change on the region’s hydrology. This necessitates the development and implementation of climate-resilient infrastructure and urban planning strategies.
Preventive Measures:
Improved Infrastructure:
Investments must be made to enhance the drainage system and build larger and efficient stormwater drains. These should be designed to accommodate heavy rainfall, reducing the risk of flooding in residential areas. Regular maintenance and periodic upgrades of existing infrastructure should also be prioritized.
River Channel Restoration:
Efforts should be directed towards restoring the natural flow of the Yamuna River by removing encroachments and revitalizing river channels. This can help create additional space for floodwaters to dissipate and reduce the pressure on residential areas during heavy rains. Adequate buffer zones should be maintained along the riverbanks to allow for natural expansion during flood events.
Climate-Resilient Urban Planning:
Long-term solutions should focus on incorporating climate-resilient urban planning strategies. This may include building sustainable and green infrastructure, promoting water harvesting and retention systems, and encouraging the use of permeable surfaces to facilitate groundwater recharge. Integrating climate change projections into urban planning frameworks can aid in creating flood-resistant cities.
Public Awareness and Emergency Preparedness:
Public awareness campaigns about flood risks and preparedness measures should be initiated to educate residents about safety protocols and evacuation procedures. Establishing early warning systems and emergency response mechanisms can significantly reduce the impact of floods and save lives.
Conclusion:
The recurring floods in the Yamuna Basin of Delhi demand immediate attention and action. Addressing the issues of inadequate infrastructure, encroachments, and climate change impact are crucial steps in flood prevention. By investing in improved infrastructure, restoring natural river channels, incorporating climate-resilient urban planning, and promoting public awareness, we can pave the way for a more resilient future, safeguarding lives and property from the devastating effects of flooding.
References
Kumar, M., Sharif, M., & Ahmed, S. (2019). Flood risk management strategies for national capital territory of Delhi, India. ISH Journal of Hydraulic Engineering, 25(3), 248-259.
Mazumder, S. K., Dhillon, M. S., & Kanwal, A. (2018). River Action Plan, Flood Management & Basin Development. Lead paper in a Souvenir “River Action Plan, Flood Management & Basin Development” published by Consulting Engineers Association of India, 27-28.
Patel, R. S., Taneja, S., Singh, J., & Sharma, S. N. (2024). Modelling of Surface Runoff using SWMM and GIS for Efficient Storm Water Management. CURRENT SCIENCE, 126(4), 463.
Sharma, M., Rawat, S., Kumar, D., Awasthi, A., Sarkar, A., Sidola, A., … & Kotecha, K. (2024). The state of the Yamuna River: a detailed review of water quality assessment across the entire course in India. Applied Water Science, 14(8), 175.
Tomar, P., Singh, S. K., Kanga, S., Meraj, G., Kranjčić, N., Đurin, B., & Pattanaik, A. (2021). GIS-based urban flood risk assessment and management—a case study of Delhi National Capital Territory (NCT), India. Sustainability, 13(22), 12850.
With reference to podcast on ‘Understanding Urban Digitalisation Projects in India: Platformisation, Infrastructuring, and Datafication’
Urban databases play a crucial role in shaping economic decision-making in urban environments. They serve as valuable repositories of information related to demographics, infrastructure, and various socio-economic factors. The availability and effective use of urban data can significantly enhance the understanding of urban dynamics, enabling policymakers and businesses to make more informed decisions. The discourse surrounding the use of urban databases for enhancing economic decision-making is a topic of increasing significance in the realm of urban planning and governance. This critical review aims to analyze the strengths and limitations of the concept, drawing upon the broader implications and challenges discussed in relevant literature.
One of the key strengths emphasized in the discourse is the potential for urban databases to provide a comprehensive understanding of the intricate dynamics within urban environments. By amalgamating data on demographics, infrastructure, and socio-economic factors, these databases promise to offer policymakers and businesses invaluable insights for more informed decision-making processes. This multifaceted approach is particularly laudable, given the complexity of urban ecosystems. However, a critical lens reveals certain limitations in the implementation and utilization of urban databases. One notable concern is the inherent challenge of data accuracy and reliability. The quality of decisions made based on urban databases is contingent on the accuracy of the data input. Inaccuracies, biases, or outdated information may lead to flawed analyses and misguided decisions. Additionally, issues of data privacy and security loom large, raising questions about the ethical considerations in the collection and storage of sensitive urban information.
Furthermore, the article under scrutiny may touch upon the potential pitfalls of over-reliance on quantitative data at the expense of qualitative insights. While databases provide a wealth of statistical information, they may fall short in capturing the nuanced, context-specific intricacies of certain urban phenomena. A comprehensive understanding of an urban environment requires a balanced integration of both quantitative and qualitative data. The review should also consider the contextual relevance of urban databases. The effectiveness of these databases may vary across different urban settings, influenced by factors such as governance structures, technological infrastructure, and socio-cultural contexts. The universal applicability of urban databases for economic decision-making should be critically evaluated, and efforts should be made to tailor these tools to specific urban landscapes.
In conclusion, while the concept of utilizing urban databases for better economic decision-making is promising, a critical review reveals a nuanced landscape of opportunities and challenges. The strength lies in the potential for comprehensive insights, but caution is warranted regarding issues of data accuracy, privacy, and contextual relevance. As the discourse continues to evolve, addressing these concerns will be paramount to harnessing the full potential of urban databases for effective economic decision-making in urban contexts.
References
Parkar, K., Zérah, M.-H., & Mittal, G. (2023). Understanding Urban Digitalisation Projects in India: Platformisation, Infrastructuring, and Datafication. Economic and Political Weekly, 58(14), 53–60.
Urban landscapes are constantly changing due to various factors such as human interventions, natural forces, and community actions. These transformations are aimed at meeting the needs of the people using the urban spaces, taking into account their social, psychological, political, cultural, financial, physical, and other needs. Urban planning research methods and tools have also been evolving, and this paper discusses the contemporary methods, tools, and technologies used in urban planning research. The article applies current trends and examples to illustrate the employment of these methods in designing, developing, and operating urban spaces. This paper aims to be a valuable introductory reference for emerging researchers in urban planning, particularly for undergraduate and postgraduate students with limited exposure to urban planning research. However, established researchers in the discipline can also find this article useful. The authors conclude that future research should not disregard established research techniques in addressing urban vulnerabilities.
Keywords
Research Methods, Urban Planning, Research Tools, Urban Governance, Sustainability
Introduction
Urban planning, like other disciplines, heavily relies on research to progress and adapt. Failure to do so can cause the discipline to become obsolete in today’s rapidly changing world. The Frascati Manual defines research and experimental development as creative work done systematically to increase knowledge of humans, culture, and society, and to develop new applications based on that knowledge. Universal research methods applicable to both physical and social sciences are identified by Gulbrandsen and Kyvik (2010), and this paper adopts three key research methods in urban planning: basic research, applied research, and experimental development.
In addition to these methods, Parnell and Piertese (2015) identify other modes of generating new knowledge in urban planning, including pure research, embedded research, city labs, professional networks, cityscapes, and exhibitions. This paper focuses on discussing the first three modes in detail, along with relevant examples of embedded techniques, and provides an overview of the other modes that readers can explore further. The following section on research technologies and tools will explain some of the latter modes identified by Parnell and Piertese (2015).
Findings and Discussion
Basic research, also known as pure or fundamental research, is focused on exploring and explaining the fundamental principles behind the functioning of the world. The OECD (2002) defines basic research as experimental or theoretical work undertaken purely to acquire new knowledge of observable phenomena and the underlying facts behind them. The aim of this research is to satisfy the curiosity of the researcher and to increase the existing base of scientific knowledge by presenting theoretical perspectives or alternatives to explain certain phenomena or behaviors in society. Pure research in urban planning involves examining existing theories, redesigning them or proposing new ones to offer better explanations for phenomena, such as the current drive to have green urban infrastructure to combat global warming or studies to develop theories on smart cities (Palys, 2018).
Pure research is not problem-solving, but it seeks to justify the status of a phenomenon, even if its applications may or may not have any use in the immediate or long-term future. Pure research in urban planning seeks to enhance an understanding of past legacies through an analysis of diverse aspects of urban complexity, such as culture, social identities, resource flows, labor regimes, regulations, urban politics, welfare regimes, and the design of a city. Pure research is often undertaken by universities and other higher-caliber research centers, but private commercial entities also engage in it resulting in theoretical researchers being drawn from there (Palys, 2018).
Pure research is primarily aimed at expanding the theoretical basis of a phenomenon, feeding researchers’ curiosities, and resulting in new ways of doing things (innovations) that then feed into investments and remodeling of the way things are done. Through pure research, old theories, standards or formulae can be tested, and those found to be incomprehensive or nonsensical are discarded. Pure research can be exploratory, descriptive or causal in nature, and it largely involves observation, polls/surveys, interviews, and focus group discussions as its primary means of investigation (Palys, 2018; Parnell & Pieterse, 2015).
In contrast to pure research, applied research aims to provide immediate solutions to existing problems and is based on pre-existing theories and assumptions from pure research. It uses its findings to address real-world issues, aids in decision-making, and enables policy and programme development. Applied research encompasses a range of methods, from large scale surveys to complex lab experiments, and is problem-solving in nature. It focuses on felt needs and non-hypothetical problems based on factual evidence to suggest meaningful solutions and testable hypotheses. Three types of applied research within social sciences include descriptive, experimental, and mixed-method studies. The applied research process involves defining the research problem, planning the study, executing data collection and analysis or experimentation, and reporting on findings with follow-up. Descriptive studies aim to paint a picture of a phenomenon, while correlational studies report negative, positive, or zero correlation between variables. Cross-sectional studies collect data from many different individuals, groups, or locations at the same time to observe variations or consistency in variables.
Klosterman (2015) describes experimental development in urban planning as the process of designing and redesigning land use maps over multiple decades, which are essential for determining land use regulations. On the other hand, Gulbrandsen & Kyvik (2010) define experimental development as a research methodology that aims to fill technical knowledge gaps to improve existing technologies or create new ones to address societal issues. Experimental development often leads to tangible products, such as software, hardware, or techniques that increase efficiency and effectiveness in service delivery. The goal of experimental development is to create prototypes that will lead to actual development. The OECD distinguishes between basic, applied research, and experimental development, which can transition from one to the next in a specific order. The primary aim of experimental development is to make technical improvements on products or processes, such as developing image processing technologies used in urban policing or alternative modes of transport and communication, among others.
here is a comparative table that summarizes the relationship between basic research, applied research, and experimental development:
Category
Goal
Output
Examples
Basic Research
Expand scientific knowledge and understanding
Theoretical frameworks, concepts, and principles
Research on subatomic particles, DNA structure
Applied Research
Solve practical problems by applying scientific ideas
Solutions to specific problems or issues
Developing a vaccine for a disease, improving a product
Experimental Development
Make technical improvements to products or processes
Developing image processing technologies for urban policing, alternative modes of transportation, innovative architectural designs
Note that there is some overlap between the categories and there may not always be a clear distinction between them. Additionally, the output of each category can inform and influence the others, leading to a cycle of innovation and discovery.
Parnell & Pieterse (2015) identified embedded research as a significant mode of undertaking urban planning studies, which involves close partnership between researchers and practitioners to co-produce outputs for society’s gains. This collaboration between academia and development organizations allows for the alignment of field practices with theory to address challenges in the use of developed technologies and practice models. Embedded research is a bridge that allows mutual collaboration and benefits between academia and industry practitioners. McGinity & Solakangas (2014) report that embedded research borrows from embedded journalism, which involves US media reporters being within the war environment and updating their audiences. While there are contradicting opinions on research methodologies, Palys (2018) insists that these categorizations of studies as either pure, applied, or experimental are strictly based on the motivation that compels a researcher to undertake a study at the beginning, whereas Gulbrandsen & Kyvik (2010) argue that there is very little difference between basic research, applied research, and experimental design. However, it is important to note that applied research and experimental development work does not necessarily have to take place in university labs. Many innovations driving the urban growth and development agenda today did not originate from urban planners, such as online shopping, which has been very vital in helping the world’s cities and their residents cope with the COVID-19 pandemic. The rise of online taxi services and shared rides also reduces the number of cars on the roads across cities, contributing to fighting transport-related greenhouse gas emissions and global warming. Although widely held perceptions exist that basic research no longer takes place in universities, many theories are still emerging in various disciplines, including urban and regional planning.
Conclusions
The authors argue that standardized urban research methodologies are inadequate for planning the development of cities. They suggest that the unique qualities of each city should be documented and incorporated into future planning. The authors note that research on urban planning is often constrained by a lack of funding and researchers willing to undertake field surveys. The authors also highlight the importance of community-based enumeration and participatory urban planning in ensuring that the needs of urban residents and decision-makers are met. However, the rapid pace of change in urban planning has created a gap in research, leaving many citizens unable to cope with the technological advancements being made. The authors call for the deliberate retention and incorporation of human-led studies on the urban environment, alongside the use of AI to solve urban problems.
References
Andrew, C. O., & Hildebrand, P. E. (1983). Planning and Conducting Applied Agricu tural Research. Canadian Journal of Agricultural Economics, 31, 275-277.
Baimyrzaeva, M. (2018). Beginners’ Guide for Applied Research Process: What Is It, and Why and How to Do It? University of Central Asia, 10-26.
Bentley, J. P., Gulbrandsen, M., & Kyvik, S. (2015). The Relationship between Basic and Applied Research in Universities. Higher Education, 70, 689-709 (21 pages). https://doi.org/10.1007/s10734-015-9861-2
Bunnell, T., & Maringanti, A. (2010). Practising Urban and Regional Research beyond Metro- centricity. International Journal of Urban and Regional Research, 34, 415-420. https://doi.org/10.1111/j.1468-2427.2010.00988.x
Cheetham, M., Wiseman, A., Khazaeli, B., Gibson, E. et al (2018). Embedded Research: A Promising Way to Create Evidence-Informed Impact in Public Health. Journal of Pub- lic Health, 40, i64-i70. https://doi.org/10.1093/pubmed/fdx125
Dehalwar, K., & Sharma, S. N. (2023). Fundamentals of Research Writing and Uses of Research Methodologies. Edupedia Publications Pvt Ltd.
Dehalwar, K., & Sharma, S. N. (2024). Exploring the Distinctions between Quantitative and Qualitative Research Methods. Think India Journal, 27(1), 7-15.
Gulbrandsen, M., & Kyvik, S. (2010). Are The Concepts Basic Research, Applied Research and Experimental Development Still Useful? An Empirical Investigation among Nor- wegian Academics. Science and Public Policy, 37, 343-353. https://doi.org/10.3152/030234210X501171
Harding, A., & Nevin, B. (2015). Cities and Public Policy: A Review Paper. Government Office for Science, Foresight.
Jain, Sarika, Kavita Dehalwar, and Shashikant Nishant Sharma. “Explanation of Delphi research method and expert opinion surveys.” Think India 27, no. 4 (2024): 37-48.
Klosterman, R. E. (2015). Urban Planning: Methods and Technologies. In J. D. Wright (Edi- tor-in-Chief) (Ed.), International Encyclopedia of the Social & Behavioral Sciences (2nd ed., Vol. 24, pp. 889-893). Elsevier.
McGinity, R., & Solakangas, M. (2014). Introduction: “Embedded Research” as an Approach into Academia for Emerging Researchers. Management in Education, 28, 3-5. https://doi.org/10.1177/0892020613508863
Ming, T. E. (2021). The Big Read: Feeling Lost in a Digital World, Some Elderly Shun Tech- nology. Today Online Newspaper.
OECD (Organization for Economic Co-Operation and Development) (2002). Proposed Standard Practice for Surveys on Research and Experimental Development (p. 77). Or- ganization for Economic Co-Operation and Development.
Owusu-Ansah, C., Rodrigues, A., & Walt, T. V.D. (2019). Integrating Digital Libraries into Distance Education: A Review of Models, Roles, and Strategies. The Turkish Online Journal of Distance Education, 20, 89-104. https://doi.org/10.17718/tojde.557742
Palys, T., & Atchison, C. (2021). Research Methods in the Social and Health Sciences.
Sage Publishing.
Parnell, S., & Pieterse, E. (2015). Translational Global Praxis: Rethinking Methods and Modes of African Urban Research. International Journal of Urban and Regional Research, 40, 236-246. https://doi.org/10.1111/1468-2427.12278
The debate over whether to refer to oneself as a “Planner” or a “Big Data Scientist” touches on the evolving nature of roles in data management, analytics, and decision-making. Each title implies a different focus, skill set, and approach to handling data and planning activities. To critically discuss this, let’s consider the distinctions and overlaps between the two roles.
1. Definitions and Roles
Planner: Traditionally, a planner is someone who devises strategies, coordinates activities, and allocates resources to achieve specific goals. This role is often seen in urban planning, business strategy, project management, and logistics. Planners focus on creating structured approaches to meet objectives, often relying on historical data, projections, and various planning tools.
Big Data Scientist: A Big Data Scientist, on the other hand, is someone specialized in handling, analyzing, and deriving insights from large volumes of complex data. This role involves using statistical methods, machine learning, and data mining to extract patterns, trends, and actionable insights from data. Big Data Scientists work extensively with structured and unstructured data, often using advanced computational techniques and software.
2. Skill Sets
Planners typically possess skills in project management, strategic thinking, resource allocation, and risk management. They may use data, but their focus is on the practical application of this data to achieve specific goals. Tools used by planners may include project management software, GIS (for urban planners), and various planning frameworks.
Big Data Scientists require strong analytical skills, proficiency in programming languages like Python or R, expertise in data analysis tools, and a deep understanding of statistical methods and machine learning algorithms. They must be able to work with large datasets, perform complex data manipulations, and create predictive models.
3. Approach to Data
Planners use data to support their planning processes but may not engage deeply with the data itself. Their focus is more on how to use available information to make strategic decisions. Data is one of many inputs into a broader decision-making process.
Big Data Scientists focus on the data itself. Their primary role is to uncover insights from data, which can then inform planning and decision-making processes. They are more concerned with the data’s quality, structure, and the methods used to analyze it.
4. Evolving Roles and Convergence
The line between planners and big data scientists is increasingly blurred. Modern planning often requires data-driven insights, and thus planners may need skills in data analysis. Conversely, Big Data Scientists might be involved in strategic planning based on the insights they generate. This convergence is seen in fields like smart city planning, where urban planners use big data analytics to understand traffic patterns, energy usage, and other urban dynamics.
5. Context and Industry Differences
In business contexts, a planner might focus on market strategies, supply chain logistics, or operational efficiency. A Big Data Scientist in the same company might analyze customer data, optimize product recommendations, or predict market trends. While both roles contribute to the company’s success, they do so in different ways.
In public policy or urban planning, a traditional planner might focus on land use, zoning, and community development. A Big Data Scientist could analyze social media data, census information, or transportation data to provide insights that shape these planning decisions.
6. Implications for Identity and Title
Choosing to call oneself a “Planner” or a “Big Data Scientist” reflects not only the skills one possesses but also the role one plays in the organization.
A Planner might emphasize their strategic, big-picture thinking, and their ability to integrate various inputs into a coherent plan. They may see their role as guiding an organization or community toward specific goals.
A Big Data Scientist might emphasize their technical skills, their ability to manage and analyze large datasets, and their role in uncovering hidden insights. They may see their role as providing the data-driven evidence needed to make informed decisions.
Conclusion
The choice between calling oneself a “Planner” or a “Big Data Scientist” ultimately depends on one’s primary focus and approach to their work. While there is overlap, the distinction lies in whether the individual is more focused on the strategic application of insights (Planner) or on the technical generation of those insights from data (Big Data Scientist). As roles continue to evolve with the integration of data science into various fields, professionals might increasingly identify with both roles, or new titles might emerge to capture this convergence.
References
Batty, M. (2013). Big data, smart cities and city planning. Dialogues in human geography, 3(3), 274-279.
Hazen, B. T., Boone, C. A., Ezell, J. D., & Jones-Farmer, L. A. (2014). Data quality for data science, predictive analytics, and big data in supply chain management: An introduction to the problem and suggestions for research and applications. International Journal of Production Economics, 154, 72-80.
Kayabay, K., Kılınç, A., Gökalp, M. O., Gökalp, E., & Daim, T. U. (2024). Technology Roadmapping: Data Science Roadmapping of Networked Organizations’ Strategic Planning for Artificial Intelligence. Future‐Oriented Technology Assessment: A Manager’s Guide with Case Applications, 273-300.
Sharma, S. N., Singh, D., & Dehalwar, K. Surrogate Safety Analysis-Leveraging Advanced Technologies for Safer Roads.
Shen, Z., & Li, M. (Eds.). (2017). Big Data Support of Urban Planning and Management: The Experience in China. Springer.
Steif, K. (2021). Public policy analytics: code and context for data science in government. CRC Press.
Van Der Aalst, W., & van der Aalst, W. (2016). Data science in action (pp. 3-23). Springer Berlin Heidelberg.
The Dr. A.P.J. Abdul Kalam Young Research Fellowship (AKYRF) is an esteemed initiative established to encourage young researchers and scholars to make significant contributions to scientific and technological advancements in India. Named after Dr. A.P.J. Abdul Kalam, one of India’s most celebrated scientists and the 11th President of India, the fellowship is designed to honor his legacy of inspiring and nurturing young minds, fostering innovation, and promoting excellence in research.
Key Features and Objectives of the Fellowship
Inspiration from Dr. A.P.J. Abdul Kalam’s Vision: Dr. Kalam was deeply passionate about empowering youth and advancing India’s scientific and technological capabilities. The fellowship aims to continue his vision of fostering scientific and technological research, particularly in the fields of defense, space technology, and other cutting-edge areas that can contribute to the nation’s development.
Target Audience: The fellowship is primarily designed for young researchers, typically in the early stages of their career. The eligibility criteria often include:
Age limit (usually below 30 or 35 years depending on the program guidelines).
Researchers, scientists, or academicians working in areas aligned with Dr. Kalam’s vision of national progress, such as aerospace, defense, energy, environmental studies, and related fields.
Fields of Research: The fellowship encourages interdisciplinary research, with particular emphasis on areas of high strategic importance to India, such as:
Aerospace and space technology
Defense and national security
Renewable energy technologies
Biotechnology and healthcare
Environmental sustainability
Advanced computing and artificial intelligence
Research Grants and Support:
Funding: The fellowship provides financial support for research, including stipends for the researchers, travel grants, and project-based funding to carry out experiments and field studies.
Facilities and Infrastructure: Fellows are often provided access to world-class research facilities and labs, either within renowned institutions or through collaborations with industry partners.
Networking and Mentorship: Fellows have the opportunity to interact with leading scientists, professionals, and mentors, creating a conducive environment for learning, innovation, and growth.
Duration and Structure: The fellowship may typically last for one to two years, depending on the scope of the research proposal. During this time, the selected fellows are expected to focus on their research topics, present progress reports, and possibly engage with industry or academic institutions for collaboration.
Collaboration and Industry Linkages: One of the core aspects of the fellowship is its emphasis on collaboration with government research organizations, academic institutions, and industries. This creates a platform for translating research into practical, real-world applications that can benefit society and the country.
Promotion of Innovation: In line with Dr. Kalam’s own passion for innovation, the fellowship encourages young researchers to think creatively and engage in projects that have the potential for breakthroughs in scientific and technological knowledge.
Post-Fellowship Opportunities: After completing the fellowship, researchers often continue their work with further academic pursuits, industry partnerships, or as part of government projects. Many fellows go on to lead innovative projects, become part of strategic national institutions, or establish their own research initiatives.
Selection Criteria
The selection process for the Dr. A.P.J. Abdul Kalam Young Research Fellowship is rigorous and highly competitive. Some typical criteria include:
Academic Excellence: Applicants must have a strong academic background, usually with at least a postgraduate degree in the relevant field.
Research Proposal: A well-articulated research proposal outlining the objectives, methodology, expected outcomes, and potential impact of the research.
Recommendations: Letters of recommendation from academic or industry professionals who can vouch for the applicant’s capabilities and potential.
Innovative Thinking: The fellowship looks for individuals who exhibit original thinking, the ability to solve complex problems, and a desire to create a tangible impact on society.
Impact and Legacy
The Dr. A.P.J. Abdul Kalam Young Research Fellowship is more than just a financial aid program. It stands as a testament to Dr. Kalam’s commitment to nurturing the next generation of scientists and innovators. By focusing on high-impact areas such as defense, space exploration, and sustainability, the fellowship plays a crucial role in supporting India’s growth as a global leader in technology and research.
Many of the fellows go on to make significant contributions to their respective fields, advancing both scientific knowledge and the practical application of that knowledge. Moreover, the fellowship fosters a spirit of inquiry and excellence among the youth, aligning with Dr. Kalam’s vision of a developed India driven by innovation, research, and collaboration.
Conclusion
The Dr. A.P.J. Abdul Kalam Young Research Fellowship is a prestigious program that plays a pivotal role in supporting and motivating young researchers to pursue innovative and impactful scientific research. By providing financial support, research infrastructure, and valuable mentorship, it honors the legacy of Dr. A.P.J. Abdul Kalam and helps realize his dream of a technologically advanced and self-reliant India.
TERRE Policy Centre, environmental NGO based in Pune, Maharashtra dedicated to sustainable solutions, organises a Fellowship program every year for the young researchers of India in the remembrance of Late President and Scientist Dr. A. P. J. Abdul Kalam. This year we have announced the 07th Edition of Dr. A. P. J. Abdul Kalam Young Research Fellowship 2024-25.
Requesting you to encourage the young researchers of your University and Institutes to actively participate in the fellowship to make a considerable change for the future generation of our nation.
Important Dates: • Announcement of fellowship programme – 15th October 2024
Registration Open – 16th October 2024
Registration Last Date – 16th January 2025
Evaluation – March 2025
Interview of shortlisted applicants – April 2025
Result – May 2025
Fellowship Awardees Announcement – 27th July 2025
Attached below are the details of the fellowship.
Please consider the attached file as a personal invitation and kindly circulate the information among the students.
The inclusion of women in management positions is a critical marker of gender equality and organizational diversity. Over the decades, there has been progress in bridging the gender gap in leadership roles, but significant challenges remain. This discussion explores the current landscape, benefits of gender diversity in management, barriers faced by women, and strategies for achieving equitable representation.
1. Current Status of Women in Management
Global Trends: Despite growing awareness, women remain underrepresented in management positions worldwide. According to reports by organizations like the International Labour Organization (ILO) and McKinsey, women occupy about 29% of senior management roles globally as of 2023, with significant variation across industries and regions.
Regional Disparities:
In North America and Europe, women have made strides, particularly in the corporate and public sectors, supported by diversity policies and quotas.
In Asia-Pacific and the Middle East, cultural norms and societal expectations pose barriers, resulting in slower progress.
In Sub-Saharan Africa, entrepreneurship among women has risen, but their presence in formal management roles remains limited.
Industry-Specific Representation: Women are better represented in industries like healthcare, education, and hospitality, but their presence is significantly lower in technology, engineering, and manufacturing sectors.
2. Benefits of Women in Management
Enhanced Organizational Performance: Studies consistently show that companies with diverse leadership teams outperform those without in terms of profitability, innovation, and decision-making quality. Diverse perspectives lead to better problem-solving and strategic planning.
Improved Workplace Culture: Women leaders often promote inclusive workplace policies and practices, fostering an environment of collaboration, trust, and employee satisfaction.
Social and Economic Growth: Gender-diverse management contributes to economic growth by leveraging the full talent pool. When women thrive in leadership roles, they inspire and mentor future generations.
3. Challenges Facing Women in Management
Structural Barriers:
Glass Ceiling: Unofficial barriers prevent women from advancing to top leadership roles despite qualifications and performance.
Pay Gap: Women in management often earn less than their male counterparts for similar roles, perpetuating financial inequity.
Societal and Cultural Norms:
Gender stereotypes portray leadership as a predominantly male domain, creating biases in hiring and promotion.
Women often face societal expectations to prioritize family responsibilities, limiting their career advancement opportunities.
Organizational Challenges:
Lack of mentorship and sponsorship opportunities hinders career progression for women.
Workplace cultures that favor “masculine” leadership traits can marginalize women with different leadership styles.
Intersectional Disparities: Women from marginalized communities face compounded discrimination based on race, ethnicity, or socio-economic status, further limiting their opportunities.
4. Strategies to Promote Women in Management
Policy Interventions:
Quotas and Targets: Governments and organizations can set targets for female representation in leadership to drive accountability.
Equal Pay Policies: Enforcing transparency in pay structures ensures women receive equitable compensation.
Organizational Initiatives:
Leadership Development Programs: Offering training and development opportunities tailored to women prepares them for managerial roles.
Flexible Work Policies: Enabling work-life balance through remote work, parental leave, and flexible hours supports women in leadership.
Diversity and Inclusion Committees: Establishing committees to monitor and promote diversity initiatives ensures sustained progress.
Mentorship and Sponsorship: Senior leaders should mentor and sponsor aspiring women managers, providing them with guidance, networking opportunities, and advocacy.
Addressing Biases: Conducting unconscious bias training helps organizations identify and mitigate discriminatory practices in recruitment, evaluation, and promotion.
5. Case Studies
Norway’s Gender Quota in Boardrooms: Norway introduced a mandatory quota requiring 40% of board members in public companies to be women. This policy significantly increased female representation in senior roles and inspired similar initiatives globally.
Lean In Movement: Founded by Sheryl Sandberg, this initiative encourages women to pursue leadership roles while advocating for systemic changes in workplace policies and culture.
UN Women’s Empowerment Principles (WEPs): The WEPs provide guidance to businesses on promoting gender equality in the workplace, marketplace, and community. Companies adopting these principles report better gender balance in management.
6. Future Directions
Technological Innovation: Leveraging technology to provide virtual mentorship, networking platforms, and data-driven approaches to address gender disparities can accelerate change.
Focus on Intersectionality: Policies must consider intersectional barriers to ensure inclusivity for all women, including those from underrepresented groups.
Corporate Accountability: Organizations should publish annual diversity reports and set measurable goals to track progress in promoting women in management.
Cultural Shifts: Encouraging society to redefine leadership as inclusive and diverse is crucial. Schools, media, and community programs can play a role in challenging stereotypes.
7. Conclusion
The presence of women in management positions is not only a matter of fairness but also a strategic imperative for organizations aiming to thrive in a competitive, globalized world. While progress has been made, achieving gender parity in leadership requires a collective effort from governments, organizations, and society at large. By dismantling systemic barriers, promoting inclusive policies, and fostering cultural change, the vision of gender-equal leadership can become a reality.
References
Broadbridge, A., & Simpson, R. (2011). 25 years on: reflecting on the past and looking to the future in gender and management research. British journal of management, 22(3), 470-483.
Brush, C. G. (1992). Research on women business owners: Past trends, a new perspective and future directions. Entrepreneurship theory and practice, 16(4), 5-30.
Dehalwar, K., & Sharma, S. N. (2024). Politics in the Name of Women’s Reservation. Contemporary Voice of Dalit, 2455328X241262562.
Lyness, K. S., & Terrazas, J. M. (2006). Women in management: An update on their progress and persistent challenges. International Review of Industrial and Organizational Psychology 2006, 21, 267-294.
Madsen, S. R. (2012). Women and leadership in higher education: Current realities, challenges, and future directions. Advances in Developing Human Resources, 14(2), 131-139.
The incidents of women lynching in Manipur have drawn significant attention to the issue of vigilantism and the dangers it poses, particularly to vulnerable groups such as women. It’s important to address the issue of mob attacks on women in the context of India and examine the complex factors contributing to such incidents. India, like many other societies, has deep-rooted gender inequalities and a patriarchal social structure. Despite significant progress in women’s rights and empowerment, there are still pockets of society where traditional gender norms and attitudes persist, leading to the marginalization and vulnerability of women. Some cultural norms and beliefs may perpetuate the notion that women are subordinate to men and should not challenge authority. This can result in the objectification and disrespect of women, making them targets of mob attacks in certain situations. In some cases, mob attacks on women may be used as a means of exerting control or punishment. Women who are perceived as deviating from societal norms or who assert their rights and freedoms may face hostility from conservative elements.
Despite progress in women’s empowerment, there are still areas where women face limited access to education, healthcare, and economic opportunities. This lack of empowerment can make them more susceptible to violence and abuse. The effectiveness of law enforcement and the justice system in addressing crimes against women can vary widely across regions in India. Weak law enforcement and slow justice processes may embolden perpetrators and encourage mob violence. Mob attacks often involve a group mentality where individuals may feel less accountable for their actions, leading to a sense of impunity. This can lead to the escalation of violence, especially against vulnerable targets like women. In some cases, mob attacks against women may be linked to underlying communal or caste tensions. Women from minority or marginalized communities may be targeted as part of larger conflicts.
Addressing these issues requires a multi-faceted approach:
Promoting gender equality and women’s empowerment through education, awareness campaigns, and economic opportunities.
Strengthening law enforcement and the justice system to ensure swift and fair action against perpetrators of violence.
Challenging cultural norms and beliefs that perpetuate gender inequality and discrimination.
Encouraging community engagement and dialogue to counter mob mentality and promote respect for women’s rights.
Enhancing women’s safety through measures like improved street lighting, safe public transportation, and community watch programs.
It’s important to recognize that progress is being made in India towards addressing these challenges, and numerous individuals and organizations are working tirelessly to improve the status of women and their safety. However, the issue remains complex and will require sustained efforts from all sections of society to achieve lasting change.
Animal husbandry, the practice of raising and breeding animals for various purposes, has been an integral part of human civilization for thousands of years. It plays a crucial role in improving livelihoods worldwide, particularly in rural communities. Animal husbandry offers a wide range of benefits, including food security, economic opportunities, environmental sustainability, and social development. This essay explores the usefulness of animal husbandry in enhancing livelihoods and highlights its significance in meeting the challenges of a rapidly changing world.
Food Security and Nutrition
One of the primary advantages of animal husbandry is its contribution to food security and nutrition. Livestock serves as an essential source of high-quality protein, essential minerals, and vitamins. Animal products such as meat, milk, and eggs provide vital nutrients necessary for human growth and development. Moreover, animal husbandry diversifies dietary options, making communities less reliant on a limited range of crops. This resilience is especially valuable in areas prone to agricultural risks, such as droughts or pests, as livestock can utilize marginal lands and convert low-quality forage into valuable protein sources.
Economic Opportunities
Animal husbandry offers numerous economic opportunities, particularly for rural communities. Livestock production creates jobs along the entire value chain, from breeding and rearing animals to processing and marketing animal products. Many small-scale farmers and pastoralists depend on livestock as a primary source of income and livelihood. By engaging in animal husbandry, individuals can generate a sustainable income, improve their financial stability, and escape the cycle of poverty.
Furthermore, animal husbandry contributes to rural economies by stimulating local markets. It encourages the growth of supporting industries such as veterinary services, animal feed production, and equipment manufacturing. Additionally, the sale of animals and their by-products generates revenue that can be invested in education, healthcare, and infrastructure development, leading to overall community advancement.
Environmental Sustainability
Animal husbandry, when practiced sustainably, plays a vital role in environmental conservation. Well-managed livestock systems can contribute to soil fertility, enhance nutrient cycling, and promote biodiversity. Animals, through their grazing patterns, help maintain grasslands and prevent the encroachment of invasive species. Moreover, livestock waste can be used as organic fertilizer, reducing the dependency on chemical inputs and enhancing soil health.
Furthermore, animal husbandry can foster sustainable land management practices. By employing rotational grazing and adopting agroforestry techniques, farmers can optimize land utilization and minimize soil erosion. Additionally, integrated farming systems that combine crop cultivation with livestock rearing contribute to resource efficiency and reduce waste. Such practices promote the preservation of natural resources and mitigate the environmental impact of agricultural activities.
Social Development and Resilience
Animal husbandry plays a pivotal role in social development, especially in marginalized communities. By engaging in animal husbandry, individuals gain valuable skills and knowledge, empowering them to become self-reliant and independent. Livestock rearing provides opportunities for vocational training and capacity building, enabling individuals to enhance their agricultural practices and improve productivity.
Moreover, animal husbandry can contribute to gender equality and women empowerment. In many societies, women play a significant role in livestock management, which allows them to generate income and actively participate in decision-making processes. By recognizing and supporting women’s involvement in animal husbandry, communities can achieve more equitable and inclusive development.
Furthermore, animal husbandry can enhance community resilience in the face of external shocks such as natural disasters or economic downturns. Diversifying livelihood options by incorporating livestock rearing reduces vulnerability and provides a safety net during difficult times. It creates opportunities for income generation and asset accumulation, enabling communities to bounce back from crises and secure their future.
Conclusion
Animal husbandry offers a range of benefits that contribute to improving livelihoods globally. It plays a critical role in ensuring food security, creating economic opportunities, promoting environmental sustainability, and fostering social development. By recognizing the importance of animal husbandry and supporting sustainable practices, societies can harness its full potential for the betterment of individuals and communities. As we navigate the challenges of a rapidly changing world, animal husbandry will continue to play a pivotal role in shaping resilient and prosperous livelihoods.
References
Adepoju Abimbola, O., & Oluwakemi, A. O. (2013). Livelihood diversification and welfare of rural households in Ondo State, Nigeria. Journal of Development and Agricultural, 5(12), 482-489.
Allison, E. H., & Ellis, F. (2001). The livelihoods approach and management of small-scale fisheries. Marine policy, 25(5), 377-388.
Belcher, B., Ruiz-Pérez, M., & Achdiawan, R. (2005). Global patterns and trends in the use and management of commercial NTFPs: implications for livelihoods and conservation. World development, 33(9), 1435-1452.
Chambers, R., & Conway, G. (1992). Sustainable rural livelihoods: practical concepts for the 21st century. Institute of Development Studies (UK).
Herrero, M., Thornton, P. K., Gerber, P., & Reid, R. S. (2009). Livestock, livelihoods and the environment: understanding the trade-offs. Current Opinion in Environmental Sustainability, 1(2), 111-120.
Serrat, O., & Serrat, O. (2017). The sustainable livelihoods approach. Knowledge solutions: Tools, methods, and approaches to drive organizational performance, 21-26.
Sharma, S. N., Chatterjee, S., & Dehalwar, K. (2023). Mahatma Gandhi National Rural Employment Guarantee Scheme: Challenges and Opportunities. Think India Journal, 26(1), 7-15.
Williams, T. O. (2004). Sustainable crop-livestock production for improved livelihoods and natural resource management in West Africa. ILRI (aka ILCA and ILRAD).
GIS Day is an international event celebrated annually on the third Wednesday of November. It serves as a platform to showcase the significant contributions of Geographic Information Systems (GIS) to society, science, and various industries. This day was first initiated in 1999 by Esri, a leading GIS software company, as a part of Geography Awareness Week. The idea was to inspire curiosity about geography and promote the importance of spatial thinking.
Purpose of GIS Day
GIS Day is dedicated to:
Raising Awareness: Educating people about GIS technology and its transformative applications in understanding spatial patterns, solving complex problems, and making informed decisions.
Showcasing Innovation: Demonstrating real-world GIS applications in areas such as urban planning, environmental conservation, disaster management, transportation, and public health.
Building Community: Bringing together GIS professionals, students, educators, and enthusiasts to share knowledge, experiences, and innovations.
Importance of GIS
GIS is a powerful tool that integrates data from various sources to visualize, analyze, and interpret spatial relationships. Its applications are vast:
Urban Planning: Designing sustainable cities, optimizing land use, and improving infrastructure.
Environmental Management: Tracking deforestation, monitoring wildlife, and managing water resources.
Disaster Response: Mapping areas affected by natural disasters to coordinate relief efforts.
Health Care: Identifying disease outbreaks and improving healthcare delivery.
Transportation: Optimizing logistics, route planning, and managing traffic systems.
How GIS Day is Celebrated
Workshops and Seminars: Educational institutions, government bodies, and organizations host workshops and seminars to introduce GIS concepts and software.
Exhibitions: Professionals and students showcase GIS projects, demonstrating its impact on various fields.
Hands-On Activities: Participants engage in interactive activities, such as map-making and geocaching, to explore the fun side of GIS.
Community Mapping: Collaborative mapping projects are organized to address local issues, like mapping safe routes, water sources, or underserved areas.
Guest Lectures: GIS experts share insights, latest trends, and real-world applications of GIS technology.
Significance for Students and Enthusiasts
For students and budding GIS professionals, GIS Day offers an excellent opportunity to:
Explore career prospects in GIS and related fields.
Network with industry leaders and academics.
Gain hands-on experience with GIS tools and software.
Themes and Innovations
Every GIS Day may highlight specific themes such as smart cities, climate change, or disaster resilience. It is also a platform to unveil advancements in GIS technology, like 3D mapping, AI integration, or real-time geospatial analysis.
Impact of GIS Day
GIS Day fosters a deeper understanding of geography and geospatial technology. It encourages the next generation to pursue careers in geospatial sciences, contributing to solutions for global challenges like urbanization, climate change, and natural disasters.
Key Takeaway
GIS Day is more than just a celebration of technology; it is a reminder of the interconnectedness of our world and the potential of spatial thinking to address complex problems. Whether you’re a professional, a student, or simply curious, GIS Day offers a window into the power of mapping and the endless possibilities it holds.
References
Sadvari, J., Koshoffer, A., Gorham, R. B., & Phillips, K. (2020). GIS Day across the Association of Research Libraries: Outreach, Education, and Collaboration. Journal of Map & Geography Libraries, 16(3), 283-299.
Sharma, S. N., Dehalwar, K., & Singh, J. (2023). Cellular Automata Model for Smart Urban Growth Management.
Weimer, K. H., Olivares, M., & Bedenbaugh, R. A. (2012). GIS day and web promotion: Retrospective analysis of US ARL libraries’ involvement. Journal of Map & Geography Libraries, 8(1), 39-57.
Coupling and coordination are two key concepts often studied together in software engineering, systems design, and organizational research. When used as part of a research technique, these concepts explore how components of a system or organization interact and depend on each other. Here’s a detailed explanation:
1. Coupling
Coupling refers to the degree of interdependence or linkage between components in a system. It measures how tightly two or more elements (modules, teams, or subsystems) are connected or reliant upon each other.
Types of Coupling in Software and Research:
Tight Coupling:
Strong dependency between components.
Changes in one component heavily affect others.
Leads to reduced flexibility and scalability.
Example: In software, tightly coupled modules require simultaneous modification for changes.
Loose Coupling:
Minimal dependency between components.
Greater flexibility and easier maintenance.
Preferred for modular designs, as each component can evolve independently.
Example: Microservices architecture.
Data Coupling:
When modules share data explicitly.
Example: Passing parameters between functions.
Control Coupling:
One component dictates the behavior of another by sending control information.
Example: Passing a flag that alters execution.
Research Focus on Coupling:
Coupling is analyzed to understand system behavior, predict change impacts, or identify potential failures.
In organizations, coupling research examines how closely teams or departments depend on one another and how this impacts productivity, resilience, and innovation.
2. Coordination
Coordination refers to the mechanisms and processes used to manage dependencies between different entities (e.g., software modules, organizational teams, or processes).
Coordination Techniques:
Direct Coordination:
Entities communicate directly, often through real-time communication or interaction.
Example: Standup meetings in agile teams.
Indirect Coordination:
Managed through intermediaries like shared resources, schedules, or tools.
Example: Using version control systems in software development.
Synchronous vs. Asynchronous Coordination:
Synchronous: Real-time interaction, e.g., video calls.
Asynchronous: Delayed interaction, e.g., emails or task boards.
Implicit vs. Explicit Coordination:
Implicit: Coordination happens automatically through shared understanding or workflows.
Explicit: Clearly defined roles, processes, and instructions.
Research Focus on Coordination:
Studying coordination helps identify bottlenecks, inefficiencies, and communication barriers.
Investigates how systems adapt to changes in requirements or unexpected events.
Coupling and Coordination in Research:
When studied together, coupling and coordination provide insights into the complexity of systems and their efficiency:
Key Research Techniques:
Dependency Analysis:
Identifying and mapping dependencies in a system or organization.
Used in system design and organizational behavior studies.
Network Analysis:
Visualizing and analyzing the relationships and dependencies between entities.
Example: Social network analysis for team coordination.
Simulation Models:
Simulating tightly coupled or loosely coupled systems to observe performance under different coordination mechanisms.
Case Studies:
In-depth exploration of specific instances of coupled systems or coordinated teams to identify best practices and challenges.
Empirical Studies:
Data-driven approaches using surveys, interviews, or metrics to measure coupling and coordination.
Applications Across Domains:
Software Engineering:
Design loosely coupled modules with effective coordination through APIs or middleware.
Example: Object-oriented programming promotes low coupling and high cohesion.
Organizational Research:
Analyzing how inter-team dependencies and coordination tools affect productivity.
Example: Investigating the use of agile practices for team collaboration.
System Design:
Balancing tight coupling for performance with loose coupling for flexibility.
Example: Designing IoT systems with minimal interdependence between devices.
Process Management:
Studying how manufacturing or logistics systems handle coupling and coordination.
Summary
Coupling and coordination research techniques involve analyzing interdependencies and communication mechanisms within systems or organizations. While coupling focuses on how tightly entities are linked, coordination emphasizes the processes for managing these dependencies. Together, these concepts guide the design of efficient, adaptable, and scalable systems.
References
Li, J., Fang, H., Fang, S., & Siddika, S. E. (2018). Investigation of the relationship among university–research institute–industry innovations using a coupling coordination degree model. Sustainability, 10(6), 1954.
Lodhi, A. S., Jaiswal, A., & Sharma, S. N. (2024). Assessing bus users satisfaction using discrete choice models: a case of Bhopal. Innovative Infrastructure Solutions, 9(11), 1-27.
Sharma, S. N., & Adeoye, M. A. (2024). New Perspectives on Transformative Leadership in Education.
Yan, B. R., Dong, Q. L., Li, Q., Amin, F. U., & Wu, J. N. (2021). A study on the coupling and coordination between logistics industry and economy in the background of high-quality development. Sustainability, 13(18), 10360.
Zhao, Y., Hou, P., Jiang, J., Zhai, J., Chen, Y., Wang, Y., … & Xu, H. (2021). Coordination study on ecological and economic coupling of the Yellow River Basin. International journal of environmental research and public health, 18(20), 10664.
The Core-Periphery Model, developed by John Friedmann in 1966, is a framework used to understand the spatial structure of economic development and regional disparities. It explores how economic activities, resources, and development tend to concentrate in certain areas (the core), leaving other areas (the periphery) less developed. The model is particularly significant in the fields of geography, regional planning, and development economics, as it highlights the unequal distribution of economic power and resources across different regions.
Key Concepts of the Core-Periphery Model
Core Region:
The core is the center of economic, political, and social power.
It is characterized by high levels of industrialization, urbanization, and infrastructure development.
The core regions typically have a concentration of capital, technology, skilled labor, and investment.
Examples include major metropolitan cities or developed countries (e.g., New York, London, Tokyo).
Periphery Region:
The periphery consists of areas that are less economically developed, with lower levels of industrialization and urbanization.
These regions often depend on primary economic activities like agriculture, mining, or raw material extraction.
Peripheral regions tend to have lower levels of income, education, and infrastructure.
Examples include rural areas or developing countries that are economically dependent on the core.
Semi-Periphery Region (added in later refinements of the model):
These are transitional regions that lie between the core and periphery.
They exhibit some characteristics of the core but still face challenges similar to those in the periphery.
Semi-peripheral regions may be emerging economies or rapidly developing cities (e.g., India, Brazil, South Africa).
Stages of Development According to Friedmann
Friedmann’s model identifies four stages in the spatial development of regions:
Pre-Industrial Society:
Economic activities are widely dispersed with little concentration.
Traditional economies dominate, with a focus on agriculture and subsistence activities.
There is minimal differentiation between core and periphery regions.
Emergence of the Core:
Industrialization leads to the growth of certain regions, creating a core area.
The core attracts investments, industries, and skilled labor, becoming an economic hub.
Peripheral areas remain underdeveloped, leading to a spatial economic imbalance.
Core-Dominated Economy:
The core continues to expand, accumulating more economic power and resources.
The periphery becomes increasingly dependent on the core for economic activities, capital, and technology.
This dependence creates a hierarchical relationship, reinforcing regional disparities.
Spatial Integration:
Over time, development policies, infrastructure projects, and technological advancements may reduce regional disparities.
The economic benefits of the core can spill over to the periphery, promoting regional integration.
This stage aims for a more balanced spatial distribution of economic activities.
Mechanisms of Core-Periphery Dynamics
Polarization Effect:
Economic growth tends to concentrate in the core, attracting more resources, investments, and skilled labor.
This process, known as “cumulative causation,” leads to the growth of core regions at the expense of peripheral regions.
Backwash Effect:
The core extracts resources, labor, and capital from the periphery, further weakening the peripheral regions.
This can lead to a drain of talent and resources from rural or underdeveloped areas to more prosperous urban centers.
Spread Effect:
The core’s growth may eventually lead to positive spillover effects in the periphery, such as increased investments, technology transfer, and job creation.
This can happen through policies aimed at decentralization, regional development, and infrastructure improvements.
Implications of the Core-Periphery Model
Economic Inequality:
The model highlights the uneven economic development between core and peripheral regions, which can lead to social and economic inequalities.
Policy Formulation:
Policymakers can use this model to devise strategies for balanced regional development, such as promoting investment in peripheral areas, decentralizing industries, and improving infrastructure.
Urbanization Trends:
It explains the rapid urbanization and concentration of population in metropolitan areas, as people migrate from rural peripheries to urban cores in search of better economic opportunities.
Criticisms of the Core-Periphery Model
Over-Simplification:
The model is criticized for being too simplistic, as it divides regions into binary categories of core and periphery without accounting for the complexities of regional dynamics.
Lack of Consideration for Globalization:
The model was developed in the 1960s, before the rise of globalization and digital technologies, which have altered the spatial distribution of economic activities.
Limited Applicability:
The model may not be fully applicable to all regions, especially in the context of modern economies where multiple cores and decentralized economic activities exist.
Applications of the Core-Periphery Model
Regional Planning and Development:
The model is used to guide regional development policies, focusing on reducing disparities between core and peripheral areas.
Urban Studies:
It helps in analyzing urbanization patterns, city growth, and migration trends.
Economic Geography:
The model provides insights into the spatial distribution of economic activities, helping economists understand the factors driving regional disparities.
Example: Application in India
Core Regions:
Major metropolitan areas like Mumbai, Delhi, and Bengaluru serve as economic cores, with high levels of industrialization, services, and technology.
Peripheral Regions:
Rural areas in states like Bihar, Odisha, and parts of Northeast India remain less developed, with economies primarily dependent on agriculture and limited industrialization.
Semi-Periphery Regions:
States like Gujarat, Tamil Nadu, and Maharashtra show mixed characteristics, with both developed urban centers and underdeveloped rural areas.
Conclusion
The Core-Periphery Model by Friedmann offers a valuable framework for understanding the spatial dynamics of economic development. While it has limitations, it provides a useful lens for examining regional disparities, informing policy interventions aimed at promoting balanced development and reducing economic inequality.
References
Baldwin, R. E. (2001). Core-periphery model with forward-looking expectations. Regional science and urban economics, 31(1), 21-49.
Borgatti, S. P., & Everett, M. G. (2000). Models of core/periphery structures. Social networks, 21(4), 375-395.
Castro, S. B., Correia‐da‐Silva, J., & Mossay, P. (2012). The core‐periphery model with three regions and more. Papers in Regional Science, 91(2), 401-419.
Forslid, R., & Ottaviano, G. I. (2003). An analytically solvable core‐periphery model. Journal of Economic Geography, 3(3), 229-240.
Klimczuk, A., & Klimczuk-Kochańska, M. (2023). Core-periphery model. In The palgrave encyclopedia of global security studies (pp. 239-245). Cham: Springer International Publishing.
Sharma, S. N. Exploring the Urban Growth Pole Theory.
Sharma, S. N., Dehalwar, K., Kumar, G., & Vyas, S. (2023). Redefining Peri-urban Urban Areas. Thematics Journal of Geography, 12(3), 7-13.
Surveys and questionnaires are widely used research tools designed to collect data from a target population. They are integral to fields such as social sciences, marketing, healthcare, and education, providing insight into behaviors, opinions, experiences, and trends. While these terms are often used interchangeably, a distinction exists between the two: surveys typically refer to the broader method of data collection, whereas questionnaires refer to the specific set of questions used in the survey process.
Purpose of Surveys and Questionnaires
The primary purpose of surveys and questionnaires is to gather information systematically from a predefined group of people. This information can be used to:
Identify trends and patterns in attitudes or behaviors.
Test hypotheses and theories in academic research.
Collect feedback on products, services, or policies.
Support decision-making in business and policy contexts.
Assess needs for program development or resource allocation.
Key Components of Surveys
Survey Design: A well-designed survey ensures the collection of reliable and valid data. Key considerations include:
Objectives: Defining the purpose and what you aim to achieve with the survey.
Population and Sampling: Identifying the target audience and determining how they will be selected (sampling techniques such as random, stratified, or convenience sampling).
Mode of Distribution: Selecting a method for delivering the survey (online, mail, phone, or in-person).
Questionnaire Development: The core of a survey is the questionnaire, which should be carefully designed to minimize bias and gather meaningful data. Considerations for question design include:
Type of Questions: Closed-ended (e.g., multiple choice, yes/no) or open-ended (allowing detailed responses).
Wording: Questions should be clear, unambiguous, and neutral to avoid leading respondents.
Order of Questions: Grouping similar topics together, ensuring a logical flow, and starting with less sensitive or easier questions to engage respondents early.
Scale: Likert scales, semantic differential scales, and numerical rating systems are often used to measure attitudes or perceptions.
Pretesting: Before deploying the survey, it is important to pilot test it on a small subset of the target population. This ensures that the questions are interpreted correctly and that there are no technical issues in administration.
Types of Surveys
Descriptive Surveys: These are designed to describe the characteristics of a population. For example, a survey may aim to understand consumer preferences for a particular product or gather demographic data about a community.
Analytical Surveys: These surveys seek to understand relationships between different variables, often used to explore cause and effect. Analytical surveys may use more complex designs, including longitudinal surveys to track changes over time.
Cross-sectional vs. Longitudinal Surveys:
Cross-sectional Surveys collect data from respondents at a single point in time, providing a snapshot of the population.
Longitudinal Surveys collect data from the same respondents over multiple time points, allowing for the observation of changes and trends over time.
Types of Questions in Questionnaires
Closed-ended Questions: These limit responses to predefined options, making them easy to analyze but potentially limiting in detail.
Dichotomous: Yes/No or True/False responses.
Multiple Choice: Offering several options for respondents to choose from.
Ranking: Asking respondents to rank items in order of preference or importance.
Scaled Questions: Using scales (e.g., 1-5 or 1-10) to measure the intensity of a response.
Open-ended Questions: These allow respondents to provide their own answers, giving more in-depth insights but requiring more effort to analyze. They are particularly useful in exploratory research or when seeking qualitative data.
Advantages of Surveys and Questionnaires
Cost-effective: Especially when conducted online or via mail, surveys can reach a large audience without incurring significant costs.
Scalability: Surveys can collect data from hundreds or even thousands of respondents, making them an efficient tool for studying large populations.
Anonymity and Confidentiality: Surveys can be designed to ensure anonymity, making respondents more comfortable when answering sensitive or personal questions.
Data Analysis: Closed-ended questions allow for easy quantification and statistical analysis, providing clear insights into trends and patterns.
Flexibility: Surveys can be tailored to a variety of topics and settings, making them applicable across many industries and fields of study.
Limitations of Surveys and Questionnaires
Response Bias: Respondents may provide answers they believe are socially acceptable rather than their true thoughts, especially when sensitive topics are involved.
Sampling Bias: If the sample is not representative of the population, the results may not be generalizable.
Inaccurate Responses: Memory recall errors or misunderstanding of questions can lead to inaccurate data.
Low Response Rates: Especially in mail or online surveys, response rates can be low, which may skew the data.
Superficial Data: Closed-ended questions often limit the depth of response, and important nuances might be missed.
Best Practices for Creating Effective Surveys and Questionnaires
Be Clear and Concise: Avoid overly complex or technical language. Ensure that questions are easy to understand and do not overwhelm respondents with long or complicated instructions.
Avoid Leading Questions: Ensure that questions do not suggest a particular answer. For example, instead of asking “How much do you enjoy our excellent customer service?” ask “How would you rate our customer service?”
Use Neutral Language: Avoid emotionally charged or biased terms that could influence responses.
Pilot Test: Always test your questionnaire on a small group before full deployment to identify any issues with question interpretation or flow.
Optimize for Devices: For online surveys, ensure that the questionnaire is mobile-friendly, as a large percentage of respondents may complete it on their phones or tablets.
Survey Data Analysis
Once the survey data is collected, it needs to be analyzed effectively. For closed-ended questions, quantitative analysis is often performed using statistical software like SPSS, R, or Excel. Descriptive statistics (mean, median, mode) or inferential statistics (correlation, regression) can provide insights into the relationships and trends in the data.
Open-ended questions are typically analyzed using qualitative methods, such as thematic analysis or content analysis. This involves coding the responses into themes or categories that capture the essence of what respondents are saying.
Conclusion
Surveys and questionnaires are invaluable tools for collecting information from diverse groups. When designed and implemented correctly, they provide accurate, reliable data that can inform decision-making, contribute to research, and offer insight into public opinion or customer satisfaction. However, it is crucial to carefully consider design, sampling, question wording, and analysis methods to ensure that the data gathered is both valid and actionable.
References
Dalati, S., & Marx Gómez, J. (2018). Surveys and questionnaires. Modernizing the Academic Teaching and Research Environment: Methodologies and Cases in Business Research, 175-186.
Dehalwar, K., & Sharma, S. N. (2023). Fundamentals of Research Writing and Uses of Research Methodologies. Edupedia Publications Pvt Ltd.
Dehalwar, K. (Ed.). (2024). Basics of Research Methodology-Writing and Publication. EduPedia Publications Pvt Ltd.
Siraj-Blatchford, J. (2020). Surveys and questionnaires: An evaluative case study. In Doing early childhood research (pp. 223-238). Routledge.
Slattery, E. L., Voelker, C. C., Nussenbaum, B., Rich, J. T., Paniello, R. C., & Neely, J. G. (2011). A practical guide to surveys and questionnaires. Otolaryngology–Head and Neck Surgery, 144(6), 831-837.
Testa, M. A., & Simonson, D. C. (2017). The use of questionnaires and surveys. In Clinical and translational science (pp. 207-226). Academic Press.
Surveys and Questionnaires: Used to gather large amounts of data from a specific population.
Statistical Software:
SPSS (Statistical Package for the Social Sciences)
R (for statistical computing and graphics)
STATA (data analysis and statistical software)
SAS (Statistical Analysis System)
Sampling Methods: Random, stratified, cluster, and systematic sampling.
Regression Analysis: Used to understand relationships between variables.
Factor Analysis: Identifies underlying relationships between variables.
ANOVA (Analysis of Variance): Compares means among groups.
Structural Equation Modeling (SEM): Tests relationships between observed and latent variables.
2. Qualitative Tools and Techniques
Interviews:
Structured, semi-structured, and unstructured.
Focus Groups: Facilitated group discussions to gather insights.
Case Studies: In-depth exploration of a specific case or phenomenon.
Ethnography: Fieldwork that involves immersion in a particular community or group.
Content Analysis: Systematic analysis of communication and media content.
Narrative Analysis: Interpreting personal stories or life histories.
Discourse Analysis: Examining language, conversations, and texts.
3. Mixed Methods:
Triangulation: Combining multiple research methods to cross-verify data.
Convergent Parallel Design: Quantitative and qualitative data collected simultaneously but analyzed separately.
Explanatory Sequential Design: Quantitative data collected first, followed by qualitative analysis for deeper insights.
4. Digital and Online Research Tools
NVivo: Software for qualitative and mixed-methods data analysis.
MAXQDA: Another qualitative data analysis tool.
Google Scholar: Database for academic research and citation tracking.
EndNote and Zotero: Reference management tools.
Mendeley: Reference manager and academic social network.
SurveyMonkey or Google Forms: Tools for creating and distributing surveys online.
Atlas.ti: Qualitative research tool for coding and analyzing qualitative data.
Dedoose: Web-based tool for mixed-methods research.
5. Other Techniques
Comparative Analysis: Systematically comparing cases, phenomena, or groups.
Grounded Theory: Developing a theory grounded in empirical data.
Social Network Analysis (SNA): Analyzing social structures through networks and relationships.
Participatory Action Research (PAR): Involving participants in the research process to foster change.
6. Experimental Methods
Randomized Controlled Trials (RCTs): Used in social experiments to test interventions.
Quasi-Experimental Designs: Non-randomized studies used when RCTs are not feasible.
These tools and techniques allow social science scholars to explore various social phenomena in both quantitative and qualitative dimensions.
References
Dehalwar, K., & Sharma, S. N. (2023). Fundamentals of Research Writing and Uses of Research Methodologies. Edupedia Publications Pvt Ltd.
Dehalwar, K. (Ed.). (2024). Basics of Research Methodology-Writing and Publication. EduPedia Publications Pvt Ltd.
Dehalwar, K., & Sharma, S. N. (2024). Exploring the Distinctions between Quantitative and Qualitative Research Methods. Think India Journal, 27(1), 7-15.
Foster, I., Ghani, R., Jarmin, R. S., Kreuter, F., & Lane, J. (2016). Big data and social science: A practical guide to methods and tools. Chapman and Hall/CRC.
Kuechler, M. (1998). The survey method: An indispensable tool for social science research everywhere?. American Behavioral Scientist, 42(2), 178-200.
Rose, J. (1997). Soft systems methodology as a social science research tool. Systems Research and Behavioral Science: The Official Journal of the International Federation for Systems Research, 14(4), 249-258.
Sharma, S. N. (2023). An Insight into the Book Titled Why Stories Work. Think India Journal, 26(4), 19-24.
Suleiman, R., Troitzsch, K. G., & Gilbert, N. (Eds.). (2012). Tools and techniques for social science simulation. Springer Science & Business Media.
Writing effective answers in exams like the UPSC Civil Services Examination requires a strategic approach. Here are some essential tips to enhance your answer-writing skills:
Read Carefully: Make sure you comprehend what is being asked. Look for keywords and specific instructions.
Identify the Demand: Determine if the question is asking for an explanation, analysis, comparison, or opinion.
2. Structure Your Answer
Introduction: Start with a brief introduction that outlines the key points you will discuss. This sets the context for your answer.
Body: Present your arguments and points systematically. Use subheadings or bullet points where appropriate for clarity.
Conclusion: End with a concise conclusion that summarizes your main points and, if applicable, provides a perspective or recommendation.
3. Be Concise and Relevant
Stick to the Point: Avoid unnecessary elaboration. Focus on the question and avoid tangents.
Use Clear Language: Write in simple and straightforward language. Avoid jargon unless necessary.
4. Incorporate Facts and Examples
Use Data and Statistics: Support your arguments with relevant facts, figures, and examples. This adds credibility to your answer.
Real-Life Examples: Referencing current events, historical instances, or case studies can illustrate your points effectively.
5. Practice Time Management
Plan Your Time: Allocate a specific amount of time for each question. Practice writing answers within the set time limits to build efficiency.
Review Your Answers: If time permits, quickly review your answers for clarity and completeness.
6. Develop Your Own Style
Practice Regularly: Write practice answers to previous years’ questions to improve your style and speed.
Seek Feedback: Share your answers with peers or mentors to get constructive feedback and improve.
7. Use Diagrams and Flowcharts
Visual Aids: Where applicable, use diagrams, flowcharts, or tables to summarize information. Visuals can make complex information easier to digest.
8. Be Objective and Analytical
Critical Thinking: Show your ability to analyze different viewpoints. Weigh pros and cons where necessary, demonstrating depth in your understanding.
Balanced Approach: If the question requires an opinion, present a balanced view rather than a one-sided argument.
9. Stay Updated on Current Affairs
Integrate Relevant Current Events: Relate your answers to current affairs when relevant. This shows your awareness of the world and how it relates to the topic.
10. Stay Calm and Focused
Maintain Composure: Manage exam stress with relaxation techniques. A calm mind enhances clarity and focus while writing.
Stay Positive: Believe in your preparation and skills. Confidence can greatly influence your performance.
Conclusion
Effective answer writing in UPSC exams is a skill that develops over time with practice and reflection. By following these tips and continuously honing your writing ability, you can enhance your chances of success in the examination.
References
Clayton, D. L. K., Rogers, S., & Stuifbergen, A. (1999). Answers to unasked questions: Writing in the margins. Research in Nursing & Health, 22(6), 512-522.
Dehalwar, K., & Sharma, S. N. (2023). Fundamentals of Research Writing and Uses of Research Methodologies. Edupedia Publications Pvt Ltd.
Dehalwar, K. (Ed.). (2024). Basics of Research Methodology-Writing and Publication. EduPedia Publications Pvt Ltd.
Hand, B., Prain, V., & Wallace, C. (2002). Influences of writing tasks on students’ answers to recall and higher-level test questions. Research in Science Education, 32, 19-34.
Rijlaarsdam, G., & Van den Bergh, H. (2013). The dynamics of composing—An agenda for research into an interactive compensatory model of writing: Many questions, some answers. In The science of writing (pp. 107-125). Routledge.
The Graduate Aptitude Test in Engineering (GATE) 2025 is a national-level examination that primarily tests the comprehensive understanding of various undergraduate subjects in engineering, technology, architecture, and science. Conducted jointly by the Indian Institute of Science (IISc), Bangalore and seven Indian Institutes of Technology (IITs),
The Graduate Aptitude Test in Engineering (GATE) is a highly competitive examination conducted in India for assessing the knowledge and understanding of various undergraduate subjects in engineering, technology, and architecture. The GATE exam is primarily used for admissions into postgraduate programs (like M.Tech, M.E.) in various Indian institutes and also serves as a qualifying exam for various public sector jobs.
GATE 2025 Overview
1. Exam Structure
Subjects Covered: GATE covers various subjects across engineering, science, and architecture. The subjects are grouped into different papers, each with a unique code.
Question Types: The exam consists of multiple-choice questions (MCQs), numerical answer questions (NATs), and multiple select questions (MSQs).
Total Marks: Each paper is generally of 100 marks.
2. Eligibility Criteria
Educational Qualifications: Candidates must have completed or be in the final year of their degree in engineering/technology, or those pursuing a Master’s degree in any relevant science subject can also apply.
No Age Limit: There is no upper age limit to appear for the GATE exam.
3. Exam Pattern
Duration: The exam is typically conducted over a period of 3 hours.
Marking Scheme: Correct answers earn marks, while incorrect answers (in MCQ format) may incur a penalty (negative marking).
4. Application Process
Registration: Candidates need to register online on the GATE official website during the specified application period.
Fees: There is an application fee, which may vary based on the candidate’s category (General, OBC, SC/ST, etc.).
Documents Required: Candidates must upload necessary documents, including educational certificates, identity proof, and a passport-sized photograph.
5. Important Dates
Notification Release: Typically in July or August.
Application Form Availability: Usually opens in September.
Examination Dates: The exam is generally conducted in February.
6. Preparation Tips
Syllabus Familiarization: Candidates should thoroughly understand the GATE syllabus for their chosen paper.
Reference Books: Use standard textbooks and resources recommended for GATE preparation.
Mock Tests: Regularly practice with mock tests and previous year question papers to gain familiarity with the exam format.
Study Schedule: Create a study plan that allows sufficient time for each subject and includes breaks.
7. Post-Exam Process
Result Declaration: GATE results are usually announced within a month after the exam.
Score Validity: The GATE score is valid for three years for postgraduate admissions and for jobs in public sector undertakings (PSUs).
8. Career Opportunities
Higher Studies: Many candidates use their GATE scores for admission into prestigious institutions for M.Tech and Ph.D. programs.
Public Sector Jobs: Numerous PSUs recruit based on GATE scores, providing excellent job opportunities.
Conclusion
GATE 2025 is a crucial examination for aspiring engineers and technologists in India, offering pathways to higher education and rewarding careers in various sectors. With a structured preparation approach and thorough understanding of the exam’s requirements, candidates can enhance their chances of success.
Sentiment analysis (also known as opinion mining) refers to the use of natural language processing (NLP), machine learning (ML), and text analytics to identify and extract subjective information from textual data. The primary objective of sentiment analysis is to determine whether a given piece of text expresses a positive, negative, or neutral sentiment.
2. Applications in Research
Marketing and Business Research: Companies use sentiment analysis to gauge public opinion about their products, services, or brands. For example, analyzing customer reviews, feedback, or social media mentions helps businesses understand consumer satisfaction, brand reputation, and areas for improvement.
Political Science: Sentiment analysis is used to measure public opinion about political parties, candidates, or policies. Researchers can analyze social media posts, news articles, or public speeches to evaluate the general sentiment of voters and predict election outcomes or policy acceptance.
Social Science and Psychology: In these fields, sentiment analysis helps understand human emotions and behavior. Analyzing online discussions or blogs can reveal insights about mental health issues, social movements, or societal trends.
Healthcare: In healthcare research, sentiment analysis helps assess patient feedback, such as reviews of hospitals or doctor-patient interactions. It can also be used to analyze public opinion on health policies or medication.
3. Techniques in Sentiment Analysis
Lexicon-based Approaches: This method relies on predefined lists of words associated with positive or negative sentiments. The text is analyzed by counting the number of positive and negative words. However, this approach may struggle with handling sarcasm, negations, or complex sentence structures.
Machine Learning-based Approaches: Using algorithms like Support Vector Machines (SVM), Naïve Bayes, or neural networks, these models are trained on labeled datasets (where the sentiment is already known) to predict the sentiment of new data. These approaches are more flexible than lexicon-based methods as they learn to interpret context and complex relationships between words.
Deep Learning: Advanced techniques such as Convolutional Neural Networks (CNNs) and Recurrent Neural Networks (RNNs) further improve accuracy by learning from large datasets and handling nuances in language, including context, tone, and more complex sentence structures.
4. Challenges in Sentiment Analysis
Ambiguity and Context: Human language is often ambiguous, making it difficult for machines to correctly interpret context. For example, the sentence “The movie was surprisingly good for a boring director” contains mixed sentiment, which can be tricky for algorithms to decipher.
Sarcasm and Irony: Sentiment analysis algorithms often struggle with sarcasm or ironic statements. A sentence like “Oh great, another rainy day” might be interpreted as positive due to the word “great” when the true sentiment is negative.
Domain-Specific Language: Sentiment analysis models trained on general data may not perform well in specialized fields like finance, medicine, or law, where the meaning of certain terms could differ from common usage.
Emotion Detection: Beyond positive or negative sentiment, there are subtleties of human emotion like anger, sadness, joy, or fear. Detecting such granular emotions is a complex challenge that requires advanced models and labeled datasets.
5. Tools and Technologies
TextBlob: A Python library for text processing that provides simple sentiment analysis tools.
VADER (Valence Aware Dictionary and sEntiment Reasoner): VADER is a lexicon and rule-based sentiment analysis tool specifically designed for social media texts.
NLTK (Natural Language Toolkit): A powerful library that supports complex text analysis, including sentiment analysis.
Google Cloud Natural Language API and AWS Comprehend: Cloud-based services that offer NLP and sentiment analysis as a service.
Transformers (e.g., BERT): Transformer-based models have been revolutionary in NLP and are often fine-tuned for sentiment analysis tasks to capture the context better.
6. Data Sources for Sentiment Analysis in Research
Social Media: Platforms like Twitter, Facebook, and Reddit are rich sources of opinionated content. Twitter sentiment analysis is particularly popular due to the public nature of tweets and their limited character count.
Surveys and Reviews: Analyzing reviews from platforms like Amazon, Yelp, or TripAdvisor helps researchers understand customer satisfaction and perception.
News Articles and Blogs: These sources are useful in understanding public sentiment over longer texts, such as editorials or opinion pieces.
7. Impact on Decision-Making
Sentiment analysis aids in decision-making by providing quantifiable insights into public opinion, brand health, or societal trends. For instance:
Businesses can tweak marketing strategies based on customer feedback.
Politicians can tailor their campaign strategies after understanding voter sentiment.
Researchers can track the emotional well-being of society by monitoring discussions on mental health.
8. Future Directions
Emotion Detection and Analysis: Researchers are working to enhance sentiment analysis with more refined emotion detection capabilities.
Multilingual Sentiment Analysis: With the rise of global online communities, sentiment analysis tools need to handle multiple languages and regional dialects effectively.
Real-Time Sentiment Analysis: As data streams from social media or other sources become more real-time, sentiment analysis models that can provide real-time insights are increasingly in demand.
In summary, sentiment analysis has become an invaluable tool across various research domains, helping researchers and organizations measure public opinion and make informed decisions.
References
Cambria, E., Das, D., Bandyopadhyay, S., & Feraco, A. (Eds.). (2017). A practical guide to sentiment analysis (Vol. 5). Cham: Springer International Publishing.
Dehalwar, K., & Sharma, S. N. (2023). Fundamentals of Research Writing and Uses of Research Methodologies. Edupedia Publications Pvt Ltd.
Medhat, W., Hassan, A., & Korashy, H. (2014). Sentiment analysis algorithms and applications: A survey. Ain Shams engineering journal, 5(4), 1093-1113.
Prabowo, R., & Thelwall, M. (2009). Sentiment analysis: A combined approach. Journal of Informetrics, 3(2), 143-157.
Taboada, M. (2016). Sentiment analysis: An overview from linguistics. Annual Review of Linguistics, 2(1), 325-347.
Wankhade, M., Rao, A. C. S., & Kulkarni, C. (2022). A survey on sentiment analysis methods, applications, and challenges. Artificial Intelligence Review, 55(7), 5731-5780.
What’s the point of your essay? Is it clear to the reader from the very beginning? This is key since this is one of the main ways to improve the quality of the essay.
CREATIVITY
How you tell your story is just as important as which story you decide to tell. A creative introduction is a great way to catch your reader’s attention.
COMPELLING
Write so that the reader wants to keep reading. Aim for telling a good story, as if you are introducing yourself to someone through your favorite story about yourself. Use specific, descriptive language. Use active words rather than passive ones.
CONCISE
Use as few words as possible and make sure each word is the right one for the job. It should be concise in content but deep in meaning. Keeping meaningful and necessary sentences. Use conjunctions and compound sentences to make essay concise.
CANDOR
Make it your mission to be honest with your readers. Give readers something they can actually use in the real world: hard-won advice, useful facts that you’ve discovered, a careful description of problems, and actionable solutions to those problems. Level with your readers about important information that less courageous writers would rather not write about.
CONFIDENCE
Be both calm and firm about the rightness of your argument. Don’t demand that readers agree with you; ironically, such an approach shows lack of confidence. Invite readers to agree with you and congratulate them for choosing your firm side. Acknowledge opposing points of view, but refute them immediately and resolutely.
CONTROL
A strong argument has more impact when discussed matter-of-factly than when screamed or shouted. Don’t quote others excessively. Always retain the first word and last word of every paragraph for yourself. Balance the structure of your essay. Each section of the essay should have a specific role.
COMPREHENSION
Whatever your topic, proactively show readers that you understand it well. Be both a helpful guide through complex issues and an informed judge when choices must be made. Cover your territory fully and give readers information that they’re not likely to know. Generous sharing of useful, real-world knowledge is the fastest way to establish trust with your audience. Never forget the ultimate goal, which is to contribute your wisdom freely and help your readers sincerely.
CONSISTENT
Essay should be consistent with the norms and guidelines usually followed in academic writing. Don’t try to out of box and invent something new, this might not create impress rather it might lead to low score in essay writing answers.
References
Dehalwar, K., & Sharma, S. N. (2023). Fundamentals of Research Writing and Uses of Research Methodologies. Edupedia Publications Pvt Ltd.
Rosenwasser, D., Stephen, J., & Rosernwasser, D. (2009). Writing analytically. Thomson Wadsworth.
Raimes, A. (1998). Teaching writing. Annual review of applied linguistics, 18, 142-167.
Sharma, S. N. (2023). An Insight into the Book Titled Why Stories Work. Think India Journal, 26(4), 19-24.
Weigle, S. C. (2002). Assessing writing. Ernst Klett Sprachen.
Sherry Arnstein’s “Ladder of Citizen Participation” is a seminal framework in urban planning and public policy, which she introduced in a 1969 article in the Journal of the American Institute of Planners. The framework categorizes different levels of citizen involvement in decision-making processes, offering a critical perspective on the dynamics between power holders and citizens. Arnstein’s ladder remains influential in discussions of participatory democracy, power distribution, and community engagement.
Overview of the Ladder
The “Ladder of Citizen Participation” is depicted as an eight-rung ladder, with each rung representing a different level of citizen participation. The higher the rung, the greater the degree of citizen power and influence in the decision-making process. Arnstein’s model is divided into three broad categories:
Nonparticipation: The lowest rungs, where the primary goal is not genuine participation but rather to manipulate or placate the public.
Tokenism: The middle rungs, where citizens are allowed to have a voice but without any real power to influence the outcome.
Citizen Power: The highest rungs, where citizens obtain decision-making power and can directly influence policies and programs.
The Eight Rungs of the Ladder
Manipulation:
Definition: This is the lowest level of participation, where those in power (government officials, developers, etc.) “educate” or “inform” citizens in a way that subtly or overtly manipulates them into supporting predetermined plans.
Characteristics: Citizens are used as a public relations tool, with the illusion of participation rather than any real influence. Information is controlled and selectively released to shape opinions without genuinely addressing citizen concerns.
Therapy:
Definition: This rung is characterized by efforts to “cure” or “educate” citizens about their own problems, under the assumption that their attitudes or behaviors are the root cause of issues, rather than systemic problems.
Characteristics: Citizens are involved in activities meant to change their views or attitudes, but not in a way that grants them any control over decisions. The focus is on “adjusting” citizens to fit existing structures, rather than altering those structures.
Informing:
Definition: The first level of what Arnstein describes as “tokenism,” where citizens are merely informed of their rights, responsibilities, and options.
Characteristics: Information flows from the power holders to the citizens with no channel for feedback or dialogue. While informing is a necessary part of participation, at this stage, it is largely one-way communication, with little to no influence on decision-making.
Consultation:
Definition: This rung involves asking citizens for their opinions through surveys, meetings, or public hearings.
Characteristics: Although this represents an improvement over simply informing, consultation often fails to ensure that citizen feedback will be heeded. It gives the appearance of involving citizens, but without any guarantee of influence on the final decision.
Placation:
Definition: At this stage, citizens are allowed to advise or make recommendations, but the power holders retain the right to decide whether to accept or reject the advice.
Characteristics: Mechanisms like citizen advisory boards or committees are established, but these bodies typically lack the authority to make or enforce decisions.
Partnership: In this level, power is shared between citizens and authorities. Citizens actively participate in decision-making processes, forming a partnership with officials. Negotiations take place, and there is mutual decision-making power.
Delegated Power: Citizens gain more control as decision-making authority is largely handed over to them. They are given delegated responsibilities to govern specific areas, although ultimate control may still lie with higher authorities.
Citizen Control: At the highest level of participation, citizens have full authority over decision-making processes. They initiate and lead programs, having complete control over policies and governance without needing external approval.
The participation levels of partnership, delegated power, and citizen control refer to degrees of citizen involvement in decision-making processes, often depicted in Arnstein’s Ladder of Citizen Participation. These levels represent increasing degrees of citizen empowerment.
These levels reflect a progression toward greater citizen autonomy and control over public matters.
References
Arnstein, S. R. (1969). A ladder of citizen participation. Journal of the American Institute of planners, 35(4), 216-224.
Arnstein, S. R. (2019). A ladder of citizen participation. Journal of the American planning association, 85(1), 24-34.
Gaber, J. (2020). Building “a ladder of citizen participation”: Sherry Arnstein, citizen participation, and model cities. In Learning from Arnstein’s Ladder (pp. 13-34). Routledge.
Maier, K. (2001). Citizen participation in planning: Climbing a ladder?. European Planning Studies, 9(6), 707-719.
May, J. (2006). Ladders, stars and triangles: old and new theory for the practice of public participation. International journal of market research, 48(3), 305-319.
Urban planning is a multifaceted discipline that aims to create functional, sustainable, and livable cities. Over time, various theories have emerged to explain how urban planning should be conceptualized, executed, and structured. These theories can be classified into three major categories: Conceptual Theories, Procedural Theories, and Land-use-based Theories. Each of these approaches provides a unique lens to understand the dynamics of city planning and its relationship to the environment, society, and economy.
1. Conceptual Urban Planning Theories
Conceptual theories focus on the underlying ideas, visions, and philosophical assumptions that guide the practice of urban planning. These theories aim to shape how we think about the structure and purpose of urban spaces. They are often normative, meaning they propose an ideal form for cities.
a. Garden City Movement (Ebenezer Howard)
Core Idea: The Garden City concept was proposed by Ebenezer Howard in the late 19th century, aiming to combine the best aspects of the city and countryside.
Key Features: Howard envisioned self-contained communities surrounded by greenbelts, with a balance of residential, industrial, and agricultural areas. The goal was to reduce urban sprawl and overcrowding while promoting healthy living conditions.
Impact: This theory laid the groundwork for the development of suburban areas and influenced the planning of modern towns.
b. Radiant City (Le Corbusier)
Core Idea: Le Corbusier’s vision of the Radiant City was a high-density, vertically structured urban environment, which focused on order, symmetry, and modernism.
Key Features: His concept called for skyscrapers for work and living, surrounded by parks and open spaces. He believed that rational city planning should prioritize efficiency, through zoning for different activities, and heavily relied on technological advancements.
Impact: Though controversial, this theory influenced the development of modernist urban projects, especially in the mid-20th century, like Brasília and Chandigarh.
c. City Beautiful Movement
Core Idea: Originating in the United States in the late 19th and early 20th centuries, this movement emphasized the aesthetic quality of urban spaces, believing that beautiful cities promote a better quality of life.
Key Features: Advocates of the City Beautiful movement argued that wide boulevards, grand parks, and monumental public buildings would instill civic pride and moral upliftment among citizens.
Impact: The City Beautiful movement influenced the design of several major American cities, particularly Washington D.C., Chicago, and Cleveland.
d. New Urbanism
Core Idea: This is a late 20th-century movement that promotes walkable neighborhoods, mixed-use development, and sustainable urban design.
Key Features: New Urbanism advocates for the creation of pedestrian-friendly streets, human-scale development, and the integration of different types of housing and businesses.
Impact: It has influenced modern city developments, focusing on reducing automobile dependence and creating more livable, community-oriented environments.
2. Procedural Urban Planning Theories
Procedural theories focus on the methods, processes, and techniques used in planning. Rather than focusing on what the ideal city should look like, these theories concentrate on how planning should be conducted. They reflect the operational side of urban planning and involve decision-making, stakeholder engagement, and the use of various tools for implementation.
a. Rational Planning Model
Core Idea: The Rational Planning Model is rooted in a systematic approach to problem-solving, based on scientific methods.
Key Features: This model emphasizes clear objectives, data-driven analysis, forecasting future scenarios, and selecting the best course of action among alternatives.
Steps: The process typically involves defining the problem, setting goals, gathering data, analyzing alternatives, and making decisions.
Criticism: This model has been criticized for being too technocratic, ignoring social and political dimensions, and assuming that all variables can be predicted or controlled.
b. Incrementalism (Charles Lindblom)
Core Idea: Incrementalism, also known as “muddling through,” rejects the comprehensive nature of rational planning. Instead, it advocates for making small, manageable changes rather than large, sweeping reforms.
Key Features: In this model, planners deal with problems incrementally by making decisions based on a series of small steps. It recognizes the limitations of human capacity to foresee all outcomes and suggests that planning should be flexible and adaptive.
Criticism: Critics argue that incrementalism can be too conservative, potentially missing opportunities for larger-scale innovation or necessary transformation.
c. Communicative Planning
Core Idea: This theory views planning as a collaborative and communicative process, emphasizing the involvement of various stakeholders in decision-making.
Key Features: Communicative planning is built on the idea that planners should act as facilitators of dialogue among different interest groups. The goal is to reach consensus and develop plans that are inclusive and democratic.
Criticism: While participatory planning is praised for its inclusiveness, critics argue that it can be time-consuming and may not always lead to decisive action.
d. Advocacy Planning (Paul Davidoff)
Core Idea: Advocacy planning emerged in the 1960s in response to the technocratic nature of earlier models. It argues that planners should not be neutral but should actively advocate for marginalized communities and social justice.
Key Features: Planners are seen as representatives for particular interest groups, particularly those who are often left out of planning decisions. It emphasizes the need for planners to address social inequalities in cities.
Criticism: Advocacy planning may lead to conflicts between different interest groups, and critics argue it can politicize the planning process, potentially undermining the professional neutrality of planners.
e. Transactive Planning
Core Idea: Transactive planning, developed by John Friedmann, focuses on the interaction between planners and the people they serve. Planning is seen as a learning process where knowledge is exchanged between experts and community members.
Key Features: This theory emphasizes mutual learning, personal interactions, and the co-creation of solutions through shared experiences. The knowledge and values of the community are considered as important as the technical knowledge of the planners.
Criticism: The challenge with transactive planning lies in effectively balancing professional expertise with community input, and ensuring that the process remains equitable.
3. Land-Use-based Urban Planning Theories
Land-use-based urban planning refers to the strategic arrangement and regulation of the physical space within a city or urban area. It focuses on how land is allocated for different purposes—residential, commercial, industrial, recreational, agricultural, or environmental preservation—while considering social, economic, and environmental factors. Urban planning theories in this domain have evolved over time, reflecting shifts in urban development priorities, technological advancements, and social paradigms. Key theories include the following:
a. The Concentric Zone Theory (Burgess Model)
Developed by sociologist Ernest Burgess in the 1920s, this theory was among the earliest attempts to explain urban land-use patterns. The Concentric Zone Model suggests that cities grow outward in rings from a central core, known as the Central Business District (CBD). Burgess proposed five zones:
Zone 1 (CBD): The central business district, containing commercial activities.
Zone 2 (Transition Zone): A mix of industry and poorer residential housing.
Zone 3 (Working-Class Residential): Densely populated working-class housing.
Zone 4 (Middle-Class Residential): More spacious housing for the middle class.
Zone 5 (Commuter Zone): Suburban areas with higher-end housing.
This model highlights urban growth through a natural expansion process. However, it assumes a monocentric city structure, which has been critiqued for its simplicity and lack of applicability in modern, polycentric cities.
b. Sector Theory (Hoyt Model)
Homer Hoyt developed the Sector Model in 1939 as an alternative to the Burgess Model. He argued that cities grow not in concentric rings but in sectors or wedges radiating out from the CBD. Certain types of development, such as high-end housing or industrial zones, expand along transportation routes or environmental corridors. This model emphasizes transportation’s role in shaping land-use patterns.
Key insights from the Hoyt model include:
Wealthier residential areas tend to develop outward from the city center in certain sectors, typically along major roads.
Industrial and working-class housing develops in other sectors, often near railways or ports.
Though a step forward from Burgess’ model, the Sector Theory also falls short in explaining complex, modern urban dynamics, such as the rise of mixed-use neighborhoods.
c. Multiple Nuclei Model (Harris and Ullman)
In 1945, Chauncy Harris and Edward Ullman proposed the Multiple Nuclei Model, suggesting that cities develop around multiple centers (nuclei) rather than a single core. These centers may serve different functions—some focusing on retail, others on manufacturing or residential uses—and often emerge around key transport nodes, industrial hubs, or large institutions (universities, hospitals).
Key features of this model include:
Polycentric Structure: Modern cities have multiple business centers, not just one dominant CBD.
Functional Specialization: Each nucleus has a specialized function (e.g., industrial, educational, commercial).
Land-Use Interdependency: Nuclei can influence land uses around them, creating clusters of similar activities.
The Multiple Nuclei Model is seen as more realistic than earlier models for explaining large, modern cities that are often decentralized and feature multiple economic or cultural hubs.
d. The Urban Realms Model (Vance)
Developed by James E. Vance Jr. in the 1960s, the Urban Realms Model offers a further evolution of polycentric development. Vance argued that cities are composed of several semi-autonomous “realms,” each with its own central business district and functional identity. These realms operate independently but are interconnected through infrastructure like highways and public transportation.
Features of the Urban Realms Model:
Self-Sufficient Suburbs: Urban areas no longer rely solely on the central city for employment and services.
Decentralized Growth: The rise of suburban business districts reduces the dominance of the main CBD.
Metropolitan Integration: Even as suburban realms become more self-sufficient, they remain integrated into a broader metropolitan system.
This model reflects the growing importance of suburbanization and highlights how modern metropolitan areas consist of diverse, decentralized zones with complex interdependencies.
Tabular Analysis of Conceptual Theories, Procedural Theories, and Land-use-based Theories
Aspect
Conceptual Theories
Procedural Theories
Land-use-based Theories
Definition
Theories that focus on the ideas, values, and principles guiding urban development. They explore the social, cultural, economic, and environmental ideals that underpin planning.
Theories that focus on the processes, techniques, and steps used in planning. They explore how decisions are made, who is involved, and how planning outcomes are achieved.
Theories that focus on the spatial organization of land and how different areas are designated for various uses (e.g., residential, commercial, industrial).
Focus
Broad philosophical and conceptual understanding of urban development and its goals.
The decision-making process and planning methodologies used in urban planning practice.
The allocation, regulation, and organization of physical land uses within urban areas.
Key Questions
– What should a city be like? – What values guide urban development?
– How should planning decisions be made? – What steps should be followed?
– How should land be used? – How can spatial organization create efficient, sustainable cities?
Purpose
Establishes the ideological framework and vision for urban development, focusing on social justice, environmental sustainability, and economic growth.
Ensures that planning is conducted in a structured and systematic way, often focusing on transparency, participation, and efficiency.
Aims to create functional, efficient, and sustainable cities through the strategic allocation of land for different activities.
Examples of Theories
– Rational Planning: Focuses on logical, data-driven decisions for the public good. – Advocacy Planning: Emphasizes planners representing marginalized groups. – Sustainable Development: Focuses on balancing economic, environmental, and social needs.
– Synoptic Planning: Follows a linear process of goal setting, data analysis, and evaluation. – Incrementalism: Decisions are made in small steps to adjust to change. – Collaborative Planning: Emphasizes stakeholder engagement and consensus-building.
– Concentric Zone Model: Urban areas grow outward in rings from a central core. – Multiple Nuclei Model: Cities develop around several specialized centers. – Smart Growth: Encourages compact, sustainable development with mixed land uses.
Decision-Making
Guided by overarching values, such as equity, justice, and sustainability, often abstract and normative.
Involves structured steps for decision-making, often focusing on rationality, stakeholder participation, and iterative processes.
Guided by geographic and economic considerations for the spatial organization of urban areas. Decision-making focuses on efficient land allocation.
Major Criticisms
– Too abstract and idealistic, difficult to translate into practical planning. – May lack consideration for implementation challenges.
– Can be overly procedural or technocratic, losing sight of broader urban goals. – Sometimes criticized for being slow or overly bureaucratic.
– Often assumes static patterns of land use. – May not account for socio-political dynamics affecting land development.
Methodology
Theoretical, value-driven approach focusing on qualitative aspects, often informed by sociology, economics, and environmental science.
Structured, step-by-step processes with a focus on quantitative and qualitative analysis, stakeholder input, and iterative reviews.
Spatial analysis of land, typically using GIS, zoning regulations, and urban models to designate areas for different uses.
Influence on Planning Practice
Provides guiding principles and ideals that inform the vision and goals of urban development.
Establishes frameworks and methods for how planners make decisions, engage stakeholders, and implement plans.
Provides practical frameworks for zoning, land-use designations, and spatial planning, directly influencing city layouts and regulations.
Strengths
– Encourages innovative, holistic thinking. – Focuses on long-term sustainability and equity.
– Structured and systematic, making planning predictable and transparent. – Emphasizes collaboration and adaptability.
-Practical and easy to adopt -Encourages regulation of unplanned growth.
References
Agarwal, S., & Sharma, S. N. (2014). Universal Design to Ensure Equitable Society. International Journal of Engineering and Technical Research (IJETR), 1.
Alexander, E. R. (2016). There is no planning—only planning practices: Notes for spatial planning theories. Planning theory, 15(1), 91-103.
Davy, B., Levin-Keitel, M., & Sielker, F. (2023). Plural planning theories: cherishing the diversity of planning. European Planning Studies, 31(11), 2267-2276.
Dehalwar, K., & Sharma, S. N. (2023). Fundamentals of Area Appreciation and Space Perceptions.
Fainstein, S. S. (2000). New directions in planning theory. Urban affairs review, 35(4), 451-478.
Faludi, A. (Ed.). (2013). A reader in planning theory (Vol. 5). Elsevier.
Friedmann, J. (2017). Two centuries of planning theory: An overview. Explorations in planning theory, 10-29.
Friedmann, J., & Hudson, B. (1974). Knowledge and action: A guide to planning theory. Journal of the American Institute of Planners, 40(1), 2-16.
Lawrence, D. P. (2000). Planning theories and environmental impact assessment. Environmental impact assessment review, 20(6), 607-625.
Sharma, S. N. (2014). Participatory Planning in Plan Preparation. BookCountry.
Sharma, S. N. (2019). Review of most used urban growth models. International Journal of Advanced Research in Engineering and Technology (IJARET), 10(3), 397-405.


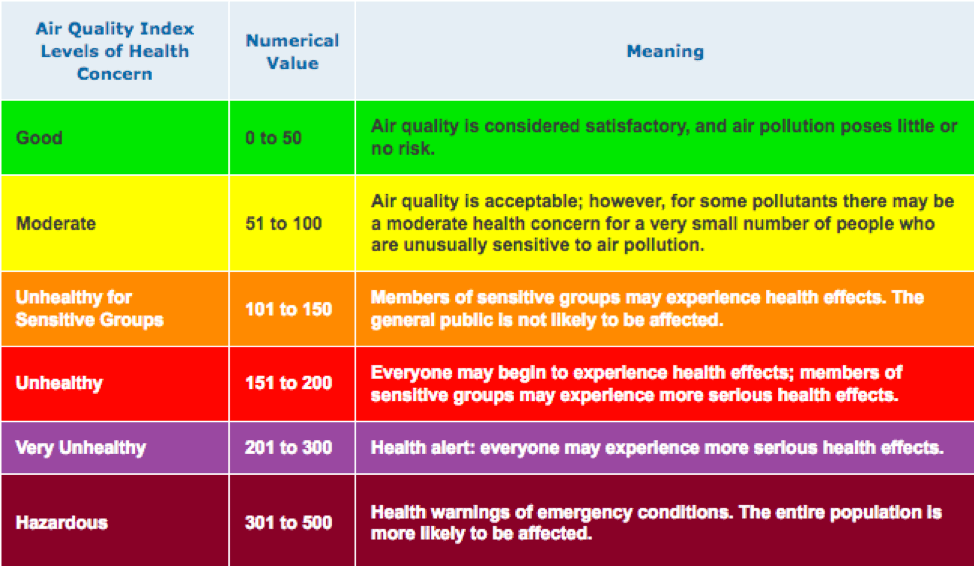


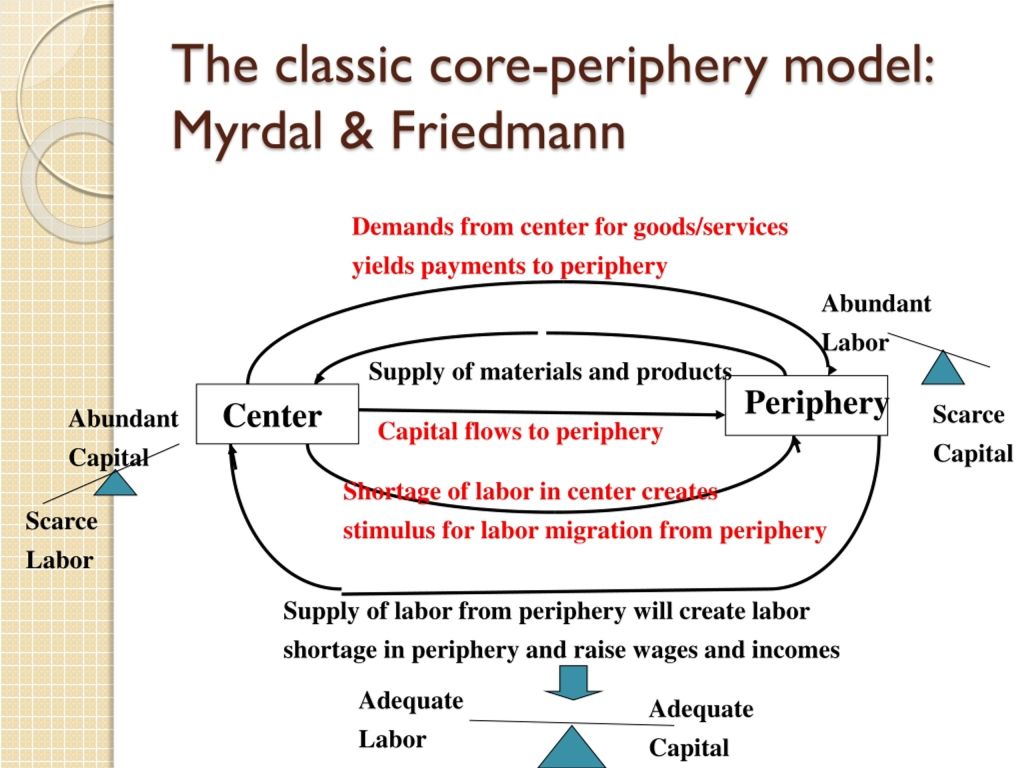


You must be logged in to post a comment.