Design is more than an artistic exercise; it is a powerful tool for communicating ideas, influencing behaviour, and shaping public awareness. In the contemporary era of climate change, rapid urbanisation, environmental degradation, and resource scarcity, creative communication has become essential for promoting sustainable practices. One effective approach to encourage environmental awareness is through live logo design competitions that focus on themes related to the relationship between nature and the built environment, such as water conservation, environmental protection, climate resilience, and sustainable urban living.
A logo represents the visual identity of a concept, organization, or movement. It condenses complex ideas into a simple, memorable symbol. When students, designers, planners, and environmental enthusiasts participate in logo design exercises based on sustainability themes, they engage in a process of thought development, conceptual understanding, and creative problem-solving. This process allows participants to translate abstract environmental issues into visual narratives that can inspire awareness and action.
This article discusses how design concepts can be applied to develop themes and ideas through logo creation, particularly in the context of live competitions addressing challenges related to nature and the built environment, including campaigns such as Save Water, Protect the Environment, Green Cities, and Sustainable Living.
Understanding the Relationship Between Nature and the Built Environment
The built environment refers to human-made spaces such as buildings, roads, infrastructure, and urban landscapes. These spaces are designed to support human activities but inevitably interact with natural systems including land, water, vegetation, and climate. Modern cities face numerous challenges because of the imbalance between development and environmental protection. Issues such as water scarcity, urban heat islands, air pollution, loss of green spaces, and excessive resource consumption highlight the urgent need to rethink how cities are designed and managed.
Creative disciplines such as architecture, planning, and graphic design can play a major role in communicating sustainability principles to society. Visual communication tools like posters, logos, infographics, and digital media help translate scientific and technical knowledge into accessible messages for the general public.
Logo design competitions focused on environmental themes encourage participants to think critically about these issues and represent them visually. Through this process, designers learn to connect ecological values with urban development, thereby reinforcing the idea that sustainability should be integrated into everyday life.
The Role of Concept Development in Logo Design
Concept development is the foundation of any successful design project. Before creating a logo, participants must first understand the theme, identify the key message, and translate that message into a symbolic form.
For environmental and urban sustainability themes, the concept development process typically involves the following steps:
1. Understanding the Problem
Participants begin by studying the issue they want to represent. For example, if the theme is Save Water, they may explore topics such as water scarcity, groundwater depletion, rainwater harvesting, and responsible water consumption. Understanding the problem allows designers to develop meaningful ideas rather than purely decorative graphics.
2. Identifying Key Symbols
Environmental themes often rely on symbolic representation. Water may be represented through droplets, waves, or rivers. Trees symbolize ecological balance and sustainability. Buildings represent urban development, while the sun can symbolize renewable energy or climate awareness. Combining these elements thoughtfully helps designers express the relationship between natural and built environments.
3. Developing a Visual Narrative
A good logo tells a story through minimal elements. For example, a design showing a water droplet transforming into a tree can represent the idea that water conservation supports environmental growth. Similarly, a logo showing buildings integrated with greenery can symbolize sustainable urban development.
4. Simplifying the Design
Logos must remain clear and recognizable even when scaled down. Designers therefore refine their concepts into simple geometric forms and balanced compositions that communicate the message effectively.
Through these steps, the logo becomes a visual representation of the theme and communicates the intended message instantly.
Live Competitions as Platforms for Creative Engagement
Live design competitions offer a dynamic and interactive environment where participants develop ideas within a limited timeframe. Such competitions are often organized in academic institutions, conferences, environmental awareness events, or community initiatives. Participants are given a theme related to environmental sustainability and asked to create a logo that represents the concept.
These competitions have several advantages:
Encouraging Critical Thinking
Participants must analyze the theme quickly and translate complex environmental issues into simple visual elements. This process stimulates critical thinking and creativity.
Promoting Environmental Awareness
When designers work on themes such as water conservation or climate action, they become more aware of environmental challenges and the importance of sustainable behaviour.
Developing Design Skills
Live competitions help participants improve their skills in concept development, sketching, digital design, typography, and visual communication.
Engaging Communities
The final designs can be used for campaigns, awareness programs, or environmental initiatives, thereby extending the impact beyond the competition itself.
Themes for Logo Design Competitions
Environmental and sustainability-focused competitions can explore a variety of themes related to the interaction between nature and the built environment. Some common themes include:
Save Water
Water scarcity is becoming one of the most critical challenges for cities around the world. Rapid urban growth and unsustainable consumption patterns have placed immense pressure on freshwater resources. Logo designs for this theme may incorporate elements such as water droplets, rivers, reservoirs, rainwater harvesting structures, or hands protecting water.
Designs might visually communicate messages such as every drop counts, protecting water sources, or sustainable water use in cities.
Protect the Environment
This theme focuses on preserving ecosystems, reducing pollution, and promoting responsible environmental behaviour. Designers may combine natural elements such as trees, leaves, and animals with symbols representing human activity.
The objective is to emphasize the idea that human development should coexist with nature rather than destroy it.
Green Cities and Sustainable Urban Development
Urban areas consume large amounts of energy and resources, making sustainable planning essential. Logos developed for this theme may integrate buildings, green roofs, bicycles, public transport symbols, and renewable energy elements such as solar panels or wind turbines.
Such designs communicate the vision of cities that are clean, green, energy-efficient, and environmentally responsible.
Climate Action
Climate change is one of the most pressing global challenges. Designers may create logos that represent rising temperatures, renewable energy solutions, or collective action for climate resilience.
Visual elements such as the Earth, sun, wind, and sustainable technologies help illustrate the connection between human activity and climate systems.
Integrating Nature and Built Environment in Design
One of the most powerful approaches in environmental logo design is the integration of natural and built elements into a single composition. This integration reflects the fundamental principle of sustainability: development must work in harmony with nature.
Examples of integrated design ideas include:
Buildings shaped like leaves or trees to symbolize green architecture
Water droplets containing city skylines to represent water sustainability in urban areas
Circular designs combining the Earth, plants, and infrastructure to represent ecological balance
Hands protecting natural resources to symbolize responsibility and stewardship
Such visual metaphors effectively communicate complex sustainability concepts in a simple and engaging way.
Educational Value of Logo Design Exercises
Logo design competitions are particularly valuable in educational settings such as architecture, urban planning, environmental science, and design programs. These exercises encourage students to connect theoretical knowledge with creative expression.
For example, architecture and planning students studying sustainable urban development can translate their understanding of environmental challenges into visual concepts. Through the process of sketching and refining ideas, they learn how design can influence public perception and behaviour.
Educational institutions can organize workshops or competitions where participants collaborate in teams, discuss sustainability themes, and develop creative solutions. This interdisciplinary interaction helps build a deeper understanding of environmental issues.
From Concept to Campaign
The outcomes of logo design competitions can extend beyond the classroom or event. Winning designs can be adopted as official symbols for awareness campaigns, environmental initiatives, or sustainability programs.
For example, a “Save Water” logo created during a competition may be used in posters, social media campaigns, educational materials, or municipal awareness drives. This gives participants the opportunity to see their creative work contribute to real-world environmental action.
Such initiatives demonstrate that design is not merely decorative but can function as a strategic communication tool for social and environmental change.
Encouraging Innovation and Future Thinking
As cities continue to expand and environmental challenges intensify, innovative approaches to communication and awareness will become increasingly important. Creative exercises such as logo design competitions encourage participants to think about the future and imagine sustainable possibilities.
Designers can experiment with new visual languages, digital tools, and interdisciplinary ideas to represent environmental themes. By combining artistic creativity with environmental knowledge, participants contribute to a broader culture of sustainability.
Conclusion
The use of design concepts to develop themes related to nature and the built environment offers a powerful approach to raising awareness about sustainability. Logo design competitions focused on issues such as water conservation, environmental protection, and sustainable urban development provide a platform for creative engagement and thought development.
Through the process of concept development, symbol selection, visual storytelling, and design refinement, participants translate complex environmental challenges into clear and compelling visual messages. Live competitions not only enhance design skills but also encourage critical thinking, environmental responsibility, and community engagement.
Ultimately, these creative exercises demonstrate that design can play a significant role in shaping attitudes and behaviours toward the environment. By integrating artistic expression with sustainability themes, logo design competitions contribute to building a culture that values nature, respects resources, and promotes harmonious coexistence between the natural world and the built environment.
Simple Interest (SI) is the interest calculated only on the original principal amount, for the entire duration of the loan or investment. It does not include interest on previously earned interest (unlike compound interest).
Simple interest is commonly used in:
Short-term loans
Personal borrowing
Fixed deposits (in some cases)
Educational examples
Basic financial planning
🔹 Formula of Simple Interest
SI=100P×R×T
Where:
SI = Simple Interest
P = Principal amount (Initial investment or loan)
R = Rate of interest (per annum in %)
T = Time (in years)
🔹 Total Amount Formula
To find the total amount payable or receivable:A=P+SI
Where:
A = Final Amount
P = Principal
SI = Simple Interest
🔎 Example 1: Basic Calculation
Problem:
A person invests ₹50,000 at an interest rate of 8% per year for 3 years. Find the simple interest and total amount.
✔ Interest remains constant every year ✔ Easy to calculate ✔ Suitable for short-term financial decisions ✔ Does not consider time value compounding
🔹 When to Use Simple Interest
Short-term business loans
Borrowing from individuals
Treasury bills (basic calculations)
Quick financial estimation
School-level financial mathematics
📌 Important Note
In long-term investments, Compound Interest gives higher returns because interest is earned on interest. Simple interest is mainly useful for straightforward and short-duration financial calculations.
Saving a video from your feed used to mean screen-recording with shaky fingers and a notification bar in the frame. Today a good video downloader removes that friction in seconds, no installs required.
This guide walks through three free browser-based tools that cover Facebook, TikTok, and Likee. Each one works on desktop and mobile, asks for nothing more than a pasted link, and stores the file straight to your device.
Why save social media content locally?
Platforms delete posts without warning. Creators go private, accounts get suspended, and algorithms bury clips you liked yesterday. A local copy means the content stays yours.
Offline access matters too. Commutes, flights, and spotty Wi-Fi are easier when your photo download or video is already on the phone. No buffering, no data charges.
Grab Facebook videos and reels with one link
GetMyFb focuses entirely on Facebook. It handles public videos, reels, and stories in both HD and SD quality.
Open the Facebook post, tap the three-dot menu, and copy the link. Paste it into the search bar on the site, hit the download button, and pick your resolution. The file lands in your default downloads folder within moments.
The reels downloader function works identically. Facebook Reels use the same URL structure, so the tool detects the format automatically and returns a clean MP4.
No account creation, no watermark, no limit on how many clips you save per session.
Save TikTok clips without the watermark
TikTokDownload.Online strips the TikTok watermark before delivering the file. That makes it useful for creators who repurpose content across platforms or compile highlight reels.
Copy the TikTok video URL from the app or browser. Paste it, choose between MP4 video or MP3 audio, and download. The process finishes in under ten seconds on a standard connection.
MP3 extraction is a bonus if you only need the sound, whether it is a trending audio or a voiceover clip you want to reference later.
Download Likee videos to any device
Likee Downloader targets the Likee short-video platform. It removes watermarks and outputs standard MP4 files compatible with every major media player.
The steps mirror the others. Find the Likee video, copy its URL, paste it into the tool, and tap download. Android, iOS, Windows, and Mac all handle the resulting file without extra software.
For batch saving, open each video link in a new tab, paste them one after another, and queue the downloads. Browser download managers group them neatly.
Tips that work across every tool
Always copy the direct post link, not a search-results or profile URL.
If a download stalls, check that the original post is still public.
Use Wi-Fi when grabbing HD files; a single high-quality clip can exceed 50 MB.
Rename files right after saving so they stay organized in your gallery.
Quick comparison of features
Tool
Platform supported
Watermark removal
Audio-only option
GetMyFb
Facebook
Yes
No
TikTokDownload.Online
TikTok
Yes
Yes (MP3)
Likee Downloader
Likee
Yes
No
Each tool solves a specific platform gap. Together they let you download videos online from three of the most active short-form networks without installing a single app.
Staying safe while downloading
Stick to tools that never ask for your social media password. The three options above only need a public URL. If any site requests login credentials, close it immediately.
Respect copyright as well. Saving content for personal offline viewing is generally fine. Re-uploading someone else’s work as your own is not. Credit the original creator when sharing or reposting.
With the right images download or video tool bookmarked, keeping your favorite social media moments is a ten-second task. Paste, tap, done.
👉 The property value grows to ₹66.55 lakh in 3 years.
6️⃣ Example 3: Future Value of Annual Rental Savings
A building generates annual surplus cash of ₹5,00,000. The amount is reinvested at 7% interest. Period = 4 years
Using annuity formula:FV=5,00,000(0.07(1.07)4−1) (1.07)4=1.3108 FV=5,00,000(0.071.3108−1) FV=5,00,000×4.44 FV≈₹22,20,000
👉 Total accumulated value after 4 years = ₹22.2 lakh.
7️⃣ Applications in Architecture & Urban Planning
🔹 1. Real Estate Feasibility
Predicting property appreciation
Estimating resale value
Forecasting rental growth
🔹 2. Transit-Oriented Development (TOD)
Estimating future land value increase
Forecasting commercial return near metro stations
🔹 3. Infrastructure Projects
Estimating future toll revenue
Predicting parking revenue growth
🔹 4. Maintenance Fund Planning
Planning sinking funds for building repairs
Estimating future corpus for redevelopment
8️⃣ Difference Between Present Value and Future Value
Future Value
Present Value
Moves money forward in time
Brings future money to present
Used for forecasting
Used for feasibility analysis
Calculates growth
Calculates discounting
9️⃣ Importance in Planning Decisions
Future Value helps planners:
Understand long-term asset appreciation
Evaluate redevelopment timing
Plan phased investment strategies
Compare long-term financial scenarios
Estimate infrastructure revenue growth
🔟 Limitations
❌ Assumes constant growth rate ❌ Does not account for risk variations ❌ Inflation uncertainty affects accuracy ❌ Market volatility not considered
11️⃣ Conclusion
Future Value (FV) is a crucial financial tool in architecture and urban planning. It helps estimate how present investments grow over time, enabling planners and developers to forecast:
Land and property appreciation
Rental growth
Infrastructure returns
Long-term financial sustainability
Understanding FV supports better strategic decision-making in long-term urban development projects.
Net Present Value (NPV) is a financial evaluation method used to determine the profitability of a project by considering the time value of money.
It answers:
“What is the present value of future cash flows after deducting the initial investment?”
Unlike ROI, NPV accounts for the fact that ₹1 today is worth more than ₹1 in the future.
2️⃣ Concept of Time Value of Money
Money received in the future must be discounted because:
Inflation reduces purchasing power
Money has opportunity cost
There is risk involved
Therefore, future cash flows are converted to present value.
3️⃣ NPV Formula
NPV=−C0+∑(1+r)tCt
Where:
C0 = Initial investment
Ct = Cash inflow in year t
r = Discount rate
t = Time period
4️⃣ Decision Rule
If NPV > 0 → Accept the project
If NPV < 0 → Reject the project
If NPV = 0 → Break-even
5️⃣ Importance of NPV in Architecture & Planning
NPV is widely used in:
Real estate feasibility studies
Urban infrastructure projects
Metro and transport projects
Sustainable building investments
PPP projects
Smart city development
It helps planners evaluate long-term economic viability.
6️⃣ Step-by-Step Numerical Example
✅ Example 1: Commercial Building Project
Initial Investment (Year 0)
₹1,00,000
Expected Cash Inflows:
Year 1 = ₹60,000 Year 2 = ₹60,000
Discount Rate = 10%
Step 1: Discount Year 1 Cash Flow
PV1=1.1060,000 PV1=54,545
Step 2: Discount Year 2 Cash Flow
PV2=1.10260,000 PV2=49,587
Step 3: Calculate Total Present Value
Total PV=54,545+49,587 Total PV=1,04,132
Step 4: Calculate NPV
NPV=1,04,132−1,00,000 NPV=₹4,132
👉 Since NPV is positive, the project is financially acceptable.
7️⃣ Example 2: Urban Parking Facility
Initial Investment = ₹2,50,00,000
Annual Net Cash Flow = ₹40,00,000 Project Life = 5 years Discount Rate = 12%
Using discount formula:
Year 1:
40,00,000/1.12=35,71,429
Year 2:
40,00,000/1.122=31,88,776
Year 3:
40,00,000/1.123=28,47,120
Year 4:
40,00,000/1.124=25,41,179
Year 5:
40,00,000/1.125=22,69,803
Total Present Value of Benefits:
≈ ₹1,44,18,307
NPV Calculation:
NPV=1,44,18,307−2,50,00,000 NPV=−₹1,05,81,693
👉 Negative NPV → Project not viable at 12% discount rate.
8️⃣ Applications in Planning
🔹 1. Transit-Oriented Development (TOD)
Used to assess:
Increased land value
Rental growth near transit
Long-term commercial viability
🔹 2. Infrastructure Projects
Metro rail
Bus terminals
Multi-modal hubs
Flyovers
🔹 3. Sustainable Building Projects
Solar energy systems
Green roofing
Energy-efficient retrofitting
🔹 4. Public-Private Partnership (PPP)
NPV helps determine:
Financial feasibility
Concession duration
Revenue sharing models
9️⃣ Advantages of NPV
✔ Considers time value of money ✔ Measures absolute profit ✔ Suitable for long-term projects ✔ Reliable for infrastructure evaluation ✔ Widely accepted in financial analysis
🔟 Limitations
❌ Requires selection of discount rate ❌ Complex compared to ROI ❌ Sensitive to future cash flow estimation ❌ Hard to monetize social benefits
11️⃣ Difference Between ROI and NPV
ROI
NPV
Percentage measure
Absolute monetary value
Ignores time value
Considers time value
Simple
More accurate
Short-term focus
Long-term focus
12️⃣ Conclusion
Net Present Value (NPV) is one of the most important financial tools in architecture and urban planning. It allows planners and architects to:
Evaluate long-term project feasibility
Compare alternative design options
Assess infrastructure viability
Support sustainable development decisions
Strengthen Detailed Project Reports (DPRs)
NPV ensures that planning decisions are economically sound, financially sustainable, and aligned with long-term urban growth strategies.
👉 Interpretation: The project earns 25% return on invested capital.
✅ Example 2: Solar Panel Installation
Installation Cost = ₹5,00,000
Total Savings over 5 years = ₹6,20,000
Net Profit:6,20,000−5,00,000=₹1,20,000 ROI=5,00,0001,20,000×100 ROI=24%
👉 Sustainable investment is financially viable.
✅ Example 3: Urban Parking Facility
Investment = ₹2,50,00,000
Total Revenue over 5 years = ₹2,75,00,000
Net Profit:2,75,00,000−2,50,00,000=₹25,00,000 ROI=2,50,00,00025,00,000×100 ROI=10%
👉 Moderate return; compare with alternative land use.
7️⃣ Advantages of ROI
✔ Simple to calculate ✔ Easy to understand ✔ Useful for comparing alternatives ✔ Helpful in early-stage feasibility studies ✔ Widely accepted by investors
8️⃣ Limitations of ROI
❌ Ignores time value of money ❌ Does not consider risk ❌ Not suitable alone for long-term public projects ❌ Does not include social and environmental benefits
Therefore, ROI is often combined with:
Net Present Value (NPV)
Internal Rate of Return (IRR)
Cost–Benefit Analysis (CBA)
9️⃣ ROI in Planning Decision-Making
In architecture and urban planning, ROI helps in:
Evaluating density options
Comparing building materials
Assessing TOD commercial potential
Estimating feasibility of PPP projects
Supporting Detailed Project Reports (DPR)
🔟 Conclusion
Return on Investment (ROI) is a fundamental financial tool that links architectural design and urban planning decisions with economic feasibility. It provides a clear, percentage-based measure of profitability, helping planners and architects ensure that projects are not only technically sound but also financially sustainable.
Cost–Benefit Analysis (CBA) is a systematic economic evaluation method used to compare the total costs of a project with its total benefits, expressed in monetary terms.
It helps answer:
“Do the benefits of this project justify its costs?”
CBA is widely used in:
Urban infrastructure projects
Transport planning
Environmental planning
Public policy decisions
Smart city and TOD projects
2️⃣ Basic Principle of CBA
A project is considered acceptable if:Total Benefits>Total Costs
More formally:Net Benefit=Total Benefits−Total Costs
If Net Benefit > 0 → Project is viable.
3️⃣ Key Formulas in Cost–Benefit Analysis
🔹 1. Net Present Value (NPV)
Since most planning projects occur over many years, future benefits and costs are discounted:NPV=∑(1+r)tBenefitst−Costst
Where:
r = discount rate
t = time period
If NPV > 0 → Accept the project.
🔹 2. Benefit–Cost Ratio (BCR)
BCR=Present Value of CostsPresent Value of Benefits
If:
BCR > 1 → Accept
BCR < 1 → Reject
4️⃣ Steps in Conducting CBA for Planning Projects
Define project scope
Identify all costs
Identify all benefits
Convert benefits into monetary value
Discount future values
Compute NPV and BCR
Perform sensitivity analysis
5️⃣ Types of Costs in Architecture & Planning
🔹 Direct Costs
Land acquisition
Construction cost
Equipment
Maintenance
🔹 Indirect Costs
Environmental impact
Traffic disruption during construction
Social displacement
6️⃣ Types of Benefits in Planning Projects
🔹 Financial Benefits
Rental income
Property value increase
Parking revenue
🔹 Social Benefits
Reduced travel time
Improved safety
Public health improvement
🔹 Environmental Benefits
Reduced pollution
Energy savings
Carbon reduction
7️⃣ Detailed Numerical Example
✅ Example: Urban Flyover Project
Initial Construction Cost (Year 0)
₹10,00,00,000
Annual Benefits:
Travel time savings = ₹2,00,00,000
Fuel savings = ₹1,00,00,000
Accident reduction benefit = ₹50,00,000
Total Annual Benefit = ₹3,50,00,000
Project Life = 5 years Discount Rate = 10%
Step 1: Calculate Present Value (PV) of Benefits
Using formula:PV=(1+r)tBenefitt
Year 1:
1.103,50,00,000=3,18,18,182
Year 2:
1.1023,50,00,000=2,89,25,620
Year 3:
1.1033,50,00,000=2,62,96,927
Year 4:
1.1043,50,00,000=2,39,06,297
Year 5:
1.1053,50,00,000=2,17,33,907
Total Present Value of Benefits:
≈ ₹13,26,80,933
Step 2: Calculate NPV
NPV=PV of Benefits−Initial Cost NPV=13,26,80,933−10,00,00,000 NPV=₹3,26,80,933
NPV is positive → Project is economically justified.
Step 3: Benefit–Cost Ratio (BCR)
BCR=10,00,00,00013,26,80,933 BCR=1.33
Since BCR > 1 → Accept the project.
8️⃣ Applications in Architecture & Urban Planning
🔹 1. Transit-Oriented Development (TOD)
Used to evaluate:
Increased land value
Reduced travel time
Environmental benefits
🔹 2. Public Transport Projects
Metro rail
Bus Rapid Transit
Multi-modal hubs
Evaluates:
Time savings
Fuel savings
Reduced congestion
🔹 3. Urban Redevelopment
Brownfield redevelopment
Slum rehabilitation
Heritage conservation
🔹 4. Environmental Infrastructure
Stormwater management systems
Solid waste management plants
Solar energy installations
9️⃣ Advantages of CBA
✔ Considers social and environmental benefits ✔ Suitable for public sector projects ✔ Helps in policy formulation ✔ Supports grant and funding approval ✔ Allows comparison of alternatives
🔟 Limitations
❌ Difficult to monetize social benefits ❌ Sensitive to discount rate ❌ Long-term projections uncertain ❌ May ignore equity issues
11️⃣ Difference Between ROI and CBA
ROI
CBA
Focus on financial profit
Includes social & environmental benefits
Used in private projects
Used in public projects
Simple calculation
More comprehensive
Short-term focus
Long-term societal focus
12️⃣ Conclusion
Cost–Benefit Analysis is a crucial evaluation tool in architecture and urban planning. Unlike simple profitability measures, CBA:
Incorporates social, environmental, and economic impacts
Annual Net Cash Flow = ₹40,00,000 Project Life = 8 years
Using financial approximation:
IRR ≈ 14–16%
If the required return is 12%, the project is financially viable.
✅ Example 3: Solar Panel Investment in Office Building
Installation Cost = ₹5,00,000
Annual Savings = ₹1,20,000 Life = 5 years
Using trial method or Excel:
IRR ≈ 18–20%
This supports sustainable investment decision-making.
5️⃣ Applications of IRR in Architecture & Urban Planning
🔹 1. Real Estate Feasibility Studies
Apartment development
Commercial complex
Mixed-use buildings
Helps developers decide project scale and phasing.
🔹 2. Transit-Oriented Development (TOD)
IRR helps evaluate:
Increased land value
Higher rental income near transit
Mixed-use density benefits
🔹 3. Public-Private Partnership (PPP)
IRR determines:
Concession period
Revenue sharing ratio
Private investor attractiveness
🔹 4. Infrastructure Projects
Used for:
Metro stations
Bus terminals
Multi-level parking
Smart city infrastructure
🔹 5. Sustainable Building Investments
IRR justifies:
Green roof systems
Solar panels
Energy-efficient façade
Water recycling systems
6️⃣ Advantages of IRR
✔ Considers time value of money ✔ Useful for long-term projects ✔ Easy comparison between alternatives ✔ Widely accepted in financial markets ✔ Useful for PPP and infrastructure projects
7️⃣ Limitations of IRR
❌ Complex to calculate manually ❌ May give multiple IRRs in unusual cash flow patterns ❌ Does not show absolute profit amount ❌ Can mislead if project sizes differ
Therefore, IRR should be used along with:
NPV
ROI
Payback Period
Cost-Benefit Analysis
8️⃣ Difference Between ROI and IRR
ROI
IRR
Simple profitability ratio
Time-adjusted return
Ignores time value
Considers time value
Easy to calculate
Requires iteration
Short-term focus
Long-term focus
9️⃣ Practical Use in DPR Preparation
When preparing a Detailed Project Report:
Estimate yearly cash flows
Apply discounting
Calculate IRR
Compare with cost of capital
Recommend project acceptance or rejection
🔟 Conclusion
Internal Rate of Return (IRR) is one of the most powerful financial tools in architecture and urban planning. It helps evaluate:
Real estate viability
Infrastructure feasibility
TOD development returns
Sustainable design investments
PPP financial attractiveness
For architects and planners, understanding IRR ensures that projects are not only technically sound and aesthetically strong but also financially sustainable.
Return on Investment (ROI) in Architecture and Planning Projects
1️⃣ What is Return on Investment (ROI)?
Return on Investment (ROI) is a financial performance indicator used to evaluate the profitability of an investment. It measures how much return is generated relative to the cost invested in a project.
🔹 Formula
ROI(%)=Initial InvestmentNet Profit×100
Where:Net Profit=Total Gain−Initial Investment
ROI expresses profitability as a percentage, making it easy to compare different projects.
2️⃣ Why ROI is Important in Architecture and Planning
In architecture and urban planning projects, investments are usually large and long-term. ROI helps:
Assess financial feasibility
Compare alternative design options
Justify project approval to stakeholders
Evaluate redevelopment projects
Support public-private partnership (PPP) decisions
Prioritize infrastructure investments
For planners and architects, ROI bridges design thinking and economic rationality.
3️⃣ Where ROI is Used in Architecture and Planning
1. Real Estate Development Projects
Residential apartments
Commercial office buildings
Shopping malls
Mixed-use developments
2. Urban Redevelopment Projects
Brownfield redevelopment
Transit-Oriented Development (TOD) zones
Heritage adaptive reuse
3. Infrastructure Projects
Parking structures
Bus terminals
Metro station area development
Smart city projects
4. Sustainable Design Decisions
Solar panel installation
Rainwater harvesting systems
Energy-efficient façades
Green building materials
5. Public Projects (Cost-Benefit Support)
Urban parks
Pedestrian infrastructure
Streetscape improvements
4️⃣ How to Use ROI in Architecture and Planning Projects
Step 1: Identify Initial Investment
Include:
Land cost
Construction cost
Consultant fees
Approval charges
Equipment cost
Marketing cost
Step 2: Estimate Total Return
Returns may include:
Sale revenue
Rental income
Increased property value
Energy savings
Reduced maintenance cost
Increased tax revenue (public projects)
Step 3: Calculate Net Profit
Net Profit=Total Returns−Initial Investment
Step 4: Apply ROI Formula
ROI=Initial InvestmentNet Profit×100
5️⃣ Detailed Examples in Architecture & Planning Context
✅ Example 1: Residential Apartment Project
Initial Investment:
Land: ₹40,00,000
Construction: ₹50,00,000
Other costs: ₹10,00,000
Total Investment = ₹1,00,00,000
Total Sales Revenue = ₹1,25,00,000
Net Profit:1,25,00,000−1,00,00,000=25,00,000 ROI=1,00,00,00025,00,000×100 ROI=25%
👉 This indicates strong financial viability.
✅ Example 2: Solar Panel Installation in Commercial Building
Installation Cost = ₹5,00,000
Annual Energy Savings = ₹80,000 Project Life Considered = 5 years
Total Savings in 5 years:80,000×5=4,00,000
Assume property value increase = ₹2,20,000
Total Return = ₹6,20,000
Net Profit:6,20,000−5,00,000=1,20,000 ROI=5,00,0001,20,000×100 ROI=24%
👉 Supports sustainable investment decision.
✅ Example 3: Parking Structure in Urban Area
Investment = ₹2,50,00,000
Total Parking Revenue over 5 years = ₹2,75,00,000
Net Profit:2,75,00,000−2,50,00,000=25,00,000 ROI=2,50,00,00025,00,000×100 ROI=10%
👉 Moderate ROI; planner may compare alternatives.
6️⃣ ROI in Urban Planning Decision-Making
ROI helps in:
✔ Comparing Design Alternatives
Example:
Glass façade vs energy-efficient façade
Conventional materials vs green materials
✔ Evaluating TOD Projects
Increased land value near transit
Higher rental income
Increased density returns
✔ Public Investment Justification
Economic multiplier effects
Tax increment financing
Urban regeneration impact
7️⃣ Advantages of ROI in Planning
Simple to calculate
Easy to interpret
Comparable across projects
Useful for private investors
Supports financial feasibility studies
8️⃣ Limitations of ROI in Architecture & Planning
Does not consider time value of money
Ignores social and environmental benefits
Not suitable alone for long-term public projects
Does not capture intangible value (livability, safety, aesthetics)
Therefore, ROI should be used along with:
Net Present Value (NPV)
Internal Rate of Return (IRR)
Cost-Benefit Analysis (CBA)
Social Return on Investment (SROI)
9️⃣ Practical Application for Architects & Planners
When preparing a Detailed Project Report (DPR):
Estimate project cost
Forecast revenue or savings
Compute ROI
Compare multiple scenarios
Present ROI to clients/investors
Use ROI to optimize design choices
🔟 Conclusion
Return on Investment (ROI) is a fundamental financial tool that connects design, planning, and economics. In architecture and urban planning, ROI supports:
Investment decisions
Sustainable design adoption
Real estate feasibility
Infrastructure planning
Policy justification
While ROI is not sufficient alone for public welfare projects, it remains essential for financially driven development and strategic planning decisions.
As critical transitional zones between terrestrial and marine environments, estuarine ecosystems provide unique biodiversity and indispensable ecosystem services. These sensitive habitats are constantly threatened by human activities such as pollution and land-use change. This study was carried out to investigate the variations in some physicochemical parameters and heavy metal concentration levels in three coastal estuaries along the Ratnagiri coast. Water samples were collected from Bhatye, Kalbadevi and Sakhartar estuaries during monsoon (2022), winter (2022), and summer (2023). Air temperature ranged from 24.8°C to 33.5°C, water temperature varied between 24.2°C and 31.1°C – both showing distinct seasonal patterns. The pH values were in the range of 7.0 to 8.3 and the salinity values between 12.8-33.2 ppt, which reflected the freshwater-marine gradient influenced by monsoonal dynamics. The dissolved oxygen content of water was in the range 4.5 to 7.4 mg/L with higher values during monsoon due to increased turbulence and freshwater inflow. The heavy metals in water were Lead (1.39-3.90 μg/L), Cadmium (0.110-0.341 μg/L), Chromium (2.56-7.98 μg/L), Nickel (1.92-5.10 μg/L) and Zinc (6.21-15.36 μg/L), all within WHO permissible limits but with areas of localized increase at Kalbadevi estuary near industrial discharge points. In space, the pattern of pollutions is reflected with Sakhartar estuary still enjoying almost pristine conditions; Bhatye shows some (but not serious) contamination; while Kalbadevi estuary clearly suffered from man’s activities. These results furnish baseline data essential for long-term observation and sustainable development of the marine environment in Ratnagiri region.
Keywords: Ratnagiri coast, dissolved oxygen, physicochemical parameters, heavy metals, and seasonal variation.
1. INTRODUCTION
Estuarine ecosystems are characterized by unique hydrological, chemical, and biological features (Pritchard, 1967; 2004). These transitional zones are extremely productive biologically, act as breeding and nursery grounds for commercially important fish and shellfish, and perform essential ecological services such as nutrient recycling, sediment trapping and pollution filtration (Day et al). In India’s Maharashtra state, Ratnagiri’s lush Konkan coastline harbors a number brief. lasting river systems that are of high ecological value and has. The physico-chemical parameters of estuarine water are fundamental measures of ecosystem health and water quality (Chapman & Wang, 2001). Temperature controls the metabolic rates of aquatic organisms and the solubility of dissolved oxygen, while pH and salinity are critical determinants of species distribution and biological productivity. Dissolved oxygen (DO) is essential for aerobic respiration, and it provides an important yardstick of water quality (Wetzel, 2001). The discharge of heavy metals from industrial, agricultural and urban sources has become a major global concern in recent years in estuarine systems (Rainbow, 1995; Zhang et al.). Metals such as lead (Pb), cadmium (Cd), chromium (Cr), nickel (Ni) and zinc (Zn) have high toxicity, are bioavailable, and persist in the aquatic ecosystem (Förstner & Wittmann, 2012).
Development for the Ratnagiri coast has taken place mainly in three sectors: urban expansion, development of ports and industrial estates (Zingde et al., 1999; Achary et al., 2015). The three estuaries of this study represent varying degrees anthropogenic impact. Bhatye Estuary, a moderate site near human activities serves as the control threshold; Kalbadevi Estuary is located near sources of heavy metal pollution, such as industrial zones; Sakhartar Estuary, meanwhile, is virgin territory.The current investigation seeks to: (1) assess air and water temperatures, pH, salinity concentrations in estuarine water both spatially and temporally; (2) determine the levels of heavy metals in estuarine waters (Pb, Cd, Cr, Ni, Zn); 3) evaluate the situation relative to national and international standards regarding water quality; and (4) investigate sources of potential environmental pollution through metal contamination. This research is core data for any extensive monitoring program lasting decades or centuries in the Ratangiri area.
2. MATERIALS AND METHODS
2.1 Study Area
The geographic setting of the study is the Ratnagiri coast along 16°59–17°30′ North latitude and 73°10–73°30′ East longitude in India’s Maharashtra state. Three sampling stations were chosen according to their strategic positions and varying estuarine characteristics: Bhatye estuary, where there is only moderate human influence; Kalbadevi estuary near an industrial belt with higher pollution levels due to the proximity of surrounding industries; and Sakhartar estuary now relatively unaffected by human activity as its former industry-first policy has been reversed completely. The climate is typical for a tropical zone with three distinct seasons: the monsoon period (June to September); winter-post monsoon (October – February); and pre-summer (March – May). Precipitation falls most heavily during this time, an annual total of between 3000-4000mm occurring mainly from the southwest monsoon wind.
2.2 Sample Collection
In 2022 water samples are taken at three different points in time: monsoon season (June to September 2022), winter season (November 2022 – Mid January 2023) and summer months of 2023 late spring period (March-May 2003). Samples were taken during high tide to reduce differences among sites. Surface water samples (> 0.5m depth) can be collected in pre-cleaned polyethylene bottles according to the standard method of procedure (APHA, 2017). But mineral maxi scope testing should not take place immediately so as not to bring water from one place to another and wash out all of its mineral contents before examination can take place. Acid-washed (10% HNO3) polyethylene bottles are used to collect all samples in. For heavy metal analysis, the pH of the HNO3 was always less than 2 when it went off in containers back at sea. Uptake tubes as well as the lead container were accompanied by two sample blanks filled with deionized water. All samples were taken to the laboratory in ice cooled containers and processed within 6 h of collection.
2.3 Physico-Chemical Analysis
We measured air temperature with a mercury thermometer (accuracy ± 0.1 C) but water temperature was taken on-location by a calibrated digital thermometer. pH was measured using a digital pH meter (Eutech Instruments, accuracy ± 0.01) and salinity determined using a refractometer (± 0.1 ppt). Dissolved oxygen was determined by Winkler’s azide modification method with an analytical accuracy of ± 0.05 mg/L (APHA 2017).
2.4 Heavy Metal Analysis
Samples were filtered through 0.45 μm membrane filters and digested with concentrated HNO₃ and H₂O₂ by US EPA Method 3015A. Heavy metal Contents (Pb, Cd, Cr, Ni, Zn) were determined using Inductively Coupled Plasma Mass Spectrometry (ICP-MS, Perkin Elmer NexION 2000). Quality control consisted of analysis of certified reference materials (NIST 1643f), method blanks, and duplicate samples. Detection limits were: Pb (0.05 μg/L), Cd (0.01 μg/L), Cr (0.1 μg/L), Ni (0.1 μg/L), and Zn (0.5 μg/L). Values c (Recoveries) ranged between 92% and 108%, with a relative standard deviation<5%.
2.5 Statistical Analysis
The data were processed by SPSS Statistics 26.0. For all variables, figures demonstrate the mean variance as mentioned previously in this section as this subsection illustrates.For seasonal and spatial variations, we used one-way ANOVA. After each of the seasons is tested in turn for the mean of all other seasons combined, we applied post-hoc Tuckey’s HSD test.They used Pearson correlation analysis to study the relationship between these parameters. The standard for choosing p-values is 0.05 or less, rather than to four digits than in previous sentences.
3. RESULTS
3.1 Physico-Chemical Parameters
These eco-environmental conditions will be explored in detail in the following 12 chapters. The physico-chemical parameters ranging from 140 to 1,800 umol/liter-1 showed distinct seasonal and spatial variabilities across the three estuaries Air temperature ranged from 24.8°C(Sakhartar, Winter 2022) to 33.5°C(Bhatye, Summer 2023), with seasonal means of 32.0°C(summer), 27.2°C(Monsoon) and 26.1°C(Winter) Water temperature showed similar patterns, ranging from 24.2°C to 31.1°C, with highest values in summer and lowest during winter. There was a strong positive correlation between air and water temperatures (r = 0.91, p <0.001).
pH values ranged from 7.0 to 8.3 across all stations and seasons, with monsoon samples showing lower pH values(7.2-7.6) due to freshwater influx and organic acid inputs. Winter and summer pH values were relatively higher(7.5-8.3), reflecting increased marine influence and reduced freshwater dilution. Salinity exhibited pronounced seasonal variation, ranging from 12.8 ppt(Kalbadevi, Monsoon 2022) to 33.2 ppt(Sakhartar, Summer 2023). Monsoon salinity (13-20 ppt) was significantly lower than winter (20-28 ppt) and summer (26-33 ppt), due to increased river discharge and freshwater influx.
Dissolved oxygen concentrations ranged from 4.5 mg/L(Kalbadevi, Summer 2023) to 7.4 mg/L(Sakhartar, Monsoon 2022). Seasonal variability was significant (F = 42.3, p < 0.001), with highest values during monsoon (6.5-7.4 mg/L) and lowest in summer (4.5-5.8 mg/L). Kalbadevi estuary showed consistently lower levels of DO (4.5-6.8 mg/L) than Bhatye (5.4-7.1 mg/L) and Sakhartar(5.8-7.4 mg/L), indicating stronger organic pollutant load from industrial activities. Negative correlation was found between water temperature and DO (r = -0.78, p < 0.001), indicating reduced oxygen solubility in high temperatures.
Table 1: Physico-chemical parameters in Bhatye, Kalbadevi, and Sakhartar estuaries
Estuary
Season
Air Temp (°C)
Water Temp (°C)
pH
Salinity (ppt)
DO (mg/L)
Bhatye
Monsoon 2022
28.9
27.1
7.43
19.2
7.1
Winter 2022
26.2
26.1
7.89
26.3
6.2
Summer 2023
33.5
31.1
8.11
30.8
5.4
Kalbadevi
Monsoon 2022
26.8
26.5
7.21
12.8
6.8
Winter 2022
25.8
25.3
7.52
22.7
5.8
Summer 2023
31.6
29.9
7.98
31.2
4.5
Sakhartar
Monsoon 2022
25.7
25.1
7.56
17.8
7.4
Winter 2022
24.8
24.2
7.71
20.8
6.5
Summer 2023
30.8
28.6
8.28
33.2
5.8
Table 2: Heavy metal concentrations in Bhatye, Kalbadevi, and Sakhartar estuaries
Estuary
Season
Pb (μg/L)
Cd (μg/L)
Cr (μg/L)
Ni (μg/L)
Zn (μg/L)
Bhatye
Monsoon 2022
1.63
0.129
3.01
2.26
7.30
Winter 2022
1.90
0.161
3.72
2.98
8.76
Summer 2023
3.39
0.296
6.94
4.44
13.35
Kalbadevi
Monsoon 2022
1.88
0.149
3.46
2.60
8.40
Winter 2022
2.19
0.185
4.28
3.43
10.08
Summer 2023
3.90
0.341
7.98
5.10
15.36
Sakhartar
Monsoon 2022
1.39
0.110
2.56
1.92
6.21
Winter 2022
1.61
0.137
3.16
2.53
7.44
Summer 2023
2.88
0.252
5.90
3.77
11.35
3.2 Heavy Metal Concentrations
According to data from a heavy metal analysis, concentrations detected across the three estuaries and seasons were different (Table 2). Lead concentrations varied from 1.39 μg/L (Sakhartar, Monsoon 2022) to 3.90 μg/L (Kalbadevi, Summer 2023), Kalbadevi estuary showing constantly higher levels of lead due to industrial wastewater discharge. Cadmium concentrations were relatively low (0.110-0.341 μg/L), all sites well below the WHO Drinking Water Quality Guidelines 3 μg/L.Chromium levels varied from 2.56 μg/L to 7.98 μg/L, the Kalbadevi estuary having the most for this metal during summer (7.98 μg/L), probably due to effluents from tanneries and electroplating factories nearby.Incidentally Nickel concentrations were from 1.92 to 5.10 μg/L and zinc levels varied between 6.21-15.36 μg/L. None of these were in excess of WHO allowable limits (Pb 10 μg/L, Cd 3 μg/L, Cr 50 μg/L, Ni 70 μg/L, Zn 5000 μg/L), so in general water quality was considered acceptable, despite local peaks.Due to less dilution and greater evaporation, metal concentrations were higher in summer. When the monsoonal rains came and brought a large amount of fresh water into the sea, levels then dropped appreciably. The three sites studied, Kalbadevi had the highest metal pollution index (calculated by adding the concentrations of each metal divided by the standard) at 0.42, while Bhatye measured 0.36 and Sakhartar 0.31.
3.3 Spatial and Seasonal Variations
The data show that significant differences among estuaries exist in most parameters (p> 0.05). However, Kalbadevi estuary carried a heavy load of industrial pollution. Concentrations of heavy metals there were high; ditto for demineralized oxygen levels (DO). Sakhartar estuary, clean and untarnished by human contact, still maintained that status with the highest values of DO and lowest entanglement in waste discards. Bhatye estuary had a little virgin goodness to it as well. The water was pure in springs and there wasn’t just an industrial spot. Cluster analysis classified the three estuaries into three clear groups of pristine (Sakhartar), moderately impacted (Bhatye) and anthropogenically influenced (Kalbadevi).
4. DISCUSSION
The Bhatye, Sakhartar and Kalbadevi estuaries may be geographically remote from each other but we are frequently associated with flood relief work in one or more of these areas. The harpical coastal ecosystem on the whole is a variable entity, as its appearance and the native forms of life it supports depend not only on natural factors but also upon human activity. The strong correlation between air and water temperatures (r = 0.91) suggests efficient heat transfer and little or no stratification. During the monsoon season, temperature decreases are attributed to increased cloud cover, reduced solar radiation, and cooler freshwater inputs from upstream catchments. The pH and salinity vary quite obviously according to monsoon dynamics. Water between pH values of 7.0 to 7.6) during the monsoon season (June-August) result from increased terrestrial organic acids and humic substances and the lackof marine water to counteract this acidic hydrogen. Chemical salinity levels, meanwhile, shift from monsoon [12.8-20.0 ppt] to summer [26.2-33.2 ppt], reflect the passage the transitionof brackish water towards the tome ecological conditions characteristic of the tropical estuary’s seasonal water cycle (Vijayakumar et al., 2000).Not only are multi-faceted factors such as temperature, salinity, photosynthesis and respiration, as well as anthropogenic inputs all at work on the dissolved oxygen and yet at exactly this moment in human history we have the unprecedented ability to solve those problems. This study recorded the negative correlation between temperature and DO (r = -0.78), which accords with basics of gas solubility: as temperature increases, so does the decrease in solubility of oxygen (Weiss, 1970). But during the monsoon season, river water drainage increased turbulence leads to higher levels of atmospheric oxygen and less biological oxygen demand due to dilution of organic matter. In contrast, DO concentrations are relatively low in Kalbadevi estuary (4.5-6.8 mg/L) to Bhatye (5.4-7.1 mg/L) and Sakhartar (5.8-7.4 mg/L) prompting concerns about organic pollution from industrial effluents and urban run-off. Still within the current range above hypoxic thresholds (< 2 mg/L), the minimum water temperature in summer is approaching critical lower limits (4.5 mg/L). Attention must be paid to this, as hypoxia can have ecological consequences: fish will die; trophic structures will alter and other habitats degrade (Vaquer-Sunyer& Duarte, 2008). Stricter controls on industrial effluent discharges should be imposed at Kalbadevi.
Heavy metal concentrations within WHO permissible limits meant the good water quality for estuaries was relatively well maintained. But local spatial variability suggests there are anthrogenic sites at some of these districts (Chen et al., 1995). For example, industrial discharge releases at electroplating plants, tanneries and steel factories probably account for the higher levels of lead and chromium in Kalbadevi estuary. In this water, chromium concentrations reach up to 7.98 μg/L, an indication that global environmental fate may be slowly settling (Chowdhury et al., 2016). As a result, metal concentrations decrease by 40-60% during the rainy season across three estuaries, a phenomenon observed in other Indian coastal systems (Mohiuddin et al., 2010; Srichandan et al., 2016). However, this seasonal dilution may transmit contamination downstream into coastal ecosystems for marine life. Long-term sediment and biotic bioacumulation studies are essential to understand the risks of chronic exposure, since heavy metals are biomagnified by food chains even at low water column concentrations (Luoma & Rainbow, 2008). The spatial distribution of zinc remained similar to these other metals. Yet so far concentrations have been well below WHO limits (from 6.21-15.36 μg/L) and showed little seasonal change at Kalbadevi estuary. Nickel levels stayed stable (1.92-5.10 μg/L), suggesting there was a limited impact from the nickel-related factories. Such substances will most likely all come from the city’s industrial waste waters or from the garbage that year in and out (the strong correlation between zinc and lead r=0.84, p<0.001).
In comparison with west coast estuaries have water that is similar or worse in quality in areas such as heavily industrialized Thane Creek and the Ratnagiri three estuaryare Furthermore, therefore, for its treatment situation to deteriorate is an inevitable outcome if We must respond immediately as an intermediate monitoring site.The Sakhartar estuary, which has little impact on humans and a high ecological value, should be established for long-term reference. The limitations of this study its scope in time (three seasonal periods over one year) and lack of sediment or biological analysis combine to leave comprehensive ecological health assessment out of reach Future research projects need to incorporate biological indicators like phytoplankton diversity, communities in benthic macroinvertebrates and population structure As Ratnagiri’s coastline urbanizes more and more, monitoring should also include emergent contaminants such as pharmaceuticals, personal care products and microplastics.
5. CONCLUSIONS
This research provides a wealth of baseline data on physicochemical parameters and heavy metal content in three estuarine waters (Bhatye, Kalbadevi and Sakhartar) along the Ratnagiri coast.
The main findings include: Temperatures were distinctly seasonal, with air temperature ranging from 24.8 °C to 33.5 °C and water temperature from 24.2°C up to∼ 31.1°C as a result of monsoonal dynamics or radiation from the sun.The pH (7.0–8.3) and salinity (12.8–33.2 ppt) also exhibited pronounced periodic variation; this reflects a shift between freshwater-dominated (monsoon season) to marine-dominated (summer season) conditions.All stations measured oxygen concentrations above the critical threshold (4 mg/L), except for the Kalbadevi estuary area during summer (4.5 mg/L) which trends towards an elevated organic pollution level due to industrial effluents.As for heavy metal levels, Pb (1.39 – 3.90 μg/L), Cd (0.110 – 0.341 μg/L), Cr (2.56 – 7.98μg/L), Ni (1.92 – 5.10μg/L) and Zn (6.21 – 15.36 μg/L) are all within WHO standard lower limit lines. Over all, water quality is considered acceptable. However, in local areas like Kalbadevi estuary near industrialized zones there exist peaks. Kalbadevi and its surroundings show a clear pattern of spatial heterogeneity, with varying degrees of anthropogenic influence: Sakhartar (pristine but with some local pollution now) <Bhatye (moderate) <Kalbadevi (heavily industrialized).
Monsoonal dynamics regulate the water quality, with 40- 60% seasonal reduction in contaminants compared with summer. These finds demonstrate the need for sustained and constant monitoring, strict control of industrial discharges and integrated management of Ratnagiri estuary ecological health. Specific recommendations include: (1) Establishment of continuous water quality monitoring stations at all three estuaries. (2) Industries located near Kalbadevi estuary should be made to limit their effluent discharge standards even more meticulously, in (3). Sakhartar becomes a marine reserve area and serves as a long-term reference for future evaluation of estuarine conditions, and (4). Sediment quality and bioaccumulation studies of commercial fish species in these vital but now polluted estuaries should be made at least every two years to ensure that the seas can continue to feed us well. It is imperative to work out early warning systems and adaptive management strategies for maintaining ecosystem health in the face of ongoing coastal development and climate change.
ACKNOWLEDGMENTS
The authors acknowledge the Principal, Head and Director of the Research Centre in Department of Zoology, Padmashri Vikhe Patil College of Arts, Science and Commerce, Pravaranagar, for providing the necessary laboratory facilities and valuable support. The authors also thank Savitribai Phule Pune University, Pune, for giving permission to carry out this study.
REFERENCES
Achary, M.S., Satpathy, K.K., Panigrahi, S., Mohanty, A.K., Padhi, R.K., Biswas, S., Prabhu, R.K., Vijayalakshmi, S., &Panigrahy, R.C. (2015). Concentration of trace metals in seawater, sediments and biota of Kalpakkam coast, southeast coast of India. Marine Pollution Bulletin, 97(1-2), 104-115.
APHA (2017). Standard Methods for the Examination of Water and Wastewater (23rd ed.). American Public Health Association, Washington, DC.
Chapman, P.M., & Wang, F. (2001). Assessing sediment contamination in estuaries. Environmental Toxicology and Chemistry, 20(1), 3-22.
Chowdhury, S., Mazumder, M.A.J., Al-Attas, O., & Husain, T. (2016). Heavy metals in drinking water: Occurrences, implications, and future needs in developing countries. Science of the Total Environment, 569-570, 476-488.
Day, J.W., Christian, R.R., Boesch, D.M., Yáñez-Arancibia, A., Morris, J., Twilley, R.R., Naylor, L., Schaffner, L., & Stevenson, C. (2012). Consequences of climate change on the ecogeomorphology of coastal wetlands. Estuaries and Coasts, 31(3), 477-491.
Diaz, R.J., & Rosenberg, R. (2008). Spreading dead zones and consequences for marine ecosystems. Science, 321(5891), 926-929.
Förstner, U., & Wittmann, G.T.W. (2012). Metal Pollution in the Aquatic Environment (2nd ed.). Springer Science & Business Media.
Luoma, S.N., & Rainbow, P.S. (2008). Metal Contamination in Aquatic Environments: Science and Lateral Management. Cambridge University Press.
McLusky, D.S., & Elliott, M. (2004). The Estuarine Ecosystem: Ecology, Threats and Management (3rd ed.). Oxford University Press.
Mohiuddin, K.M., Ogawa, Y., Zakir, H.M., Otomo, K., &Shikazono, N. (2010). Geochemical distribution of trace metal pollutants in water and sediments of downstream of an urban river. International Journal of Environmental Science & Technology, 7(1), 17-28.
Pritchard, D.W. (1967). What is an estuary: Physical viewpoint. In G.H. Lauff (Ed.), Estuaries (pp. 3-5). American Association for the Advancement of Science.
Rainbow, P.S. (1995). Biomonitoring of heavy metal availability in the marine environment. Marine Pollution Bulletin, 31(4-12), 183-192.
Srichandan, S., Kim, J.Y., Kumar, A., Mishra, D.R., Bhadury, P., Muduli, P.R., Pattnaik, A.K., & Rastogi, G. (2016). Interannual and cyclone-driven variability in phytoplankton communities of a tropical coastal lagoon. Marine Pollution Bulletin, 101(1), 39-52.
Vaquer-Sunyer, R., & Duarte, C.M. (2008). Thresholds of hypoxia for marine biodiversity. Proceedings of the National Academy of Sciences, 105(40), 15452-15457.
Vijayakumar, S., Menon, N.R., &Harkantra, S.N. (2000). Seasonal variations in benthic conditions in Zuari estuary, west coast of India. Indian Journal of Marine Sciences, 29(3), 222-228.
Weiss, R.F. (1970). The solubility of nitrogen, oxygen and argon in water and seawater. Deep-Sea Research, 17(4), 721-735.
Wetzel, R.G. (2001). Limnology: Lake and River Ecosystems (3rd ed.). Academic Press.
Zhang, C., Yu, Z.G., Zeng, G.M., Jiang, M., Yang, Z.Z., Cui, F., Zhu, M.Y., Shen, L.Q., & Hu, L. (2014). Effects of sediment geochemical properties on heavy metal bioavailability. Environment International, 73, 270-281.
Zingde, M.D., Singbal, S.Y.S., Moraes, C.F., & Reddy, C.V.G. (1999). Arsenic, copper, zinc and manganese in the marine flora and fauna of coastal and estuarine waters around Goa. Indian Journal of Marine Sciences, 5(3), 212-217.
Abstract: The look east policy is the significant forcing policy initiative of India in the post cold war era and proved immensely successful for both the partners. The two sides are engaged in meeting the goals of India ASEAN partnership for peace, progress and prosperity.
Introduction:
India’s road to ASEAN opened with India becoming the sect oral dialogue partner in 1992 and full dialogue partner in December in 1995. India became a member of Asian Regional Forum (ARF) in July 1996 and held its first Summit meeting with ASEAN in 2002 since then India is participating in cooperation with ASEAN Countries. The Summit meeting has played a significant role in caring for Indian ASEAN relations. It is one of the most Comprehensive, fruitful friendships leading to a partnership of peace progress and shared prosperity in Asia. The Summit Partnership helped to Agreement India ASEAN ties which cultivated into fruitful and meaningful partnership for the Two decades above and diplomatic victory for India’s look policy.
1. First India ASEAN Summit in Phnom Penh on 5th Nov.2002:
Summit in Phnom Penh on 5th November 2002: The institutionalization of ASEAN India relations came with the first ASEAN India summit in Phnom Penh on 5 November 2002 and was the success of India’s look east policy. It was considered an acknowledgement of India’s emergence as a key player in the Asia Pacific Region16. This breakthrough came after a long and arduous effort in the part of the Indian diplomacy to convince ASEAN countries to hold separate ASEAN summits. The first association of South East nations India summit held in Cambodia set the stage for India to more purposefully ahead in developing a broad strategic partnership with the South East Asian countries while Indian political leaders constantly ponder upon how they will enhance the prospecting of their peoples.17 The first ever summit has been the landmark development heralding a new path in relationship of India ASEAN
2. India ASEAN Second summit in Bali on Oct. 2003:
The second India ASEAN summit was held in Bali Indonesia in October 2003. India and ASEAN had signed three agreements which were a framework agreement on comprehensive economic cooperation leading to the creation of free trade areas by the year 2001. The 2nd document is India’s accession to the Treaty of Amity and Cooperation in South East Asia.
The Third agreement was on cooperation to ASEAN Treaty of Amity and cooperation spoke of a growing closeness with Southeast Asia and was seen as another step towards India’s look East policy but of greater signification was the framework agreement aimed at creation of a free Trade area in ten years as provided in the agreement on comprehensive economic cooperation.
A joint declaration signed by India ASEAN for cooperation in combating international terrorism. The joint declaration stipulates cooperation in) exchange information 2. Legal and enforcement matters. 3. Institutional capacity augmentation 4. The signing of Treaty of Amity and cooperation TAC expressed its adherence to the ASEAN goal of regional peace and stability.
3. The Third India – ASEAN Summit in Laos in November 2004:
The third India ASEAN Summit took place at Vientiane in Laos in November 2004 whereby the prime minister of India welcomed the adoption by ASEAN leaders of the Violating Action programme VAP to realize the goals of the ASEAN vision 2020 and the ASEAN Declaration Concord IInd. India expressed its support to the implementation of activities and projects under the VAP. They also signed the “ASEAN India partnership for peace, progress and shared prosperity. And adopted its plan of action to expand and deepen their partnership and cooperation in the century. They also acknowledged that the signing of partnership will assure India’s accession to the Treaty of Amity and cooperation in South Asia. The Joint Declaration for Cooperation to combat international Terrorism by The ASEAN India. Reflected our determination and commitment to move forward the relationship in substantive comprehensive and purposeful manner contributing to regional peace and stability and shared economic prosperity and development.18
4. The fourth ASEAN India summit in Kuala Lumpur on 13 December 2005:
The fourth India ASEAN Summit was held in Kuala Lumpur, Malaysia successfully on 13 December 2005. The plan of Action to implement the ASEAN India partnership for peace, progress and prosperity signed at the Third India ASEAN summit. Progress was made in the area of cooperation including agriculture, health and pharmaceuticals science and technology, Transport and infrastructure, human resource development, ICT and people to people interaction. The leaders expressed appreciation to India for the US 2.5 million replenishment to ASEAN India cooperation fund they tasked ministers and senior officials to accelerate the implementation of the ASEAN India plan of Action through concrete activities programme and projects Expressed appreciation India’s continued support for the initiative for ASEAN integration in particular India’s officer to establish and maintain satellite based network linking India with the 4 clung countries for Tele education application and tale medicine.
5. The fifth India ASEAN Summit in Cebu Philippines on 14 January 2007:
The fifth India ASEAN Summit on 14 January 2007 was held successfully in Cebu, Philippines. The leaders expressed satisfaction with the all achievement of India ASEAN relation. The major areas of cooperation were Trade, investment, Tourism science and techniques, human resource development and people to people contract information and communication technology. The talk on “open skies” between India ASEAN agreements which would liberalize air service was also commenced, so as to have faster interaction and movement between Southeast Asia and India. It was agreed that connectivity would be further enhanced with the establishment of a transport network between India and CLMV countries19. The project such as:
1) ASEAN India IT industry forum 2. ASEAN network project establishing a VSAT based tele education and medicine network to connect CLMV countries was to be implemented20.
6. The Sixth India ASEAN summit in Singapore on 21 Nov. 2007:
The 6th India ASEAN Summit was held on 21 Nov. 2007 in Singapore whereby the ASEAN leaders welcomed India’s continued support for ASEAN’s efforts to build an ASEAN community by 2015. they expressed appreciation for India’s support for the Vientiane action programme and to narrow the development gap within ASEAN through its various contributions including the initiative for ASEAN integration and other sub regional growth initiatives” ASEAN leaders appreciated India’s offer to set up on “ASEAN India’s Green fund” with an initial contribution from India of US 5 million. They expressed their satisfaction for India’s contribution of US million to operationalise. The ASEAN India science and technology Development fund;The Fund would intensify research and development cooperation in science and information technology, and enable ASEAN to tap India’s expertise in those fields.
7. The Seventh India ASEAN Summit in HuaHin, in October 2009:
The 7thIndia ASEAN Summit in October 2009 in HuaHin Thailand in October 2009, India announced a contribution of USD 50 million to ASEAN India cooperation fund to Support ASEAN India project across the range of sectors. India has set up an ASEAN India. science and technology development fund with an initial corpus fund of USD one million and USD 5 million ASEAN India Green fund for Pilot project to promote adoption and mitigation Technologies in the field of climate change the signing of ASEAN India trade in goods agreement took place at the 41st ASEAN Economic ministers meeting on 13 August 2009 which has encouraged its earlyimplementation by January 2010. It was hoped the agreement would allow producers and exporters to drive full benefit from the potential of combined markets. To further reap the benefits of free trade, the ministers and officials of India and ASEAN countries were entrusted to work towards the early conclusion of services and investment agreements.
8. The Eighth India – ASEAN Summit in Ha Noi, on 30 October 2010:
The 8th India ASEAN Summit was held on 30 October 2010 in Ha Woi in Vietnam. The Summit meeting reviewed ASEAN India Dialogue relations and expressed satisfaction at the growth of cooperation which has developed into Multi faceted and dynamic partnership contributing to regional peace, mutual understanding and closer economic interaction. The Summit welcomed the proposal of India to host the ASEAN India commemorative Summit in India in 2012 and tasked officials to work out substantive activities to mark the celebration of 20th anniversary of ASEAN India Dialogue relations and the Tenth anniversary of the ASEAN Indian Summit.
In that time efforts of both sides to draft the ASEAN India plan of action POA to implement the ASEAN India partnership for peace, progress and shared prosperity from 2010 to 2015 which was going to serve as a key instrument to make ASEAN India cooperation more action oriented. Contributing to the ASEAN India Dialogue partnership and complementing the ASEAN in integration and community building. The leaders agreed to launch the POA on this occasion and tasked ministers and officials to implement the POA through concrete projects and practical cooperation.
Despite the global financial crisis in 2009, India remained the seventh largest trading partner of ASEAN and the sixth largest investor in ASEAN with an increase of 40.8% in foreign direct investment from India to ASEAN.In this regard the ASEAN leaders reaffirmed their commitment made at India ASEAN Summit to achieve’s bilateral Trade target of US 70 billion by 2012.
The entry into force of the ASEAN India trade is a good agreement AL TIGA for all parties by the leaders, and raised hoped for the early completion of the negotiations on trade in services and investment Agreement under the ASEAN India free trade area framework (AIFTA) India proposed to convene an ASEAN India Business fair (AIBF) and the ASEAN India Business Summit (AIBS) in March 2011 in New Delhi Dialogue IIIrd which provide the platform for security and political dialogue between India ASEAN21. It was also decided to establish an ASEAN India Eminent person Group (EPG) to take stock of the 22 years of ASEAN India cooperation and chart future direction of ASEAN India dialogue relation by drafting a new ASEAN India vision 2020 Document for presenting at the commemorative summit in 2012. India also extended its readiness to increase the number of the ASEAN Indiaentrepreneurship development centers and centers for English language Training in CLMV countries as well as the establishment of the IT Training centers in the CLMV countries22.
ASEAN leaders appreciated India’s continued effort in promoting people to people exchange and mutual understanding through visits to India of students, members of the media and diplomats. ASEAN India relations help to foster at the peoples level. In this regard, in 2010 they welcomed the visit of India Indian Parliamentary Assembly and the granting of “observer status” to the delegation during their visit.
9. The Ninth India ASEAN Summit in Bali on 19 Nov. 2011:
The 9th India ASEAN Summit was held on 19 Nov. 2011 successfully in Bali, Indonesia. The leaders agreed to further enhance cooperation to vigorously implement the ASEAN India Joint declaration for cooperation tocombat international terrorism to enhance cooperation on maritime security to ensure safety and security of Seas lanes of communication in the Indian Ocean cooperation on food energy security. They appreciated the convening of the ASEAN India commemorative to celebrate the 20th Anniversary of ASEAN India dialogue relation from 20-21 December 2012 in New Delhi.
The ASEAN leader appreciated India’s proposal to hold in the run up to the summit including the holding of the fourth round of the Delhi Dialogue in February 2012 and meetings of the ASEAN India ministers for new and Renewable energy and agriculture as well as India and ASEAN business fair, The leaders agreed to enhance the people to people connectivity to increase understanding of cultural diversity and value of Asia, through exchange of youth, young entrepreneurs, IT experts, scientists, diplomats, Media and students. They also committed to hold an India ASEAN Festival in 2012 and hold other activities such as translating literary works and books. They welcome Cambodia’s Proposal to organize ASEAN India cultural performance in 2012 in Siem Reap Cambodia.
India and ASEAN leaders expressed their commitment to enhance further the implementation of the plan of action 2010-2015 Highlighting the importance of ASEAN India Eminent persons group, the leaders said that the recommendations to be submitted to the Tenth ASEAN India summit in 2010. The leaders from ASEAN commended India for its initiative in establishing the ASEAN India green fund to support cooperative projects between ASEAN and India on Technologies aimed at promoting adaptation to and mitigation of climate change establishment of the ASEAN India S and T development fund as it will encourage collaboration in R and D and Technology projects between ASEAN and India which led to extensive joint cooperation activities in science and technology. ASEAN leaders welcomed India’s active contribution in fostering collaboration and consultations with ASEAN and further promoting the interests of the developing countries in the United Nations, international financial institutions WTO and G 20 among others, so as to articulate the aspirations of the developing countries for equitable treatment and representation of their views23.
10. The Tenth India Nov. 2012: ASEAN Summit in Phnom Penh, on
The Tenth India ASEAN Summit that was held at peace place Phnom Penh, in Cambodia on 19 Nov. 2012. The prime minister of kingdom of Cambodia chaired the Summit Hun Sen and was attended by the leaders of ten members of ASEAN and the Indian Prime Minister Manmohan Singh, During the Tenth Anniversary of ASEAN India Summit, 20th Anniversary of ASEAN India Dialogue reactions was also observed at the same venue of peach place Phnom Penh. The ASEAN India Summit for the first time was observed in the year 2002.
At Phnom Penh, it was decided to organize various commemorative activities throughout the year to mark the twenty years of dialogue partnership and year of summit partnership. The cardinal activities included the meeting between heads of space agencies, ministerial level meeting in tourism, environment, agriculture, new and renewable energy the sending of the sail training ship “Sudarshini” on an expedition to ASEAN countries second India ASEAN Business fair and Business conclave and the ASEAN India car rally. These would be held during the ASEAN India commemorative Summit24.
11. India ASEAN commemorative Summit in New Delhi on 21 December 2013:
The India ASEAN commemorative summit took place in New Delhi on 21 December 2013 to commemorate the 20 years of India ASEAN Relations and 10 years of Summit partnership. The significant aspect of the Summit wasthe vision statement agreed between India and ASEAN which clearly articulated the objectives of a new “strategic partnership” that would be based on closer political, security and economic cooperation. They underlined the need for freedom of navigation, a contentious issue because of competing claims with Beijing over parts of the South china sea, though there was no mention of China in the statement “we are committed to fostering greater security cooperation and information sharing in the form of regular and high-level security dialogues to further address traditional and nontraditional crises, and strengthening the effective implementation of The ASEAN India joint declaration for cooperation to combat international terrorism25.
12. The Eleventh India: ASEAN Summit on 10 Oct. 2013 in Bander Seri Bagawan in Brunei:
The 11th India ASEAN Summit took place at the Bander Seri Bagawan in Brunei Successfully on 10th October 2013 Prime Minister Manmohan Singh highlighted the importance of India’s look cast policy and the successful Journey of India ASEAN partnership of the past two decades. He said “We look forward to sign the India ASEAN trade in services and investment by the end of 2013 and its operationalization by July 2014 and its operationalization by July 2014 we would be happy to Respond to the ASEAN request to develop the security dimension of India’s look east policy to strengthen the ASEAN political security community Blueprint 2015” further the prime minister of India Manmohan Singh said at the concluding session of the summit “ASEAN countries that they have led to the way in cooperation and integration, not only among themselves, but also in the border region for India. It is an article of faith of our look east policy that ASEAN must remain central to future evolution of regional mechanisms. Which must be open and inclusive? We share your vision and aspirations for the region and applaud your March toward on ASEAN economic community in 2015” the primeminister also emphasized the growing strategic content in India ASEAN relations to respond to the common security challenges which supplemented India’s depending security cooperation with ASEAN countries Bilaterally India and ASEAN have agreed to develop a “Security community Blueprint 2015 which includes cooperation on transnational cries. a counter mechanism against threat of piracy and drug trafficking and an action plan to combat international terrorism, Aiming to give a fillip to India’s look east policy prime minister Minoan Singh announced new initiatives to take forward ties with ASEAN the establishment of a mission in Jakrta with full time resident Ambassador will not only enhance India’s regional linkage but will also strengthen India Indonesia bilateral relations. The India ASEAN free trade agreement on services and investment had been expected by the end of 2013. It will complement India ASEAN agreement on goods and bolster the economic partnership. This will also promote negotiations for the regional comprehensive economic partnership RCEP between ASEAN India and other cast ASEAN partners. Which aims to create the world’s largest free trade area by2015? It is expected that India ASEAN trade which stood at $ 76 billion last year will reach $ 100 billion by 2015 and double volume by 202226.
India and ASEAN leaders at the summit committed to look into the possibility of taking concrete steps towards the development of making India Economic corridor as well as strengthening ASEAN India connectivity in information and communication technology ICT. India is dedicated to improving roads with ASEAN in infrastructure connectivity. In addition to a massive highway project that will link Thailand and Myanmar as well as special economic zones and pores. The summit also boosted several cooperative projects with ASEAN under the plan of action for 2010 to 2015 that includes establishment of a satellite tracking and data reception station and data processing Facility in Vietnam and the upgrading of a telemetry command situation in Indonesia by April 2014. Projects to set up four information technology Centers in CLMV countries Cambodia Lao PDR Myanmar Vietnam was supported by a resource center located in India, ASEAN countries have expressed support for the establishment of Nalanda University as an international institution of excellence India and ASEAN have agreed to sign the intergovernmental Memorandum of understanding on Nalanda University, which would go a long way in promoting cultural confluence of both regions. The Prime minister noted that the first meeting between The ASEAN connectivity coordinating committee and India took place in 2013. The decision to establish a working group and soft infrastructure along the corridors of connectivity projects, He suggested that officials begin discussions on an ASEAN India transit transport agreement with a view to completing it by 2015. India has recently established an exchange programme for students. Farmer’s diplomats, media and parliamentarians and the ASEAN India network of Think Tanks these exchanges sow the seeds of better understanding and productive partnerships between India and member countries of ASEAN27.
Conclusion:
India ASEAN relations have come a long way in the last two decades, providing enormous opportunities to both sides to cooperate on a wide range of issues. The India ASEAN partnership for peace, progress and shared prosperity in 2004 to 2010 and 2010-2015 has proved instrumental in taking these ties to new heights. India ASEAN Summit partnership enthused the two sides to launch numerous projects in different fields leading to comprehensive and inclusive partnership in the 21th century. The look east policy is the significant forcing policy initiative of India in the post cold war era and proved immensely successful for both the partners. The two sides are engaged in meeting the goals of India ASEAN partnership for peace, progress and prosperity.
Reference:
1. Joint Statement of Bismt-Ec Ministerial Meeting New Delhi, 6 July 2000.
2. Jha Ganganath, India and Southeast Asia, Anamika New Delhi,2000,P.N.99.
3. Kavl Man Mohini , Time for great long Eastward, The Indian Express New Delhi ,2002.
4. A Parthasarthy, The gains of looking ease,” The Pioneer New Delhi,21 November 2002
13.Dr. Bhimrao Laxman Shirsat., Role of India in ASEAN.,(Research thesis.,)Department of Political Science, Dr.BAMU, Aurangabad Maharashtra 2017.p.. No.56, 66.
Makhamadinovna, U. K. (2026). The Main Components of Students’ Independent Study Activity and their Organizational Functions. International Journal of Research, 13(2), 125–134. https://doi.org/10.26643/ijr/2026/36
Urinboeva Khayotkhon Makhamadinovna
Senior teacher, Uzbekistan State World Languages University
ABSTRACT
Independent study has become a central component of modern higher education, particularly in the context of competency-based and learner-centered approaches. The effectiveness of students’ independent study largely depends on its internal structure and the organizational functions of its key components. This article deals with the issues based on the organizational functions of cognitive, motivational, operational, reflective, and self-regulatory components within students’ independent study activities. Special attention is given to how these components interact to ensure planning, control, self-assessment, and continuous improvement of learning outcomes. The study emphasizes that well-organized independent study promotes autonomy, responsibility, and lifelong learning competencies among university students.
The transformation of higher education systems worldwide has led to a growing emphasis on independent study as a key factor in developing professionally competent and intellectually autonomous specialists. In contemporary educational paradigms, the student is no longer viewed as a passive recipient of knowledge, but rather as an active subject of the learning process who is responsible for planning, organizing, and evaluating their own educational activities. In this context, independent study is regarded as an essential mechanism for fostering critical thinking, self-management, and lifelong learning skills.
Independent study activity is a complex pedagogical phenomenon that includes a system of interrelated components performing specific organizational functions. These components ensure the effectiveness, continuity, and meaningfulness of students’ learning beyond direct teacher supervision. The organizational aspect of independent study is particularly important, as it determines how learning tasks are structured, how goals are set, and how students regulate and assess their own progress.
Modern educational standards, including competency-based frameworks, emphasize the formation of self-organization, self-control, and reflective abilities among students. However, in practice, many students experience difficulties in managing their independent study due to insufficient motivation, poor planning skills, lack of reflection, and weak self-regulatory mechanisms. This situation highlights the need for a deeper theoretical analysis of the components of independent study and their organizational functions.
Researchers note that independent study activity consists of several core components, such as cognitive, motivational, operational, reflective, and self-regulatory elements. Each of these components plays a distinct organizational role in ensuring the effectiveness of independent study. For instance, the cognitive component is responsible for knowledge acquisition and comprehension, while the motivational component determines the learner’s internal drive and goal orientation. The operational component ensures the selection and application of appropriate learning strategies, whereas reflection and self-regulation support continuous monitoring and improvement of learning outcomes.
Literature review
The concept of independent study has been extensively explored in pedagogical and psychological research. Scholars define independent study as a purposeful, self-directed educational activity that requires learners to assume responsibility for planning, implementing, and evaluating their own learning processes. Contemporary interpretations emphasize not merely independence from the teacher but also learners’ capacity for self-management, autonomy, and reflective control over learning outcomes (Knowles, 1975; Benson, 2011).
A significant strand of research focuses on the structural composition of independent study activity. Within learner-centered and self-regulated learning frameworks, independent study is viewed as a multi-component system encompassing motivation, cognition, strategic action, and regulation. Educational researchers highlight that these components jointly perform organizational functions that ensure coherence and effectiveness in independent study (Zimmerman, 2002; Biggs, Tang, 2011).
The cognitive component is associated with knowledge acquisition, information processing, and the application of learning content. Cognitive theories emphasize that meaningful learning depends on learners’ ability to analyze, interpret, and integrate new information with prior knowledge. Without developed cognitive strategies, independent study remains fragmented and lacks conceptual depth (Bransford, Brown, Cocking, 2000; Oxford, 1990).
The motivational component has been widely recognized as the driving force of independent study. Research grounded in self-determination theory demonstrates that intrinsic motivation plays a decisive role in sustaining engagement in self-directed learning tasks. Motivation performs a key organizational function by orienting learners toward goal achievement, persistence, and personal relevance of learning activities. Studies further indicate that motivation is closely connected with learners’ values, professional aspirations, and sense of autonomy (Deci, Ryan, 2000; Dörnyei, 2001).
The operational component refers to the methods, strategies, and techniques learners employ during independent study. Researchers emphasize that organizational effectiveness largely depends on students’ ability to plan learning activities, manage time, select appropriate resources, and apply effective language learning strategies. This component ensures the procedural structuring and systematic execution of independent study tasks (Harmer, 2015; Oxford, 1990).
Reflection is considered an essential component in contemporary educational research. It involves learners’ self-analysis, evaluation of learning outcomes, and awareness of difficulties encountered during the learning process. Reflective activity performs a corrective organizational function, enabling learners to adjust strategies, identify weaknesses, and enhance learning effectiveness. Without reflection, independent study lacks sustainability and adaptive potential (Schön, 1983; Brookfield, 2017).
Self-regulation integrates all components into a coherent and dynamic system. According to models of self-regulated learning, learners who possess self-regulatory skills are able to set goals, monitor progress, and regulate cognitive, motivational, and emotional processes. This component fulfills a coordinating organizational function, ensuring consistency, continuity, and purposeful progression in independent study activities (Zimmerman, 2002; Pintrich, 2002).
Despite extensive research on independent study, the organizational functions of its components are frequently examined in isolation. This study addresses this gap by offering a holistic analysis of how motivational, cognitive, operational, reflective, and self-regulatory components interact to structure and enhance students’ independent study activity.
The main components of independent study
Independent study is a multifaceted educational process that consists of several interconnected components ensuring its effectiveness and sustainability. The motivational component stimulates learners’ interest, responsibility, and willingness to engage in self-directed study. The cognitive component involves acquiring, processing, and applying knowledge through critical and analytical thinking. The metacognitive component supports planning, monitoring, and evaluating one’s own learning activities. The operational component focuses on selecting appropriate strategies, methods, and learning techniques. The resource management component develops skills in searching for, evaluating, and using learning resources effectively. Finally, the reflective and self-regulatory components enable learners to assess outcomes, correct mistakes, and continuously improve their learning process.
1. Motivational Component
The effectiveness and outcomes of the independent study process directly depend on students’ intrinsic and extrinsic motivation. Motivation functions as a psychological factor that ensures students’ activity, directs them toward learning goals, and strengthens discipline within the educational process. In independent study, the role of motivation is particularly significant, as students are required to plan, manage, and evaluate their own learning activities, which necessitates strong internal incentives.
The motivational component consists of students’ interest in independent study, their willingness to engage in self-development, and their aspiration to achieve meaningful results. Highly motivated students do not limit themselves to completing assigned tasks; instead, they strive for deeper understanding, explore additional resources, and seek ways to apply acquired knowledge in real-life situations. In English language teaching, motivation facilitates not only theoretical knowledge acquisition but also the practical use of the language.
There are two main types of motivation: intrinsic and extrinsic motivation. Intrinsic motivation arises from students’ personal interests and developmental needs, whereas extrinsic motivation is associated with grades, diplomas, and social expectations. In independent study, the development of intrinsic motivation is considered particularly important.
Effective strategies for strengthening motivation include acknowledging small achievements, setting clear and achievable goals using the SMART model, collaborative activities, and motivational tasks. In addition, reflective journals, self-assessment checklists, and constructive feedback play a crucial role in maintaining motivation throughout the learning process.
As a result, the motivational component acts as the driving force of independent study, shaping students’ desire to manage, plan, and achieve meaningful learning outcomes independently.
2. Cognitive and Metacognitive Components
In the independent study process, cognitive and metacognitive components constitute the core mechanisms necessary for deep language acquisition. Cognitive components encompass thinking, analysis, synthesis, and memory strategies applied during learning activities.
The cognitive component involves processes related to the perception, processing, and practical application of learning materials. For example, identifying main ideas in a text, analyzing concepts, and applying them in context represent cognitive learning activities.
The metacognitive component, in turn, reflects students’ ability to plan, monitor, and evaluate their own learning processes. This component enables students to identify their mistakes, select effective learning strategies, and determine future learning directions.
The integration of cognitive and metacognitive components ensures conscious and deep language learning. Initially, cognitive strategies are applied, followed by metacognitive analysis, which allows learners to evaluate and improve these strategies. This approach significantly increases the effectiveness of independent study.
In language learning, cognitive strategies include dividing texts into meaningful segments, identifying key ideas, applying new grammatical structures through examples, and establishing meaningful connections between newly acquired content. These strategies help learners not only memorize new language units but also apply them appropriately in context. Metacognitive strategies, on the other hand, encourage learners to analyze which methods are most effective, redirect the learning process when necessary, and apply self-evaluation mechanisms.
For instance, after independently reading an English text, a student may reflect on questions such as: “What have I learned from this text?”, “Which strategies were effective for me?”, and “Where did I make mistakes and why?” These questions foster metacognitive thinking and contribute to the conscious improvement of the learning process.
To develop metacognitive strategies in language teaching, instructors guide students toward planning their activities, recording errors, and engaging in reflective thinking focused on self-correction. Such strategies enable students to manage their independent study process, evaluate outcomes, and adapt their learning strategies accordingly. For example, by analyzing personal notes, learners can identify problematic grammatical structures and adjust subsequent learning plans based on these observations.
Consequently, cognitive and metacognitive components facilitate not only the acquisition of language units but also conscious management, analysis, and adaptation of learning strategies, leading to deeper and more effective language learning. These components encourage active learner engagement and contribute to the formation of autonomous language learners within the independent study framework.
3. Resource Management Component
One of the essential components of the independent study process is the resource management component, which focuses on developing students’ skills in searching for, selecting, analyzing, and applying various learning resources. This component enhances language learning effectiveness by enabling students to independently discover and acquire new knowledge.
The concept of resources includes not only textbooks but also scientific, technological, and practical materials such as electronic resources, online courses, video lessons, academic articles, audio materials, dictionaries, and interactive platforms. The resource management component teaches students to locate information from diverse sources, critically analyze it, compare alternatives, and apply it in practice. For instance, students may use platforms such as BBC Learning English, TED Talks, Duolingo, and Coursera to complete additional vocabulary, grammar, and listening tasks. This process creates opportunities to apply language skills in various contexts.
The first stage of resource management is resource selection. At this stage, students identify appropriate textbooks, academic articles, video courses, and interactive tasks that correspond to their learning needs. When selecting resources, factors such as reliability, relevance, currency, and content quality are taken into account. For example, adapted audio and video materials are particularly suitable for beginner-level learners.
The second stage involves analyzing information and applying it effectively. Students analyze acquired materials, apply knowledge in independent tasks, and integrate it into creative learning activities. For instance, during the analysis of English texts, grammatical structures, collocations, and vocabulary items are identified and subsequently used in written and spoken communication.
The resource management component also develops skills related to information evaluation, classification, and critical assessment. When analyzing academic articles, students evaluate their structure, logical consistency of arguments, and reliability of evidence, later incorporating these insights into their own written work. This process prepares learners for independent research activities and enhances their academic literacy.
As a result, the resource management component contributes to the development of reading comprehension, listening skills, grammatical application, written communication, and interactive communicative competencies. By encouraging independent knowledge acquisition, this component increases students’ research potential and significantly enhances the overall effectiveness of the independent study process.
Recent studies conducted by contemporary researchers further enrich the understanding of independent study components and their organizational functions. In particular, Makhamadinovna (2025) emphasizes that the development of independent study skills in future English teachers requires a well-structured pedagogical framework that integrates motivational, cognitive, and reflective components. According to the author, independent study becomes effective only when students are provided with clear goals, structured tasks, and opportunities for self-assessment within a supportive learning environment. This framework highlights the organizational role of instructional design in guiding and regulating students’ autonomous learning activities.
In another study, Makhamadinovna (2025) explores the principles of forming and assessing students’ independent study skills through literature-based and creative writing tasks. The findings suggest that creative and reflective writing activities significantly enhance students’ motivation, critical thinking, and cognitive engagement. These tasks perform an important organizational function by encouraging students to independently plan their learning, manage time, and evaluate their progress. The study also underlines the role of clear assessment criteria in sustaining learners’ responsibility and self-discipline during independent study.
The reflective component of independent study is further elaborated in the research by Urinboeva (2025), which focuses on developing reflective thinking in pre-service English teachers. The author argues that reflection enables learners to analyze their learning experiences, identify strengths and weaknesses, and consciously modify learning strategies. Reflective thinking thus performs a corrective and developmental organizational function, ensuring continuous improvement and deeper learning. The study demonstrates that systematic use of reflective journals and self-analysis tasks strengthens students’ autonomy and metacognitive awareness.
Additionally, Urinboeva (2025) addresses the issue of assessment criteria for independent study competencies. The research highlights that transparent and well-defined assessment indicators play a crucial organizational role in independent study by guiding students’ efforts, supporting self-regulation, and ensuring objective evaluation of learning outcomes. Assessment is viewed not merely as a control mechanism, but as an integral element that structures independent study activities and motivates students toward consistent progress.
Overall, these studies confirm that the organizational functions of independent study components are realized through purposeful pedagogical design, reflective practice, creative learning tasks, and clearly defined assessment criteria. Integrating these elements into the independent study process enhances students’ autonomy, self-regulation, and professional preparedness, particularly in the context of training future English language teachers.
The analysis of students’ independent study components demonstrates that their effectiveness depends on the coherence and balance of organizational functions. Each component contributes uniquely to structuring independent study, yet none of them can function productively in isolation.
The cognitive component organizes the content aspect of independent study. It allows students to comprehend learning objectives, analyze information, and construct knowledge independently. However, cognitive competence alone does not guarantee successful independent study if students lack motivation or organizational skills.
The motivational component performs a goal-orienting and energizing function. Motivation influences students’ willingness to engage in independent tasks and determines the sustainability of their efforts. When motivation is weak, independent study becomes formal and superficial, regardless of cognitive potential.
The operational component organizes the procedural side of learning. Planning, time management, and strategy selection enable students to structure their independent work effectively. This component is particularly important in higher education, where the volume of independent study tasks is significant.
Reflection and self-regulation serve as integrative organizational mechanisms. Reflection allows learners to evaluate their achievements and identify gaps, while self-regulation ensures conscious control over learning behavior. Together, these components support adaptive learning and continuous improvement.
The interaction of all components forms a dynamic system that ensures the effectiveness of independent study. From a pedagogical perspective, teachers should design instructional environments that stimulate motivation, develop operational skills, and foster reflection and self-regulation. Such an approach transforms independent study into a meaningful and productive activity.
Conclusion
In conclusion, students’ independent study activity represents a multifaceted pedagogical system composed of interrelated components that perform specific organizational functions. The cognitive, motivational, operational, reflective, and self-regulatory components collectively ensure the planning, implementation, monitoring, and evaluation of independent study.
The study confirms that the effectiveness of independent study largely depends on the balance and interaction of these components. Organizational functions such as goal setting, process management, self-control, and self-correction are essential for developing learner autonomy and responsibility. Insufficient development of any component negatively affects the overall learning outcome.
Understanding the organizational functions of independent study components has significant practical implications for higher education. Educators should purposefully design learning tasks and pedagogical conditions that develop students’ ability to organize their own learning. This approach contributes to the formation of lifelong learning competencies and prepares students for professional self-development in a rapidly changing world.
References:
Deci E. L., Ryan R. M. Self-Determination Theory. – New York: Guilford Press, 2000.
Dörnyei Z. Motivational Strategies in the Language Classroom. – Cambridge: Cambridge University Press, 2001.
Knowles M. Self-Directed Learning. – Chicago: Follett Publishing, 1975.
Oxford R. L. Language Learning Strategies. – Boston: Heinle & Heinle, 1990.
Pintrich P. R. The Role of Metacognitive Knowledge in Learning // Educational Psychologist. – 2002. – Vol. 37(2).
Zimmerman B. J. Becoming a Self-Regulated Learner // Theory Into Practice. – 2002. – Vol. 41(2).
Harmer J. The Practice of English Language Teaching. 5th ed. – Harlow: Pearson Education, 2015.
Makhamadinovna, U. K. (2025). DESIGNING PEDAGOGICAL FRAMEWORK FOR ENHANCING INDEPENDENT STUDY SKILLS IN FUTURE ENGLISH TEACHERS. SHOKH LIBRARY, 1(11).
Makhamadinovna, U. K. (2025). PRINCIPLES OF FORMATION AND EVALUATION OF STUDENTS’INDEPENDENT STUDY SKILLS THROUGH LITERATURE AND CREATIVE WRITING. Confrencea, 5(5), 228-231.
Urinboeva, K. (2025). DEVELOPING REFLECTIVE THINKING IN PRE-SERVICE ENGLISH TEACHERS. Journal of Multidisciplinary Sciences and Innovations, 1(3), 792-794.
Urinboeva, K. (2025). ASSESSMENT CRITERIA FOR INDEPENDENT STUDY COMPETENCIES. International Journal of Artificial Intelligence, 1(4), 1728-1731.
Karm. A. M. Patil Arts, Commerce & Kai. N. K. Patil Science Senior College,
Pimplaner Tal. Sakri Dist. Dhule
email: sanjay.khodke@gmail.com
Abstract:
Human–leopard conflict is rising across many parts of Maharashtra. Sakri Taluka in the Dhule district has recently emerged as a significant hotspot for human-leopard (Pantherapardus) conflict. A survey including questionnaire was conducted in six sites of Sakritaluka.The average number of injuries and deaths due to leopard attacks in study area is noted. Majority of the leopard attack victims in study area were livestock and young people, with a noticeable increase in incidents in winter. This study explores the correlation between rapid habitat degradation, driven by agricultural expansion and deforestation. By analyzing recent incidents inNov-Dec, 2025 and Jan, 2026, including attacks on motorists and livestock predation, the study highlights the need for localized mitigation strategies that move beyond mere translocation toward habitat restoration and community-based co-management. Key recommendations include restoring habitat connectivity, targeted livestock-protection measures, community awareness programs, and strengthened rapid-response capacity for the forest department.
The leopard (Pantherapardus) is a highly adaptable apex predator capable of surviving in diverse landscapes. Leopard thrives across diverse habitats, ranging from lowlands to elevations of 4400 m, encompassing grasslands, forests, and mountainous terrains (Can et al., 2020; Baralet al., 2023). Leopards play a critical ecological role but increasingly come into conflict with humans where natural habitats are altered or fragmented.Sakri is characterized by its hilly terrain and traditional forest patches which have undergone significant fragmentation. In the Dhule district of north-western Maharashtra, particularly Sakritaluka, a string of leopard incidents reported by local and national media indicates both recurring close encounters and occasional attacks on people and domestic animals. Their diet consists of many prey species, including birds, rodents, and other small mammals, yet they favor medium-sized ungulates as their primary food source (Hayward et al., 2006; Bhandari, Baral&Adhikari, 2022). As natural prey bases like barking deer and wild boar diminish due to habitat loss, leopards are increasingly drawn to human settlements. This study compiles recent documented incidents and explores how habitat degradation, agricultural expansion, and water scarcity contribute to these conflicts.
Aim of the study: The study explores the correlation between habitat degradation and the increasing frequency of leopard attacks on livestock and humans in Sakritaluka.
Objectives:
1. To study how habitat degradation links to Human-Leopard conflict.
2. To study the recent incidents of leopard attack in Sakri region.
3. To study the steps to adopt mitigation measures and recommendations.
Materials and Methods:
Study area:Sakri Tal, Dhule district, MaharashtraSakri Tal lies in the western part of Dhule district, a region composed of mixed dry-deciduous patches, agricultural lands, and scattered village settlements. Over recent years the landscape mosaic has shifted: increasing irrigation, expansion of monoculture and seasonal crops, and human settlement growth have modified leopard habitat, producing more edge environments attractive to adaptable carnivores but increasing human–animal interface.
Methodology:
This study is based on:
(1) A survey including questionnaire was conducted in leopard attack sites of Sakritaluka.
(2) Evidenceof leopard attacks was collected from Range Forest Office, Pimpalner&Sakri.
(3) A targeted review of recent news reports and rescue-records concerning leopard incidents in Sakritaluka(Nov-Dec, 2025 & Jan, 2026).
(4) Synthesis of conservation commentary on causes of human–leopard conflict in Maharashtra.
(5) Application of standard conflict-mitigation recommendations from wildlife-management practice.
Results and Discussion:
Habitat Degradation: Habitat degradation in Sakritalukais not just the loss of trees; it is the fundamental alteration of the landscape.
Drivers: How habitat degradation links to conflict:
Loss of contiguous natural habitat and fragmentation: As native scrub and dry deciduous patches are converted to farmland or divided by roads and settlements, leopards lose continuous ranges and are forced to use remnant patches and agricultural edges for hunting and movement. This increases encounters with people. (General pattern reflected in regional case studies of Maharashtra.)
Agricultural Encroachment: The conversion of forest fringes into agricultural land, particularly for cash crops, has blurred the boundaries between wild and domestic spaces.
Loss of Natural Prey: Overgrazing by domestic cattle and illegal wood felling in the Sahyadri spurs surrounding Sakri have depleted the natural fodder for ungulates.
Food availability in altered landscapes: Converted landscapes (e.g., irrigated fields, sugarcane, and grain stores) attract prey species (rodents, feral dogs, small ungulates) and sometimes stray/guard dogs or livestock in the village periphery. This draws leopards into fields and village edges, increasing overlap.
Feral Dog Populations: Poor waste management in villages near Sakri attracts feral dogs, which serve as a “primary protein source” for leopards, drawing them into the heart of human habitations.
The ‘Sugarcane’ Effect: Similar to the Junnar model, leopards in Sakri are utilizing tall crops like sugarcane and maize as ‘pseudo-forests’, providing them with cover and easy access to domestic dogs and livestock.
Water scarcity and use of village water sources: Drier months push big cats to seek water in village wells, storage pots, and livestock troughs. The 2024 ‘head-stuck-in-pot’ rescue illustrates how proximity to human water sources can create hazardous interactions.
Human behaviors and infrastructure gaps: Free-ranging livestock, nocturnal outdoor activities, and lack of secure night-time animal enclosures increase vulnerability. Inadequate rapid-response and local reporting mechanisms can exacerbate risk and delay safe capture/relocation measures.
Recent Leopard Attacks (In last Three Months): Case Studies
Recent data highlights a shift in leopard behavior, moving from nocturnal stealth to more aggressive daylight encounters.While the incidents of leopard attacks in Nashik and Kolhapur are fresh, a leopard created terror in Sakritaluka on the evening of November 19, 2025.On the Nandwan-Trishulpada-Bhadne route, between 7.30 pm and 8.30 pm, the leopard attacked four separate places in a span of just one and a half hours. Six persons traveling on three bikes were injured in these attacks.
Date
Location
Incident Type
Outcome
Nov 19, 2025
Nandwan Road,BhadaneShivar, Sakri
Attack on home-goers (motorists / bike)
The leopard first attacked HarshalShewale and DnyaneshwarBichkule of Nandwan. He was going home from Sakri on a two-wheeler. Then a leopard suddenly pounced on them near the temple of Ashapuri Devi, one to two kilometers from Bhadne village. Both were injured in this incident. They threw away the motorcycle and fled for their lives.
Nov 19, 2025
BhadaneShivar, Sakri
Attack on approaching friend
After reaching Sakri, HarshalShewale and DnyaneshwarBichkule informed their friend GhanshyamDevare about the attack. Ghanshyam along with his friends NitinDeore and AtulSalunkhe was coming to Sakri on the same road to meet the injured. At that time, the leopard attacked and injured all three of them.
Nov 19, 2025
Bhadaneroute, Sakri
Attack on motorists (bike)
After this incident, two more youths of TrishulPada village were attacked by a leopard.
Nov 19, 2025
Bhadane route, Sakri
leopard attacked a car
The leopard attacked a car. Fortunately, no one in this car was injured.
Dec 24, 2025
Wathode (Adjacent Shirpur/Sakri)
Livestock Predation
Three calves killed in a single night
Jan 2026
Rural Sakri Fringes
Daytime Sighting/Chasing
Panic in local farming communities
Table No.1: Showing Leopard attacks in last three months (Nov-Dec-Jan)
These incidents taken together show a pattern of opportunistic leopard movements into human-dominated spaces, occasionally with catastrophic outcomes.
Consequences for people and leopards:
For communities: Loss of life or injury, economic loss from livestock depredation, psychological stress, reduced willingness to coexist, and occasional mob action against forest staff or animals. High-profile human fatalities have led to public pressure for capture or translocation.The socio-economic impact in Sakri is profound. Farmers are increasingly reluctant to work in fields after sunset, affecting crop yields.
For leopards: Injured or trapped animals, culling/translocation risks, and reduced survival prospects when forced into human-dominated landscapes. Repeated capture-and-relocation without addressing habitat drivers often leads to reappearance of conflict elsewhere.
Mitigation and Recommendations(locally actionable for Sakri Tal):
To address the conflict in SakriTaluka, a multi-pronged approach is required:
Habitat Restoration: Reforestation of the local grazing lands to encourage the return of natural prey.
Water management:Create or maintain wildlife-friendly water points away from villages (seasonal waterholes located near core habitat) to reduce visits to human water sources.
Community awareness and behaviour change:
Conduct sustained awareness campaigns about safe timings, travel advisories (avoid walking alone at night in high-risk zones), and steps to take during sightings (call forest helpline, do not provoke the animal).
Encourage community reporting networks (mobile WhatsApp groups linked to forest department rapid-response teams) for faster, safer response.
Improve carcass disposal practices to avoid attracting leopards and scavengers.
Do not allow grass to grow near the house.
Fencing houses and cowsheds.
Solar Street Lighting: Installing high-intensity solar lights in “conflict hotspots” identified by the Forest Department.Make availability of electricity to agriculture only during day hours.
Rapid Response Teams (RRT): Establishing a dedicated RRT in Sakri. Strengthen rapid-response teams with trained personnel, cage traps, tranquilization equipment, and vehicles; deploy camera traps and targeted CCTV in hotspot villages as temporary surveillance.
AI-Driven Monitoring: Utilizing thermal drones and AI-enabled cameras to track leopard movement near schools and residential clusters.
These mitigation measures are also recommended by earlier researchers (Naha et al. 2018).
Discussion:
In Sakri Tal and broader Dhule, human–leopard conflict is symptomatic of a landscape in transition. When natural landscape are split up into smaller, more isolated areas as a result of human activities like infrastructure development, agricultural expansions, or urbanization, leads to habitat fragmentation. In such cases, organisms are less able to obtain vital resources like food, water, and mates (Chauhan and Goyal 2000). S.Sidhuet al., (2017) shows that the attacks on people occurred mostlyon young children who were unsupervised, and during lateevenings. Guidelines for human-leopard conflict managementby Ministry of Environment and Forests (2011) note that suchsituation-based attacks on people may result from accidentalencounters that are avoidable by employing solutions that donot attract leopards in the vicinity of human-settlements, suchas providing garbage disposal, sanitation, improving livestockcorralling, as well as by advising people to accompany childrenand carry lights when going out in the evenings so that chanceencounters can be avoided.
Leopards’ ecological adaptability allows them to persist near humans (Hunter & Price, 1992; Gandiwa, 2013), but persistence comes with escalating incidents when structural drivers (fragmentation, water scarcity, prey shifts) are ignored. Media-documented rescues and captures (e.g., the pot-entrapment rescue and capture of problem individuals) show reactive management is underway, yet long-term coexistence requires proactive habitat and community-level solutions. Integrated approaches that combine habitat restoration, community engagement, livestock protection, and stronger rapid-response will reduce both human risk and pressure on leopards.
Conclusion:
The human-leopard conflict in Sakri is a symptom of a larger ecological imbalance.Habitat degradation has forced the leopard to become a ‘village resident’ rather than a ‘forest ghost’.The pattern of recent leopard incidents in and around Sakri Tal underscores the urgent need to address habitat degradation, water scarcity, and landscape fragmentation. Practical, locally tailored interventions, focused on restoring connectivity, protecting livestock, improving water infrastructure, and equipping forest teams can reduce conflict and promote coexistence. Given the cultural and ecological importance of large carnivores and the livelihoods of rural communities, balanced, science-informed policy that centers both human safety and leopard conservation is essential.
References:
Baral K, Adhikari B, Bhandari S, Kunwar RM, Sharma HP, Aryal A, Ji W. (2023). Impact of climate change on distribution of common leopard (Pantherapardus) and its implication on conservation and conflict in Nepal. Heliyon 9(1):e12807 DOI 0.1016/j.heliyon.2023.e12807.
Bhandari S, Baral K, Adhikari B. (2022). Leopard preyed on Jungle cat: evidence from themid-hill of Nepal. European Journal of Ecology 8(1):1-5DOI 0.17161/eurojecol.v8i1.15220.
Can OE, Yadav BP, Johnson PJ, Ross J, D’Cruze N, Macdonald DW. (2020). Factorsaffecting the occurrence and activity of clouded leopards, common leopardsand leopard cats in the Himalayas. Biodiversity and Conservation. 29(3):839-851.DOI 10.1007/s10531-019-01912-7.
Chauhan, D. S., Agrawal, M. K., &Goyal, S. P. (2000). A study on the distribution, relative abundance and food habits of leopard (Pantherapardus) in Garhwal Himalayas(Technical Report, December 1999 – July 2000). Wildlife Institute of India.
Hayward, M. W., Henschel, P., O. Brien, J., Hofmeyr, M., Balme, G. and Kerley, G. I. H., (2006). Prey preferences of the leopard (Pantherapardus). J. Zool., 270: 298–313.
Hunter, M. D., & Price, P. W. (1992). Playing chutes and ladders: Heterogeneity and therelative roles of bottom-up and top-down forces in natural communities. Ecology, 73(3),723–732.
Loksatta and regional Marathi outlets documenting later sightings, injuries to people (e.g., motorcycle-related injury incidents), and local responses (camera-traps, cages) in Sakritaluka.
Naha, D., Sathyakumar, S., Rawat, G.S., (2018). Understanding drivers of human-leopard conflicts in the Indian Himalayan region: Spatio-temporal patterns of conflicts and perception of local communities towards conserving large carnivores. PLOS ONE 13(10): e0204528. https://doi.org/10.1371/journal.pone.0204528.
S. Sidhu, G. Raghunathan, D. Mudappa, and T. R. S. Raman, (2017). “Confict to coexistence: human–leopard interactions in a plantation landscape in Anamalai Hills, India,” Conservationand Society, vol. 15, pp. 474–482.
This study highlights the significant biopesticidal potential of Alstonia scholaris against Sitophilus granarius, a major pest of stored wheat. The findings suggest that both crushed fresh leaves and bark of A. scholaris can effectively control pest populations, with mortality rates of 75.66% and 70.66% respectively within 96 hours. The dose and duration-dependent effects indicate the potential for A. scholaris-based bioinsecticides as an eco-friendly alternative to chemical pesticides in grain storage management. Further research on formulation and field application could enhance its practical use in pest control.
Stored grains are highly susceptible to damage from insect pests, with Sitophilus granarius, commonly known as the wheat weevil, being one of the most destructive pests. This weevil, a member of the family Curculionidae and the order Coleoptera, feeds on a variety of grains, including wheat, corn, rice and many cereals (Padín et. al., 2002; USDA, 2016; Vijay and Bhuvaneswari, 2018; Charles Kasozi et. al., 2018). Its impact on stored grains results in significant economic losses, highlighting the need for effective pest control methods. In general, stored products of agricultural and animal origin are attacked by more than 600 species of Coleopterans, 70 species of Lepidopterans and about 355 species of mites (Tyagi et. al., 2019). Among various storage insect pests Angoumois grain moth (Sitotrogacerealella), maize/ rice weevil (Sitophilusoryzae), lesser grain borer (Rhyzoperthadominica), khapra beetle (Trogodermagranarium), rust-red flour beetle (Triboliumcastaneum), legume weevil (Callosobruchus sp.) etc. are most detrimental (Gc, 2006). They are causing both quantitative and qualitative losses (Rajendran and Sriranjini 2008).
While various pest control methods exist, biopesticides offer a promising alternative due to their environmentally friendly nature. Biopesticides are derived from naturally occurring substances such as living organisms (natural enemies), microbial products, phytochemicals, or their by-products (semiochemicals), which can control pests through nontoxic mechanisms (Salma and Jogen, 2011). One of the key advantages of biopesticides is their minimal impact on the environment, human health, and the quality of stored grains.
Numerous plant-derived biopesticides, often botanicals, have shown potential in controlling agricultural and stored grain pests. Plants with medicinal properties, such as neem (Azadirachtaindica), bach (Acoruscalamus), phoolakri (Lantanacamara), draik (Meliaazadarach), kali mirch (Pipernigrum), and basuti (Adhatodazeylanica), have been reported to exhibit effective biopesticidal effects. These plants not only help control insect pests without harming the grains or seeds but also contribute to the ecosystem’s overall health (Lal, et. al., 2017). Incorporating plants with biopesticidal properties into Integrated Pest Management (IPM) strategies could be an effective approach to managing stored grain pests. By combining the use of biopesticides with other pest control methods, the reliance on chemical pesticides can be reduced, leading to sustainable and eco-friendly pest management practices.
In this study, the biopesticidal effects of Alstonia scholaris (Devil’s Tree) on Sitophilus granarius are explored. Alstoniascholaris, a member of the Apocynaceae family, is widely distributed across the dried forests of India, particularly in the Western Himalayas, Western Ghats, and the Southern region (Naik, 1998). Known for its rich array of active compounds, A. scholaris has been utilized in traditional medicine to treat various ailments. The plant’s phytochemical constituents comprise nearly 400 compounds, contributing to its medicinal versatility. It is commonly used as an anti-irritation agent (Goyal and Shinde, 2019; Sharma, et. al., 2016).
The organic extracts and essential oils of A. scholaris showed strong antioxidant and cytotoxic properties (Siddiqui, et. al., 2015). Larvicidal activity of Alstonia scholaris leaf extract in different solvents against Ae. Albopictus showed 35% mortality in hexane extract at the highest concentration (Yadav, et. al., 2013). Alstonia scholaris leaves column fractions proved to be highly toxic against stored product pests, Rhyzopertha dominica, and mosquito larvae (Kallur and Patil, 2019). The effect of polar and non-polar extract of leaves and stem barks of Alstonia scholaris (L.) R.Br. (Apocynaceae) was evaluated for its repellent activity against T. castaneum. The repellence increased with increasing concentration of the extracts (Pawar, et. al., 2013).
In this present study, both the leaves and bark of Alstoniascholaris were tested for their biopesticidal effects on Sitophilusgranarius, a pest that significantly affects wheat grains.
MATERIALS AND METHOD
Preparation of leaves and bark tablet
Collection: Fresh leaves and bark of Alstonia scholaris were collected from the plant.
Cleaning: The leaves and bark were washed thoroughly under tap water to remove any dirt or impurities.
Tablet Formation:
An electronic mixer grinds the washed leaves and bark into a fine consistency. Tablets were made by mixing crushed leaves and bark with wheat flour. First, wheat flour was taken, and its pulp was soaked. Then, freshly crushed leaves and bark were measured in given quantities, mixed with wheat flour, and made into tablets or pellets by hand.
Dose Regimens:
The tablets were prepared in three different dosages: 0.5 gm, 1 gm, and 1.5 gm of crushed fresh leaves and bark.
Fig- Crushed fresh leaves and bark Fig- Leaves and Bark Tablets
Experimental Setup:
Insect Collection and Identification:
Sitophilus granarius pests were collected from local grocery shops.
The pests were identified using the Grains Research and Development Corporation (GRDC) user guide.
Fig- Sitophilus granarius- Identify a given insect under the compound microscope.
Rearing Conditions:
The pests were reared in a plastic box with muslin cloth tightly secured with rubber to allow aeration.
Laboratory conditions were maintained at a room temperature of 27 ± 2°C, with a 14:10 hours light: dark photoperiod.
Relative humidity was maintained at 65 ± 5%.
Experimental Groups: The pests were divided into four groups, each containing 100 insects and 100 gm of wheat grains:
Group I: Exposed to tablets containing 0.5 gm of crushed Alstonia scholaris leaves and bark.
Group II: Exposed to tablets containing 1 gm of crushed Alstonia scholaris leaves and bark.
Group III: Exposed to tablets containing 1.5 gm of crushed Alstonia scholaris leaves and bark.
Group IV (Control): Exposed to wheat flour (vehicle control).
Exposure Duration:
The exposure was carried out for four different time intervals: 24, 48, 72, and 96 hours.
Experiment No. 1 – Effect of Crushed Fresh Leaves Tablet on Sitophilus granarius Mortality Over Different Exposure Durations 24, 48, 72, and 96 Hours
Experiment No.2 – Effect of Crushed Fresh Bark Tablet on Sitophilus granarius Mortality Over Different Exposure Durations: 24, 48, 72, and 96 Hours
Mortality Calculation:
The mean percent mortality was calculated using Abbott’s formula, which is commonly used to adjust for control mortality in bioassays.
Purpose of Study:
The purpose of this study seems to be to evaluate the insecticidal or repellent effects of Alstonia scholaris crushed fresh leaves and bark tablets on Sitophilus granarius, a common pest of stored grains and to observe its efficacy at different concentrations (0.5 gm, 1 gm, and 1.5 gm) over time (24, 48, 72, and 96 hours).
RESULT AND DISCUSSION:
The present study was undertaken to test the biopesticidal effect of crushed leaves and bark of Alstonia scholaris on Sitophilus granarius. Further research on formulation and field application could enhance its practical use in pest control.
When exposed to crushed fresh leaves in tablet form, Experiment No. 1 shows that the mortality rate increases with the concentration of the crushed fresh leaves, with Group III showing the highest mortality, 75.66%, at 96 hours, compared to the control group, which showed 0% mortality.
Mortality of Sitophilus granarius at 96 Hours of Exposure to Crushed Fresh Leaves Tablets
Group I: 52.33% mortality
Group II: 61.66% mortality
Group III: 75.66% mortality
Control Group: 0% mortality
This indicates the highest percent mortality of Sitophilus granarius in all three treatment groups at 96 hrs compared to the control group. This data shows a clear trend where increasing the concentration of crushed fresh leaves in tablet form leads to a higher mortality rate of Sitophilus granarius. (Table 1., Graph 1). Similarly, effects were recorded previously using leaves of Alstoniascholaris against Sitophilusoryzae (Pawara, et, al., 2024) and also effects of leaves from different plants such as Lantana camara (Verbenaceae) (Ogendo, et. al., 2003; Dua, et. al., 2010), Azadiracta indica (Bina, et. al., 2004), Annona squamosa (L.), Moringa oleifera (Lam.), Eucalyptus globulus (Labill.) and datura(Nenaah, et. al., 2011) against a serious pest such as Tribolium castaneum,Trogoderma granarium and Rhyzopertha dominica, Trogoderma granarium and Sitophilus oryzae.
When exposed to crushed fresh bark in tablet form, Experiment No.2 shows that the mortality rate of Sitophilus granarius increases with the concentration of bark tablet. Group III, with the highest concentration, resulted in 70.66% mortality after 96 hours, compared to 0% in the control group.
Mortality of Sitophilus granarius at 96 Hours of Exposure to Bark Tablets
Group I: 48.33% mortality
Group II: 55.33% mortality
Group III: 70.66% mortality
Control Group: 0% mortality
This is observed that the percent mortality increased with the increase in the concentration of crushed fresh bark in the tablet (Table 2, Graph 2). A similar result bark of Moringa oleifera was reported to be effective against T. castaneum and Scirpophaga incertulus (Ajayi 2007, Deka et al 2006). Hence, crushed fresh bark has been reported to be effective against Sitophilus oryzae (Pawara, et. al., 2024).Thus, it is clear that the biopesticidal effect of crushed leaves as well as bark tablets was increased with the period of drug exposure and also with the concentration of the drug.
Table 1: Biopesticidal effect of leaves tablet of Alstonia scholaris on Sitophilus granarius.
Group
Treatment(gm/100 gm grains)
*Mean % mortality
24 hrs.
48 hrs.
72 hrs.
96 hrs.
I
0.5
25.33
31.33
38.33
52.33
II
1
29.66
41.66
49.66
61.66
III
1.5
40.66
51.33
57.33
75.66
IV (Control)
Tablet of wheat flour
00.00
00.00
00.00
00.00
Graph 1: Graph for Determination of the biopesticidal effect of leaves tablet of Alstonia scholaris on Sitophilus granarius.
Table 2: Biopesticidal effect of bark tablet of Alstonia scholaris on Sitophilus granarius.
Group
Treatment(gm/100 gm grains)
*Mean % mortality
24 hrs.
48 hrs.
72 hrs.
96 hrs.
I
0.5
21.33
28.33
37.33
48.33
II
1
27.33
33.33
49.66
55.33
III
1.5
33.66
52.66
61.66
70.66
IV (Control)
Tablet of wheat flour
00.00
00.00
00.00
00.00
Graph 2: Graph for Determination of the biopesticidal effect of bark tablet of Alstonia scholaris on Sitophilus granarius.
CONCLUSION
The crushed fresh leaves and bark tablets of Alstonia scholaris exhibit a significant biopesticidal effect against the stored grain pest Sitophilus granarius. at 96 hours, the crushed fresh leaves tablets resulted in 75.66% pest mortality, while the crushed fresh bark tablets showed 70.66% mortality. This study suggests that the biopesticidal effect is dose and duration-dependent. The formulation will be further explored for its potential as an effective natural pesticide against stored product pests.
REFERENCES
Padín S, Dal BG and Fabrizio M 2002. Grain loss caused by Tribolium castaneum, Sitophilus oryzae and Acanthoscelides obtectus in stored durum wheat and beans treated with Beauveria bassiana. Journal of Stored Products Research 38:69–74.
USDA 2016. Stored-Grain Insect Reference. Federal Grain Inspection Service, United States Department of Agriculture.
Vijay S and Bhuvaneswari K 2018. Biology and development of Sitophilus oryzae L. feeding on split pulses. Indian Journal of Agricultural Research 52:111–118.
Charles KL, Derera J, Tongoona P, Zziwa S, Muwonge A, Gasura E and Bergvinson D 2018. Comparing the 339 effectiveness of the “weevil warehouse” and “laboratory bioassay” as techniques for screening maize genotypes for weevil resistance. Journal of Food Security 6:170–177.
Tyagi SK, Guru PN, Nimesh A, Bashir AA, Patgiri P, Mohod V and Khatkar AB 2019. Post-Harvest Stored Product Insects and Their Management ICAR-AICRP on PHET Central Institute of Post-Harvest Engineering and Technology Ludhiana (Punjab) Technical Bulletin No. AICRP on PHET/ Pub 02: 1-36.
Gc YD 2006. Efficacy of indigenous plant materials and modified storage structures to insect pests of maize seed during on-farm storage. J. Inst. Agric. Ani. Sci. 27: 69-76.
Rajendran S and Sriranjini V 2008. Plant products as fumigants for stored-product insect control. J. Sto. Prod. Res. 44: 126–135.
Salma M and Jogen CK 2011. A review on the use of biopesticides in insect pest management. International Journal of Science and Advanced Technology, 1, 169- 178.
Lal M, Ram B and Tiwari P 2017. Botanicals to Cope Stored Grain Insect Pests. A Review. Int.J.Curr.Micr.App.Sci. 6 (6): 1583-1594.
Naik VN 1998. Flora of Marathwada Vol. I. Amrut Prakashan, Aurangabad (MS), India, pp. 528–529.
Goyal M and Shinde L 2019. Qualitative and Quantitative Evaluation of Phytochemicals in Leaf Extract of Alstonia scholaris (L.) R. Br.By GC-MS Technique. Int. J. of Pha. and Bio. Sci-IJPBSTM 9 (3): 323-328.
Sharma P, Sharma R, Rao HS and Kumar D 2016. Phytochemistry and Medicinal Attributes of A.Scholaris: A Review. Int. J. Pha. Sci. Res. 6 (12): 505-13.
Siddiqui SA, Rahman MO, Akbar MA, Rouf ASS, Islam R, M. Rahman MS, and Rahman A 2015. Antioxidant and Cytotoxic Properties of Essential Oil and Various Extracts of Alstonia Scholaris (L.) R. BR. J. of Cha. and Dev. of Nov. Mat. 7 (1): 49-61.
Yadav R, Tyagi V, Tikar SN, Sharma AK, Mendki MJ, Jain AK and Sukumaran D 2013. Differential Larval Toxicity and Oviposition Altering Activity of some Indigenous Plant Extracts against Dengue and Chikungunya Vector Aedes albopictus. 8(2): 174-185.
Kallur R and Patil S 2019. To evaluate the effect of the Pesticide activity of of nanoformulations of Alstonia scholaris, against the pest- Rhyzopertha dominica using HPLC and Fourier transform infrared (FT-IR) spectra analysis. Int. J. of Med. Sci. and Cur. Res. (IJMSCR) Volume 2 Issue 3: 294-301.
Pawar NS, Salunke SP, Bhadane VV 2013. Toxicity and repellant activity of organic extracts of bioactive Indian medicinal plant Alstonia scholaris against Tribolium castaneum (Herbst) adults. Nat. Pro. an Ind. J. NPAIJ. 9 (2): 47-50.
User guide of Grains Research and Development Corporation (GRDC) Australia.
Abbott WS 1925. “A method of computing the effectiveness of an insecticide”. Journal of Economic Entomology Vol.18, pp. 265-267.
Pawara VL, Wasu YH and Bhande SS 2024. Biopesticidal efficacy of Devil’s tree (Alstoniascholaris) on Sitophilusoryzae (Pest of rice). International Educational Applied Scientific Research Journal, 09 (08): 5456-5040.
Ogendo JO, Belmain SR, Deng AL, Walker DJ 2003. Comparison of toxic and repellent effects of Lantana camara L. with Tephrosia vogelii Hook and a synthetic pesticide against Sitophilus zeamais Motschulsky (Coleoptera: Curculionidae) in stored maize grain. Insect Sci Appl 23 (2):127–135.
Dua VK, Pandey AC, Dash AP 2010. Adulticidal activity of essential oil of Lantana camara leaves against mosquitoes. Indian J Med Res 131:434–439.
Bina SF, Siddiqui TA and H Muddasar 2004. Tetracyclic triterpenoids from the leaves of Azadiracta indica. Phytochemistry, 65 (16): 2363-2367.
Nenaah GE and Ibrahim SIA 2011. Chemical composition and the insecticidal activity of certain plants applied as powders and essential oils against two stored-products coleopteran beetles. J. Pest. Sci. 2011; 84:393–402.
Ajayi FA 2007. Effect of grain breakage and application of insecticidal edible oils to protect pearl millet Pennisatum glaucum (L.) against infestation by adult Tribolium castaneum (Herbst.) (Coleoptera: Tenebrionidae). Electronic Journal of Environmental, Agricultural and Food Chemistry, 6 (4): 1965-1974.
Deka MK, Bhuyan M and Hazarika LK 2006.Traditional pest management practices of Assam. Indian Journal of Traditional Knowledge, 5 (1):75-78.
The National Education Policy (NEP) 2020 represents a comprehensive and forward-looking reform of the Indian education system. It seeks to address long-standing concerns related to quality, equity, access, relevance, and employability by introducing a learner-centric, multidisciplinary, and flexible framework. NEP 2020 emphasises holistic development, critical thinking, skill orientation, research, and the integration of technology at all levels of education. While the policy offers significant opportunities to transform higher education and align it with global standards, its implementation poses several challenges, including infrastructural inadequacies, teacher preparedness, financial constraints, governance complexities, and the digital divide. This paper critically examines the challenges and opportunities associated with the implementation of NEP 2020, with particular reference to higher education institutions. It also proposes practical and context-sensitive strategies to ensure effective, inclusive, and sustainable implementation. The study is based on secondary data collected from official policy documents, academic literature, and research reports. The paper aims to contribute to a deeper understanding of NEP 2020 and its implications for the future of Indian education.
Education is a fundamental driver of social transformation, economic development, and nation-building. A robust education system equips individuals with the knowledge, skills, values, and competencies required to participate effectively in a rapidly changing global environment. In India, despite considerable progress in expanding access to education, concerns regarding quality, rigidity of curricula, employability, and regional and social disparities have persisted. The need for comprehensive reform was therefore widely acknowledged.
In response to these challenges, the Government of India introduced the National Education Policy (NEP) 2020, replacing the earlier National Education Policy of 1986. NEP 2020 envisions an education system rooted in Indian values while being responsive to global trends and future needs. It aims to move away from rote learning and examination-centric practices toward conceptual understanding, experiential learning, and multidisciplinary education. However, translating this ambitious vision into reality requires systematic planning, adequate resources, and coordinated efforts across all stakeholders. This paper analyses the challenges and opportunities involved in implementing NEP 2020 and suggests strategies to facilitate its effective execution, particularly in the context of higher education.
2. Objectives of the Study
The study is undertaken with the following objectives:
To examine the key features and reform agenda of the National Education Policy 2020.
To identify the major challenges in implementing NEP 2020 in higher education institutions.
To analyse the opportunities created by NEP 2020 for improving the quality, equity, and relevance of education.
To suggest practical strategies for the effective and sustainable implementation of NEP 2020.
3. Research Methodology
The present study is based on secondary data. Relevant information has been collected from the official National Education Policy 2020 document, reports of government committees, research articles published in peer-reviewed journals, books, and reliable online sources related to education policy and reform. A descriptive and analytical approach has been adopted to interpret the data and draw meaningful conclusions.
4. Key Features of NEP 2020
NEP 2020 introduces wide-ranging reforms across school and higher education, with a strong emphasis on quality, flexibility, and inclusivity. Some of the prominent features of the policy include:
Holistic and Multidisciplinary Education: The policy encourages integration of arts, science, commerce, and vocational subjects to foster comprehensive intellectual and personal development.
Multiple Entry and Exit System: Learners are provided with flexible pathways in higher education, supported by the Academic Bank of Credits (ABC), enabling lifelong learning.
Skill Development and Vocational Education: Integration of vocational education, internships, and hands-on training aims to enhance employability and entrepreneurship.
Technology Integration: Digital learning platforms, online resources, and educational technology are promoted to expand access and improve learning outcomes.
Institutional Autonomy and Governance: Greater academic, administrative, and financial autonomy is granted to higher education institutions to promote innovation and excellence.
Teacher Professional Development: Continuous professional development, merit-based career progression, and improved service conditions are emphasised.
5. Challenges in Implementing NEP 2020
Despite its progressive vision, the implementation of NEP 2020 faces several challenges.
5.1 Infrastructure and Resource Constraints
Many higher education institutions, particularly in rural and semi-urban areas, lack adequate physical and digital infrastructure. The successful implementation of multidisciplinary programs, research initiatives, and technology-enabled learning requires substantial investment in classrooms, laboratories, libraries, and digital connectivity.
5.2 Teacher Preparedness and Capacity Building
Teachers are central to the success of NEP 2020. However, a significant proportion of faculty members may not be adequately trained to adopt interdisciplinary teaching, competency-based assessment, and experiential learning methods. Continuous professional development remains a critical challenge.
5.3 Digital Divide
While NEP 2020 strongly advocates the use of technology in education, unequal access to digital devices, internet connectivity, and digital literacy can exacerbate existing inequalities. Bridging the digital divide is essential to ensure inclusive implementation.
5.4 Financial Constraints
The policy recommends increasing public investment in education to 6 per cent of GDP. However, limited financial resources and competing developmental priorities may affect the pace and scale of implementation.
5.5 Governance and Administrative Challenges
Effective implementation requires coordinated action among central and state governments, regulatory bodies, and institutions. Administrative rigidity, lack of clarity in roles, and resistance to change can hinder the reform process.
6. Opportunities Offered by NEP 2020
NEP 2020 provides several opportunities to strengthen and modernise the Indian education system.
6.1 Learner-Centric and Flexible Education
Flexible curricula and choice-based learning pathways empower students to pursue their interests and develop critical thinking, creativity, and problem-solving skills.
6.2 Improved Employability and Entrepreneurship
The emphasis on skills, internships, and vocational education helps bridge the gap between education and the labour market, promoting employability and entrepreneurship.
6.3 Global Engagement and Competitiveness
Internationalisation of higher education, academic collaborations, and credit transfer mechanisms enhance India’s global academic standing.
6.4 Promotion of Research and Innovation
The establishment of the National Research Foundation aims to strengthen research culture, funding, and interdisciplinary collaboration.
6.5 Inclusive and Equitable Education
Special focus on disadvantaged groups, regional languages, and inclusive practices contributes to social equity and national integration.
7. Strategies for Effective Implementation of NEP 2020
To realise the objectives of NEP 2020, the following strategies are suggested:
Teacher Capacity Building: Regular training programs, workshops, and academic mentoring should be organised to enhance pedagogical and research capabilities.
Infrastructure Development: Targeted investment in physical and digital infrastructure is essential, especially in under-resourced institutions.
Public–Private Partnerships: Collaboration with industry and private organisations can support skill development, internships, and resource mobilisation.
Phased and Context-Sensitive Implementation: Reforms should be implemented in phases, considering regional diversity and institutional readiness.
Robust Monitoring and Evaluation: Transparent monitoring mechanisms should be established to assess progress and ensure accountability.
Stakeholder Awareness and Participation: Active involvement of students, parents, teachers, and administrators is crucial for successful implementation.
8. Conclusion
The National Education Policy 2020 represents one of the most ambitious and comprehensive education reforms undertaken in independent India. By emphasising holistic development, multidisciplinary learning, flexibility, skill orientation, and research-driven growth, the policy seeks to align the education system with the needs of the twenty-first century. NEP 2020 recognises education not merely as a means of acquiring degrees, but as a continuous process of developing intellectual, ethical, social, and professional capacities.
However, the successful realisation of this vision depends largely on the effectiveness of its implementation. Challenges such as infrastructural inadequacies, limited financial resources, uneven digital access, and gaps in teacher preparedness pose serious constraints, particularly for public and rural institutions. These challenges highlight the need for sustained public investment, administrative reforms, and institutional capacity building. At the same time, NEP 2020 offers unprecedented opportunities to redesign curricula, promote research and innovation, improve employability, and enhance India’s global academic standing.
A collaborative and participatory approach involving governments, institutions, teachers, students, industry, and the community is essential for translating policy objectives into practice. Continuous monitoring, evaluation, and policy feedback mechanisms must be strengthened to ensure accountability and adaptability. If implemented with commitment, inclusivity, and long-term vision, NEP 2020 can play a transformative role in shaping an equitable, high-quality, and future-ready education system that contributes significantly to national development and global knowledge creation.
9. Implications of NEP 2020 for Higher Education Institutions
The implementation of NEP 2020 has far-reaching implications for higher education institutions in India. Universities and colleges are required to redesign curricula to support multidisciplinary education and flexible learning pathways. This necessitates structural changes, inter-departmental collaboration, and the creation of new academic programs that integrate humanities, sciences, commerce, and vocational studies.
Institutional autonomy, as envisaged under NEP 2020, places greater responsibility on higher education institutions for academic quality, governance, and financial management. While autonomy provides opportunities for innovation and responsiveness, it also demands strong leadership, transparent governance practices, and accountability mechanisms. Institutions must develop internal quality assurance systems and align their goals with national priorities.
NEP 2020 also emphasises research and innovation through the establishment of the National Research Foundation. Higher education institutions are encouraged to promote a research-oriented culture by providing incentives, infrastructure, and interdisciplinary platforms. This focus is expected to enhance knowledge creation, problem-solving capacity, and global competitiveness.
10. Role of Teachers and Academic Leadership
Teachers and academic leaders play a pivotal role in the effective implementation of NEP 2020. The shift toward learner-centric, experiential, and competency-based education requires teachers to adopt new pedagogical approaches and assessment practices. Continuous professional development programs must therefore be institutionalised to equip teachers with the necessary skills and knowledge.
Academic leadership is equally important in driving change at the institutional level. Principals, deans, and administrators must foster a culture of collaboration, innovation, and continuous improvement. Effective leadership can facilitate the alignment of institutional practices with policy goals, motivate faculty, and ensure stakeholder engagement.
11. Conclusion and Way Forward
In conclusion, NEP 2020 provides a comprehensive roadmap for transforming India’s education system into a more inclusive, flexible, and quality-driven framework. While the challenges associated with its implementation are substantial, they can be addressed through strategic planning, adequate funding, capacity building, and collaborative governance. The success of NEP 2020 ultimately depends on sustained political will, institutional readiness, and the active participation of all stakeholders. A phased, context-sensitive, and evidence-based approach to implementation will ensure that the policy’s transformative potential is fully realised, contributing to national development and global educational leadership.
References
Government of India. (2020). National Education Policy 2020. Ministry of Education.
Agarwal, P. (2020). Higher education reforms in India under NEP 2020. Indian Journal of Public Administration.
Tilak, J. B. G. (2021). Education reform in India: Challenges and prospects. Economic and Political Weekly.
1Mr.vishal Bhalchadndra Desale and 1Dr.Shivaji Bansilal Patil–
1Late Annasaheb R.D.Deore Arts and Science College Mhasadi Tal-Sakri, Dist-Dhule,vishaldesalesir@gmail.com
Abstract
The Andhra river basin is famous for the ‘Phad’ irrigation syste. The total length of the Pazara river is 138 km, and its basin covers approximately 3257 sq. km. It is an important river in Dhule district. The Kan river is its major tributary.The Phad irrigation system is a traditional and community-managed water distribution method predominantly found in the Sakri tehsil of Maharashtra, India. This indigenous system has been in use for centuries, serving as a testament to the creativity of local farmers in managing limited water resources. The Phad system entails the diversion of river water through a network of canals and distributaries to irrigate agricultural fields. This article examines the historical significance, operational dynamics, and socio-economic implications of the Phad irrigation system in Sakri tehsil. It also brings to light the challenges that the system faces in the contemporary era and the urgent need for its preservation and revitalization.
Keywords
Pazara river ,Phad Irrigation,Community-Based Irrigation ,Traditional Water Management, Sakri Tehsil, Maharashtra, Sustainable Agriculture.
Objectives:
The objective of this article is …..
1. To present an extensive overview of the Phad irrigation system in Sakri tehsil, focusing on its historical and cultural significance, and its role in promoting sustainable agriculture.
2.To analyze the effects of phad irrigation system on farmers life of sakri tehsil.
3.To identify the challenges that the system confronts and propose solutions for its conservation and modernization.
Introduction
Agriculture and water have a close relationship. Water is a crucial contribution to the agricultural sector. In Maharashtra, insufficient and irregular rainfall often leads to the loss of crops that are almost ready for harvest. Consequently, numerous droughts occur. Naturally, artificial water supply becomes necessary to save the crops. In Maharashtra, attempts have been made since ancient times to supply water to agriculture through wells and canals. The Phad system is one of the irrigation methods that existed in Maharashtra in the past. The Phad system of Khandesh is a method of flow irrigation
About Sakri Tehsil
Sakri tehsil serves as an administrative subdivision located within the Dhule district of Maharashtra. The elevation varies from a low of 128 meters to a high of 1,558 meters, with an average elevation of approximately 470 meters. The region is primarily composed of Deccan Trap Basalt dating from the Upper Cretaceous to Lower Eocene periods, often intersected by dykes.Annual maximum temperatures can soar to 42°C, while minimum temperatures hover around 6.5°C. The eastern region is classified as a scarcity zone, experiencing low and erratic rainfall of about 500 mm, whereas the western region acts as a transition zone with increased rainfall ranging from 700 to 750 mm. Major Rivers: The Panzara River serves as the main lifeline for the tehsil, originating in Pimpalner in western Sakri. Other notable rivers and streams include the Burai, Kan, and Jamkhedi. Fertile black cotton soil is prevalent along the riverbanks. Approximately 30.18% of the area is covered by forests, and around 45% of the land is utilized for cultivation. Key crops cultivated in the region include bajri, cotton, groundnut, and wheat. Despite facing numerous challenges, the farmers of Sakri tehsil have successfully managed to grow crops by utilizing the Phad irrigation system. The tehsil is distinguished by its dependence on traditional knowledge and community collaboration, both of which are vital for the efficient functioning of the Phad system.
What is Phad irrigation ?:
The Phad irrigation system is a traditional water management technique that has its origins in the medieval period. It involves the establishment of small diversion weirs, known as bandharas, across rivers to channel water into a network of canals and distributaries. These canals, referred to as Phads, systematically and equitably distribute water to agricultural fields. The Pazara river basin is famous for the ‘Phad’ irrigation system. This river originates in the Sahyadri range at an altitude of 600 meters above sea level. Its source is located between 20°52′ North latitude and 73°55′ East longitude. The Panjhra river flows eastward for 99 km. Then, turning north, it joins the Tapi river near Mudawad and Sindkheda. The total length of the Panzara river is 138 km, and its basin covers approximately 3257 sq. km. It is an important river in Dhule district. The Kan river is its major tributary. Although the banks of these rivers are higher near their source, the height decreases in the plateau region. Moreover, there are rocks in the riverbeds at various places. Previously, these rivers flowed throughout the year. Therefore, to utilize the flowing water for agriculture, the people of this basin have built stone dams of 2 to 3 meters in height in the riverbeds. Most of the villages along the riverbanks in this basin have dams, and the Phad system exists on these dams. It would be more appropriate to call the Panzara a river of dams. According to the Panzaraproject, there are 45 dams on this river. Around 1962, the Phad system was in operation on 30 dams from Pankheda to Betawad.
Positive aspects of the Phad Irrigation System
1.The Phad system allows for water distribution considering the water requirements of each crop. For example, the Kamod variety of rice requires water daily. The next priority is sugarcane, followed by other crops
2. Water is supplied to a continuous area of land through a single channel, and all the land receives equal water. This prevents water wastage, and the water does not spread to scattered fields through numerous channels.
3.The crop rotation system allows the land to rest. Despite this system being in use for hundreds of years, the land has never become degraded or saline.
4.There are separate employees for water distribution. They distribute water in turns according to the instructions of the chairman. Therefore, there is no excessive or unauthorized use of water. Moreover, everyone receives equal water.
5. Since the Phad institutions carry out minor repairs to the dam and canals in this system, the government does not have to incur any expenses for them.
6. The Phad system depends on gravity for the flow of water, which lessens the requirement for external energy sources machinary and tools.
7.This system is designed to be uncomplicated and cost-efficient, requiring very little maintenance and few empoyes to maintain
8 The management of the system is conducted by local communities, who collectively decide on the distribution of water. it increse co operation between villagers
The Phad system has significantly contributed to the cultivation of crops like wheat, millet, and pulses in Sakri tehsil. It has also been pivotal in sustaining the ecological balance of the region.
Challenges encountered by the Phad irrigation system
While the Phad irrigation system is effective, it faces several challenges in the contemporary era. These challenges are as follows:
1.Deforatation : twenty years ago, due to good forests cover the watershed area of the Panzara valley, there was a perennial flow in the river. But nowdays deforestation and an increase in wells and boarwells the groundwater level decreased. The river flow diminished and now lasts only 5 to 6 months.
2.Fragmention of Holdings : After 1950, population growth necessitated the fragmentation of already small landholdings. The one hectare of permanently irrigated land owned by a farmer was divided among his 2-3 children, creating an even more difficult situation.
3.Lacking Mmaintenance– Grass and bushes grew in the irrigation channels; silt accumulated in the dams, yet no cleaning was done. Farmers along the riverbanks even encroached upon the silt accumulated in the dams.
4.Availability of Private Irrigation Facility : various government schemes providing easy loans and subsidies for wells became available. Then, farmers who depended on public irrigation channels and couldn’t afford their own wells quickly dug wells, and once they had their own private resource, the publicly managed Phad system began to be increasingly neglected.
5.Construction of Dams :from 1970, the construction of government dams on Panzara and kan river began .Latipada and Akkalpada on Pazara and malngaon on Kan river is good example of it.Since these projects, the government gained control over water of rivers.
6. Climate Change: Erratic rainfall patterns and extended droughts have significantly influenced the availability of water in rivers throughout the year for irrigation purposes. The unpredictability of the rainy season makes it challenging for farmers to depend on phad irrigation.
7. Changes in Land Use Patterns: In numerous towns within Sakri tehsil, individuals residing along the riverbanks strive to build close to the river. They establish houses and factories near the riverbank. The growth of urban areas has encroached upon agricultural land and water resources.
8. Insufficient Government Support: The phad system has received scant attention from policymakers. Government initiatives favouring drip irrigation and the construction of ponds on farms have led to insufficient funding and infrastructure development.
9. Decline in Traditional Knowledge: For the effective operation of the daily irrigation schedule in the phad system, traditional agricultural knowledge is necessary. Nevertheless, the younger generation is progressively moving away from agriculture and rural communities, resulting in a loss of traditional knowledge.
To address these challenges, it is essential to modernize the Phad system. This could involve integrating modern technology, such as sensors and automated gates, to enhance water management. Moreover, government support and community awareness initiatives are vital for the preservation and revitalization of this traditional system.
Conclustion
The Phad irrigation system found in Sakri tehsil is a notable example of traditional water management that has supported agriculture in a difficult environment for centuries. The block system established for water distribution from dams in 1903-1904 was modelled after the Phad system. The recommendation made by the Bombay Inquiry Committee in 1938 to create farmers’ cooperative societies or water panchayat institutions for water distribution was also influenced by the Phad system. This method had been carefully observed by a prominent engineer, Sir M. Visvesvaraya., who had resided in Dhule for some period . Since the early 20th century, the Phad system has been regarded as a benchmark for water distribution from dams. It is essential that all possible actions are taken today to protect this Phad system, which was innovated by Indians, fosters collaboration, and is recognized for its fair water distribution.
References:
1. Pawar, S. (2015). Community-Based Water Management: A Case Study of Phad Irrigation in Maharashtra. International Journal of Rural Studies.
2. Deshpande, R. S. (2005). Traditional Water Management Systems in Maharashtra. Indian Journal of Agricultural Economics.
3. Mishra, A. (2001). The Radiant Raindrops of Rajasthan. Research Foundation for Science, Technology and Ecology.
4. Agarwal, A., & Narain, S. (1997). Dying Wisdom: Rise, Fall and Potential of India’s Traditional Water Harvesting Systems. Centre for Science and Environment.
5.Government of Maharashtra. (2010). Report on Traditional Irrigation Systems in Maharashtra. Department of Agriculture.
2Insurance Institute of India, BKC, Bandra, Mumbai
Abstract
In the contemporary knowledge-driven economy, the structure of business assets has shifted significantly from tangible resources to intangible and innovation-based assets. Intellectual Property Rights (IPR) has emerged as critical financial and strategic instruments influencing enterprise valuation, credit assessment, and investment decisions. This research paper examines the role of Intellectual Property Rights within the Indian banking and financial system, focusing on their impact on firm valuation, access to finance, and investor confidence. The study adopts a doctrinal and analytical research methodology based on secondary data sourced from statutes, policy documents, institutional reports, and recent scholarly literature. The findings reveal that enterprises with strong IPR portfolios demonstrate enhanced creditworthiness, reduced information asymmetry, and improved funding opportunities, particularly in the case of MSMEs and startups. The paper concludes that integrating IPR valuation mechanisms into banking and financial frameworks is essential for fostering innovation-led growth and strengthening India’s economic competitiveness.
The evolution of global and Indian economies has witnessed a gradual transition from asset-intensive production systems to knowledge-based economic models. In this changing environment, intellectual assets such as patents, trademarks, copyrights, software, and proprietary technologies have assumed greater importance than traditional physical assets. For modern enterprises, value creation increasingly depends on innovation, branding, and technological capability rather than land or machinery alone.
This transformation poses new challenges for banking and finance. Traditional lending models rely heavily on tangible collateral, whereas innovation-driven enterprises often possess limited physical assets but substantial intellectual capital. Intellectual Property Rights (IPR) provide a legal mechanism through which intangible assets can be protected, commercialized, and converted into economic value. Consequently, IPR has gained relevance not only as a legal safeguard but also as a determinant of enterprise valuation, creditworthiness, and investment potential.
In India, the rapid expansion of startups, MSMEs, finTech firms, and technology-oriented businesses has intensified the interaction between intellectual property and financial systems. Financial institutions, venture capitalists, and investors increasingly consider IPR portfolios while evaluating funding proposals. This paper analyses the role of Intellectual Property Rights from a banking and finance perspective, highlighting their contribution to enterprise valuation, lending decisions, and economic growth.
Objectives of the Study
The objectives of the present study are as follows:
To examine the role of Intellectual Property Rights in enterprise valuation from a banking and finance perspective.
To analyze the relevance of IPR in banking credit appraisal and lending decisions.
To study the impact of IPR ownership on investment, funding, and financial performance of enterprises.
To assess the influence of international IPR frameworks on the Indian financial system.
To identify challenges associated with IPR valuation and financing in India.
Hypotheses
The study is based on the following hypotheses:
Intellectual Property Rights positively influence enterprise valuation and financial credibility.
Enterprises with strong IPR portfolios face fewer constraints in accessing finance.
Integration of IPR frameworks into financial systems supports innovation-led economic growth.
Research Methodology
The study adopts a doctrinal and analytical research methodology. It relies exclusively on secondary data, collected from:
Indian intellectual property statutes
Reports of the Reserve Bank of India, WIPO, WTO, OECD, and Government of India
Peer-reviewed national and international journals
Books and policy documents related to banking, finance, and intellectual property
The collected data is analyzed qualitatively to evaluate the financial and commercial implications of Intellectual Property Rights in India.
Review of Literature
The shift toward knowledge-based economies has prompted extensive scholarly inquiry into the financial relevance of Intellectual Property Rights. Recent literature recognizes IPR as a strategic financial asset influencing firm valuation, investment attractiveness, and access to institutional finance.
Hall et al. (2024) demonstrate that patents and trademarks function as reliable indicators of innovation capability and growth potential. Their study finds that firms with protected intellectual assets enjoy higher market valuation and improved financing outcomes due to reduced information asymmetry between enterprises and financial institutions.
Kumar and Sharma (2023) focus on emerging economies and highlight that intellectual property significantly strengthens enterprise valuation where physical collateral is limited. Their findings indicate that IPR enhances goodwill and balance-sheet strength, thereby positively influencing investor and lender perceptions.
From a banking perspective, the OECD (2023) observes a gradual global shift toward intellectual property-backed financing. While advanced economies have begun incorporating IPR valuation into credit frameworks, developing economies such as India face challenges related to valuation uncertainty, enforcement risks, and institutional capacity constraints.
Venture capital literature further emphasizes the importance of IPR. Lerner and Nanda (2024) argue that strong patent portfolios and brand protection improve bargaining power during investment negotiations, leading to higher valuations and favorable funding terms.
Studies on MSMEs reveal that registered intellectual property improves access to formal finance and enhances long-term sustainability (Singh & Mehta, 2023). However, limited awareness and procedural complexity continue to restrict effective utilization of IPR among small enterprises.
International organizations such as WIPO (2023, 2024) and WTO (2023) underline that harmonized intellectual property regimes under the TRIPS framework strengthen investor confidence, promote technology transfer, and support financial stability. Despite these insights, the literature reveals a lack of focused research on integrating IPR valuation into Indian banking systems, creating a clear research gap addressed by the present study.
Review of Literature Summary Table
Author & Year
Focus Area
Key Findings
Hall et al. (2024)
IPR & firm valuation
IPR enhances market value and financing outcomes
Kumar & Sharma (2023)
Emerging economies
IPR strengthens goodwill and enterprise valuation
OECD (2023)
IPR-backed financing
Valuation challenges limit banking adoption
Lerner & Nanda (2024)
Venture capital
Strong IPR attracts higher investment
Singh & Mehta (2023)
MSMEs
IPR improves access to institutional finance
WIPO (2023, 2024)
Global IPR regime
Harmonization improves investor confidence
Theoretical Framework
The study is grounded in the Resource-Based View (RBV), which identifies unique and inimitable resources as sources of sustained competitive advantage. Intellectual Property Rights qualify as such resources due to their exclusivity, revenue-generating potential and legal enforceability.
Additionally, Signaling Theory explains how enterprises use patents and trademarks to signal quality, innovation capacity, and growth potential to banks and investors. By reducing information asymmetry, IPR enhances trust and influences financial decision-making.
Intellectual Property Rights as Financial Assets
Intellectual Property Rights convert innovation into legally protected economic assets. Patents generate royalty income, trademarks create brand-based revenue, and copyrights support monetization through licensing. During mergers and acquisitions, intellectual property significantly contributes to goodwill and enterprise valuation, reinforcing its importance in financial analysis.
Role of IPR in Banking and Credit Assessment
Registered intellectual property improves creditworthiness by demonstrating ownership, innovation capability, and market potential. Although IPR-backed lending is still evolving in India, banks increasingly consider intellectual assets while assessing startup and MSME proposals. Strong IPR protection also reduces default risk by safeguarding revenue streams from imitation.
IPR and Investment Decisions
Investors and venture capitalists rely on IPR portfolios to assess scalability and risk. Enterprises with protected innovations attract higher valuations, strategic partnerships, and long-term funding. IPR thus plays a decisive role in shaping investment outcomes in innovation-driven sectors.
Challenges in IPR Financing
Despite its potential, IPR-based financing faces obstacles such as lack of standardized valuation models, limited banking expertise, enforcement risks, and low awareness among enterprises. Addressing these challenges is critical for mainstreaming IPR within financial systems.
Findings
Intellectual Property Rights significantly enhance enterprise valuation and financial credibility.
Firms with strong IPR portfolios enjoy better access to finance and investment.
IPR reduces information asymmetry between enterprises and financial institutions.
Valuation and enforcement challenges limit the widespread adoption of IPR-backed financing.
Suggestions
Banks should develop structured frameworks for IPR valuation and risk assessment.
Regulatory authorities should issue guidelines on intellectual property-backed lending.
MSMEs should be encouraged to register and strategically manage intellectual property.
Capacity-building programs should be introduced for bankers and financial analysts.
Conclusion
Intellectual Property Rights have emerged as a vital bridge between innovation and finance in India’s evolving economic landscape. Recognizing intellectual property as a financial asset enhances enterprise valuation, improves access to credit, and strengthens investor confidence. Integrating IPR into banking and financial frameworks is essential for supporting innovation-led growth, MSME development, and global competitiveness. A robust and well-implemented intellectual property regime will play a decisive role in shaping India’s future economic progress.
References
Controller General of Patents, Designs and Trade Marks. (2024). Annual report 2023–24. Government of India.
Hall, B. H., Helmers, C., Rogers, M., & Sena, V. (2024). The importance of intellectual property for firm performance and finance. Research Policy, 53(2), 104889.
Kumar, S., & Sharma, R. (2023). Intellectual property rights and firm valuation: Evidence from emerging economies. Journal of Intellectual Capital, 24(3), 635–654.
Lerner, J., & Nanda, R. (2024). Venture capital, innovation, and intellectual property protection. Harvard Business Review, 102(1), 78–87.
Singh, A., & Mehta, P. (2023). Role of intellectual property in MSME financing and growth in India. International Journal of Business and Emerging Markets, 15(4), 412–428.
World Intellectual Property Organization. (2023). World intellectual property indicators 2023. WIPO.
World Intellectual Property Organization. (2024). Global innovation index 2024. WIPO.
World Trade Organization. (2023). TRIPS agreement: Trade, innovation and development. WTO.
Government of India adapted new education policy on 29th July 2020. TheNational Education Policy (NEP) 2020 represents a Crucial and innovative shift in India’s educational framework, emphasizing holistic learning and the integration of traditional Indian knowledge systems, such as yoga and mindfulness. This research article presents a comprehensive analysis of how NEP 2020 has influenced the incorporation of yoga and mindfulness practices in Indian educational institutions. The study aims to assess the extent to which these practices have been adopted and their perceived benefits for students’ overall well-being through an in-depth review of policy documents, academic literature, and case studies. Yoga education aims to contribute the overall well-being of students by promoting their physical, mental, emotional, and spiritual growth.Trained Instructors: Educators will receive specialized training to ensure they have the essential skills and knowledge to teach yoga effectively.The policy highlights the importance of traditional yoga practices, including asanas, pranayama, and meditation. Promoting research and innovation in yoga education to explore its benefits and applications, along with integrating yoga into higher education curriculum. Yoga will be available as an elective or credit course in universities and colleges.Yoga education will involve community engagement, promoting yoga practices beyond the classroom. The National Education Policy of India aims to cultivate a healthier, more balanced, and conscious society. Yoga education involves the study and practice of yoga principles, techniques, and philosophies, promoting physical, mental, and emotional well-being along with spiritual development. Here are some essential elements of yoga education: Asanas (postures): Instruction on various yoga poses, breathing techniques, and alignment principles. Pranayama (breathing techniques): Guidance on conscious breathing practices. Meditation and Mindfulness: Understanding their origins, practices, and benefits for mental well-being. Integrating yoga education into NEP 2020 will help future generations achieve their goals more easily. It promotes innovative thinking, enhances cognitive skills, and improves overall well-being by keeping the body active. This paves the way for a healthier and happier generation.
Introduction-
The National Education Policy (NEP) 2020 is an all-encompassing and forward-thinking approach to education in India. The aspects of this policy aim to encompass all levels of education, from elementary to higher education, across both rural and urban regions of India. The policy has been designed, detailed, and is being executed in alignment with the global education development framework outlined in Sustainable Development Goal 4 (SDG4) of the 2030 Agenda for Sustainable Development, which was officially approved and adopted by the Indian government in 2015. The National Education Policy 2020 places significant focus on to approve relativity among students. All-inclusive development of personality denotes the overall development of the future potential of every individual. It essentially represents the enhancement, progress, and advancement of logical, intellectual, physical, analytical, philosophical, and spiritual abilities in each individual, enabling them to meet the requirements, necessities, and challenges of contemporary life in the post-pandemic era. As stated earlier, these competencies and aptitudes are vital for attaining success and excellence in all aspects of personal and professional pursuits.
OBJECTIVES OF THE STUDY
The main objective of this research article is to observe and reveal the impact of the new education Policy, 2020,Integrating Yoga into Higher Educationa comprehensive analyzed of its implementation within the new education policy framework for university students.
Research Methodology
This research article relies on gathering secondary data, conducting observations, inquiries, and performing a descriptive analysis. The necessary secondary data and information were sourced from various college teachers and students, newspapers, magazines, journal publications, and more. The collected data, observations, and inquiries were analyzed, assessed, and synthesized to reach a conclusion.
VARIOUS EDUCATIONAL POLICIES AND THEIR WORKED
In 1935, Macaulay introduced the educational proposal, which proved highly beneficial to the British Empire. n 1935, this fostered a perception of the education system as one that merely produced clerks, instilling apathy toward their own culture, traditional knowledge, and the Gurukul system, which offered holistic education to the younger generation.
“In 1948, to implement educational policies effectively, it is essential to examine the key functional changes. Following India’s independence in 1947, the University Education Commission was established under the leadership of Dr. Radhakrishnan. Subsequently, the Mudaliar Committee was formed in 1952, followed by the Kothari Commission in 1964.”
In 1968, the National Education Policy was introduced. Its key features included the emphasis on education as a means to achieve social harmony after independence. Gandhi highlighted the urgency of education that integrates intellectual and practical skills, making it directly relevant to everyone’s life. This pattern followed a 10+2+3 structure. Education was compulsory but free, with a focus on agriculture, industry, teacher training, grassroots education, examination requirements, and book production for language development. Additionally, Indian knowledge was included as a subject of study.
In 1986, the National Education Policy came again. In this policy, the pattern of 10+2+3 was kept as before. In this policy, teacher training, women education, education for Scheduled Castes and Scheduled Tribes, Mid-day meal, healthy awareness, these all areas are focusing.The policy should also have a cultural perspective and inclusion of three languages was considered.
In 1990 External Quality assessment and 1994 National Assessment and accreditation council in 2005 The National Knowledge Commission, aimed to achieve objectives such as Expansion, Inclusion, and Excellence. But the other 50 universities have given suggestion and considered.
In 2008, the Dr. Yashpal Committee emphasized the importance of research and underscored its necessity.2013-RUSA Rashtriy Uchchstar Shiksha Abhiyan focuses on expansion of education and quality improvement.2011- In Maharashtra- Dr. Kakodkar/Dr Nigvekar/Dr Takawale committee, was established. In this, A3 i.e. Anyone, Anytime, anywhere is the overall idea of education. Also, adding to this, Dr Narendra Jadhav Committee has suggested to improve the quality of education by setting different criteria for research, skill development, and people of each level.2015 – It was during this period that the idea of ‘New Education Policy’ was started. A committee headed by TSR Subramanyam submitted a report in 2016, but the policy was not approved.
In 2020, following the 2016 initiatives, a committee led by K. Kasthurirangan carefully examined various aspects and formulated a new education policy. This policy was officially introduced for implementation on July 29, 2020.The National Education Policy (NEP) 2020 includes yoga into its academic structure, striving to make physical education, sports, yoga, and mental wellness programs. Moreover, NEP 2020 supports Integrating yoga, naturopathy, and the AYUSH system into healthcare education. It also encourages integrating Indian Knowledge Systems (IKS) into engineering diploma programs.
The Policy aims for an integrative system of healthcare education curriculum. Medical undergraduate students may have the opportunity to take a first-year credit course centered on Indian Systems of Medicine. This course aims are to give basic knowledge about naturopathy, yoga, pranayama, Ayurveda etc. The second-year student have the option to enroll in a two-semester credit course that examines the theory and practice of a particular Indian System of Medicine, such as Yoga. NEP’s proposed framework emphasized that with 2 credits for the ‘Yoga education’ coursework, students can be equipped to be strong both physically and mentally, while aiding them in Integrating their physical, mental, and spiritual faculties.UGC has Guideline for Incorporating Indian Knowledge in Higher Education Curricula, 2023 stated that,considering the emphasis placed by NEP 2020 on integrating Indian context and the Indian Knowledge System (IKS) like Yoga ‘into our curricula and pedagogy, all students in undergraduate (UG) and postgraduate (PG) programs should be encouraged to take IKS credit courses amounting to at least five percent of their total required credits.
Conclusion
The national education policy (NEP) 2020 is a visionary framework designed to revamp India’s education system, making it more holistic, adaptable, and aligned with the demands of the 21st century. It highlights inclusivity, quality, and the incorporation of traditional Indian Knowledge Systems (IKS), with a particular focus on yoga education. This paper examines how the implementation of NEP 2020 promotes a well-rounded, balanced, and culturally enriched educational experience. The policy regards yoga as a comprehensive educational tool that fosters cognitive abilities, mental well-being, ethical principles, and inclusivity. Integrating yoga into higher education encourages lifelong learning and personal development, aligning with ancient Indian educational traditions. The policy emphasizes experiential learning, critical thinking, and ethical values, aligning with yoga principles to cultivate well-rounded individuals who contribute positively to society. By integrating yoga into the educational system, NEP 2020 respects India’s cultural heritage while providing students with essential tools for a balanced and fulfilling life.
Government of India. National Education Policy 2020.Ministry of Human Resource Development; 2020.
Ministry of Education. Implementation Plan for National Education Policy 2020. Government of India; c2021.
Ministry of Youth Affairs and Sports. Khelo India Scheme. Government of India; c2021.
Sports Authority of India. Annual Report. Government of India; 2021.
Fit India Movement. Government of India; c2021. Available from: Available https://fitindia.gov.in
Mrs. Rashmi P. and Dr. Jaydeep D.(2023)Place of Yoga in National Education Policy 2020.EPRA International Journal of Research and Development (IJRD) Journal DOI: 10.36713 ISSN: 2455-7838(Online) Volume: 8 | Issue: 6 | June 2023
Higher academic accomplishment, better classroom behavior, and better long-term mental health are all closely correlated with social and emotional competences (SEC), which include self-awareness, self-management, and relationship skills. Incorporating SEC into curricula promotes a supportive, effective learning environment by assisting students in controlling their emotions, persevering through difficulties, and forming meaningful connections.
The goal of the five social-emotional learning core competencies is to give teachers a clear framework for teaching skills that will help students in a variety of contexts throughout their life, from the workplace and school to their families and other communities. These competences were chosen because they effectively identify the abilities needed to thrive in a variety of spheres of life, from reaching academic objectives to feeling more comfortable in social situations. Developing these fundamental skills in each kid via social and emotional learning is a beneficial and healthy process that can then benefit the communities to which these children belong.
The 5 core SEL competencies
Self-Awareness
Self-Management
Responsible Decision Making
Social Awareness
Relationship Skills
1.Self-Awareness The capacity to think about and comprehend your own feelings, ideas, experiences, and ideals and how they may affect your behavior is known as self-awareness. Increasing your self-awareness can help you recognize your unique strengths and shortcomings in a variety of areas, which may enhance your ability to make decisions and control yourself (two additional essential skills).Understanding how your thoughts and emotions influence your behavior can motivate you to make constructive life changes and adopt a viewpoint that will give you fresh perspective on your own choices, passions, and behaviors. Self-awareness is a crucial component of the five core competencies because it not only promotes optimism and responsible decision-making but also serves as a basis for building and sustaining positive interpersonal connections.
Self-Awareness Lesson: Be Truthful With Yourself
Positive Action promotes self-awareness by utilizing a core philosophy that is woven throughout seven units, forming the foundation for all materials. The philosophy presented in Unit 1 states that engaging in positive actions leads to feeling good about oneself.
This becomes a conscious and practical concept through the Thoughts-Actions-Feelings about Self-Circle, illustrating how thoughts result in actions, actions in feelings about yourself, and then return to thoughts.
The Self-Awareness competency is taught specifically in Unit 5, where students discover that by being truthful with themselves, they can evaluate their strengths and weaknesses accurately.
It appears that there is no text provided for me to paraphrase. Please share the content you’d like me to rephrase, and I’ll be happy to assist! Self-Governance
2. Self-Management
The self-management core competency emphasizes a person’s capacity to manage and oversee their emotions, thoughts, and actions. For instance, this could entail enhancing aspects such as stress management, organizational abilities, goal-setting skills, impulse regulation, and self-control.
Enhancing your self-management can boost your academic performance, work productivity, and relationships, in addition to fostering more responsible decision-making and a heightened awareness of safety issues.
Employing a constructive self-management approach within a SEL teaching framework can manifest in various ways, typically involving self-reflection and a pragmatic assessment of oneself, enabling subsequent actions (including those detailed in other competencies) to be taken constructively and positively
Self-Management Lesson: Cultivate Impulse Control
Intrinsic motivation is conveyed via the philosophy and the Thoughts-Actions-Feelings Circle: engaging in positive actions makes you feel good about yourself, based on the assumption that you desire to feel good about who you are.
It is specifically called “Self-Management” and instructs that we all possess personal resources to regulate in order to feel positive about ourselves, such as our thoughts, behaviors, emotions (anger, fear, concern, jealousy, solitude, anxiety, and more).
This aids students in managing impulse control. Enhancing self-management and impulse control is crucial for achieving positive academic and social-emotional outcomes for students, as well as fostering a well-functioning classroom atmosphere.
Learners are instructed that by effectively managing additional resources such as their time, energy, finances, belongings, and skills, they will experience improved self-esteem and feel a greater sense of control over their experiences in both school and life.
3. Responsible decision-making
Responsible decision-making entails the capability to make beneficial and constructive choices influenced by personal and social elements such as individual and academic objectives, ethical principles, safety issues, and societal norms. It calls for you to evaluate the outcomes of various possible actions, recognize your abilities and constraints, and be aware of when to seek additional assistance when making critical choices.
In daily life, individuals must make various decisions, both significant and minor, across a wide range of situations, all of which require focus and thought for a favorable result.
This might concern the way you decide to chase your individual aspirations, such as attaining specific academic grades linked to your abilities and weaknesses or enhancing your overall mindset, or it might involve social scenarios like opting to consider someone else’s viewpoint or deliberately investing more effort and time into nurturing positive relationships
4. Awareness of Society
The social awareness skill involves enhancing abilities such as empathizing with others, understanding perspectives of people in different circumstances, recognizing diverse individuals and groups, and ensuring fair treatment towards others.
This can assist you in building and sustaining healthy relationships and social interactions, thus positively affecting your family, school, and community, particularly when engaging in social-emotional learning within these groups.
Concerning equity and diversity, heightened social awareness can improve your capacity to comprehend the viewpoints of and relate to others, especially regarding traits such as gender, race, religion, age, culture, class, and economic conditions, and will guarantee that your decision-making in social environments like school considers diversity.
5. Relationship skills
The competency of relationship skills pertains to your capability to form positive bonds with others, along with your capacity to consider their emotions in various scenarios and social exchanges, to foster and sustain healthy, mutually beneficial relationships.
This includes various abilities, like active listening, effective and clear communication, recognizing suitable and unsuitable social behavior, readiness to compromise, ability to acknowledge and respect others’ emotions, thoughts, and values, along with the skill to see situations from another’s viewpoint and empathize with them.
In addition to personal situations with family and friends, relationship skills are valuable in school with peers and teachers, as well as in professional settings with colleagues and supervisors. Having the capability to build positive connections with those you learn and collaborate with enhances a more uplifting school or work atmosphere
Conclusion
The five SEL competencies—self-awareness, self-management, responsible decision-making, social awareness, and relationship skills—are essential for instructing and comprehending social and emotional learning in educational settings. These skills are entirely incorporated into the Positive Action program to guarantee that students have the abilities needed to lead joyful, satisfying, and optimistic lives.
References:
Goleman, D. (1995).Emotional Intelligence: Why It Can Matter More Than IQ.New York: Bantam Books.
Salovey, P., & Mayer, J. D. (1990). Emotional intelligence. Imagination, Cognition and Personality, 9(3), 185–211.
Elias, M. J., Zins, J. E., Weissberg, R. P., et al. (1997).Promoting Social and Emotional Learning: Guidelines for Educators.Alexandria, VA: ASCD.
Gangurde, D. U. Y. (2026). Humanities and Socialsciences to a Transforming Life and Society. International Journal of Research, 13(13), 190–195. https://doi.org/10.26643/ijr/2026/s13/22
Dr.Umesh Yashwantrao Gangurde
Assistant Professor
Krantiveer NavalBhau Arts
College Navalnagar Tal.Dist.Dhule
ABSTRACT:-This research paper highlights the topic Transforming life and Society under the influence of Humanities and Social Science. The society we live in, the culture we adopt, the lifestyle we follow as well as the ease of technological advancements, altogether have transformed our lives and surroundings to a different level. It can totally be agreed upon that major sources of social change include population growth and its composition, culture and technology, the natural environment, and social conflict but, humanities and social sciences are a part and parcel of these changes. Social change is a phenomenon that we constantly encounter in our daily lives. This is because the society we live in, itself keeps changing all the time. Humanities help us to understand others through their languages, histories, and cultures. Humanities and social science make it easy to understand whether a new technology or a new pattern of life would prove beneficial, fruitful, and healthy or unfit, barren, and impotent for the people. Societal transformations often include not only social changes but cultural, technological, political, and economic, as well as environmental. Social science helps people understand the consequences and application of newly emerging technologies. They are concerned with the social and economic advancement of humanity at large. This research paper focuses on the importance of Humanities and Social Sciences in a transformed life and society. The data collected is through secondary data analysis following a series of various research papers, books, articles, and literature review for the same.
KEYWORDS: Education system, Technological advancements, Social change and improved standard of living, Fruitful or Barren
OBJECTIVES: –1. The main objective of this study is to understand that humanities have an innovative and scientific nature that can improve the quality of life of people, thus leading to a change. 2. To aim on the fact that social science is important because its study helps us to gain knowledge of the society we live in and the changes brought in it.
INTRODUCTION: -In order to make something better, modifications are required and therefore nothing can be achieved if no modifications are made in existing situations. Social change and Transformation are a phenomenon that we constantly encounter in our daily lives. The concept of social transformation is closely linked to social change and therefore the two terms are often used interchangeably. In Sociology, Societal Transformation refers to “a deep and sustained, nonlinear systematic change in a society.” Societal transformations can also be referred as change of an entire culture or civilization. Humanities and Social science are concerned with the social and economic advancement of the race at large. Humanities, or the study of humanity, encompass a wide range of disciplines including History, Philosophy, Literature, and the Arts.
TECHNOLOGICAL CHANGE:- The humanities can give us critical thinking skills and the perspective to deal with issues such as climate change, economic inequality, runaway technological change wherein, the solutions require something different and more than technical knowledge alone. Whether the problem is social, economic, and environmental or health related, solving such problems calls for critical thinking, historical understanding, cultural literacy and creativity. It requires skills and competencies cultivated through an education in the humanities and social science, and the insights and discoveries generated by research in these disciplines. Social Science is defined as “the study of society with respect to how individuals behave, interact with each other, develop as a culture and impact the world.” It includes Anthropology, Economics, Political science, Sociology and Social psychology. It seeks to study the past and present of humans, the patterns of behavior and behavioral changes, cultural changes with respect to different norms and values as a whole, how individuals and groups interact and how societies are organized and functions. The humanities and social science play an important role in supporting decolonization and reconciliation of people. The research collectively focuses on the population as whole and the impact that humanities and social science have had on the population, culture, and various generations. Humanities and Social science have a profound impact on how we view and interact with the world around us. There are many ways in which Humanities and Social science have transformed and can transform life and society, some include:
EDUCATION SYSTEM:ØOften Education reform seems to take place un regard for the best interests of the learners. As per Education research, parents of younger children are more concerned that their children enjoy schooling and actively be a part of extra-curricular activities rather than sticking solely to bookish knowledge. By actively working with students of all ages and their parents, and understanding their perspective on schooling, researchers can discover new insights into what makes effective schools syllabi and therefore will be able to cater the students as per their need. Both humanity and social science can be used to reform and improve educational systems, curriculum and pedagogy. The study of education and learning can help to improve teaching practices and educational outcomes. This can lead to a more well-rounded and effective education system that benefits both individual students and society as a whole.
HEALTH AND WELL BEING:Ø By evaluating health care policies, social scientist can help ensure that our health care systems work at an optimal level. On one hand a nutritionist provides a diet chart/diet plan for an individual to have a healthy and balanced diet, whereas on the other hand a social scientist may look further into geographical, economic and social factors that impacts into the availability and accessibility of the diet. The field of psychology has made significant contributions to our understanding of mental health and the factors that contribute to it. This has led to the development of effective treatments and interventions for improving mental health conditions.
PERSONAL DEVELOPMENT:ØWhen we understand the world around us, we are able to live in a more manageable manner. Understanding the society we live in, eventually makes us realize what we need to do to contribute to it and make it a better place for others. It broadens our horizons by introducing us to different social movements and cultures. It helps us to develop the ability to make the right decisions. This can lead to personal growth and self-improvement, as well as a greater appreciation of the diversity of human experience.It is addressed to people through social science. It helps in raising attention to different perspectives of the society and is concerned for the public when it comes to holding politicians and media into account. In this technological era, majority of transformation has taken place in the field of media resulting into digital age and social media. Social media solely holds the power to access multiple angles of a debate and allows one to share their own opinion by being a part of community journalism and presenting our own accounts online. Democracy could not flourish without the humanities because humanities develop informed and critical citizens.
EFFECTIVE STRATEGIES:- The insights gained through the study of humanities and social science can be used to inform policy decisions at the local, national and international levels. Research in psychology may be used to inform the development of mental health policies, while in economics can inform economic policy decisions. The field of economics can provide insights into how to promote economic growth and stability, which can have positive impacts on individuals and society. Knowledge from the humanities and social science is crucial to understand the historical, structural and social phases that contribute to inequality, and to develop the most effective strategies that promote equity, diversity, inclusion, and decolonization.
WELFARE AND SOCIAL CHANGE:ØThe study of humanity and social science can also be used to promote social change. It can help to identify and address inequalities and injustices in society, such as discrimination based on race, gender, or other social identities. This research can inform policies and practices that promote fairness and equality for all members of society. One of the key roles of social science is how it affects decision making when it comes to move forward as a society, and eventually as an entire species. It offers new insights and generates modern ways of understanding on trending topics of debates about feminism, peace, ecology, social movements, and much more. The world needs to be a safer place where basic dignity and human rights are practiced. Social scientists have made a remarkable progress in the areas of human welfare and development. It can rightly be said that social science and humanities are partly responsible for new laws and regulations that govern how we work and live. Social scientists influence how existing laws can be changed to meet societal demands that were more or less not being fulfilled previously.
EMERGING TECHNOLOGY: ØScholars from social science and humanities are helping address the societal implications of technology. Social science helps people understand the consequences and application of newly emerging technologies, such as steam power. The expansion of railways and factories not only transformed the economy and the working world, but also changed the way people organized their family lives and leisure. By raising questions associated with large group of social, ethical, and legal issues surrounding the introduction of new technologies, they help us to have a better understanding of the consequences of new technological developments. The Humanities and social science make it easy to understand whether a new technology or a new pattern of life would prove beneficial, fruitful, and healthy or unfit, barren, and impotent for the people. In the recent years, nanotechnology and advances in medical research have had a significant impact on the way we live. Creating a better future means to recognize the leadership and hard-won achievements of those who came before us.
CONCLUSION:-
Social transformation refers to a fundamental change in society, which can be contrary to social change which is viewed as gradual, moderate, or slow change over a period of time. An understanding of the role of social scientist is must in order to be able to forecast where the human race is heading and taking the rest of the world with it. Social science offers an insight into society and makes it easy to understand the relationships between individuals within that society. The main aim of humanities and social science is to look into those issues that contribute in improving the knowledge and understanding of human beings and in turn favours the development of society. As our understanding of the world and the human condition continues to evolve, the importance and relevance of humanity and social science will continue to grow.
Das, D. T. L., & Thakur, D. R. (2026). Physical Education in NEP 2020: A Holistic and Interdisciplinary Approach. International Journal of Research, 13(13), 185–189. https://doi.org/10.26643/ijr/2026/s13/21
1Dr. Tarak L. Das and 2Dr. Rahul Thakur,
1Director of Physical Education & Sports,
NTVS’s G.T. Patil College, Nandurbar.
tarak19.das@gmail.com
2Department of Physical Education & Sports,
Lt. Loknete Maikrao Gavit Arts & Commerce College, Visarwadi.
Abstract
This paper explores how the National Education Policy (NEP) 2020 repositions Physical Education (PE) within India’s school and higher education systems by promoting an interdisciplinary, learner-centered, and holistic approach. Drawing on policy provisions, theoretical frameworks, and contemporary educational thinking, the paper argues that PEwhen integrated with cognitive, social, creative, and technological disciplinesbecomes a path for developing health-literate, resilient, and adaptable learners. The paper outlines conceptual linkages, curriculum design models, pedagogical strategies, assessment frameworks, and implementation challenges, and offers recommendations for policy makers, curriculum designers, teachers, and researchers.
Physical Education has traditionally been viewed as a discrete subject focused on physical fitness, games, and motor skill development. NEP 2020 reframes education toward holistic, multidisciplinary development and emphasizes the integration of experiential learning, life skills, and well-being across the curriculum. This creates an opportunity to reconceptualize PE not as a physical practice but as an interdisciplinary field that contributes to cognitive development, mental health, creativity, lifelong fitness, and community well-being.
(b) Map interdisciplinary links between PE and other disciplines;
(c) Propose curricular and pedagogical innovations; and
(d) Discuss implementation challenges and research directions.
2. NEP 2020: Positioning Physical Education
NEP 2020 stresses foundational learning, experiential pedagogy, and a focus on health and well-being. PE includes holistic development approach that is based on physical, emotional, cognitive, and ethical growth. NEP 2020’s flexibility and multidisciplinary learning pathways not only emphasizes on foundational literacy and numeracy, but also a wider range of 21st century skills i.e. critical thinking, collaboration, and socio-emotional learning. NEP also focuses on teacher training and continuous professional development.These shifts permit the expansion of PE’s remit to include health education, sports science, movement-based creativity, digital fitness technologies, and community health initiatives.
Learning through active, embodied experience develops Constructivism.Multiple Intelligences (Gardner) like bodily-kinesthetic intelligence as an equal domain to logical-mathematical and linguistic intelligences.Ecological Systems Theory (Bronfenbrenner) means situates the learner within interacting systems with family, school, communitywhere PE can act as a bridge to community health practices. Embodied Cognition is the cognitive processes those are deeply rooted in the body’s interactions with the world, implying movement enhances thinking and learning.
Practical intersections between PE and other subjects are as follows.
4.1 PE & Life Sciences: Learning human anatomy, physiology, and the science of exercise through practical labs (e.g., heart rate monitoring before and after activity). Projects on nutrition, growth, and injury prevention.
4.2 PE & Psychology: Embedding social-emotional learning (SEL) in team sports (conflict resolution, empathy).Mindfulness, breathwork, and stress management modules connected to classroom counseling.
4.3 PE & Mathematics and Statistics: Using sports data in research statistics and mathematical calculations for efficient sports performance.Time-motion studies and measurement activities to apply units, ratios, and percentages.
4.4 PE & Technology: Wearables and fitness trackers for data collection and biofeedback learning.Simple biomechanics experiments using video analysis, sensor data, and physics concepts (force, momentum).
4.5 PE & Performing Arts: Dance and movement integrated with music, theatre, or visual arts to teach cultural history, rhythm, and creative expression.Choreography projects that connect narrative storytelling and physical expression.
NEP 2020 emphasizes continuous professional development for that PE teachersneeded workshops on SEL, technology use, and curriculum integration.Creation of communities of practice across schools to share curricular units, assessment rubrics, and culturally-responsive practices. PE teacher is a concrete pillar of implementation of NEP 2020 so its capacity building is prime necessity in the curriculum.
6. Policy and Institutional Considerations:
The successful implementation of an interdisciplinary approach to Physical Education under NEP 2020 depends on several policy and institutional factors. Key enablers include the policy’s flexibility, its strong emphasis on multidisciplinary learning, and the provision for vocational and skill-based pathways that allow Physical Education to extend beyond traditional classroom boundaries. However, significant barriers continue to exist, such as inadequate infrastructure including playgrounds and laboratories, a shortage of professionally trained Physical Education teachers, assessment systems that remain heavily examination-oriented, and limited financial and material resources, particularly in rural and remote schools. To address these challenges, policy interventions should focus on ring-fenced funding for Physical Education infrastructure, incentives and continuous professional development opportunities for teacher training, the inclusion of Physical Education portfolios within continuous and competency-based assessment frameworks, and the promotion of public–private partnerships to support access to equipment, technology, and specialized training.
NEP 2020 creates a generative environment to reconceive Physical Education as an interdisciplinary, innovative, and essential component of holistic schooling. With deliberate curriculum design, teacher capacity building, and institutional support, PE can contribute to healthier, more engaged, and creatively capable learners. The shift from segmented subject teaching to integrated learning models offers promising pathways to realize NEP’s vision of an education system that nurtures the whole child.
Government of India. (2020). National Education Policy 2020. Ministry of Human Resource Development.
Casey, A., & Kirk, D. (2021). Models-based practice in physical education: A sociocritical perspective. Physical Education and Sport Pedagogy, 26(1), 1–15. https://doi.org/10.1080/17408989.2020.1789575
Gardner, H. (2011). Frames of mind: The theory of multiple intelligences (3rd ed.). Basic Books.
Kirk, D. (2010). Physical education futures. Routledge.
Lynch, T. (2019). Physical education teacher education and teacher training: Policy, practice and possibilities. European Physical Education Review, 25(2), 452–468. https://doi.org/10.1177/1356336X17750602
Pill, S. (2018). Teaching games and sport for understanding: Exploring and reconsidering its relevance in physical education. European Physical Education Review, 24(2), 1–14. https://doi.org/10.1177/1356336X17752053
Sharma, R., & Sharma, S. (2021). Holistic education and NEP 2020: Implications for school curriculum and pedagogy. Journal of Educational Planning and Administration, 35(4), 389–402.
Tomporowski, P. D., McCullick, B., Pendleton, D. M., & Pesce, C. (2015). Exercise and children’s cognition: The role of exercise characteristics and a place for metacognition. Journal of Sport and Health Science, 4(1), 47–55. https://doi.org/10.1016/j.jshs.2014.09.003
UNESCO. (2015). Quality physical education: Guidelines for policy-makers. UNESCO Publishing.
SSSTik is a free web-based tool that lets you download tiktok videos directly in watermark-free quality. If you have ever wanted to save a TikTok clip for offline viewing, this TikTok downloader gives you a direct link to the clean file. No app install, no sign-up, no waiting.
The entire process takes a few seconds on any device, whether you are on Android, iPhone, or a desktop browser.
How the SSSTik TikTok downloader works
SSSTik runs entirely in your browser. There is nothing to install or configure. Here is how to download video TikTok tanpa watermark in three steps:
Open TikTok and copy the video URL using the share or copy link button on the clip you want.
Go to SSSTik and paste that video URL into the input field on the page.
Tap the download button, pick your preferred format, and save TikTok content straight to your device.
Processing time is usually under two seconds. The tool fetches a direct link to the watermark-free file so you can unduh TikTok content without any extra software.
What you can save with SSSTik
Most people use SSSTik to grab standard video posts, but it handles more than that.
Full videos in MP4 file format at HD resolution, ready for offline viewing or sharing.
TikTok Stories that disappear after 24 hours, saved before they are gone.
Audio clips extracted from any short-form video, useful for content creators who repurpose sound.
Every download arrives without the TikTok watermark overlay. SSSTik does not remove a watermark after the fact. It provides a clean file link directly, which means the output quality stays intact.
Browse TikTok without an account
SSSTik also offers a TikTok Viewer that lets you watch profiles and videos without logging in. You can browse content as tiktok anonymous, with no account required and no watch history recorded.
This is practical for anyone who values user privacy or simply does not want to create a TikTok account. You can preview clips, check a creator’s page, and then decide what to unduh video TikTok for later.
Why users pick SSSTik for tik tok download
Several online tools claim to handle TikTok downloads. Here is how SSSTik compares on the criteria that matter most.CriteriaSSSTikTypical alternativesRegistrationNone requiredOften required or promptedWatermark TikTok removal methodDirect clean file linkPost-processing crop or blurDevice supportAny browser on mobile device or desktopSometimes limited to desktop onlyDownload speedUnder 2 seconds on average5-15 seconds with ads in betweenDaily limitUnlimited, freeCapped or paid tiers
No registration means you skip account creation entirely. Open the page, paste your link, and the file is ready. That reduced friction is why SSSTik stays a go-to option for people who download TikTok video regularly.
The tool works the same way on every device. Whether you are on a phone during a commute or at a laptop, the experience does not change.
Saving TikTok clips offline is useful when you travel without reliable internet, want to share a clip on another platform, or plan to repurpose content for your own creative projects. SSSTik handles all of that with a single paste-and-save workflow, free and open to everyone.
Influencing skills are no longer a “nice-to-have” for managers—they are a core leadership capability. In modern organizations, authority alone rarely gets things done. Teams are cross-functional, remote, diverse, and often more informed than ever. As a result, successful managers influence rather than command. They persuade, align, motivate, and guide decisions without relying on formal power.
This article explores the best examples of influencing skills for managers, showing how they work in real situations and why they matter. Each example reflects a practical leadership scenario you’re likely to encounter, whether you manage a small team or a large organization.
1. Influencing Through Clear Vision and Purpose
One of the strongest influencing skills a manager can demonstrate is the ability to connect everyday tasks to a bigger picture. People are far more likely to support decisions when they understand why something matters.
A manager with strong influence doesn’t just say, “We need to change this process.” Instead, they explain how the change supports team goals, customer satisfaction, or long-term growth. This clarity builds voluntary buy-in rather than reluctant compliance.
Example: A product manager introduces a new development framework that initially slows delivery. Instead of focusing on deadlines, they explain how the framework will reduce defects, improve collaboration, and protect the team from burnout over time. As a result, resistance turns into cooperation because the team understands the purpose behind the decision.
Influence here comes from meaning, not authority.
2. Influencing by Active Listening
Managers often underestimate how powerful listening can be as an influencing tool. When people feel genuinely heard, they are more open to persuasion—even when they disagree.
Active listening involves more than staying quiet. It means asking thoughtful questions, reflecting back what you’ve heard, and validating concerns without immediately trying to “fix” them.
Example: A team is resistant to returning to the office part-time. Instead of enforcing a policy immediately, the manager schedules listening sessions. They acknowledge concerns about commuting, flexibility, and productivity. After listening, the manager adjusts the policy slightly and explains the constraints they’re working under. The final decision isn’t perfect for everyone, but acceptance is much higher because employees felt respected.
Influence grows when people feel understood, not overruled.
3. Influencing Through Credibility and Expertise
Managers who consistently demonstrate competence naturally gain influence. When people trust your judgment, they are more likely to follow your recommendations—even in uncertain situations.
Credibility isn’t about knowing everything; it’s about being prepared, honest, and willing to say “I don’t know” when appropriate.
Example: A marketing manager proposes reallocating budget from paid ads to content marketing. They support their argument with data, previous campaign results, and industry benchmarks. Because the team sees the manager as informed and reliable, the proposal gains quick support—even from initially skeptical stakeholders.
Influence rooted in credibility is quiet but powerful.
4. Influencing by Building Strong Relationships
Influence doesn’t happen in isolation. Managers who invest time in relationships—across teams and hierarchies—find it easier to gain support when it matters.
This includes informal conversations, empathy, and showing genuine interest in others’ priorities. Relationship-based influence is especially important when managing peers or senior stakeholders you don’t formally control.
Example: An operations manager needs engineering support for a time-sensitive project. Instead of escalating immediately, they leverage relationships built over months of collaboration. Because trust already exists, the engineering lead agrees to reprioritize work temporarily.
Influence is often the result of long-term relationship building, not last-minute persuasion.
5. Influencing Through Emotional Intelligence
Emotionally intelligent managers understand that decisions are rarely purely rational. Emotions—fear, pride, uncertainty, motivation—play a major role in how people respond to change.
By recognizing emotional undercurrents, managers can adapt their message and timing for maximum impact.
Example: During a restructuring, a manager notices anxiety spreading through the team. Rather than pushing performance metrics, they focus on reassurance, transparency, and stability. Once emotions settle, the team becomes more receptive to strategic discussions.
Influence increases when managers address emotions before logic.
6. Influencing Through Storytelling
Facts inform, but stories persuade. Managers who can frame ideas as stories—complete with challenges, consequences, and outcomes—create stronger emotional connections.
Storytelling helps people visualize the future and understand their role within it.
Example: A sales manager wants the team to adopt a new CRM workflow. Instead of listing features, they tell a story about a lost deal caused by missing data—and how the new process would have prevented it. The story sticks, and adoption improves.
Good stories turn abstract ideas into relatable experiences.
7. Influencing Without Authority (Lateral Influence)
One of the clearest signs of strong influencing skills is the ability to lead without formal authority. Managers frequently need to influence peers, cross-functional teams, or external partners.
This requires diplomacy, alignment of interests, and mutual benefit.
Example: A project manager needs input from finance, IT, and legal—none of whom report to them. Instead of issuing requests, they frame the project in terms of shared benefits and risks. By aligning goals, they secure cooperation without escalation.
Influence without authority relies on collaboration, not control.
8. Influencing Through Consistency and Integrity
Managers who say one thing and do another quickly lose influence. Consistency between words and actions builds trust, which is the foundation of long-term influence.
Integrity also means making fair decisions—even when they’re unpopular.
Example: A manager consistently enforces performance standards, even for high performers. Over time, the team sees that expectations apply to everyone equally. This fairness strengthens the manager’s credibility and influence.
People follow leaders they trust—even when decisions are difficult.
9. Influencing by Framing Choices, Not Ultimatums
Highly influential managers avoid presenting decisions as rigid commands. Instead, they frame options, trade-offs, and consequences—allowing others to feel involved in the decision.
This technique increases ownership and reduces resistance.
Example: A manager needs overtime coverage. Instead of assigning shifts unilaterally, they present two scheduling options and ask the team to choose. The outcome is the same, but morale is higher because the team had a voice.
Influence increases when people feel agency.
10. Influencing Through Coaching and Development
Managers who invest in developing others gain influence naturally. When people see that you care about their growth, they’re more open to feedback and direction.
Coaching-based influence focuses on asking questions rather than giving answers.
Example: Instead of correcting a mistake directly, a manager asks an employee to reflect on what went wrong and how to improve. The employee feels empowered rather than criticized—and is more likely to accept future guidance.
Influence rooted in development lasts longer than influence rooted in correction.
11. Influencing During Conflict
Conflict is where influencing skills are tested most. Strong managers don’t avoid conflict—they navigate it constructively.
By remaining calm, neutral, and solution-focused, managers can influence outcomes without taking sides prematurely.
Example: Two team members disagree on project ownership. The manager facilitates a discussion focused on goals and responsibilities rather than personalities. By reframing the conflict, they guide the team toward a solution both parties support.
Influence during conflict comes from fairness and clarity.
12. Influencing Through Leading by Example
Perhaps the most underrated influencing skill is modeling the behavior you expect from others. Managers who demonstrate accountability, adaptability, and professionalism influence teams more effectively than those who merely talk about values.
Example: During a stressful product launch, a manager remains calm, meets deadlines, and supports the team hands-on. Their behavior sets the tone, motivating others to rise to the challenge.
Actions influence more powerfully than words.
Why Influencing Skills Matter More Than Ever
Modern managers operate in environments shaped by rapid change, hybrid work, and flatter hierarchies. In such settings, influence is more effective than authority. Teams expect transparency, respect, and collaboration—not top-down control.
Managers who master influencing skills:
Gain faster buy-in
Reduce resistance to change
Improve cross-team collaboration
Build stronger, more engaged teams
Develop future leaders
Influence isn’t manipulation—it’s alignment.
Final Thoughts
The best managers don’t force outcomes; they shape them. Influencing skills allow leaders to guide decisions, inspire action, and build trust without relying on position or power.
Whether it’s listening deeply, telling compelling stories, leading through example, or navigating conflict with empathy, influence is a skill that can be learned, practiced, and refined. And in today’s workplace, it may be the most valuable leadership skill of all.
Color is one of the fastest ways to change how a work setting feels. It can make a space seem quieter or more active, more focused or more social. And because many of us spend long hours at a desk, small visual choices can add up. In this guide, we’ll break down what blue, green, and neutral tones tend to communicate at work, where each one fits best, and how to build a simple palette that looks professional without feeling bland.
What color psychology can (and can’t) do
Color psychology is useful as a practical guide, not a strict rulebook. People often share similar reactions to certain colors, but personal taste, culture, and lighting play a big role. The goal is not to “hack” productivity with a paint chip. The goal is to create a setting that supports your daily tasks and the way your team works.
What it can help with
Color can nudge how a space is read at a glance. It can make a meeting area feel more open, help a private office feel more settled, or bring order to a busy background on video calls. It also helps unify a space so it looks intentional rather than random.
What it can’t guarantee
Color can’t replace good lighting, comfortable seating, or healthy routines. It also can’t override strong personal dislikes. If someone hates cool blues, “blue = focus” won’t matter. Treat color as a support tool, then adjust based on real feedback.
A quick guide to how color is perceived
Warm vs. cool tones
Blues and many greens are usually considered “cool.” They often read as clean and steady. Neutrals can lean warm (cream, tan) or cool (some grays). The warm/cool direction matters because it changes the mood even when the color family stays the same.
Saturation and brightness
Two blues can behave like completely different colors. A dark navy can feel formal and structured. A bright cyan can feel energetic and loud. If you want a calm work backdrop, choose lower saturation and medium-to-dark values. If you want more energy, add a small amount of brighter color as an accent.
Contrast and readability
High contrast can feel sharp and clear. Low contrast can feel soft and quiet but may also feel flat. In work settings, aim for contrast where it improves readability (screens, notes, signage) and keep the rest balanced.
Blue at work: focus, trust, and clear thinking
Blue is a strong choice for work because it often reads as stable and straightforward. Many people connect blue with reliability, structure, and calm. That makes it a common pick for offices, studios, and home work zones where focus matters.
Where blue tends to work best
Deep-focus tasks like writing, analysis, planning, and coding
Areas where you want a “clean” visual signal: a tidy background for video calls
Client-facing spaces where you want a confident, professional tone
Shared work areas that need to feel steady rather than overly playful
When blue can feel too cool
In some rooms, especially those with cool lighting, blue can feel distant. If the space already has a lot of gray, steel, or glass, adding more cool blue may push it into a sterile look. The fix is simple: soften with warm neutrals (off-white, beige), natural textures (wood, linen), or a muted green.
Blue pairings that stay professional
For a classic look, pair navy or slate blue with warm white and a small amount of black. For a lighter feel, pair soft blue-gray with cream and light wood. If you want a creative edge without chaos, add one art piece with a controlled mix of blue plus a small accent color.
Green at work: steady energy and mental reset
Green is often linked to balance, rest for the eyes, and a sense of “freshness.” In work settings, it can support long sessions where you want to stay alert without feeling tense. Green also connects well with natural materials, which helps a workspace feel more human.
Where green tends to work best
Spaces for long work blocks, especially when you want a calmer pace
Creative work where you want openness without visual noise
Meeting areas where you want a friendly tone
Spaces that feel dry or overly technical and need a softer touch
When green can feel flat
A mid-tone green used everywhere can lose definition, especially under dim lighting. Add contrast with neutrals: cream, charcoal, or crisp white. Or choose a green with a clear direction—either a deeper forest green for a grounded mood or a lighter sage for a softer look.
Green pairings that keep the look clean
Try sage with warm white and tan. Try deep green with cream and black details. If you like a more structured look, pair green with a cool gray, then add one warm element (a wood desk, a warm lamp) so the space doesn’t feel icy.
Neutrals at work: clarity without distraction
Neutrals are the backbone of most work interiors for a reason: they reduce visual clutter and make it easier to focus. The key is choosing neutrals that match your lighting and your preferred mood.
Neutral families to know
White and off-white: bright, clean, and flexible for backgrounds
Cream and beige: warmer and softer, good for comfort
Gray: structured and modern, but can feel cold if overused
Charcoal and black: strong contrast, best in smaller doses
Avoiding “too much gray”
All-gray rooms can feel heavy or dull. If your walls and furniture are already gray, bring in warmth with cream accents, wood tones, or art that includes blue-green hues. Even small changes can help a room feel more balanced.
How to build a blue–green–neutral palette
A reliable palette has three roles: a main color, a support color, and a background. For work settings, let neutrals do most of the background work, then use blue and green to guide the mood.
A simple palette method
Start with a neutral base. Then choose one “leader” color (blue or green) and one “support” color (the other). Keep the leader color stronger, and use the support color in smaller parts. This keeps the space calm and organized.
Ratio rule that’s easy to follow
Use a neutral base for most of what you see, then add your leader color, then add the support color. If you want an accent, keep it small and purposeful. Too many accents can make a workspace feel busy.
Use wall art to tie it together
Wall art is a practical way to pull colors into a room without repainting. If you want blue for focus but your furniture is warm, choose prints that include blue plus warm neutrals. If you want green to soften a space, choose pieces that mix green with cream, tan, or light gray. A curated set of Abstract Art Prints Collection for Office Walls can make this easy because abstract pieces often blend multiple tones in a controlled way.
Practical ways to apply these colors without repainting
Use canvas prints and wall art as the quickest color shift
If you don’t want to change paint, art is your best lever. One large piece can set the mood, or a small group can add structure. Blue-led art often works well behind a desk because it reads calm on camera. Green-led art can soften sharp lines and add a more relaxed feel. Neutrals help the whole setup look consistent.
If your goal is a professional workspace look that still feels personal, browse the Office Wall Art Collection – Canvas Prints for Workspaces and pick a color direction first, then choose a style that fits your work.
Try smaller changes that support the palette
Once your wall art sets the direction, match small elements to it. A desk mat, notebook covers, lamp shade, or storage boxes can echo the leader color without taking over the room. Lighting matters too: warm bulbs make blues feel softer and neutrals feel more inviting; cool bulbs make whites and grays feel sharper.
Digital background and video-call framing
Your background is part of your professional image. A controlled mix of blue, green, and neutrals helps you look consistent on camera. Place your main art piece where it frames you without crowding your head, and avoid high-contrast patterns directly behind your face.
Common mistakes to avoid
Using too many strong colors: Pick one main direction and stick with it.
Ignoring lighting: The same print can look different under warm vs. cool bulbs.
Choosing brightness over comfort: Very bright blues or greens can feel loud over long hours.
Overdoing gray: Add warm neutrals or natural materials to keep the room from feeling cold.
Copying a trend that doesn’t fit your work: Your daily tasks should guide the mood.
FAQ: Blue, green, and neutrals in work settings
Is blue always better for productivity?
Blue often supports focus, but “better” depends on your tasks and lighting. For some people, softer greens are easier for long sessions. Use the color that helps you feel steady, not the one that sounds most “correct.”
Is green better for creative work?
Green can feel open and relaxed, which can help idea work. But creative teams often do best with a stable base (neutrals) plus one guiding color so the space stays organized.
Are neutrals boring?
Not if you use them well. Neutrals create a clean foundation, then blue or green adds direction. Texture also matters: wood, textiles, and paper surfaces keep neutrals from feeling flat.
How do I choose warm vs. cool neutrals?
Look at your lighting and your main furniture. If you have warm wood and warm lighting, warm off-whites and beige often fit better. If you have cool light and metal details, cooler whites and grays can look more consistent.
What if team members react differently to color?
Use a neutral foundation and keep strong color to controlled zones: art, small accents, or one feature area. This keeps the room comfortable for more people.
Closing: a simple plan you can use today
If you want a clear, professional workspace that supports real work, start with neutrals, choose blue for focus or green for long-session comfort, then let wall art pull the palette together. Keep contrast where it helps clarity, and keep strong color under control so the space stays calm. Once your palette is set, small desk and lighting changes will follow naturally.
A brand refresh is not only a new logo, a new deck, or a new website. It is a shift in how you want clients and teammates to read you the moment they step into the space. Your office walls sit in that first glance. They can say “focused and confident,” “human and welcoming,” or “ready for what’s next”—without a single word from your team.
That is why office wall art is one of the fastest ways to communicate change. It is visible in the entry view, it stays in the background of meetings, and it becomes part of the daily routine. If you want your refresh to feel real, start with the surfaces people look at every day.
If you are planning a full update, start by saving a shortlist of pieces that match the new direction, then build one hero wall before you expand to other rooms.
Define the change before you choose office wall decor
Art works best when it supports a clear message. Before you pick a canvas print or an art print, write down what has changed in your business. Maybe you moved from service work to product work, introduced a new offer, changed leadership, or shifted the tone of your brand voice. The goal is to turn that change into a short set of visual cues you can repeat across the office.
Write your “brand cue” list
Choose three to five cues that describe how you want the space to feel. Keep them plain and actionable. Then match each cue to a visual direction: color range, subject matter, and layout.
Calm focus: open space, natural scenes, soft gradients
Craft and detail: close-up textures, pattern, careful repetition
Why office artwork signals change so well
People notice what repeats. When the same visual language shows up in the reception wall, the meeting room, and the hallway, it reads as intentional. Office artwork also helps reduce mixed messages. If the new brand voice is clean and direct, a crowded wall filled with unrelated pieces will work against it. A planned wall tells the viewer, “We made a decision and we stand behind it.”
Three signals that feel immediate
First, color. A new palette is easy to read, even from a distance. Second, subject. Business themes, calm landscapes, or abstract forms each set a different tone. Third, scale. A larger hero piece says you are confident about the new direction.
Step-by-step: choose office wall art that fits the new brand
You do not need dozens of pieces to make the refresh visible. A small number of well-chosen prints can carry the message, especially when you plan the wall as one system.
Step 1: choose one main theme
Pick a theme you can repeat across the office. For a strategy-led refresh, business imagery can work well; for a culture-led refresh, abstract or nature themes can soften the room and support focus. If your brand story is about progress and clarity, explore the Business Concept Wall Art Collection for clean, goal-forward visuals.
Step 2: pick a style lane and stay consistent
Consistency is what makes a wall feel planned. Decide if you want photography, graphic forms, or abstract work, then stay close to that lane. If you want a flexible mix that still looks unified, a set of abstract art prints can help create structure across different rooms. Start with the Abstract Art Print Collection and save a short shortlist.
Step 3: match the palette to your brand colors
Use your brand colors as a guide, not a rule. You can match exactly, or you can echo them through a similar temperature. A brand that uses deep blues can pair well with cool neutrals; a warm brand can use clay, sand, and soft reds. Keep one repeating color visible across most walls, even if each room has a different hero piece.
Step 4: choose sizes for office walls and sightlines
People view office walls from farther away than they view small home nooks. That means your pieces need enough scale to read from the doorway and from the table. If your walls are large, consider one main canvas as the anchor and smaller supporting pieces nearby.
Step 5: decide on one hero piece or a set
A hero piece is a single strong print that becomes the room’s focal point. A set is better when you want rhythm and repeat. Multi-panel layouts also work well in long corridors and wide meeting walls because they create a clean path for the eye.
Placement plan for offices and home offices
Placement is strategy. Put the strongest message where the most people will see it, then support it with quieter pieces nearby.
Reception wall: the first impression
Choose one clear statement piece that matches your new brand language. If your refresh is about confidence and direction, keep the layout clean and the scale generous. Avoid clutter around the frame so the message reads quickly.
Conference room: shared focus
Meeting rooms work best with art that supports attention. Abstract work, calm landscapes, and simple compositions keep the room from feeling noisy. If you want a natural direction that still looks professional, browse the Nature Wall Art Collection and select pieces with open space and balanced tones.
Hallway and entry: guide the walk-through
A hallway is a perfect place for a short series. Use two or three pieces that share the same size and frame style. Keep equal spacing so the wall feels planned rather than improvised.
Home office: stay on-message on camera
If your team works hybrid, your wall becomes your video background. Choose one piece that reflects your new direction and sits at eye level behind you. Keep the wall calm so the art reads as intentional, not distracting.
Format and sizing basics for office canvas prints
Canvas prints and paper art prints each bring a different feel. Canvas offers texture and depth and can be displayed without extra framing. Art prints are a strong pick when you want a crisp finish or a gallery-style wall with matched frames.
Simple measuring rules you can follow
Measure the wall width, then aim for art that fills about two-thirds of that span.
Hang the center of the main piece near eye level when standing in the room.
For sets, keep spacing consistent—small gaps read cleaner than large gaps.
When placing art above furniture, leave a comfortable gap so the wall and furniture look connected.
Material and build notes
Artesty canvas prints are printed on natural canvas with quality ink, then hand-stretched on wood panels that are about 1.5 inches (3 cm) thick, and packaged for shipment. Orders are typically shipped within 1–3 business days. These details help you plan timing for a move-in, a launch week, or a refreshed client visit schedule.
Theme ideas that match common brand refresh goals
Most refresh projects fall into a few clear categories. Choose the category that matches your message, then select art that repeats the same cue across multiple walls.
Calm focus for busy teams
Choose open landscapes, soft color transitions, and quiet compositions. These pieces work well behind desks and in meeting rooms, helping the space feel steady during busy cycles.
Clear goals for growth and momentum
Go for structured shapes, clean lines, and purposeful imagery. This approach fits teams that want the office to feel disciplined and directed.
New energy for creative work
Pick bolder forms and sharper contrast, then keep the palette aligned so the rooms still feel connected. Use one strong piece in the reception area, then repeat smaller pieces in work zones.
Before you buy: a quick office wall art checklist
Audience: Is the wall for clients, new hires, or the core team?
Message: Can you describe the wall’s message in one sentence?
Scale: Will the art read from the doorway and from the table?
Palette: Does at least one color repeat across most rooms?
Layout: Are you choosing one hero piece, or a planned set?
Timing: Do you need the pieces before a launch, an event, or a big client week?
Common mistakes that make a refresh feel unfinished
Mixing too many messages. If every wall tells a different story, the refresh reads as confusion. Choose one direction, then repeat it.
Going too small. Small prints can disappear on large office walls. Use scale where it matters, then support with smaller pieces nearby.
Skipping a wall plan. Buying art without a simple layout sketch often leads to uneven spacing and mismatched sizes. A quick plan saves time.
Wrap-up: make the change visible
A brand refresh becomes real when people can see it and feel it. Office wall art helps you express the new direction in a way that is steady, consistent, and easy to maintain. Start with one hero wall, set the visual rules, then expand room by room. When you are ready to select the pieces that match your new message, return to the Office Wall Art Collection and build a short shortlist.
Okoro, B. O., & Ekejiuba, A. O. D. (2026). Innovative Work Behaviour of Secretaries in Tertiary Institutions: Implications for Administrative Efficiency. International Journal of Research, 13(1), 467–483. https://doi.org/10.26643/ijr/2026/20
Dr. Bernard Olu Okoro
Oluyesucan@gmail.com
Department of Office Technology and Management
Imo State Polytechnic, Omuma
Imo State, Nigeria
2 Mr. Amos O. Dike Ekejiuba
Department of Office Technology and Management
Imo State Polytechnic, Omuma,
Imo State, Nigeria
Abstract
This study examined the relationship between secretaries’ innovative work behaviour (IWB) and administrative efficiency in tertiary institutions in Delta State, Nigeria. The objectives were to assess the levels of idea generation, idea promotion, and idea implementation among secretaries and to determine the predictive effect of these dimensions on administrative efficiency, measured through timeliness, accuracy, and coordination of tasks. A descriptive survey design was adopted, and data were collected from 285 secretaries using a structured questionnaire. Reliability of the instrument was confirmed with Cronbach’s alpha values of 0.87 for IWB and 0.89 for administrative efficiency. Descriptive statistics (mean and standard deviation) summarized the data, while multiple regression analysis examined the relationships among variables. Results revealed that secretaries demonstrated moderately high engagement in all IWB dimensions, with idea implementation being the strongest predictor of administrative efficiency (β = 0.30, p < 0.001). Idea generation (β = 0.28, p < 0.01) and idea promotion (β = 0.22, p < 0.01) also significantly influenced efficiency. The study concludes that secretaries’ innovative behaviours play a critical role in enhancing administrative performance. It recommends that tertiary institutions create supportive mechanisms, including training programs and formal channels for idea generation, promotion, and implementation, to optimize administrative outcomes. These findings contribute to the understanding of innovation-driven efficiency in administrative contexts and offer practical insights for higher education management in emerging economies.
Keywords: Innovative work behavior, secretaries, administrative efficiency, tertiary institutions
Introduction
In the contemporary knowledge-driven workplace, employees’ ability to innovate has become a vital source of organizational competitiveness, adaptability, and efficiency. Organizations are increasingly recognizing that innovation is not limited to product or technological breakthroughs but also includes individual-level behaviors that introduce new ideas, methods, or processes to improve performance (Afsar & Umrani, 2020; Prieto & Pérez-Santana, 2021). Within this context, innovative work behaviour (IWB)—defined as the intentional generation, promotion, and implementation of new and useful ideas within a work role or organization—has become a focal construct in organizational and behavioural research (De Jong & Den Hartog, 2010; Janssen, 2000).
Although much of the existing literature on IWB focuses on managerial or technical employees, the contribution of secretaries and administrative professionals to organizational innovation remains underexplored (Onwuchekwa & Ugochukwu, 2023). Secretaries in tertiary institutions play a strategic role in information processing, records management, communication, and coordination between academic and administrative departments. Their closeness to operational processes positions them as potential drivers of incremental innovation—the kind that enhances administrative systems, improves timeliness, and minimizes resource wastage (Adegbola, 2022; Mensah & Darko, 2021).
The concept of administrative efficiency refers to the extent to which administrative processes achieve institutional goals effectively, accurately, and promptly with minimal cost and effort (Drucker, 1999; Ogunyemi & Oni, 2021). In tertiary institutions, administrative efficiency is critical for ensuring smooth operations in teaching, research, and student services. It encompasses dimensions such as timeliness of task execution, accuracy and quality of work output, andeffective communication and coordination across departments (Eze & Okoli, 2022; Bello & Yusuf, 2023). When administrative functions are efficient, institutions can respond swiftly to internal and external demands, enhance accountability, and support academic excellence.
Recent empirical studies indicate that innovative work behaviour among administrative personnel is strongly linked to improvements in operational efficiency and service quality (Afsar, Masood, & Umrani, 2019; Okechukwu & Nwachukwu, 2024). Employees who actively generate ideas tend to identify new ways to streamline tasks; those who promote ideas influence acceptance and adoption of improved practices; and those who implement ideas drive tangible changes that enhance output quality and reduce delays (Scott & Bruce, 1994; De Spiegelaere et al., 2018). This process-oriented perspective positions IWB as a mechanism through which individual initiative translates into measurable organizational outcomes.
However, in many developing contexts such as Nigeria, institutional bureaucracy, limited technological infrastructure, and insufficient managerial support often hinder the translation of secretaries’ innovative behaviours into administrative gains (Onah & Eze, 2022; Asogwa, 2023). Despite increased emphasis on digital transformation and quality assurance in higher education, secretaries’ innovative potential is often underutilized due to hierarchical decision structures and inadequate empowerment (Okafor & Nwosu, 2021). This creates a research gap concerning how IWB among secretaries can be harnessed to improve administrative efficiency in tertiary institutions.
Consequently, this study investigates the innovative work behaviour of secretaries in tertiary institutionsand its implications for administrative efficiency in Imo State, Nigeria. It focuses on three key dimensions of IWB—idea generation, idea promotion, and idea implementation—and examines how they influence the core indicators of administrative efficiency, namely timeliness of task execution, accuracy and quality of output, and effective communication and coordination. By exploring these relationships, the study contributes to both theoretical and practical understanding of how non-academic staff can enhance institutional productivity through innovative engagement, thereby filling a critical gap in the literature on innovation and administrative performance in emerging economies.
Statement of the Problem
In contemporary higher education systems, administrative efficiency has become an indispensable element for institutional effectiveness, quality assurance, and sustainable performance. Tertiary institutions depend heavily on their secretarial and administrative workforce for timely documentation, communication, and coordination of academic and managerial activities. However, the efficiency of these processes increasingly relies on employees’ capacity to display innovative work behaviour (IWB)—that is, the ability to generate, promote, and implement novel ideas that improve work procedures and outcomes (De Jong & Den Hartog, 2010; Srirahayu, Sridadi, & Ekowati, 2023).
Despite global recognition of innovation as a driver of efficiency, evidence from developing contexts such as Nigeria remains scarceregarding how the innovative behaviour of secretaries contributes to administrative performance in tertiary institutions. Studies in public organisations suggest that innovative work behaviour enhances productivity and service delivery (Hashim, 2021; Abun, Macaspac, Valdez, & Julian, 2023), yet most of these investigations are concentrated in manufacturing, banking, or managerial occupations. Secretaries—who serve as critical links between management, academic units, and administrative structures—remain largely absent in innovation discourse within higher education (Ismail, Begum, & Kassim, 2023).
Empirical evidence also indicates that administrative systems in Nigerian tertiary institutions are often characterised by bureaucratic rigidity, limited technological adaptation, and weak motivation for creativity (Barkov, Markeeva, & Gavrilenko, 2024; Onah & Eze, 2022). Consequently, secretaries tend to follow established routines rather than develop and implement new methods that could enhance timeliness, accuracy, and coordination in administrative processes (Alvarez-Sández et al., 2023). The persistence of manual documentation, duplication of effort, and communication delays reduces institutional responsiveness and service quality.
Moreover, while global literature identifies idea generation, idea promotion, and idea implementation as the core dimensions of IWB (Scott & Bruce, 1994; Afsar & Umrani, 2020), little is known about how these behaviours manifest among secretaries in Nigerian tertiary institutions or the extent to which they translate into measurable administrative efficiency outcomes such as timely execution of duties, accurate record management, and effective interdepartmental coordination.
Therefore, a critical knowledge gap exists concerning the extent to which secretaries’ innovative work behaviours influence the administrative efficiency of tertiary institutions in Imo State. Addressing this gap is essential for developing evidence-based human-resource and innovation policies that can improve the performance of administrative systems and, by extension, the overall effectiveness of higher-education governance.
Research Objectives
The main objective of this study is to examine the relationship between innovative work behaviour and administrative efficiency of secretaries in tertiary institutions in Imo State. Specifically, the study seeks to:
Determine the extent to which secretaries’ idea generation influences administrative efficiency in tertiary institutions in Imo State.
Assess the effect of idea promotion by secretaries on the timeliness and accuracy of administrative tasks in tertiary institutions.
Examine how idea implementation among secretaries contributes to effective coordination and overall administrative efficiency in tertiary institutions.
Research Questions
The study will be guided by the following research questions:
To what extent does idea generation among secretaries influence administrative efficiency in tertiary institutions in Imo State?
How does idea promotion by secretaries affect the timeliness and accuracy of administrative activities in tertiary institutions?
In what ways does idea implementation among secretaries enhance coordination and administrative efficiency in tertiary institutions?
Research Hypotheses
H0₁: Secretaries’ idea generation has a significant effect on administrative efficiency in tertiary institutions in Imo State.
H0₂: Idea promotion by secretaries significantly influences the timeliness and accuracy of administrative operations.
H0₃: Idea implementation among secretaries significantly enhances coordination and overall administrative efficiency in tertiary institutions.
Literature Review
Innovative Work Behaviour
Innovative Work Behaviour (IWB) represents the intentional efforts of employees to generate, promote, and implement novel ideas, procedures, or solutions that enhance individual and organizational outcomes (De Jong & Den Hartog, 2010; Janssen, 2000). It is a behavioural construct that captures the process through which creativity is transformed into practical improvement in the workplace. De Jong and Den Hartog (2010) identified three interrelated stages—idea generation, idea promotion, andidea implementation—which together describe the full innovation process at the individual level. Contemporary scholarship highlights that IWB is shaped by individual attributes such as creative self-efficacy and proactivity, as well as contextual factors such as leadership support, autonomy, and innovation-oriented climates (Bos-Nehles, Renkema, & Janssen, 2017; Ismail, Begum, & Kassim, 2023).
Recent systematic reviews reveal that IWB enhances not only creativity but also organizational adaptability, service quality, and productivity across both private and public organizations (Srirahayu, Sridadi, & Ekowati, 2023; Hj Musneh, Ambad, & Roslin, 2021). Theoretical explanations often draw from the Componential Theory of Creativity—which links motivation, expertise, and creative thinking to innovation—and Social Exchange Theory, which posits that supportive and fair environments motivate employees to reciprocate through discretionary innovative acts (Janssen, 2000; Bos-Nehles et al., 2017). Within tertiary institutions, secretaries occupy strategic administrative roles that demand adaptability and creative problem-solving, making IWB an essential behaviour for improving office operations and administrative processes.
Administrative Efficiency
Administrative efficiency refers to the degree to which administrative systems convert available resources—time, labour, and information—into accurate, timely, and well-coordinated outputs with minimal waste (Beerkens, 2022; Alvarez-Sández, Velázquez-Victorica, Mungaray-Moctezuma, & López-Guerrero, 2023). It reflects not only speed and cost-effectiveness but also the quality, reliability, and coordination of administrative activities. In higher education, administrative efficiency supports institutional effectiveness by ensuring that documentation, communication, and service delivery occur seamlessly across departments.
Scholars generally conceptualize administrative efficiency around three measurable indicators: timeliness, accuracy (or quality), and coordination (Alvarez-Sández et al., 2023). Efficiency can be measured through process indicators—such as turnaround time, error rates, and stakeholder satisfaction—or via frontier methods such as Data Envelopment Analysis (DEA) for benchmarking institutional performance (Wildani, Wibowo, Wulandari, & Dinanti, 2023; Salas-Velasco, 2024). Determinants of administrative efficiency include effective governance, performance management, digital transformation, and optimal administrative intensity (Tran, 2023; Frontiers in Education, 2024). As secretaries are directly responsible for communication, scheduling, and information management, their ability to operate efficiently is a critical determinant of overall institutional performance.
Linking Innovative Work Behaviour to Administrative Efficiency
The intersection between IWB and administrative efficiency lies in the capacity of innovative behaviours to transform administrative processes. When secretaries engage in idea generation, they identify creative ways to handle records, manage digital tools, or streamline document workflows—improving timeliness in service delivery. Through idea promotion, they advocate for new procedures or technologies that enhance accuracy, such as adopting digital documentation or automated scheduling systems. Finally, during idea implementation, secretaries apply and integrate these innovations into daily routines, thereby improvingcoordinationacross departments.
Empirical studies support this connection. Hj Musneh et al. (2021) found that IWB positively influences operational performance in service organizations, while Ismail et al. (2023) showed that knowledge sharing and empowerment predict IWB that leads to improved process outcomes in higher-education institutions. Similarly, Alvarez-Sández et al. (2023) emphasize that micro-level innovation within administrative units—such as the adoption of new process designs—significantly enhances administrative efficiency. Therefore, IWB can be viewed as both a behavioural input and a mechanism through which employees, particularly secretaries, drive efficiency and service excellence in tertiary institutions.
In the nutshell, innovative work behaviour provides the behavioural foundation for achieving administrative efficiency. Secretaries who consistently generate, promote, and implement novel administrative solutions contribute to timely, accurate, and coordinated service delivery, thus strengthening institutional effectiveness. This conceptual linkage underscores the relevance of studying IWB as a predictor of administrative efficiency in tertiary institutions in Imo State.
Methodology
This study employed a descriptive survey design to investigate the relationship between secretaries’ innovative work behaviour and administrative efficiency in tertiary institutions in Imo State. The design was appropriate because it allowed for systematic collection of data on respondents’ behaviours and perceptions in their natural work environment, particularly regarding the three dimensions of innovative work behaviour—idea generation, idea promotion, and idea implementation—and their effect on administrative efficiency, measured through timeliness, accuracy, and coordination.
The population comprised all secretaries in public tertiary institutions in Imo State, totaling approximately 1,250 individuals. A stratified random sampling approach was used to ensure proportional representation across universities, polytechnics, and colleges of education, resulting in a sample size of 300 respondents, determined using Taro Yamane’s formula for finite populations.
Data were collected using a structured questionnaire adapted from validated instruments in the literature. Innovative work behaviour items were based on De Jong and Den Hartog (2010) and Janssen (2000), while administrative efficiency items were derived from Alvarez-Sández et al. (2023). The questionnaire was piloted among 30 secretaries outside the sampled institutions, yielding Cronbach’s alpha values of 0.87 for IWB and 0.89 for administrative efficiency, indicating high reliability.
Ethical approval was obtained, and respondents were informed of the study’s purpose, voluntary participation, and confidentiality of their responses. Data collection was carried out both in person and electronically over three weeks.
Data were analyzed using SPSS Version 28. Descriptive statistics, including means and standard deviations, summarized responses, while multiple regression analysis examined the predictive relationship between IWB dimensions and administrative efficiency. Assumptions of regression were checked and met.
Results
This section presents the analysis of data collected from secretaries in tertiary institutions in Imo State, focusing on the relationship between innovative work behaviour (IWB) and administrative efficiency. Data were analyzed using SPSS Version 28, with descriptive statistics (mean and standard deviation) summarizing responses, followed by multiple regression to examine predictive relationships.
Innovative Work Behaviour –
Table1. Descriptive Statistics for Idea Generation
S/N
Item
N
Mean
SD
1
Propose new ways to handle routine tasks
285
4.15
0.60
2
Identify opportunities to improve processes
285
4.08
0.59
3
Develop creative solutions to recurring problems
285
4.12
0.61
4
Think of innovative methods to improve workflow
285
4.09
0.58
5
Suggest new ideas for administrative procedures
285
4.14
0.57
Overall Mean
285
4.12
0.59
Table 4.1 presents the descriptive statistics for the five items measuring idea generation. Respondents reported high engagement across all items, with means ranging from 4.08 to 4.15 and an overall mean of 4.12 (SD = 0.59). This indicates that secretaries frequently develop new approaches to routine administrative tasks, actively seek opportunities for improvement, and suggest innovative solutions to recurring problems. The results confirm that idea generation is a key aspect of secretaries’ innovative behaviour in tertiary institutions.
Table 2. Descriptive Statistics for Idea Promotion
S/N
Item
N
Mean
SD
1
Share ideas with colleagues and supervisors
285
4.05
0.60
2
Advocate for new office procedures
285
4.03
0.62
3
Encourage team members to implement ideas
285
4.07
0.59
4
Persuade others to consider suggestions
285
4.02
0.61
5
Communicate ideas effectively to gain support
285
4.06
0.61
Overall Mean
285
4.05
0.61
For idea promotion, the five items also recorded high mean scores, ranging from 4.02 to 4.07, with an overall mean of 4.05 (SD = 0.61). These results suggest that secretaries actively communicate, advocate, and encourage colleagues to adopt new ideas, reflecting strong interpersonal engagement in promoting innovation. The findings indicate that secretaries not only generate ideas but also actively promote them, which is essential for translating creativity into actionable office improvements.
Table 3. Descriptive Statistics for Idea Implementation
S/N
Item
N
Mean
SD
1
Apply new ideas in daily tasks
285
4.00
0.62
2
Ensure suggestions are put into practice
285
4.02
0.63
3
Implement innovative procedures
285
4.05
0.61
4
Integrate new ideas into office processes
285
3.98
0.64
5
Follow through to ensure effectiveness
285
4.04
0.61
Overall Mean
285
4.01
0.62
The descriptive statistics for idea implementation show an overall mean of 4.01 (SD = 0.62), with individual item means ranging from 3.98 to 4.05. This confirms that secretaries often translate ideas into practical actions that improve workflow and office processes. Idea implementation scores demonstrate that secretaries actively convert innovative concepts into practical improvements, making this dimension a strong contributor to administrative efficiency.
Administrative Efficiency –
Table 4. Descriptive Statistics for Timeliness
S/N
Item
N
Mean
SD
1
Complete tasks within scheduled timelines
285
4.12
0.60
2
Respond promptly to requests
285
4.09
0.61
3
Submit reports on time
285
4.11
0.59
4
Prioritize tasks effectively
285
4.08
0.60
5
Manage time efficiently
285
4.10
0.59
Overall Mean
285
4.10
0.59
The five items measuring timeliness revealed an overall mean of 4.10 (SD = 0.59). Respondents reported consistently completing tasks within scheduled timelines and responding promptly to requests, indicating effective time management.
Table 5. Descriptive Statistics for Accuracy
S/N
Item
N
Mean
SD
1
Ensure records and documents are accurate
285
4.06
0.57
2
Check work carefully to minimize errors
285
4.07
0.56
3
Verify information before processing tasks
285
4.04
0.56
4
Maintain high standards in documentation
285
4.05
0.55
5
Correct mistakes promptly
285
4.03
0.58
Overall Mean
285
4.05
0.56
Accuracy scores ranged from 4.03 to 4.07, with an overall mean of 4.05 (SD = 0.56). Secretaries consistently maintained precision in records, documentation, and reporting.
Table 6. Descriptive Statistics for Coordination
S/N
Item
N
Mean
SD
1
Collaborate effectively with colleagues
285
4.08
0.58
2
Ensure smooth communication across departments
285
4.10
0.59
3
Coordinate activities to avoid duplication
285
4.09
0.57
4
Seek input from others to improve processes
285
4.07
0.59
5
Facilitate teamwork to achieve objectives
285
4.11
0.58
Overall Mean
285
4.09
0.58
Coordination items recorded an overall mean of 4.09 (SD = 0.58), indicating that secretaries effectively collaborate, communicate, and coordinate activities across departments.
Predictive Relationship: Regression Analysis
Table 7. Multiple Regression Analysis
Predictor
B
SE B
β
t
p
Idea Generation
0.34
0.09
0.28
3.78
<0.01
Idea Promotion
0.27
0.08
0.22
3.38
<0.01
Idea Implementation
0.38
0.08
0.30
4.75
<0.001
R²
0.34
F
48.62
<0.001
To examine the effect of IWB dimensions on administrative efficiency, a multiple regressionanalysis was conducted. The model was statistically significant (F(3, 281) = 48.62, p < 0.001), explaining 34% of the variance in administrative efficiency (R² = 0.34). The regression results indicate that all three IWB dimensions significantly predict administrative efficiency. Idea generation (β = 0.28) and idea promotion (β = 0.22) positively influence efficiency by fostering timely, accurate, and coordinated task performance. Idea implementation (β = 0.30) has the strongest effect, confirming that the practical application of ideas is the most critical factor in enhancing administrative processes. These results affirm the study’s hypothesis that secretaries’ innovative work behaviours significantly improve administrative efficiency.
Discussion of Results
The findings of this study indicate that secretaries in tertiary institutions in Imo State demonstrate moderately high levels of all three dimensions of innovative work behaviour (IWB) — idea generation, idea promotion, and idea implementation — and that these dimensions jointly explain a significant portion of the variance in administrative efficiency (R² = 0.34). This supports the theoretical proposition that innovation at the individual level contributes meaningfully to process and performance outcomes within administrative systems.
First, the positive and significant effect of idea generation (β = 0.28, p < 0.01) on administrative efficiency substantiates the notion that the generation of novel ideas is a necessary precursor to improved performance. This aligns with literature showing that employee innovation behaviours such as seeking new methods, tackling recurring problems and thinking creatively are critical in public sector and knowledge‑driven organisations (Srirahayu, Sridadi, & Ekowati, 2023). In the context of secretarial work, the ability to identify and propose new administrative workflows likely reduces delays and supports timely task completion, which is reflected in the higher means for timeliness and coordination noted in this study.
Second, the significant influence of idea promotion (β = 0.22, p < 0.01) indicates that the advocacy, persuasion, and communication of ideas are instrumental in converting creative concepts into actionable process behaviours. The literature corroborates that championing new ideas and engaging others are key enablers of innovation in organisational settings (Hashim, 2021). In practical terms for secretaries, promoting new procedures likely enhances departmental buy‑in, which in turn supports smoother cross‑departmental coordination and fewer re‑works—thus contributing to greater administrative efficiency.
Third—and perhaps most strongly—the effect of idea implementation (β = 0.30, p < 0.001) on administrative efficiency underscores that the mere generation and promotion of ideas are not sufficient; it is the actual execution and institutionalisation of innovation that delivers the greatest efficiency outcomes. This finding is consistent with research showing that implementation is the phase where innovation behaviour translates into tangible performance benefits (Ismail, Begum, & Kassim, 2023). For secretaries, the implementation of new document workflows, digital scheduling systems or automated routing likely improves the accuracy of outputs and the speed of inter‑unit communication, as reflected in the high mean scores for accuracy (4.05) and coordination (4.09).
These results have several implications. They validate the process‑oriented model of IWB (idea generation → promotion → implementation) within the administrative secretarial context, reinforcing its applicability beyond technical or managerial roles. Moreover, they suggest that tertiary institutions seeking to enhance administrative efficiency should focus not only on encouraging new ideas but also on fostering channels for promotion and, crucially, mechanisms for implementation. In other words, institutional policies that support idea uptake (e.g., suggestion systems), allocate resources for pilot applications, and monitor follow‑through will likely yield stronger efficiency gains.
Additionally, the 34% variance explained suggests that while IWB is important, there remain other factors influencing administrative efficiency—such as technology infrastructure, institutional climate, staff training and resource allocation. For example, studies in Nigerian tertiary institutions emphasize that digital tools, automation and workflow redesign significantly enhance administrative performance (Nwafor Orizu et al., 2024). Hence, secretaries’ innovative behaviours must be complemented by enabling conditions.
In conclusion, the study confirms that secretaries’ innovative work behaviours are a significant driver of administrative efficiency in tertiary institutions, with idea implementation being the most potent predictor. These findings widen the literature on innovation behaviour to include administrative support staff and highlight actionable levers for institutional improvement in emerging‑economy educational settings.
Conclusions
The study examined the relationship between secretaries’ innovative work behaviour and administrative efficiency in tertiary institutions in Imo State. The results revealed that secretaries engage in high levels of idea generation, idea promotion, and idea implementation, with idea implementation being the most influential in enhancing administrative efficiency. The findings demonstrate that secretaries’ innovative behaviours significantly contribute to timeliness, accuracy, and coordination of administrative tasks.
It can be concluded that fostering innovative work behaviour among secretaries is a critical determinant of administrative efficiency. Generating ideas alone is insufficient; promoting and, most importantly, implementing those ideas drives measurable improvements in administrative processes. Furthermore, while innovative work behaviour explains a substantial portion of administrative efficiency, other factors such as technological infrastructure, workflow systems, and organizational support also play important roles. Overall, the study confirms that secretaries are pivotal in sustaining effective administrative operations when empowered to innovate.
Recommendations
Based on the findings and conclusions, the following recommendations are made:
Institutionalize idea generation and sharing mechanisms: Tertiary institutions should establish formal channels, such as suggestion boxes, brainstorming sessions, and feedback platforms, to encourage secretaries to generate and share innovative ideas.
Provide targeted training programs: Training in creative thinking, problem-solving, and project implementation should be provided to enhance secretaries’ capacity to turn ideas into actionable outcomes.
Facilitate idea implementation: Management should provide the necessary resources, streamlined approval processes, and institutional support to ensure that innovative ideas are effectively implemented.
Recognize and reward innovation: A system of recognition or incentives for secretaries who successfully implement innovative solutions can motivate sustained innovative behaviour.
Leverage technology to support innovation: Institutions should adopt digital tools and workflow management systems to complement secretaries’ innovative efforts, enhancing efficiency in documentation, communication, and coordination.
Acknowledgements
The authors wish to express their profound gratitude to all individuals and institutions that contributed to the successful completion of this study. First, I acknowledge the support and guidance of Dr. C. A. Ejeka, whose expertise and constructive feedback were invaluable in shaping the research.
The authors are deeply grateful to the management and staff of the tertiary institutions in Imo State who granted permission for data collection and participated in the study. Their cooperation and willingness to provide information were critical to the success of this research.
The author also acknowledges the use of Artificial Intelligence (AI) tools, specifically ChatGPT (GPT-5 Mini, OpenAI), in supporting the development of the manuscript. The AI tool was used to assist with tasks such as structuring chapters, refining language, formatting tables, and generating prose content. All ideas, interpretations, analyses, and conclusions presented in this study remain the sole responsibility of the author. The use of AI was strictly as a support tool and did not influence the integrity or originality of the research findings.
Special thanks also go to my family and colleagues, whose encouragement and moral support provided the motivation needed to complete this work. Finally, we appreciate all authors whose scholarly works formed the foundation of this study; their research and publications were instrumental in guiding the theoretical and empirical framework.
To all who, in diverse ways, contributed to the completion of this research, I extend my sincere appreciation.
Ethics Statement
Ethical approval for this study was obtained from appropriate authority of the participating institutions. The researchers also informed all the respondents about the purpose of the study, and participation was fully voluntary, with the right to withdraw at any time. Respondents’ details and responses were treated confidentially, and the data were used solely for academic purposes.
Conflict of Interest Statement
The authors declare that there is no conflict of interestas regards the conduct, authorship, or publication of this research. The study was carried out independently, without any financial or personal relationships that could have influenced the results or interpretations presented in this work.
References
Abun, D., Macaspac, L. G. R., Valdez, E. B., & Julian, F. P. (2023). The effect of innovative work environment on the innovative work behaviour of employees.International Journal of Research in Business and Social Science, 12(3), 2467. https://doi.org/10.20525/ijrbs.v12i3.2467
Adegbola, T. O. (2022). Innovation orientation and performance of administrative staff in public tertiary institutions in Nigeria.Journal of Management and Administrative Sciences, 11(2), 45–58.
Afsar, B., & Umrani, W. A. (2020). Transformational leadership and innovative work behaviour of employees: The mediating role of motivation to learn and the moderating role of job autonomy. European Journal of Innovation Management, 23(3), 402–428.
Afsar, B., Masood, M., & Umrani, W. A. (2019). The role of job crafting and knowledge sharing on the creative performance of employees: An empirical study. European Journal of Innovation Management, 22(1), 41–63.
Alvarez-Sández, D., Velázquez-Victorica, K., Mungaray-Moctezuma, A., & López-Guerrero, A. (2023). Administrative processes efficiency measurement in higher education institutions: A scoping review. Education Sciences, 13(9), 855. https://doi.org/10.3390/educsci13090855
Asogwa, E. E. (2023). Digital transformation and administrative performance in Nigerian universities: The mediating role of employee innovation.African Journal of Business and Economic Research, 18(4), 117–134.
Barkov, S. A., Markeeva, A. V., & Gavrilenko, O. V. (2024). Innovation bureaucracy in higher education management. RUDN Journal of Sociology, 24(1), 58–72. https://doi.org/10.22363/2313-2272-2024-24-1-58-72
Bello, A. R., & Yusuf, H. (2023). Administrative process re-engineering and institutional efficiency in Nigerian polytechnics.International Journal of Education and Management Studies, 13(1), 77–90.
De Jong, J. P. J., & Den Hartog, D. N. (2010). Measuring innovative work behaviour. Creativity and Innovation Management, 19(1), 23–36.
De Spiegelaere, S., Van Gyes, G., De Witte, H., Niesen, W., & Van Hootegem, G. (2018). On the relation of job insecurity, job autonomy, innovative work behaviour and the mediating effect of work engagement. Economic and Industrial Democracy, 39(2), 273–295.
Drucker, P. F. (1999). Management challenges for the 21st century. HarperCollins.
Eze, C. P., & Okoli, F. C. (2022). Administrative efficiency and institutional productivity in Nigerian universities.Journal of Educational Administration and Policy Studies, 14(3), 101–114.
Hashim, K. L. L. (2021). Enhancing innovative work behaviour of Malaysian public sector employees. Malaysian Journal of Social Sciences and Humanities, 6(2), 253–265. https://doi.org/10.47405/mjssh.v6i2.665
Ismail, I., Begum, Z., & Kassim, E. S. (2023). How individual factors shape innovative work behaviour in Malaysian HEIs: The role of innovation capability, knowledge sharing and psychological empowerment. Information Management & Business Review, 16(3(I)S). https://doi.org/10.22610/imbr.v16i3(I)S.4077
Janssen, O. (2000). Job demands, perceptions of effort–reward fairness and innovative work behaviour. Journal of Occupational and Organizational Psychology, 73(3), 287–302.
Mensah, S. K., & Darko, R. O. (2021). Employee creativity and organizational performance: The moderating role of leadership support in tertiary institutions. International Journal of Innovation Management, 25(6), 1–20.
Nwafor Orizu College of Education. (2024). Enhancing administrative efficiency through data analytics, digital communication, and automation in tertiary institutions in Anambra and Imo States. Edulead: Journal of Education Management, 7(2). https://doi.org/10.47453/edulead.v7i2.3586
Ogunyemi, O. A., & Oni, B. (2021). Administrative efficiency and institutional performance in Nigerian tertiary institutions. International Journal of Education and Administration, 13(2), 55–68.
Okafor, P. N., & Nwosu, U. J. (2021). Managerial support, work environment, and secretaries’ innovative behaviour in Nigerian higher institutions.Journal of Office and Information Management, 12(2), 89–104.
Okechukwu, C. N., & Nwachukwu, J. C. (2024). Employee innovation and service delivery efficiency in the Nigerian public sector.African Journal of Management Studies, 15(1), 73–92.
Onah, E. C., & Eze, S. U. (2022). Bureaucratic structure and innovation implementation in public universities in Nigeria.Journal of African Public Administration, 8(3), 121–136.
Onwuchekwa, C. C., & Ugochukwu, M. (2023). Administrative professionals and innovation practices in tertiary institutions: A Nigerian perspective.Journal of Office Systems and Management, 9(1), 33–49.
Prieto, I. M., & Pérez-Santana, M. P. (2021). Managing innovative work behaviour: The role of human resource practices. Personnel Review, 50(1), 238–255.
Scott, S. G., & Bruce, R. A. (1994). Determinants of innovative behaviour: A path model of individual innovation in the workplace. Academy of Management Journal, 37(3), 580–607
Srirahayu, D. P., Sridadi, A. R., & Ekowati, D. (2023). Innovative work behaviour in public organizations: A systematic literature review. Heliyon, 9(2), e13557. https://doi.org/10.1016/j.heliyon.2023.e13557
Chinuche, A. P., Arunaye, F. O., & Igberaharha, O. C. (2026). Analysis of the Influences of Habitual Utilization of E-Learning Facilities on the Academic Performance of Business Education Students in Delta State. International Journal of Research, 13(1), 287–305. https://doi.org/10.26643/ijr/2026/7
1Chinuche, Aaron Prince; Arunaye, Florence Oghenevorho2 and Igberaharha, Omovigho Clever3
1-3Department of Business Education
Delta State University, Abraka, Delta State, Nigeria.
The utilization of e-learning facilities on the academic performance has received more attention by Business Education students. This study examined the analysis of the influences of habitual utilization of e-learning facilities on the academic performance of business education students in Delta State. Two research questions were answered and two null hypotheses were analyzed. In this study, the population of 1,374 business education students in Delta State was used. The sample of the population consisted of 272 respondents, which is 20% of the population, using the systematic random sampling technique. Influence of E-learning facilities assessment Questionnaire (IEFAQ) was used as the instrument for data collection. Mean and standard deviation were used to answer the research questions and t-test was used to test the hypotheses at 0.05 alpha level of significance. The major findings were that habitual utilization of smart phone influenced academic performance of Business Education students in Delta State; and that habitual utilization of e-library facilities influenced the academic performance of business education students in Delta State. E-learning induction or training is recommended for all categories of students’ especially freshers in our institutions. The induction or training programme should be organized in form of a seminar from time to time, at the beginning of each session or semester. Students’ should develop good/effective study habits by having a planned study programme at the beginning of each semester/session. This planned study programme should be strictly adhered to. This will make them to avert the ills in social media.
Keywords: E-learning, Habitual, Mobile Phones, E-library facilities, Business Education & Academic Performance
INTRODUCTION
Tertiary institutions are beginning to embrace e-learning and realizing the potential power and implications for using it, as it relates to students’ academic performance. E-learning involves the use of mobile technologies such as personal digital assistants and MP3/MP4 player and includes the use of web-based teaching materials and hypermedia in general, as rooms or web-sites, discussion boards, collaborative software, e-mail, blogs, wikis, text chart, computer aided assistant, educational animation, simulation, games, learning management software et cetera. In line with this fact, higher educational establishments in particular have dramatically transformed their mode of operation. Today, the use of chalk and duster in our seminar rooms and lecture theatres are completely extinct on some campuses. In place of that, we now have interactive whiteboards powered by computers and projectors, learning management systems etc. Electronic learning (E-learning) has emerged and progressed drastically with the development of the internet and information and communication technologies.
According to Fry (2000), E-learning is the delivery of training and education via networked interactivity and distribution technologies. Thus, e-learning simply refers to as learning and communication exercises across computers and networks or for that matter any other electronic sources. Khan (2005) pointed that E-learning has been described in various ways as learning using a number of different technologies and methods for delivery e.g. Computer Based Training (CBT), Internet-based training (IBT), Web-based instruction (WBI), advanced distributed learning (ADL), distributed learning (DL), distance learning, online learning (OL), mobile learning (or m-learning) or remote learning and learning management systems (LMS).
In E-learning system, students are able to interact anytime from wherever with different instructional material (text, sound, pictures, video and so on) through Internet. In addition, learners can communicate with teachers and classmates both individually and as a group discussion with the use of message boards, instant message exchanges and video conferencing (Al-Ammari and Hamad, 2008). E-learning system is an inventive approach for delivering, learner-centered, interactive, and facilitated learning environment to anyplace, anyone, anytime by utilizing the features and resources of different digital technologies along with other types of learning materials suited for an open, distributed, and flexible learning environment (Khan, 2005).
Electronic learning is increasingly becoming the established practice with a wide array of positive outcomes. Over the past decade, e-learning, has moved from being a sheer project on the periphery to a central and integral part of some higher education operations. In fact, for some institutions it has become such an integral part of the institution that their institutional goals are reflected in their strategic plans and policies (Ellis, Jarkey, Mahony, Peat and Sheely, 2007). E-Learning means a lot of different things and it is understood differently by players with very different roles. The E-Content Report (2004) describes e-learning as “an umbrella term describing any type of learning that depends on or is enhanced by electronic communication using the latest Information and Communication Technologies (ICT).” Knowledge seekers no longer need to wait for information, training or instruction.
Undoubtedly, the survival of tertiary educational institutions in the 21st century will increasingly rely on various forms of electronic delivery system and communication facilities that are available in markets as requirements for educational flexibility. E-learning (EL) refers to the use of Information and Communication Technology (ICT) to enhance and or support learning in tertiary education. However this encompasses an ample array of systems, from students using e-mail and accessing course materials online while following a course on campus to programmes delivered entirely online. E-learning can be of different types. A campus-based institution may be offering courses, but using E-learning tied to the Internet or other online network (Lorraine, 2007).
The variables of e-learning concentrated on in this study are: Smartphones and e-library facilities. E-library is a way of accessing materials for learning through electronic technology. Mobile phones are advanced computing capabilities such as a personal digital assistant (PDA), a media player, a digital camera, a GPS navigation unit, a touch screen computer, a web browser, Wi-Fi, etc. According to Gardner (2012) the uses of e-learning facilities of which smart phones are more prevalent have become a norm in today’s society vis-à-vis tertiary institutions. The uses are beyond the control and individuals frequently check their mobile phones with less of conscious. This is known as habitual behavior in many of scholar. Habitual utilization of e-learning facilities is usually identified as the signal of the situation driven automatically that occurs as a result of experiences. Stronger response of habits is one of the concrete structures that can overcome behavioral intentions. Habit is repeating response with the frequency characteristics without any of goals or purposes that comes from thinking. Habit is active without consciousness with the minimum goals (Huang, 2014). Hence, habitual utilization of e-learning tends to have influence on students’ academic performance.
Stephenson (2001) posits that there is little systematic research into the overall effectiveness of e-learning as a learning medium despite the great interest in it. Therefore, against the background of the foregoing, it became imperative for the researcher to investigate an analysis of the influence of habitual utilization of e-learning facilities on the academic performance of business education students n Delta State, with the view of analyzing the influence business education students habitual utilization of some e-learning facilities on their academic performance.
Smart phone on the academic performance of business education students in Delta State
E-library facilities on the academic performance of business education students in Delta State
Research Questions
The following research questions were raised and answered in the study:
What are the influences of habitual utilization of smart phone on the academic performance of business education students in Delta State?
What are the influences of habitual utilization of e-library facilities on the academic performance of business education students in Delta State?
Hypotheses
The following null hypotheses were formulated for the study and tested at 0.05 level of significance:
Ho1: There is no significant difference in the mean responses of male and female respondents on the influences of habitual utilization of smart phones on the academic performance of business education students.
Ho2: There is no significant difference in the mean responses of male and female respondents on the influences of habitual utilization of e-library facilities on the academic performance of business education students.
Habitual Utilization of Smart Phone and Students’ Academic Performance
Studies such as Jackson, Zhao, Kolenic, Fitzgerald, Harold, and Voneye (2014) and Ravichandran (2009) have proven that rampant use of social networking, texting and chatting on mobile phones result in lower grades and poor academic performance of students. While people of various ages find mobile phones convenient and useful, younger generations tend to appreciate them more and be more dependent on them. The researches have proven that some students have the habit of keeping their mobile phones on during classes and studies, even in the library, thereby distracting others.
Smart mobile phone is also helpful to the students for exchanging useful information with their classmates about their studies. Students use this fascinating magic device also in a very better way. Some of the studies proved that this technology has increased the academic performance. In this context the study tried to find out the positive effects on learning achievements of youth (Sundari, 2015).
The use of cell phones is on the increase with the global cellular phone market standing at 1.8 billion subscribers in 2007 and was estimated to increase to 3 billion by the year 2010 (Reid and Reid, 2007). It is estimated that 95 per cent of young people use web based enabled mobile phones in Japanese societies with voice calling being the commonly used and brings about 80 per cent revenue. This growth is not limited to Japan, but has been observed in African countries such as Namibia. Significant growth has also been observed in the use of Short Message Services (SMS), a trend observed among young cell phone users. The increasing use of SMS is predicted to dominate both traffic volume and is likely to boost revenue generation for cell phone operators.
As Ling (2004) puts it, the line between a computer and a smart phone is increasingly becoming blurred as smart phones now function as computers and are increasingly being used for academic purposes.Cell phones as communication devices serve a very potent and imperative role in the academic settings. Hendrikz et al (2009) carried out a study on the effects of SMS on distance student’s performance at the University of Pretoria, South Africa. The findings of this survey show that distance students who had academic rapport with their lecturers via SMS performed much better than those that did not use this platform. The finding of this study is significant in that it shows that cell phone use can aid the learning processes by simplifying the communication between students and their lecturers.
Ravichandran (2009) study shows that a mobile phone is a total blessing to human life as it provides a collection of communication media which add value to the quality of human life. A mobile phone is a combination of a clock for time management, a calendar to manage daily activities, a camera to take pictures and build memories, music player for entertainment, a radio to keep one informed of the latest happenings and is an Internet device to surf and download items and therefore, it is perceived as a mobile library.
Nonetheless, cell phones use can also be addictive according to Jones (2014). It can negatively impact on personal interactive skills of users, create emotional distance and discourage physical learning process. Although mobile phones provide a convenient form of information sources, they, however, lead to lackadaisical tendency as students don’t see the need of patronizing the libraries as information is readily available on their mobile phones.
Mobile phone has been popular since the late 1990s (Meek, 2006) and today, with seven (7) billion mobile connections worldwide and unique mobile subscriptions of over 3.5 billion (Twum, 2011), they are very popular with young people and are commonplace in our educational institutions. These phones are no more just voice communication tools. Functions like Short Message Service (SMS) or texting have become global phenomenon. Not many of us keep wallet photos of loved ones. Now we save photos in our mobile phones, and view them on a touch of the screen.
Research on the influence of mobile phone on our schools today has not been given much attention. There is the conflicting priority of young people, parents and teachers in relation to the mobile phone device, with teachers more concerned about issues such as discipline in the classroom and parents worried about means of contacting their children at every point in time. Researchers have discovered that the use of mobile phone in schools is problematic. As Ling and Helmerson (2000) states, the mobile phone is “at cross purpose with the mission of the school”. While in school students are supposed to take on their prescribed roles as students with full concentration on their studies and free from contact with the outside world. However, the mobile phone gives room to blending students’ roles with other roles thus distracting and disrupting the students’ academic work (Gergen, 2002; and Halpen, 2003;). In the past when fixed telephones were the norm in schools, there were minimum distractions and disruptions but presently with the invasion of mobile phone and the eagerness of parents to maintain contact with their wards, the device is becoming part of the classroom. Thus, the mobile phone has the power to undermine the schools’ authority and weaken their control over students as well as influences their level of academic performances.
Jackson, et al (2014) opined that mobile phones’ usage is negatively impacting students’ academic performance. This means that the students who spent more time using mobile phone are having low GPA. On how much time they spend using their mobile phones and in how many classes they use mobile phone, they found that there is negative relationship between these two questions with students GPA. That is the students who are using mobile phone almost 7-10 hours and those who use mobile phone during most of their classes are having low GPA. He also found that one of the most useful features of mobile phone is text messaging used by 67% students (female 37% and male 30%). Almost 81% of the students (female 46%, male 35%) used standard text messages as compared to multimedia messages or other. Forty-three percent (43%) of students (31% female and 13% male) say that they put their mobile phone on silent mode while attending classes. Thirty-five percent (35%) of students (20% female and 15% male) say that they occasionally receive or send text messages while the class was in session. Fifty-five percent (55%) of students (35% female and 20% male) agree on policy that mobile phone should be kept by students but they should set it in vibration mode. Sixty-one percent (61%) of students (40% female, 21% male) say that they do not use night packages on their mobile phone. Forty-two percent (42%) of students (23% female, 19% male) say that they use day packages on their mobile phone. Sixty-seven percent (67%) of students (39% female, 27% male) say that they spent 10% of their pocket money on mobile phones. Fifty-six percent (56%) of students (32% female, 24% male) say that they sometimes use their mobile phone while doing their assignments.
Mobile phones are very common communication devices among University students. Almost every student of a university possesses one or more mobile phones. It is common phenomena among the teenagers (Cambell, 2006). It is affecting their social behaviour, health and budget (Ravichandran, 2009). However Ishii (2011) rejected the hypothesis of adverse effects of mobile phones on adolescents in Japan. But Jamal, Robbins and Tessler (2012) agree with the adverse effects of mobile phones on female students of Saudi Arabia. The use of mobile phones is increasing cost of education in the sense that in china about 22% of the University students change their mobile sets annually and 78% replace it after every two to three years (Khan, Khan and Amin, 2014).
Habitual Utilization of E-library Facilities and Students’ Academic Performance
Studies such as George (2011) and Lonsdale (2003) have shown that there is a strong connection between the students’ use of school e-library and their academic performance. Students that use the school e-library often perform better in test and examination than students who fail to use the school library. That school e-libraries have positive impact on students’ achievement. It contended that more than sixty (60) studies have been conducted in nineteen (19) U.S. States and one Canadian province. It maintained that the major finding of these studies is that students with access to well-supported school library media programme with a qualified school library media specialist scored higher on reading assessments regardless of their socio-economic statuses. Also, it observed that a study conducted in Ohio revealed that 99.4% of students surveyed believed that their school librarians and school media programmes helped them succeed in school. It cited Lonsdale (2003) who reported a similar conclusion in Australia.
Earlier, Dent (2006) conducted a research on the observations of school library impact at two rural Ugandan schools and submitted that the purpose of the study was to explore connections between the presence of a library and certain students’ academic engagement indicators, such as scholastic performance, reading and library use patterns.
According to International Federation of Library Association (2009) the followings are essential to the development of literacy, information literacy, learning and culture; and are core school library services:
Supporting and enhancing educational goals as outlined in the school mission and curriculum.
Developing and sustaining in children the habit and enjoyment of reading and learning, and the use of libraries throughout their lives.
Offering opportunity for experiences in creating and using information for knowledge, understanding, imagination and enjoyment.
Supporting all students in learning and practicing skills for evaluating and using information, regardless of form, format or medium, including sensitivity to the mode of communication within the community.
Providing access to local, regional, national and global resources and opportunities that expose learners to diverse ideas, experiences and opinions.
Organizing activities that encourage cultural and social awareness and sensitivity.
Working with students, teachers, administrators and parents to achieve the mission of the school.
Proclaiming the concept that intellectual freedom and access to information are essential to effective and responsible citizenship and participation in a democracy
Promoting reading and resources and services of the school library to the whole school community and beyond.
School e-library is very important in shaping students’ habit as regards reading for leisure, to pass examinations and to obtain information on different aspects of life (George, 2011). It is an inexhaustible store house of unrestricted information resources in diverse formats systematically organized for users. Thus, a school library cannot be separated from the school – parent institution and expect all round development of the students. Library users make use of library for different purposes. While some users use it for reading their notes and personal books, others use library to do assignments. Yet, others visit library to prepare for examination, recreation and relaxation.
Ogunbote and Odunewu (2008) cited Kumar (1991) and stated that the performance of students could be improved considerably if they use the library regularly. Students should therefore maximize the use of school e-libraries to their advantage since school libraries provide environment where the students can discover and develop their abilities and talents as well as improving their reading and study skills.
METHODOLOGY
The study adopted descriptive survey design. This design is considered most appropriate for the study because a survey design, utilizes questionnaire, observations, tests, and interviews as tools in obtaining information. The population was 1,374 business education students in the four State owned tertiary institutions in Delta State. The population is made up of business education students from Delta State University Abraka (384), University of Delta, Agbor (297), College of Education, Mosogar (DELSU affiliate and regular NCE), (342), and College of Education Warri (DELSU affiliate and regular NCE) (351) in the 2024/2025 academic session.The sample for the study consisted of 272 respondents, which is 20% of the population. The systematic random sampling technique was used in arriving at the sample size. Influences of E-learning Facilities Assessment Questionnaire (IEFAQ) developed by the researcher, was used as the instrument for data collection.The validity of the research instrument was determined by three experts. Cronbach Alpha approach was used to determine the reliability, smart Phones cluster yielded 0.81 coefficient while e-library facility cluster yielded 0.91 coefficient. Mean and standard deviation were employed in answering the research questions, while t-test statistic was employed in testing the null hypotheses formulated at 0.05 levels of significance.
RESULTS
Results were presented in tables according to the research questions and hypotheses.
Research Question 1
What are the influences of habitual utilization of smart phone on the academic performance of business education students in Delta State?
The data collected to answer the research question is presented in Table I.
Table 1:Influences of Habitual Utilization of Mobile Phone
S/N
Items
N
SD
Decision
1.
Texting/chatting on mobile phone influence academic performance
272
2.66
0.69
Agree
2.
Keep mobile phone on during distracts students
272
2.83
0.93
Agree
3.
Diverts money meant for academics to buying recharge cards
272
2.68
0.96
Agree
4.
Distractions through my mobile phone during personal studies
272
2.91
0.86
Agree
5.
Mobile phones enhances the making of friends among students than real academic exercise
272
2.79
0.95
Agree
Grand Mean
2.53
Agree
The result of the data analysis presented in Table 1 revealed that habitual utilization of mobile phone influences academic performance of business education students in Delta State. This is because, all the items in the above table obtained mean value above 2.50 and a grand mean of 2.53. The standard deviation values which ranged from .69 to .96 showed that the opinions of the respondents were not too far from the mean.
Research Question 2
What are the influences of habitual utilization of e-library facilities on the academic performance of business education students in Delta State?
The data collected to answer the research question is presented in Table 2.
Table 2: Influence of Habitual Utilization of E-Library Facilities
Lack of requisite e-library infrastructure influences my academic performance
272
2.76
0.84
Agree
8.
Non-cultivation of habitual use of the e-library influences my academic performance
272
2.79
0.77
Agree
9.
My institutional policies on the utilization of e-library influences my academic performances
272
2.75
0.77
Agree
10.
Lack of required competencies in using e-library influences my academic performance adversely
272
3.11
0.69
Agree
Grand Mean
2.83
Agree
The result of data analysis presented in Table 2 revealed that habitual utilization of e-library facilities influences the academic performance of business education students in Delta State. This is because the grand mean of 2.83 obtained is greater than 2.50. The standard deviation values which ranged from .69 to .92 showed that the opinions of the respondents were not too far from the mean.
Test of Hypotheses
Ho1:There is no significant difference in the mean responses of male and female respondents on the influences of habitual utilization of smart phones on the academic performance of business education students.
Table 3: Responses of Male and Female on the Influences of habitual utilization of Smart Phones on the Academic Performance of Business Education Students in Delta State
S/N
Gender
N
S.D
D.F
t-Cal
t- Critical
Decision
1.
Male
146
3.21
0.76
270
7.94
0.030
Reject
Female
126
2.39
0.93
2.
Male
146
3.08
0.80
270
8.29
0.031
Reject
Female
126
2.22
0.91
3.
Male
146
3.27
0.65
270
8.15
0.000
Reject
Female
126
2.50
0.90
4.
Male
146
3.19
0.80
270
8.40
0.058
Reject
Female
126
2.32
0.91
5.
Male
146
3.18
0.82
270
8.93
0.723
Reject
Female
126
2.30
0.80
Grand Mean
8.34
The result of the t-test analysis presented in the Table 3 reveals that there were significant differences in the mean responses of male and female respondents on the influences of habitual utilization of smart phones on the academic performances of business education students in Delta State. This is because the t-calculated values obtained in all the items as shown on the table are greater than the t-critical values. Based on this, the researcher rejected the null hypothesis and concluded that there is a significant difference in the mean responses of male and female students on the influence of habitual utilization of smart phones on the academic performances of business education students n Delta State.
H02: There is no significant difference in the mean responses of Delta North and Delta Central Senatorial Districts respondents on the influences of habitual utilization of e-library facilities on the academic performance of business education students.
Table 4:Responses of Delta North and Delta Central Senatorial Districts Respondents on the Influences of habitual utilization of E-library Facilities on the Academic Performance of Business Education Students.
S/N
Zones
N
S.D
D.F
T-Calculated
T- Critical
Decision
6.
Delta North
146
3.04
0.74
270
6.50
0.001
Reject
Delta Central
126
2.42
0.82
7.
Delta North
146
3.05
0.63
270
6.54
0.000
Reject
Delta Central
126
2.48
0.80
8.
Delta North
146
2.95
0.67
270
4.84
0.000
Reject
Delta Central
126
2.51
0.80
9.
Delta North
146
3.05
0.70
270
1.612
0.394
Reject
Delta Central
126
3.10
0.67
10.
Delta North
146
3.08
0.73
270
1.772
0.212
Reject
Delta Central
126
3.23
0.62
Grand Mean
4.252
0.1214
Reject
Theresult of the t-test analysis presented in Table 4 reveals that there is significant difference in the mean response of Delta north and Delta Central Senatorial Districts respondents on the influences of habitual utilization of e-library facilities on the academic performance of business education students in colleges of education in Delta State; this is because the t-calculated values obtained in all the items as shown on the table are greater than the t-critical value obtained in all the items. Based on this, the researcher rejected the null hypothesis and concluded that there is significant difference in their responses.
DISCUSSION OF FINDINGS
Influence of Habitual Utilization of Smart Phones on Students Academic Performance
The result of the data analysis presented in Table I revealed that habitual utilization of smart phone influences academic performance of business education students in Delta State.. The finding of this study is in line with that of Kibona and Mgaya (2015) who carried out a study on smart phone’ effects on academic performance of higher degree students: A case study of Ruaha Catholic University –Iringa, Tanzania. It was discovered that the use of smart phone was abuse to the point of addiction. It was becoming more problematic in Tanzania because most students whether higher degree students or low level students were more addicted to applications found on smart phones such as whatsApp, twitter, facebook and the like. The study aimed at finding out the impact of smart phones were surveyed regarding the use of smart phone to their academic performance. Data collected after survey were analyzed using SPSS and excel tools, and then. Percentage analysis was done to find the key contributors towards academic performance and smart phone usage or addiction.
Kibona and Mgaya’s study is related to this present-study in that both studies were on the “influence of mobile (smart phone) on the academic performance of students. The findings of both study equally relates in that both studies focuses on students of higher institution of learning. The gap between the present study and the later was that they were not conducted in the same area. The sample and population of both studies are not the same.
Influence of Habitual Utilization of e-library Facilities on Business Education Students Academic Performance
The result of data analysis presented in table 2 revealed that habitual utilization of e-library facilities influence academic performance of business education students in Delta State. The finding of this study is in line with that of Ikyumen and Fiase (2016) who carried out a study on e-learning resources availability and level of preparedness for utilization of educators in tertiary teacher educational institution in Nigeria. Ikyumen and Fiase’s (2016) discovered that even though some institutions posseses e-resources, their educators are not adequately prepared in terms of skills and proficiency for their utilization. Ikyumen and Fiase’s study is related in that both studies focuses on the utilization of the availability of e-library facilities for effective academic performances in the tertiary institutions. The studies also related in that both studies uses questionnaire as the instrument for data collection. Both studies further related in that both research questions were answered using mean and standard deviation, while hypotheses were also tested using t-test statistical tools
CONCLUSION
The study was carried out in Delta State and focused on the analysis of the influences of habitual utilization of e-learning facilities on the academic performance of business education students in Delta State. It is however concluded that habitual utilization of smart phones, and e-library facilities influences academic performance of business education students in Delta State.
RECOMMENDATIONS
The following recommendations are made to stir students up towards a better academic performance:
E-learning induction or training is recommended for all categories of students’ especially fresher’s in our institutions. The induction or training programme should be organized in form of a seminar from time to time, at the beginning of each session or semester.
Students’ should develop good /effective study habits by having a planned study programme at the beginning of each semester / session. This planned study programme should be strictly adhered to. This will make them to advert the ills in social media
Students’ should learn to study their academic materials over and over again, as familiarity facilitates learning. This can be easily achieved when they are engaged in both personal and group study.
The positive side of social media should be harnessed by students towards a better academic performance.
REFERENCES
Al-Ammari, J., & Hamad, S. (2008). Factors influencing the adoption of e-learning at UOB. In 2nd International Conference and Exhibition for Zain E-learning Center pp. 28-30.
Campbell, R. (2006). Teenage Girls and Cellular Phones: Discourses of Independence, Safety and ‘Rebellion. Journal of Youth Studies, 9(2)
Dent, V. F. (2006). Observations of School Library Impact at two Rural Uganda Schools. Retrieved on 6th February, 2017 from http://www.kitengcsalibrarv.org/images/ observations article.pdf
Ellis, R. A., Jarkey, N., Mahony, M. J., Peat, M., & Sheely, S. (2007). Managing quality improvement of e-Learning in a large, campus-based university. Quality Assurance in Education, 15(1), 9-23.
Gardner, B. (2012). Habit as automaticity, not frequency. The European Health Psychologist, 14(2), 32–36.
George, M. (2011). Managerial Technology and netted Networks”, Organization, 6(3), 451-471.
Gergen, K. J. (2002). The challenge of absent presence. In Kats, J.E. and Aakhus, M.A. (Eds.): Perpetual Contact: Mobile Communication, Private Talk, Public Performance. Cambridge, UK: Cambridge University Press,.
Greenall, D., & Loizides, S. (2001). Aboriginal digital opportunities: Addressing Aboriginal learning needs through the use of learning technologies. The Conference Board of Canada, Insights you can count on (p.1-51). Retrieved on 14th August, 2017 from http://www.hrsdc.gc.ca/en/hip/IIf/oIt/Skills_Development/OLTResearch?aborige.pdf.
Halpern, D. F. (2003).Thought and knowledge: An introduction to critical thinking (4th ed.). Mahwah, NJ:Erlbaum. Retrieved on 14th August, 2017 from http://www.webopedia.com/TERM/M/mobile_phone.html.
Hendrikz . O, Prins. G, Viljoen. J, & Preez. C, D. (2009). The use of mobile phones enhancing academic performance in distance education: An African perspective. Pretoria: University of Pretoria Press.
Huang, Y. (2014). Empirical Analysis on Factors Impacting Mobile Learning Acceptance in Higher Engineering Education. (Unpublished Doctoral Dissertation)University of Tennessee, Knoxville.
Ikyumen & Fiase (2016), E-learning resources: availability and level of preparedness for utilization of educators in tertiary teacher educational institutions in Nigeria. Unpublished Ph.D. Thesis, Department of Vocational Teacher Education, University of Nigeria, Nsukka.
International Federation of Library Association (2009). The School Library in Teaching and Learning for All. Retrieved on 10th January, 2018 from http://archive.ifla.org.
Jackson, L., Zhao, Y., Kolenic, A., Fitzgerald, H., Harold, R., & Voneye, A. (2014). Race, Gender, and Information Technology Use: The New Digital Divide. Journal of Cyber Psychology & Behavior 11(4, 1-17
Jamal, A., Robbins, M. & Tessler, M. (2012), New Findings on Arabs and Democracy. Journal of Democracy, 23(4), 89-103
Khan, B. (2005): Managing E-learning Strategies: Design, Delivery, Implementation and evaluation (USA Hershey PA).
Khan, J. Khan, Z. & Amin, S. (2014). The impact of mobile phones on the performance of university students. Munich Personal RePEc Archive, 21-28.
Kibona, L. & Mgaya, G. (2015). Smartphones’ Effects on Academic Performance of Higher Learning Students. A Case of Ruaha Catholic University – Iringa, Tanzania. Journal of Multidisciplinary Engineering Science and Technology (JMEST), 2(4), 12-18.
Ling, R. & Helmerson, F. (2000).Adolescent Girls and Young adult men. Two sub-ultures of the mobile telephone, Kjeller and Telenor Research and Development, R and D, retrieved 3rd March, 2018 from Report24/2001,http://www.telenor.no/fou/program/ nomadishe/ article/rich/2001/Adolesce nt.pdf.
Ling, R. S. (2004). Mobile connection: The cell phone’s impact on society San Francisco, Morgan Kaufmann.
Lorrain, M. (2007): Strategies to Engage Online students and Reduce Attrition Rates. [Electronic Version]. The Journal of Educator Online. Retrieved October 11th 2017
Meek, V. (2006). Organizational culture: Origins and weaknesses. Organization Studies, 9(4), 17-22
Ogunbote, K.O. & Odunewu, A.O. (2008). School Library and Utilization in Ijebu North Local Government Area of Ogun State, Nigeria. Niger. School Libr. Journal, 7, 42-57.
Ravichandran, N. (2009). A finite horizon inventory model: An operational framework. International Journal of Production Economics, 108, 1-2, 406-415.
Reid, D. J & Reid, F. J. M (2007) Text or Talk? Social Anxiety, Loneliness, and Divergent Preferences for Cell Phone Use. Cyber psychology and behaviour, 3(10), 424- 435.
Stephson, J. (2001). Teaching and learning online: Pedagogies for new technologies. London: Kogan Page Ltd.
Sundari, T.T. (2015). Effects of mobile phone use on academic performance of college going young adults in India. International Journal of Applied Research, 1(9), 898-905
Twum, K. (2011). Influence of mobile phone technologies on science students’ academic performance in selected Ghanaian Public Universities. A research Thesis Submitted in fulfillment of the requirements for the Award of the Degree of Doctor of Philosophy in the School of Education, Kenyatta University.
Construction of Integrated Packaged Sewage Treatment Plant (STP) on Turnkey Basis (Specialised Work)
The N.O.W. (National Objective Works) project for the Development of Land at Sector G7/G8, Narela, represents a significant step towards strengthening urban environmental infrastructure in one of Delhi’s rapidly developing sub-cities. A key component of this initiative is the design, supply, installation, construction, and operation of an integrated packaged-type Sewage Treatment Plant (STP) with a total treatment capacity of 7.87 MLD, based on Moving Bed Biofilm Reactor (MBBR) technology, located in Pockets 5, 6, and 7 of Sector G7/G8, Narela. This specialised work is being executed on a turnkey basis, ensuring end-to-end responsibility and long-term operational reliability.
Background and Need for the Project
Narela has been planned as a major urban extension of Delhi, accommodating residential, institutional, and commercial developments. With increasing population density and urban activity, the generation of domestic wastewater has risen significantly. In the absence of adequate sewage treatment infrastructure, untreated sewage can lead to contamination of surface water bodies, groundwater pollution, public health risks, and environmental degradation.
The establishment of a decentralised, integrated STP at Sector G7/G8 directly addresses these challenges. The project is designed to ensure safe collection, treatment, and disposal or reuse of sewage, thereby supporting sustainable urban growth and compliance with environmental norms.
Scope of Work under the STP Project
The project scope is comprehensive and covers the entire lifecycle of the sewage treatment system. It includes:
Design and engineering of the STP based on projected sewage loads and effluent quality standards
Supply and installation of packaged treatment units, mechanical and electrical equipment
Civil construction works, including foundations, tanks, control rooms, and ancillary structures
Integration of treatment processes for Pockets 5, 6, and 7, achieving a combined capacity of 7.87 MLD
Testing, commissioning, and stabilisation of the plant
Operation and maintenance (O&M) for the specified period under the turnkey arrangement
Being classified as specialised work, the project demands high technical expertise, precision engineering, and strict quality control.
MBBR Technology and Its Advantages
The Sewage Treatment Plant is based on MBBR (Moving Bed Biofilm Reactor) technology, which is widely adopted for urban wastewater treatment due to its efficiency and compact design. In this system, specially designed bio-media are suspended within the aeration tank, providing a large surface area for microbial growth. These microorganisms break down organic pollutants in the sewage.
Key advantages of MBBR technology include:
High treatment efficiency with consistent effluent quality
Compact footprint, suitable for space-constrained urban areas
Lower sludge generation, reducing handling and disposal costs
Operational flexibility, capable of handling load fluctuations
Ease of operation and maintenance, making it ideal for decentralised STPs
These benefits make MBBR technology particularly appropriate for residential pockets like those in Sector G7/G8, Narela.
Turnkey Basis and Operational Responsibility
Execution on a turnkey basis means that a single specialised agency is responsible for delivering the complete STP—from concept and design to construction and operation. This approach minimises coordination issues, ensures accountability, and improves overall project efficiency.
Inclusion of operation within the project scope ensures that the plant does not remain underutilised after construction. Proper operation during the initial years helps stabilise biological processes, train personnel, and ensure compliance with prescribed discharge standards.
Financial Details and Project Timeline
The estimated project cost for the Sewage Treatment Plant is ₹13.83 crore, reflecting the specialised nature of the work and the advanced treatment technology involved. The sanctioned cost stands at ₹12.58 crore, indicating careful financial structuring under the N.O.W. and UDF-aligned framework.
The project commenced on 08 February 2021, marking the start of implementation activities at the site. The investment underscores the importance of environmental infrastructure as a foundation for sustainable urban development.
Environmental and Urban Significance
The STP at Sector G7/G8 plays a crucial role in improving the environmental performance of Narela. By treating sewage at the local level, it prevents pollution of downstream drains and water bodies, protects groundwater quality, and improves overall sanitation conditions.
Treated effluent from the plant can potentially be reused for horticulture, landscaping, flushing, and other non-potable purposes, reducing dependence on freshwater sources. This aligns with broader goals of water conservation and circular urban water management.
Long-Term Benefits
The long-term benefits of this STP project include:
Improved public health and sanitation standards
Reduced environmental pollution
Compliance with regulatory norms
Support for future urban expansion in Narela
Creation of resilient and self-sufficient urban infrastructure
By integrating treatment, operation, and maintenance within a single project framework, the initiative ensures durability and sustainability of assets.
Conclusion
The N.O.W. project for the construction of an integrated packaged-type Sewage Treatment Plant at Sector G7/G8, Narela, is a vital infrastructure intervention supporting sustainable urban development in Delhi’s expanding periphery. With a treatment capacity of 7.87 MLD, adoption of MBBR-based technology, execution on a turnkey basis, and a project cost of ₹13.83 crore (sanctioned ₹12.58 crore), commenced on 08.02.2021, the project exemplifies a technically sound and environmentally responsible approach to wastewater management. It not only addresses present sanitation needs but also lays the foundation for a cleaner, healthier, and more resilient urban future for Narela.
The N.O.W. (National Objective Works) Up-gradation of the District Centre at Bhikaji Cama Place represents a comprehensive urban renewal initiative aimed at revitalising one of New Delhi’s important commercial and institutional hubs. Bhikaji Cama Place has long functioned as a district-level centre with offices, commercial establishments, public institutions, and heavy daily footfall. Over time, however, ageing infrastructure, fragmented public spaces, traffic congestion, and inadequate pedestrian amenities necessitated a holistic redevelopment approach. The up-gradation project has therefore been conceived as a UDF (Urban Development Fund) Project, ensuring structured financing, integrated planning, and long-term sustainability.
Rationale and Need for Up-gradation
Bhikaji Cama Place occupies a strategic location in South Delhi, serving as a major employment node and transit-oriented commercial area. Despite its importance, the district centre faced several urban challenges such as deteriorated buildings, lack of organised commercial space, insufficient public amenities, poor-quality plazas, and inefficient circulation for pedestrians and vehicles. The absence of vibrant public realms and modern infrastructure limited the area’s potential as a contemporary district centre.
The N.O.W. up-gradation project addresses these shortcomings through comprehensive redevelopment on a Design, Engineering, Procurement, and Construction (EPC) basis, combined with Operation and Maintenance (O&M), ensuring that the assets created remain functional and well-maintained over time.
Scope of Work under the Project
The project encompasses a wide range of infrastructure, architectural, and public realm interventions, transforming Bhikaji Cama Place into a modern, inclusive, and people-centric district centre.
Construction of Offices and Shops
A key component of the project is the construction and reorganisation of office and shop spaces. These spaces are designed to meet contemporary functional, safety, and accessibility standards. By providing organised commercial infrastructure, the project helps rationalise activities, reduce clutter, and improve the overall business environment. Modern office and retail spaces enhance economic productivity and support long-term commercial viability.
Public Toilets and Civic Amenities
Provision of modern public toilet facilities is an essential social infrastructure element in a high-footfall district centre. The toilets are designed with adequate capacity, hygiene standards, accessibility for persons with disabilities, water-efficient fixtures, and proper ventilation. These facilities significantly improve user comfort, dignity, and public health.
Renovation of Bhikaji Cama Bhawan
The renovation of Bhikaji Cama Bhawan is an important heritage-linked and functional component of the project. Renovation works include structural improvements, façade enhancement, internal space upgrades, and modern service integration. The revitalised building strengthens the identity of the district centre while preserving its institutional and architectural significance.
Plaza and Amphitheatre Development
To introduce vibrancy and social life into the district centre, the project includes the development of a central plaza and amphitheatre. These spaces serve as venues for public gatherings, cultural performances, informal meetings, and recreational activities. The plaza acts as a visual and social anchor for the area, transforming Bhikaji Cama Place from a purely functional commercial zone into an active public destination.
Tensile Shading Structures
Given Delhi’s extreme climatic conditions, tensile shading structures are provided over plazas, walkways, and key pedestrian areas. These structures improve thermal comfort, encourage outdoor activity, and add a contemporary architectural character to the district centre.
Development Works: Roads, Footpaths, and Parking
Comprehensive development works form the backbone of the up-gradation. Internal roads are improved with better surfacing, signage, and traffic management measures. Footpaths are redesigned to prioritise pedestrians, incorporating adequate widths, barrier-free access, tactile paving, and safe crossings.
Parking facilities are reorganised to reduce random on-street parking and improve traffic circulation. Structured and well-managed parking supports commercial activity while enhancing safety and efficiency.
Horticulture and Landscape Works
Horticulture and landscaping play a crucial role in improving the environmental quality of Bhikaji Cama Place. The project includes tree plantation, landscaped plazas, green buffers, and planters, helping reduce heat stress, dust, and noise while improving visual appeal. Use of native and low-maintenance plant species ensures sustainability and ease of upkeep.
Lifts, Escalators, and Universal Accessibility
To ensure inclusivity and ease of movement, lifts and escalators are integrated into key buildings and pedestrian connections. These features enhance accessibility for senior citizens, persons with disabilities, and visitors, aligning the district centre with universal design principles.
Electrification and Allied Works
Up-gradation of electrical infrastructure includes energy-efficient LED lighting, decorative and façade lighting, underground cabling, and reliable power distribution systems. Allied works such as CCTV surveillance, fire safety systems, signage, and ICT infrastructure contribute to safety, security, and smart management of the district centre.
EPC Mode and Operation & Maintenance
Execution on an EPC basis ensures single-point accountability for design quality, construction, timelines, and cost control. Inclusion of Operation and Maintenance within the project framework ensures that the newly created infrastructure remains functional, safe, and aesthetically maintained over the specified period, maximising value for public investment.
Financial Details and Project Timeline
The estimated project cost for the up-gradation is ₹59.99 crore, while the sanctioned cost stands at ₹61.82 crore, reflecting the comprehensive scope of redevelopment works. The project commenced on 19 December 2019, marking the start of systematic transformation under the UDF framework. The scale of investment highlights the strategic importance of Bhikaji Cama Place as a district centre within New Delhi.
Conclusion
The N.O.W. Up-gradation of the District Centre at Bhikaji Cama Place, New Delhi, represents a holistic urban renewal effort that integrates commercial redevelopment, public amenities, cultural spaces, improved mobility, landscaping, and modern infrastructure. Implemented as a UDF Project on EPC basis with O&M, it not only upgrades physical assets but also enhances livability, accessibility, and economic vitality. Once completed, the redeveloped Bhikaji Cama Place is poised to emerge as a modern, vibrant, and inclusive district centre, setting a strong example for sustainable and people-centric urban regeneration in New Delhi.
(ii) Up-gradation of District Centre, Nehru Place – Construction of MLCP at Modi Tower (UDF Project)
Multi Level Car Parking (MLCP) is an essential component of modern urban infrastructure, particularly in dense commercial districts where land availability is limited and parking demand is exceptionally high. An MLCP is a vertically developed parking structure designed to accommodate a large number of vehicles within a compact footprint by stacking parking floors. In cities like Nehru Place, where commercial intensity, daily footfall, and vehicular inflow are extremely high, MLCPs play a decisive role in managing traffic congestion, improving accessibility, and enhancing the overall urban environment.
Concept and Importance of MLCP
The fundamental concept of an MLCP is efficient utilisation of scarce urban land. Instead of spreading parking across surface lots—which consume valuable land and disrupt urban activity—MLCPs provide structured, organised, and safer parking solutions. These facilities help decongest roads by reducing on-street and haphazard parking, thereby improving traffic flow and pedestrian safety.
MLCPs are particularly relevant in district centres and central business districts, where parking demand peaks during working hours. They also support public transport systems by enabling park-and-walk or park-and-ride behaviour, indirectly contributing to sustainable urban mobility.
Urban Need for MLCPs in Commercial Districts
High-density commercial areas face multiple parking-related challenges:
Chronic roadside parking leading to traffic bottlenecks
Reduced carriageway capacity and unsafe pedestrian conditions
Increased travel time and fuel consumption
Visual clutter and poor urban aesthetics
An MLCP addresses these issues by centralising parking in a managed facility, freeing up surface space for better pedestrian infrastructure, landscaping, and public amenities.
MLCP as Part of Urban Up-gradation Strategy
MLCPs are no longer seen as standalone parking structures. In contemporary urban projects, they are integrated into area up-gradation and redevelopment strategies, supporting commercial revitalisation, public realm improvement, and economic efficiency. When planned under structured funding mechanisms such as Urban Development Fund (UDF) projects, MLCPs also ensure financial discipline, lifecycle management, and long-term sustainability.
(ii) Up-gradation of District Centre, Nehru Place
Construction of Multi Level Car Parking (MLCP) at Modi Tower (UDF Project)
The Construction of a Multi Level Car Parking (MLCP) at Modi Tower, Nehru Place is a key component of the broader up-gradation of the Nehru Place District Centre. This project has been taken up as a UDF Project and is being implemented on a Design, Engineering, Procurement, and Construction (EPC) mode, ensuring single-point responsibility and integrated delivery.
Project Scope and Objectives
The primary objective of constructing the MLCP at Modi Tower is to systematically address the acute parking shortage in Nehru Place, which experiences one of the highest daily vehicular inflows in Delhi. The project aims to:
Accommodate a large volume of cars in a structured manner
Reduce roadside and surface parking
Improve traffic circulation within the district centre
Enhance pedestrian safety and walkability
Support commercial activity through better accessibility
The MLCP is designed along with all associated development works and services, including internal circulation, ramps, lighting, fire safety systems, drainage, signage, and external area development.
Financial Details and Project Timeline
The sanctioned project cost for the construction of the MLCP is ₹70.15 crore, reflecting the scale and complexity of the infrastructure. Out of this, ₹62.40 crore has been allocated towards execution of works under the EPC contract.
The project commenced on 14 June 2020, marking the beginning of on-site activities. The financial and temporal structuring under the UDF framework ensures better monitoring, accountability, and alignment with the overall redevelopment goals of Nehru Place.
Design and Planning Features
The MLCP at Modi Tower is planned as a high-capacity, user-friendly parking facility, compatible with the dense commercial character of Nehru Place. Key design considerations include:
Multi-level vertical configuration to maximise parking capacity within limited land
Efficient ramp design for smooth entry and exit, minimising internal congestion
Adequate clear heights and bay dimensions to accommodate different vehicle types
Fire detection and firefighting systems, as per safety norms
Energy-efficient lighting and ventilation, improving operational sustainability
Universal accessibility provisions, including lifts and clear pedestrian pathways
The structure is designed to integrate seamlessly with the surrounding built environment while maintaining functional efficiency.
EPC Mode and Development Works
Execution on EPC mode ensures that design optimisation, construction efficiency, and cost control are achieved under a single contractual framework. This approach reduces coordination issues between designers and contractors and accelerates project delivery.
In addition to the main parking structure, the project includes:
Internal and external road development
Stormwater drainage and utility integration
Electrical works, signage, and traffic management systems
Landscaping and interface treatment with surrounding areas
Role of MLCP in Nehru Place Up-gradation
The MLCP at Modi Tower is a strategic intervention within the overall up-gradation of the Nehru Place District Centre. By removing a substantial volume of vehicles from surface roads, it allows the district centre to reclaim space for footpaths, plazas, landscaping, and safer circulation. This directly complements other redevelopment initiatives such as pedestrian improvements, public amenities, and commercial revitalisation.
Conclusion
The construction of the Multi Level Car Parking at Modi Tower, Nehru Place, under the UDF Project, represents a critical step towards addressing one of the most pressing urban challenges in major commercial hubs—parking management. With a sanctioned cost of ₹70.15 crore, execution cost of ₹62.40 crore, and commencement on 14.06.2020, the project reflects a structured, well-financed, and strategic urban intervention. More than just a parking facility, the MLCP serves as a catalyst for traffic decongestion, pedestrian safety, and overall improvement in the functionality and image of Nehru Place as a premier district centre in New Delhi.
The up-gradation of the District Centre at Nehru Place, New Delhi, is a significant urban development initiative undertaken as part of a UDF (Urban Development Fund) Project. Nehru Place, known as one of Asia’s largest IT and electronics commercial hubs, has long been a vital economic centre of Delhi. However, decades of intense commercial activity, increasing footfall, traffic congestion, ageing infrastructure, and lack of quality public spaces have necessitated a comprehensive redevelopment and up-gradation. Phase-I of this project focuses on integrated urban renewal through Design, Engineering, Procurement, and Construction (EPC) basis, along with Operation and Maintenance (O&M), ensuring long-term functionality and sustainability.
The Up-gradation of District Centre, Nehru Place is being implemented with a sanctioned project cost of ₹97.01 crore, out of which ₹96.59 crore has been earmarked towards execution of works under Phase-I of the project. The project commenced on 12 November 2019, marking the formal start of on-ground activities under the UDF framework. The scale of investment reflects the strategic importance of Nehru Place as a major commercial and employment hub in New Delhi. This financial outlay covers comprehensive redevelopment works including commercial infrastructure, skywalks, public amenities, roads, plazas, landscaping, electrification, and other allied components on an EPC basis, along with operation and maintenance provisions. The timely commencement and substantial allocation underline the intent to achieve a high-quality, long-term urban renewal that enhances functionality, safety, and user experience while ensuring sustainable asset management for the district centre.
Background and Need for Up-gradation
Nehru Place District Centre experiences exceptionally high daily pedestrian and vehicular movement due to its concentration of offices, retail outlets, service centres, and transit connectivity. Over time, the area has faced challenges such as fragmented pedestrian movement, inadequate public amenities, poor-quality open spaces, insufficient parking management, and outdated electrical and utility infrastructure. The up-gradation project aims to transform Nehru Place into a safe, accessible, vibrant, and economically efficient district centre, aligned with contemporary urban design and infrastructure standards.
Scope of Work under Phase-I
The Phase-I up-gradation includes a wide range of civil, electrical, landscape, and public realm interventions, executed on an EPC basis with integrated O&M. The major components are detailed below.
Construction of Commercial Space
The project includes the development of organised commercial spaces to rationalise informal activities and enhance economic productivity. These spaces are planned with modern design standards, improved accessibility, and compliance with fire, safety, and structural norms. Well-planned commercial areas help decongest existing blocks, improve user experience, and increase revenue generation for long-term maintenance.
Skywalk Development
One of the most critical components is the construction of a skywalk to ensure safe, uninterrupted pedestrian movement across high-traffic corridors. The skywalk connects major activity nodes, metro access points, parking areas, and commercial blocks, significantly reducing pedestrian-vehicular conflict. Designed with universal accessibility features such as ramps, lifts, and clear signage, the skywalk enhances walkability and inclusiveness, especially for elderly users, children, and persons with disabilities.
Public Toilets and Urban Amenities
Provision of modern, hygienic public toilet facilities is a key social infrastructure component. These toilets are designed with adequate capacity, accessibility, water-efficient fixtures, proper ventilation, and mechanised maintenance systems. Such facilities are crucial in high-footfall commercial areas to ensure dignity, hygiene, and public health.
Plaza and Amphitheatre Development
The project proposes the development of a central urban plaza and amphitheatre, transforming Nehru Place from a purely commercial district into a lively public realm. The plaza acts as a gathering space for office workers, visitors, and local communities, while the amphitheatre provides a venue for cultural events, performances, public meetings, and informal recreation. These elements contribute to placemaking, social interaction, and cultural expression within the district centre.
Tensile Shading Structures
To address climatic comfort in Delhi’s extreme weather conditions, tensile shading structures are introduced across key pedestrian zones, plazas, and open areas. These lightweight yet durable structures provide protection from heat and rain while enhancing the visual identity of the district centre. Shaded spaces encourage longer pedestrian stay, increased street activity, and improved comfort.
Development Works: Roads, Footpaths, and Parking
Comprehensive road and circulation improvements form a core part of the project. This includes resurfacing of internal roads, junction improvements, traffic calming measures, and better signage. Footpaths are redesigned with adequate width, non-slip surfaces, tactile paving, and barrier-free access to prioritise pedestrians.
Parking development focuses on organised, efficient, and safer parking systems, reducing random on-street parking and improving traffic flow. Improved parking management directly supports commercial activity and reduces congestion.
Horticulture and Landscape Works
Horticulture and landscaping are essential to improving environmental quality in a dense commercial district. The project includes tree plantation, green buffers, planters, lawns, and landscaped open spaces, contributing to microclimate improvement, dust reduction, and visual relief. Native and low-maintenance plant species are preferred to ensure sustainability and ease of maintenance.
Electrification and Allied Works
Up-gradation of electrical infrastructure includes modern street lighting, decorative lighting for plazas and facades, energy-efficient LED systems, underground cabling, and reliable power distribution networks. Allied works also cover ICT infrastructure, CCTV surveillance, public address systems, and safety installations, contributing to security and smart district management.
EPC and Operation & Maintenance Framework
Executing the project on an EPC basis ensures single-point responsibility for design, quality, time, and cost control. Integration of Operation and Maintenance (O&M) within Phase-I ensures that assets created under the project remain functional, safe, and well-maintained for the intended period. This approach enhances accountability, lifecycle efficiency, and long-term value for public investment.
Significance of the UDF Project
As a UDF Project, the up-gradation of Nehru Place District Centre demonstrates a structured approach to financing and implementing urban renewal. It aligns infrastructure investment with economic revitalisation, public realm improvement, and institutional efficiency. The project not only upgrades physical infrastructure but also strengthens Nehru Place’s role as a major commercial and employment hub in New Delhi.
Conclusion
The Phase-I up-gradation of the District Centre at Nehru Place represents a holistic urban redevelopment initiative that integrates commercial growth, pedestrian safety, public amenities, cultural spaces, and environmental enhancement. Through components such as skywalks, plazas, amphitheatres, improved roads, parking, landscaping, and modern electrification—executed on an EPC basis with O&M—the project aims to transform Nehru Place into a vibrant, inclusive, and future-ready district centre. As a UDF Project, it sets a strong precedent for sustainable, well-managed, and people-centric urban renewal in Delhi and other metropolitan cities.
A UDF Project, commonly referred to as an Urban Development Fund (UDF) Project, is a structured financial and planning mechanism aimed at supporting urban infrastructure development in cities and towns. UDF projects are designed to bridge the gap between increasing urban infrastructure needs and limited availability of public funds by enabling planned investment, efficient resource utilisation, and long-term financial sustainability. Such projects are increasingly important in rapidly urbanising regions where demands for roads, water supply, sanitation, housing, transport, and public amenities are growing faster than municipal revenues.
Concept of a UDF Project
The basic concept of a UDF project is to create a dedicated fund or financing framework that supports urban development initiatives through a mix of public funds, loans, grants, and sometimes private sector participation. Instead of relying solely on annual budget allocations, UDF projects provide a revolving or pooled financing mechanism that can be used to plan, implement, and maintain urban infrastructure projects in a systematic manner.
UDF projects are often linked with city development plans, master plans, or area-based development strategies, ensuring that investments are aligned with long-term urban growth objectives rather than ad-hoc infrastructure creation.
Objectives of UDF Projects
The key objectives of a UDF project include:
Strengthening urban infrastructure, such as roads, bridges, water supply systems, sewerage, drainage, and public transport facilities.
Improving municipal financial capacity by enabling access to structured funding rather than uncertain grants.
Promoting sustainable and inclusive urban development, particularly in smaller cities and towns that lack adequate investment.
Encouraging planned urban growth, supported by proper technical, financial, and institutional frameworks.
Enhancing service delivery, ensuring better quality, reliability, and coverage of urban services.
Through these objectives, UDF projects aim to improve overall urban livability and economic productivity.
Key Components of a UDF Project
A typical UDF project consists of several interrelated components:
1. Infrastructure Development This includes funding for physical infrastructure such as urban roads, flyovers, water supply networks, sewage treatment plants, stormwater drainage, solid waste management systems, street lighting, and public spaces.
2. Financial Structuring UDF projects involve detailed financial planning, including project costing, funding sources, repayment mechanisms, and risk assessment. User charges, municipal revenues, and government support are often integrated into the financial model.
3. Institutional Strengthening Capacity-building of urban local bodies is an important part of UDF projects. This includes improving project management, accounting systems, procurement processes, and technical expertise.
4. Planning and Technical Support UDF projects are usually backed by detailed project reports (DPRs), feasibility studies, and technical designs to ensure cost-effectiveness, sustainability, and compliance with standards.
Importance of UDF Projects in Urban Development
UDF projects play a crucial role in addressing chronic underinvestment in urban infrastructure. By providing predictable and structured financing, they enable cities to undertake large-scale and long-term projects that would otherwise be difficult to execute. This is especially important for essential services like water supply, sanitation, and mobility, which directly affect public health and economic activity.
Another important benefit is financial discipline. Since UDF projects often involve repayment or performance-linked funding, urban local bodies are encouraged to improve revenue collection, adopt user charges, and enhance operational efficiency.
Challenges in UDF Project Implementation
Despite their advantages, UDF projects face several challenges:
Limited financial capacity of municipalities, affecting repayment ability.
Project delays, due to land acquisition, approvals, or weak institutional coordination.
Inadequate technical expertise, leading to cost overruns or design inefficiencies.
Equity concerns, if infrastructure investments are not distributed fairly across socio-economic groups.
These challenges highlight the need for strong governance, transparency, and stakeholder engagement.
Conclusion
UDF projects represent a strategic approach to financing and managing urban development in a sustainable and planned manner. By combining infrastructure investment with financial and institutional reforms, they help cities move beyond short-term solutions towards long-term urban resilience and growth. When implemented with sound planning, accountability, and inclusiveness, UDF projects can significantly enhance the quality of urban infrastructure, strengthen municipal capacity, and contribute to balanced and sustainable urban development.
The construction of a Flyover-cum-ROB (Road Over Bridge) is a critical urban transport infrastructure intervention aimed at improving traffic flow, enhancing road safety, and eliminating conflicts between road and railway traffic. In rapidly urbanising cities, increasing vehicular volumes and expanding railway networks often result in severe congestion and safety hazards at level crossings. A flyover-cum-ROB addresses these challenges by carrying road traffic over railway tracks and intersecting roads, ensuring uninterrupted movement and efficient connectivity.
Concept and Meaning of Flyover-cum-ROB
A Flyover-cum-ROB is a grade-separated structure that combines the functional features of a flyover and a Road Over Bridge. While a flyover allows traffic to pass over another road junction, a ROB specifically carries a road over a railway line. When both these requirements coincide—such as a road crossing a busy railway track near an intersection—the structure is designed as a composite facility known as a flyover-cum-ROB.
This integrated approach optimises land use, reduces construction redundancy, and addresses multiple traffic conflicts through a single infrastructure project.
Need for Flyover-cum-ROB Projects
The need for flyover-cum-ROB projects arises from several urban transport challenges:
Increasing vehicular traffic leading to frequent congestion at railway level crossings
High accident risk due to road–rail conflict points
Delays caused by train movement, affecting emergency services and public transport reliability
Economic losses resulting from fuel wastage and travel time delays
Urban growth, requiring uninterrupted connectivity across transport corridors
By eliminating level crossings, flyover-cum-ROB structures significantly enhance safety and operational efficiency.
Planning Considerations
Planning a flyover-cum-ROB involves detailed technical and urban considerations:
Traffic volume studies to assess current and future demand
Geometric design standards, including vertical clearance over railway tracks and adequate gradients
Railway coordination, ensuring compliance with railway safety norms and schedules
Land acquisition and right-of-way management, especially in dense urban areas
Utility shifting, including water pipelines, sewers, power lines, and telecom infrastructure
Environmental and social impact assessment, particularly where residential or commercial properties are affected
Effective planning ensures minimal disruption during construction and long-term functional efficiency.
Design and Structural Components
A flyover-cum-ROB typically consists of:
Approach ramps designed with gradual slopes to accommodate all vehicle types
Superstructure, often using reinforced concrete or prestressed concrete girders
Substructure, including piers, abutments, and foundations designed for heavy loads
Deck slab and wearing course to provide a durable riding surface
Crash barriers, railings, and lighting for safety and visibility
Drainage arrangements to prevent water accumulation on the deck
Structural design must account for dynamic loads, seismic forces, and long-term durability.
Construction Methodology
Construction of a flyover-cum-ROB is complex due to proximity to active railway lines and high-traffic roads. Typical construction stages include:
Site preparation and traffic diversion planning
Foundation and substructure construction, often using pile foundations
Erection of girders, sometimes during night blocks approved by railway authorities
Deck slab casting and finishing works
Approach road construction and integration with existing network
Safety installations and final commissioning
Strict safety protocols are followed during construction to protect both workers and ongoing rail operations.
Benefits of Flyover-cum-ROB
The advantages of constructing a flyover-cum-ROB include:
Improved traffic flow with reduced delays and congestion
Enhanced road and rail safety by removing level crossings
Time and fuel savings, contributing to economic efficiency
Reduced air and noise pollution due to smoother traffic movement
Support for public transport reliability, especially buses and emergency vehicles
Such structures also contribute to long-term urban mobility planning.
Challenges and Limitations
Despite their benefits, flyover-cum-ROB projects face challenges such as:
High capital costs and funding constraints
Construction-phase traffic disruption
Coordination issues between multiple agencies
Urban design concerns, including visual impact and pedestrian accessibility
These challenges highlight the need for integrated planning and stakeholder coordination.
Conclusion
The construction of a Flyover-cum-ROB is a strategic solution for managing complex traffic interactions in growing urban areas. By combining the functions of a flyover and a road over bridge, it ensures safer, faster, and more reliable movement for both road and rail users. When planned and executed with technical precision, environmental sensitivity, and institutional coordination, flyover-cum-ROB projects significantly enhance urban mobility and contribute to sustainable transport infrastructure development.
Treated effluent water supply lines form a critical component of modern urban water management systems, especially in water-stressed regions. Treated effluent water refers to wastewater that has undergone primary, secondary, and in many cases tertiary treatment in sewage treatment plants (STPs) to make it suitable for non-potable uses. Dedicated treated effluent water supply lines are laid to transport this reclaimed water from treatment facilities to various end-use points such as parks, industries, power plants, and construction sites. Their use reflects a shift from a linear “use-and-dispose” water model to a more sustainable circular water economy.
Purpose of Treated Effluent Water Supply Lines
The primary purpose of treated effluent water supply lines is to reduce dependence on freshwater sources such as rivers, lakes, reservoirs, and groundwater. By segregating potable and non-potable water systems, cities can ensure that high-quality freshwater is reserved for drinking and domestic needs, while treated wastewater is productively reused for activities that do not require drinking-water quality.
These pipelines are usually colour-coded (often purple or green) and clearly marked to avoid cross-connection with potable water lines, ensuring public health safety.
Major Uses of Treated Effluent Water
1. Landscaping and Green Areas One of the most common uses of treated effluent water is irrigation of parks, gardens, road medians, green belts, sports complexes, golf courses, and institutional campuses. Landscaping demands large volumes of water, and using treated effluent significantly reduces pressure on freshwater supplies while supporting urban green cover.
2. Industrial Use Industries use treated effluent water for cooling systems, boiler feed (after additional treatment if required), process water, and equipment washing. Dedicated effluent supply lines to industrial areas help industries meet sustainability norms and reduce groundwater extraction.
3. Construction Activities Treated effluent water is widely used for construction purposes such as concrete mixing (subject to quality standards), curing, dust suppression, and site cleaning. Construction demand is temporary but intensive, making reclaimed water an ideal substitute for freshwater.
4. Power Plants and Infrastructure Facilities Thermal power plants, district cooling systems, and large infrastructure installations use treated effluent water for cooling and auxiliary services. This application has high potential for large-scale water reuse.
5. Urban Services and Municipal Uses Municipal bodies use treated effluent water for street washing, drain cleaning, flushing of public toilets, firefighting reserves, and maintenance of public spaces.
6. Agriculture and Peri-Urban Farming In some cases, treated effluent water is used for irrigating non-food crops, fodder, biofuel plantations, or agriculture after ensuring compliance with safety standards. This use helps support livelihoods while conserving freshwater.
Importance and Benefits of Treated Effluent Supply Lines
Water Conservation: Reusing treated wastewater reduces freshwater withdrawals from rivers and aquifers, helping address water scarcity.
Environmental Protection: Diverting treated effluent for reuse reduces pollution load in rivers and lakes, improving overall water quality and aquatic ecosystems.
Energy and Cost Efficiency: Supplying treated effluent locally through dedicated pipelines is often more energy-efficient and cost-effective than transporting freshwater over long distances.
Urban Resilience: Cities with reclaimed water networks are better equipped to handle droughts and climate variability.
Compliance with Sustainability Goals: Effluent reuse supports sustainable development goals related to water efficiency, sanitation, and environmental protection.
Planning and Design Considerations
Proper planning of treated effluent water supply lines is essential to ensure safety, reliability, and acceptance:
Segregated network design to prevent cross-contamination with potable water systems
Quality standards based on end-use requirements (secondary or tertiary treated water)
Storage infrastructure, such as balancing reservoirs and sumps, to manage supply-demand variations
Pumping and pressure management, considering topography and distance
Clear identification and signage of pipelines and outlets
Monitoring systems for water quality, flow, and leakage
Public awareness and capacity-building among operators and users are equally important to build trust in reclaimed water systems.
Challenges and Limitations
Despite clear benefits, treated effluent supply systems face challenges:
Public perception issues, with resistance to using recycled water
High initial investment for separate pipeline networks
Operation and maintenance requirements, including regular quality monitoring
Institutional coordination between water supply, sewerage, and urban development agencies
Addressing these challenges requires strong policy support, incentives for reuse, and transparent communication.
Conclusion
Treated effluent water supply lines are a cornerstone of sustainable urban water management. By enabling safe and efficient reuse of wastewater, they help conserve freshwater, protect the environment, and support diverse urban, industrial, and infrastructural needs. As cities grow and water stress intensifies, integrating treated effluent supply networks into urban planning is no longer optional but essential. With proper design, regulation, and public engagement, treated effluent water can be transformed from a waste product into a valuable and reliable resource for long-term urban sustainability.
The restoration and rejuvenation of the River Yamuna floodplain has emerged as one of the most critical environmental and urban challenges in Delhi. The Yamuna River, despite being the lifeline of northern India and a river of immense cultural, ecological, and spiritual importance, has suffered severe degradation—especially along its urban stretch in Delhi. The floodplain, which once acted as a natural buffer for floods, groundwater recharge, and biodiversity, has been progressively encroached upon, polluted, and ecologically fragmented. Restoration and rejuvenation of this floodplain are therefore essential not only for the health of the river but also for the long-term sustainability and resilience of the city.
Understanding the Yamuna Floodplain
A river floodplain is the low-lying area adjacent to the river channel that gets periodically inundated during high flows. In its natural state, the Yamuna floodplain performed several vital functions: it absorbed excess floodwater, filtered pollutants, supported wetlands and forests, recharged groundwater, and provided habitat for diverse flora and fauna. In Delhi, the Yamuna floodplain once extended over several kilometres in width, acting as a vast ecological corridor cutting across the city.
However, rapid urbanisation, infrastructure development, and unplanned land-use changes have drastically reduced the effective floodplain area. Roads, power plants, landfills, housing, and event spaces have replaced natural vegetation and wetlands, disrupting the river–floodplain relationship.
Need for Restoration and Rejuvenation
The need for restoring and rejuvenating the Yamuna floodplain arises from multiple interlinked challenges:
Severe water pollution, caused mainly by untreated and partially treated sewage entering the river.
Loss of natural flood buffering capacity, increasing the risk of urban flooding.
Declining groundwater levels, as floodplain recharge zones are blocked or paved.
Degradation of biodiversity, with wetlands, bird habitats, and native vegetation disappearing.
Public disconnection from the river, as access has become restricted or environmentally unsafe.
Floodplain restoration is therefore not merely an environmental exercise but a necessity for urban water security, climate adaptation, and public well-being.
Key Components of Floodplain Restoration
1. Removal of Encroachments and Land-Use Regulation A fundamental step in floodplain restoration is the identification and removal of illegal or incompatible land uses. This includes restricting permanent construction within the active floodplain and enforcing zoning regulations that prioritise ecological functions over commercial or real estate interests.
2. Ecological Restoration and Native Vegetation Rejuvenation efforts focus on restoring native floodplain ecosystems such as grasslands, wetlands, and riparian forests. Native plant species are better adapted to periodic flooding and help stabilise soil, improve habitat quality, and enhance biodiversity. Recreating wetlands also aids in natural water purification and flood moderation.
3. Improving Water Quality Floodplain restoration cannot succeed without addressing pollution at its source. Intercepting drains, upgrading sewage treatment plants, and ensuring environmental flows in the river are essential. Clean water allows restored floodplains to function effectively as living ecosystems rather than stagnant landscapes.
4. Reconnecting the River and Floodplain Engineering interventions over the years have confined the river to a narrow channel. Rejuvenation involves allowing seasonal flooding in designated zones so that sediment deposition, nutrient cycling, and groundwater recharge can occur naturally.
Social and Urban Dimensions
The Yamuna floodplain also has a strong social dimension. Historically, communities depended on it for agriculture, grazing, fishing, and seasonal livelihoods. Restoration efforts must balance ecological goals with social justice by ensuring that vulnerable groups are not unfairly displaced and that alternative livelihood opportunities are created.
At the same time, a restored floodplain can become a public ecological space—with controlled access for nature walks, environmental education, and low-impact recreation. This helps reconnect citizens with the river and builds public support for long-term conservation.
Climate Resilience and Flood Management
With climate change increasing the frequency of extreme rainfall events, floodplain restoration is a key strategy for urban climate resilience. A healthy floodplain absorbs excess water during floods, reducing pressure on embankments and drainage systems. It also stores moisture during dry periods, improving water availability and microclimatic conditions.
In this sense, restoring the Yamuna floodplain is far more cost-effective and sustainable than relying solely on hard engineering solutions such as embankments and floodwalls.
Multiple agencies with overlapping responsibilities
Short-term, project-based approaches instead of long-term ecological planning
Conflicts between development pressures and environmental protection
Limited public awareness and participation
Effective restoration requires integrated river basin management, strong regulatory enforcement, scientific monitoring, and continuous public engagement.
Conclusion
The restoration and rejuvenation of the Yamuna floodplain represent a decisive step towards reclaiming the river as a living system rather than a polluted drain. For Delhi, the floodplain is not vacant land waiting to be developed, but critical natural infrastructure that supports water security, biodiversity, flood protection, and urban livability. A healthy Yamuna floodplain can act as the city’s ecological spine—absorbing shocks, sustaining life, and reconnecting people with nature. While the challenges are complex, sustained political will, scientific planning, and community participation can transform the Yamuna floodplain into a resilient and vibrant landscape, ensuring that the river once again flows as a symbol of life, balance, and sustainability.
The Golf Course, Sector 24 Dwarka is envisioned as a major recreational and green infrastructure asset within the planned sub-city of Dwarka in Delhi. Set amidst a rapidly developing urban landscape, the golf course at Sector-24 represents more than just a sporting facility—it functions as an important open space, an environmental buffer, and a lifestyle destination that contributes to the overall quality of urban life. In the context of Delhi’s high density, limited green cover, and growing demand for recreational amenities, the development of a golf course in Dwarka carries significant planning, ecological, and social relevance.
Urban Context and Location Significance
Dwarka was planned as one of Delhi’s largest sub-cities, with a structured sectoral layout, wide road networks, metro connectivity, and designated zones for residential, institutional, recreational, and utility uses. Sector-24 occupies a strategic location within Dwarka, close to major arterial roads and well connected to surrounding residential sectors. The placement of a golf course in this sector aligns with the planning principle of distributing large recreational and open spaces evenly across urban areas, rather than concentrating them only in the city core.
The golf course also serves as a visual and spatial relief in an otherwise built-up environment. For surrounding residential sectors, it provides an expansive green frontage, enhances microclimatic conditions, and contributes to higher environmental and aesthetic value.
Concept of a Golf Course as Urban Open Space
Traditionally, golf courses are viewed primarily as elite sports facilities. However, in contemporary urban planning, they are increasingly recognised as multi-functional open spaces. The golf course at Sector-24, Dwarka fits into this broader understanding by acting as:
A recreational sports facility for professional and amateur golfers
A large urban green lung contributing to air quality and temperature regulation
A buffer zone reducing noise and visual stress in surrounding areas
A landmark space that enhances the identity of Dwarka as a premium, well-planned sub-city
Such facilities play an important role in cities like Delhi, where per capita open space availability is far below desirable standards.
Design and Spatial Characteristics
The design of the golf course at Sector-24 is guided by the need to balance sporting requirements with environmental sensitivity and urban compatibility. Key spatial characteristics generally include:
Large contiguous green areas with fairways, greens, and roughs designed to international or national standards
Natural landscaping elements such as gentle contours, water bodies, and tree clusters
Clubhouse and support facilities, including changing rooms, equipment storage, cafés, and administrative spaces
Internal circulation systems for players, maintenance vehicles, and service access
The layout is typically low-rise and low-density, ensuring minimal visual obstruction and maximum landscape continuity. This openness differentiates the golf course from other urban land uses and reinforces its role as a passive and active recreational space.
Environmental and Ecological Importance
One of the most critical contributions of the Sector-24 golf course lies in its environmental benefits. Large green tracts within cities help mitigate the urban heat island effect, improve air quality, and support urban biodiversity. The extensive vegetation cover absorbs carbon dioxide, filters dust and pollutants, and provides habitat for birds and small fauna.
If planned and managed responsibly, the golf course can also promote sustainable water management through rainwater harvesting, reuse of treated wastewater for irrigation, and efficient sprinkler systems. Landscaped water bodies can aid in groundwater recharge and stormwater management, particularly during monsoon periods.
Social and Recreational Role
From a social perspective, the golf course contributes to the recreational hierarchy of Dwarka. Alongside neighbourhood parks, sports complexes, and city-level open spaces, it serves a specialised yet significant role. While golf itself may cater to a limited user group, the presence of the course enhances the overall recreational environment of the sub-city.
The development has the potential to host training programmes, amateur tournaments, and youth engagement initiatives, thereby broadening access to the sport. Indirectly, it also supports leisure activities, employment opportunities, and ancillary services related to sports and hospitality.
Economic and Urban Development Impact
The golf course at Sector-24 also influences urban development and land value patterns. Proximity to well-maintained green and recreational spaces often leads to improved property values and attracts higher-quality residential and institutional development. This, in turn, contributes to a more balanced and desirable urban environment.
At the city level, such facilities enhance Delhi’s profile as a global metropolis with diverse recreational offerings. They also support sports tourism, events, and related economic activities.
Challenges and Critical Concerns
Despite its benefits, the development of a golf course in a city like Delhi raises certain concerns:
Land use efficiency, given the large area required for a single sport
Water consumption, especially in a water-stressed region
Equity and accessibility, as golf is often perceived as exclusive
Maintenance costs, which are significantly higher than those of conventional parks
Addressing these concerns requires careful policy oversight, sustainable management practices, and integration with broader public open-space planning.
Conclusion
The Golf Course at Sector-24, Dwarka represents an important urban intervention that combines recreation, environmental sustainability, and city-level identity. Within the planned framework of Dwarka, it functions as a major green asset, enhancing livability and environmental quality. While challenges related to resource use and inclusivity must be acknowledged, a well-planned and responsibly managed golf course can serve as a valuable component of Delhi’s urban open-space system. In the long run, the Sector-24 golf course has the potential to stand not only as a sporting facility but also as a symbol of balanced, green, and forward-looking urban development in the national capital.
The Dwarka Sports Complex is one of the most prominent sports and recreational infrastructures in West Delhi, playing a crucial role in promoting physical fitness, community interaction, and organised sports activities. Developed primarily under the planning framework of sub-city Dwarka, the sports complex represents a well-integrated sports zone that caters to diverse age groups, skill levels, and sporting interests. It reflects the growing recognition of sports and recreation as essential components of urban life rather than optional amenities.
Concept of a Sports Zone in Urban Planning
In urban planning, a sports zone refers to a designated area within the city specifically planned for sports, physical activity, recreation, and wellness-related infrastructure. Such zones are vital for enhancing urban livability, improving public health, and fostering social cohesion. In high-density cities like Delhi, where open spaces are limited, planned sports complexes become critical public assets.
The Dwarka Sports Complex fits well within this concept, serving not only competitive athletes but also local residents seeking daily recreation, fitness training, and leisure activities. It aligns with planning principles that emphasise balanced land use, social infrastructure provision, and sustainable urban development.
Location and Urban Context
Dwarka, envisioned as a planned sub-city of Delhi, was designed with sector-based development, wide road networks, metro connectivity, and dedicated institutional and recreational areas. The sports complex is strategically located to ensure easy accessibility from surrounding residential sectors, schools, and institutions. Proximity to metro corridors and arterial roads enhances its reach, making it a regional-level recreational facility rather than a neighbourhood-level one.
The presence of the sports complex adds significant value to the urban fabric of Dwarka, contributing to land-use balance and improving the quality of life for residents.
Components and Facilities of the Dwarka Sports Complex
The Dwarka Sports Complex offers a wide range of indoor and outdoor sports facilities, making it a multi-functional sports zone. Key components typically include:
Outdoor facilities such as football grounds, cricket pitches, athletics tracks, and multipurpose playfields.
Indoor sports infrastructure, including badminton courts, table tennis halls, squash courts, and gymnasiums.
Aquatic facilities, such as swimming pools for training, recreation, and competitions.
Fitness and wellness amenities, including yoga halls, aerobics spaces, and modern gyms.
Supporting infrastructure like changing rooms, spectator seating, lighting, parking areas, and landscaped open spaces.
These facilities are designed to accommodate both formal sporting events and informal recreational use, ensuring maximum utilisation throughout the day.
Role in Promoting Sports and Physical Fitness
One of the most significant contributions of the Dwarka Sports Complex is its role in encouraging sports participation and active lifestyles. It provides structured training opportunities for children and youth, helping identify and nurture sporting talent at an early stage. Coaching camps, sports academies, and regular practice sessions contribute to skill development across various disciplines.
For adults and senior citizens, the complex offers safe and accessible spaces for walking, fitness training, yoga, and recreational sports. This inclusive approach supports public health objectives by reducing sedentary behaviour and lifestyle-related diseases.
Social and Community Significance
Beyond physical activity, the sports complex functions as an important community space. It brings together people from different socio-economic backgrounds, fostering social interaction and a sense of belonging. Events such as local tournaments, sports meets, fitness drives, and cultural programmes transform the complex into a vibrant social hub.
In a city where public open spaces are often under pressure, the Dwarka Sports Complex provides a structured yet open environment where residents can engage positively with each other, strengthening community ties.
Planning and Design Considerations
From a planning perspective, the sports complex demonstrates several good practices:
Zoning and land-use efficiency, with clear demarcation of activity areas and support facilities.
Safety and accessibility, through controlled entry points, lighting, and pedestrian-friendly internal circulation.
Environmental considerations, including landscaped areas, tree cover, and potential for water-efficient practices.
Scalability and adaptability, allowing facilities to be upgraded or expanded based on demand.
However, like many large public facilities, continuous maintenance and periodic upgrades are essential to retain functional efficiency and user satisfaction.
Challenges and Scope for Improvement
Despite its strengths, the Dwarka Sports Complex faces some challenges:
High user demand, leading to overcrowding during peak hours.
Maintenance issues, particularly for outdoor fields and older infrastructure.
Limited access for economically weaker groups, if user fees are perceived as high.
Need for better integration with schools and local sports programmes, to enhance outreach.
Addressing these challenges through improved management, inclusive pricing strategies, and community partnerships can significantly enhance the complex’s impact.
Conclusion
The Dwarka Sports Complex stands as a successful example of a planned sports zone within an urban context, contributing to physical fitness, social well-being, and overall urban livability. It demonstrates how dedicated sports infrastructure can go beyond competitive athletics to serve as a cornerstone of community life. As Delhi continues to grow and densify, such sports complexes will become increasingly important in ensuring that urban development remains people-centric, healthy, and socially inclusive. With sustained investment, effective management, and inclusive policies, the Dwarka Sports Complex can continue to inspire active living and sporting excellence for generations to come.
Economically Weaker Section (EWS) housing plays a vital role in addressing the housing shortage among low-income urban households in India. EWS houses are primarily meant for families with limited income who are often excluded from the formal housing market and are forced to live in informal settlements or substandard conditions. The Design & Build (D&B) model has emerged as an effective project delivery mechanism for EWS housing, enabling faster construction, cost control, and better coordination between design and execution.
Understanding EWS Housing
EWS housing refers to dwelling units developed specifically for economically weaker sections of society, usually with a small unit size (generally 25–40 sq m carpet area) and basic but adequate living facilities. These houses typically include one multipurpose room, a small kitchen space, a toilet-bathroom, and provision for ventilation and natural light. The objective of EWS housing is not merely shelter provision but ensuring dignified, safe, and habitable living conditions with access to essential services such as water supply, sanitation, electricity, roads, and social infrastructure.
EWS housing projects are often developed by public authorities, urban local bodies, housing boards, or through public–private partnerships as part of affordable housing and slum rehabilitation initiatives.
Concept of the Design & Build Model
The Design & Build model is a project delivery system in which a single agency or contractor is responsible for both the design and construction of the housing project. Unlike the traditional model—where design and construction are handled by separate entities—the D&B model integrates both functions under one contract. This approach is particularly suitable for EWS housing due to its emphasis on speed, standardisation, and cost efficiency.
Under this model, the client or government agency specifies performance requirements, unit sizes, quality standards, timelines, and cost limits. The design-build contractor then prepares detailed designs and executes construction accordingly.
Design Principles for EWS Houses
Designing EWS houses under the D&B model requires a careful balance between affordability, functionality, and livability. Key design considerations include:
Efficient space planning to maximise usability within limited carpet area. Multi-functional spaces are often adopted.
Standardised layouts and modular design, which allow repetition and faster execution while maintaining quality.
Adequate natural light and ventilation, achieved through window placement, orientation, and open corridors.
Structural safety and durability, especially in multi-storey developments, using cost-effective but robust construction technologies.
Provision of basic services, including water supply, sanitation, electricity, and drainage.
Fire safety, accessibility, and disaster resilience, particularly important in high-density EWS housing clusters.
The D&B model allows contractors to optimise designs based on construction methods, materials, and sequencing, reducing wastage and cost overruns.
Construction Aspects under the Design & Build Model
Construction of EWS houses using the D&B model often employs mass housing techniques such as precast components, monolithic concrete construction, or other fast-track technologies. These methods help achieve uniform quality, reduce construction time, and ensure structural consistency.
Key construction features include:
Rapid project execution, as design and construction phases overlap.
Better coordination, since the same agency handles drawings, approvals, and on-site work.
Cost control, achieved through bulk procurement, standard materials, and optimised construction processes.
Quality assurance, as the contractor is accountable for both design performance and construction output.
Advantages of the Design & Build Model for EWS Housing
The D&B model offers several advantages when applied to EWS housing projects:
Single-point responsibility – Reduces disputes between designers and contractors.
Cost effectiveness – Better integration leads to optimised designs and reduced variations.
Innovation potential – Contractors can introduce new materials and construction techniques.
Scalability – Suitable for large-scale EWS housing developments.
Challenges and Limitations
Despite its benefits, the Design & Build model also presents certain challenges in EWS housing:
Risk of compromised design quality if cost-cutting dominates decision-making.
Limited community participation, as designs are often finalised quickly.
Maintenance concerns, if post-construction management is not clearly defined.
Need for strong monitoring, as public agencies must ensure compliance with quality and safety standards.
Addressing these challenges requires robust tender conditions, independent quality audits, and clear performance benchmarks.
Conclusion
EWS houses developed under the Design & Build model represent a pragmatic and efficient approach to affordable housing delivery in India. By integrating design and construction, the model ensures speed, cost control, and accountability—key factors in meeting the massive housing needs of economically weaker sections. However, the true success of EWS housing lies not just in numbers but in quality, livability, and long-term sustainability. When supported by thoughtful design guidelines, strong institutional oversight, and inclusive planning, the Design & Build model can significantly contribute to creating humane, dignified, and resilient housing solutions for the urban poor.
The Delhi Cycle Walkway represents an important step towards building a more sustainable, healthy, and inclusive urban transport system in Delhi. As one of the most populous and congested metropolitan regions in the world, Delhi faces severe challenges related to traffic congestion, air pollution, road safety, and declining quality of life. In this context, the development of dedicated cycle walkways—often integrated with pedestrian paths—has emerged as a critical intervention to encourage non-motorised transport (NMT), reduce dependency on private vehicles, and create people-centric streets.
Concept of the Delhi Cycle Walkway
A cycle walkway in Delhi refers to a dedicated, clearly demarcated corridor designed primarily for cyclists and often combined with pedestrian infrastructure, ensuring safe and comfortable movement for non-motorised users. These facilities are typically separated from motorised traffic through physical barriers, level differences, landscaping, or markings. The concept aligns with global best practices in urban mobility, where cycling and walking are treated as essential modes of transport rather than residual activities.
In Delhi, cycle walkways are planned along arterial roads, sub-arterial corridors, transit-oriented development (TOD) zones, institutional areas, and recreational stretches. The aim is not only to provide infrastructure but also to reshape travel behaviour by making cycling and walking safer, more attractive, and socially acceptable.
Need for Cycle Walkways in Delhi
The need for cycle walkways in Delhi arises from multiple urban challenges:
High traffic congestion: With rapid growth in private vehicle ownership, Delhi’s road space is heavily dominated by cars and two-wheelers.
Air pollution: Vehicular emissions are a major contributor to poor air quality, making a strong case for zero-emission modes such as cycling and walking.
Road safety concerns: Pedestrians and cyclists constitute a significant share of road accident victims due to the absence of safe infrastructure.
First- and last-mile connectivity: Cycle walkways play a crucial role in connecting residential areas to metro stations, bus stops, and activity centres.
Public health: Encouraging active travel helps address lifestyle diseases and improves overall well-being.
Design Features of Delhi Cycle Walkways
Delhi’s cycle walkways incorporate several important design elements:
Dedicated cycle lanes with adequate width, typically ranging from 1.5 to 2.5 metres, depending on demand and right-of-way availability.
Pedestrian footpaths alongside cycle tracks, ensuring conflict-free movement between walkers and cyclists.
Physical segregation from motorised traffic using kerbs, bollards, railings, or green buffers.
Universal accessibility features, such as ramps, tactile paving, and gentle gradients for persons with disabilities.
Street furniture and amenities, including benches, lighting, signage, drinking water points, and shade trees.
Safe crossings at intersections through raised tables, signals, and traffic calming measures.
These design components aim to create a comfortable and continuous network rather than isolated stretches of infrastructure.
Integration with Public Transport and TOD
One of the most significant roles of cycle walkways in Delhi is their integration with public transport systems. Many cycle tracks are planned within transit influence zones to support metro and bus ridership. Cyclists can access stations quickly, park their bicycles at designated facilities, or use shared mobility services for first- and last-mile travel.
Within transit-oriented development areas, cycle walkways contribute to compact, mixed-use, and walkable neighbourhoods. They help reduce short motorised trips, increase active travel, and support sustainable land-use patterns.
Social and Environmental Benefits
The Delhi Cycle Walkway offers a wide range of benefits:
Social equity: Affordable mobility for low-income groups, students, and informal workers who rely on cycling and walking.
Health benefits: Increased physical activity leads to better cardiovascular health and reduced stress.
Economic efficiency: Cycling infrastructure is cost-effective compared to road widening or flyover construction.
Urban livability: Streets with cycle walkways are often more vibrant, safer, and people-friendly.
Challenges in Implementation
Despite its potential, the Delhi Cycle Walkway initiative faces several challenges:
Encroachment and misuse by parked vehicles, street vendors, or utility installations.
Discontinuity of networks, where cycle tracks abruptly end or lack safe intersections.
Public perception, as cycling is still viewed by many as a non-prestigious mode of transport.
Maintenance issues, including damaged surfaces, poor lighting, and inadequate cleanliness.
Institutional coordination, as multiple agencies are involved in planning and implementation.
Addressing these issues requires strong enforcement, continuous monitoring, and public awareness campaigns.
Conclusion
The Delhi Cycle Walkway is more than just a piece of transport infrastructure; it is a statement about the city’s vision for sustainable and inclusive mobility. By prioritising cyclists and pedestrians, Delhi can reduce its environmental footprint, enhance public health, and reclaim streets as shared public spaces. While challenges remain, consistent policy support, community participation, and integrated planning can transform cycle walkways into a backbone of everyday urban mobility. In the long run, a well-connected and well-maintained cycle walkway network has the potential to redefine how Delhi moves—cleaner, healthier, and more equitably.
In-situ rehabilitation is an urban development and housing strategy aimed at improving the living conditions of informal settlement residents at the same location where they currently reside, instead of relocating them to distant peripheral sites. The core idea behind in-situ rehabilitation is simple yet powerful: people should not lose their homes, livelihoods, social networks, or access to urban opportunities in the name of development. This approach has gained prominence in rapidly urbanising countries like India, where informal settlements are deeply integrated into the urban economy.
Concept and Meaning of In-Situ Rehabilitation
The term in-situ literally means “in the original place.” In-situ rehabilitation therefore refers to redevelopment or upgrading of existing slums or informal settlements without displacing the residents outside the project area. The approach may involve rebuilding houses vertically, improving infrastructure, regularising land tenure, and providing basic services such as water supply, sanitation, electricity, drainage, and road access.
Unlike relocation-based resettlement, where communities are shifted to far-off locations, in-situ rehabilitation recognises that informal settlements are often located close to employment centres, transport corridors, and social amenities. Removing people from these locations can worsen poverty, increase travel costs, and disrupt established social systems.
Objectives of In-Situ Rehabilitation
The primary objectives of in-situ rehabilitation include:
Improving housing quality by replacing unsafe, congested, or dilapidated structures with durable and planned housing units.
Ensuring tenure security, either through ownership rights, long-term leases, or occupancy certificates.
Upgrading urban infrastructure, including internal roads, drainage, sewerage, water supply, solid waste management, and street lighting.
Minimising displacement, thereby protecting livelihoods and social networks.
Promoting inclusive urban development, where low-income communities remain part of the city rather than being pushed to the margins.
Process of In-Situ Rehabilitation
The implementation of in-situ rehabilitation generally follows a structured process:
1. Identification and Survey The first step involves identifying eligible settlements and conducting detailed socio-economic and physical surveys. Household data, structure conditions, tenure status, and service availability are documented.
2. Community Participation and Consent In-situ rehabilitation heavily relies on community participation. Resident consent is crucial, especially where redevelopment involves vertical construction and temporary relocation. Community engagement helps build trust and ensures that designs respond to real needs.
3. Planning and Design Planning includes layout redesign, building typologies, density optimisation, and integration with the surrounding urban fabric. Design solutions often involve multi-storey buildings to accommodate the same population within limited land.
4. Temporary Transit Accommodation During construction, residents may be shifted to nearby transit camps. Keeping these camps close to the original site is essential to minimise disruption.
5. Construction and Redevelopment Housing units are constructed along with internal infrastructure and service networks. Quality control and adherence to safety standards are critical at this stage.
6. Allotment and Post-Occupancy Support After completion, rehabilitated units are allotted to eligible beneficiaries. Post-occupancy support, such as maintenance systems and resident welfare associations, ensures long-term sustainability.
Importance and Benefits of In-Situ Rehabilitation
In-situ rehabilitation offers several social, economic, and spatial advantages:
Livelihood protection: Residents retain access to jobs, markets, and informal economic activities.
Social continuity: Community bonds, cultural practices, and support systems remain intact.
Reduced urban sprawl: Redevelopment within existing city areas limits outward expansion and infrastructure costs.
Better utilisation of urban land: Central land is optimised rather than underutilised or encroached upon.
Improved quality of life: Access to services, safer housing, and improved public spaces enhances living conditions.
Challenges and Limitations
Despite its advantages, in-situ rehabilitation faces multiple challenges:
Land ownership and legal disputes can delay or derail projects.
High population density makes planning and construction complex.
Financial viability is often dependent on cross-subsidy models, which may prioritise commercial interests.
Temporary displacement issues arise when transit housing is inadequate or located far away.
Maintenance concerns may emerge if residents lack capacity or institutional support post-redevelopment.
Additionally, poorly planned projects risk creating vertical slums if adequate open spaces, social infrastructure, and livelihood considerations are ignored.
In-Situ Rehabilitation in the Indian Context
In India, in-situ rehabilitation has been promoted under national urban housing initiatives, particularly as part of slum redevelopment and affordable housing policies. Cities such as Mumbai, Delhi, Ahmedabad, and Hyderabad have implemented varying models of in-situ redevelopment, with mixed outcomes. Successful projects are typically those where community participation, transparent governance, and contextual planning are prioritised.
Conclusion
In-situ rehabilitation represents a progressive shift in urban planning—from eviction and relocation towards inclusion, dignity, and rights-based development. When executed thoughtfully, it not only transforms physical living conditions but also strengthens social equity and urban resilience. However, its success depends on sensitive planning, strong institutional frameworks, financial transparency, and meaningful community engagement. As cities continue to grow, in-situ rehabilitation will remain a critical tool for achieving sustainable and inclusive urban development.
External Development refers to all infrastructure facilities that are developed outside the individual plot or building boundary but are essential for the proper functioning of a project, township, or urban development. These facilities connect the project with the larger city or regional infrastructure network.
External development typically includes:
External approach roads and access roads
Water supply pipelines from municipal mains
Sewerage and storm water connections to city networks
External power supply lines and substations
External drainage channels
Street lighting in peripheral areas
The responsibility for external development may lie with the developer, government agencies, or be shared, depending on local development regulations. In large housing or mixed-use projects, external development ensures integration with city services, smooth mobility, environmental safety, and long-term sustainability. Poor external development often leads to traffic congestion, water shortages, flooding, and service failures.
2. Electrification
Electrification involves the planning, installation, and commissioning of electrical infrastructure required to supply safe and reliable power to a project or area. It includes both external electrification and internal electrification.
Key components of electrification include:
High tension (HT) and low tension (LT) power lines
Electrical substations and transformers
Distribution panels and switchgear
Street lighting systems
Backup power systems (DG sets, solar PV, batteries)
External electrification connects the project to the city or state electricity grid, while internal electrification distributes power within buildings, common areas, and services. Modern electrification planning also integrates renewable energy systems, energy-efficient lighting, and smart metering to reduce power consumption and operational costs.
3. UGRs (Underground Reservoirs)
UGRs (Underground Reservoirs) are structures used for storage of potable or non-potable water below ground level. They form a critical part of water supply systems in residential, commercial, and institutional developments.
Functions of UGRs include:
Storing municipal water for uninterrupted supply
Acting as buffer storage during peak demand
Supporting fire-fighting systems
Storing treated water for reuse (flushing, landscaping)
UGRs are usually connected to overhead tanks (OHTs) through pumping systems. Proper design of UGRs ensures adequate capacity, water quality protection, ease of maintenance, and structural safety. They help ensure water security, especially in areas with intermittent municipal supply.
4. STP (Sewage Treatment Plant)
A Sewage Treatment Plant (STP) is a facility designed to treat wastewater generated from residential, commercial, or mixed-use developments before disposal or reuse. STPs are mandatory in large developments under environmental and urban development regulations.
The treatment process generally includes:
Preliminary treatment (screening and grit removal)
Primary treatment (settling of solids)
Secondary biological treatment (removal of organic matter)
Tertiary treatment (filtration and disinfection)
Treated wastewater from STPs is reused for:
Flushing toilets
Landscape irrigation
Cooling towers
Road washing
STPs reduce pollution loads on city sewer networks, conserve freshwater resources, and support sustainable urban water management. Efficient operation and maintenance of STPs are crucial to avoid odor, health risks, and environmental violations.
5. ESS (Electrical Substation / Energy Storage System)
The term ESS can have two meanings depending on project context:
(a) Electrical Substation
An Electrical Substation is a facility where voltage is transformed from high to low or vice versa to enable safe distribution of electricity. Substations include:
Transformers
Circuit breakers
Control panels
Protection systems
They ensure stable power supply, voltage regulation, and electrical safety within a project or township.
(b) Energy Storage System
In modern developments, ESS may also refer to Energy Storage Systems, which store electrical energy for later use. These systems:
Improve power reliability
Support renewable energy integration (solar, wind)
Reduce peak load demand
Provide backup during power outages
Energy storage systems play a growing role in sustainable and smart city projects.
6. Other Supporting Infrastructure (“etc.”)
In addition to the above, large projects also include:
Storm water drainage systems
Solid waste management facilities
Fire-fighting infrastructure
Communication and ICT networks
Utility corridors and service ducts
These systems collectively ensure functional efficiency, safety, environmental protection, and quality of life.
Conclusion
External development and infrastructure components such as electrification, UGRs, STPs, and ESS form the backbone of any planned urban or infrastructure project. Their proper planning, design, and integration ensure sustainable service delivery, environmental compliance, and long-term operational efficiency. Together, these systems transform physical development into a livable, resilient, and well-functioning urban environment.
A turnkey project is a form of project delivery in which a single contractor or organization is made fully responsible for the design, execution, installation, testing, and commissioning of a project. The term turnkey signifies that the client only needs to “turn the key” to begin operations once the project is completed. Such projects are commonly used in construction, infrastructure development, industrial plants, power projects, information technology systems, and urban development works, where clients prefer minimal involvement during implementation.
In a turnkey arrangement, the client defines the broad requirements, objectives, and performance standards at the outset. Based on these requirements, the contractor undertakes the entire project lifecycle—from conceptual design to final handover. This approach contrasts with traditional project delivery methods, where design, construction, and supervision may be handled by multiple agencies, often increasing coordination challenges and risks for the client.
One of the most significant features of a turnkey project is single-point responsibility. The contractor is accountable for cost, time, quality, and functionality. If delays occur, costs escalate, or performance standards are not met, the responsibility lies with the contractor rather than being dispersed across consultants, suppliers, and subcontractors. This greatly reduces administrative and managerial burden for the client and ensures clearer accountability.
Another important characteristic of turnkey projects is fixed pricing. In many cases, the project is executed on a lump-sum or fixed-price basis. This provides cost certainty to the client and helps in better financial planning. Since the contractor bears the risk of cost overruns, they are motivated to plan efficiently, optimize resource use, and complete the project within the agreed budget and timeline.
Turnkey projects are especially beneficial when the client lacks technical expertise or sufficient manpower to manage complex projects. By transferring technical and operational risks to the contractor, the client can focus on strategic decisions rather than day-to-day execution. This makes turnkey contracts attractive for governments, public sector undertakings, and private developers undertaking large-scale or technically complex projects.
However, turnkey projects also have certain limitations. Since the contractor controls design and execution, the client may have limited flexibility to introduce changes once the project is underway. Any modification in scope or specifications often leads to cost and time implications. Therefore, it is crucial that the client clearly defines project requirements, performance criteria, and quality standards at the planning stage.
Another concern can be quality assurance. As contractors aim to maximize profit within a fixed price, there may be a tendency to reduce costs by selecting lower-quality materials or technologies, unless strict specifications, monitoring mechanisms, and penalties are included in the contract. Hence, well-drafted contracts and effective supervision remain essential even in turnkey projects.
In practice, turnkey projects are widely used in sectors such as highways, metro rail systems, water supply schemes, wastewater treatment plants, industrial units, and housing developments. In urban and infrastructure planning, turnkey projects help expedite implementation, reduce delays caused by inter-agency coordination, and ensure faster delivery of public assets.
In conclusion, a turnkey project is an efficient and client-friendly project delivery mechanism that emphasizes accountability, risk transfer, and timely completion. While it offers significant advantages in terms of simplicity, cost certainty, and reduced managerial effort, its success depends heavily on clear initial planning, comprehensive contracts, and robust performance specifications. When applied appropriately, turnkey projects can play a vital role in achieving efficient and sustainable development outcomes.
Estimation is a critical activity in construction and project management, as it directly influences decision-making, budgeting, scheduling, and resource allocation. The attached image clearly illustrates how estimating methods evolve from quick, perception-based approaches to highly detailed, fact-driven techniques, with a corresponding increase in accuracy and level of detail. This progression reflects the maturity of project information and the purpose for which the estimate is prepared.
The horizontal axis in the image represents a shift from perception to fact, while the vertical axis highlights the movement from “quick and dirty” estimates to high accuracy and detail. As projects move forward, estimation methods transition along this curve.
1. Expert Judgment Estimate
At the earliest stage of a project, expert judgment is often the primary estimation method. This approach relies on the experience, intuition, and professional knowledge of experts who have worked on similar projects.
Characteristics:
Based largely on perception and past experience
Minimal data or documentation required
Very fast and inexpensive
Applications:
Conceptual planning
Initial idea screening
Early discussions with stakeholders
Limitations:
Highly subjective
Accuracy depends heavily on expert competence
Difficult to justify quantitatively
This method is positioned at the far left of the image, emphasizing its low accuracy but high speed. It is useful for rough direction-setting rather than firm decision-making.
2. Three-Point Estimate
The three-point estimate improves upon pure expert judgment by incorporating uncertainty into the estimation process. Instead of a single value, three scenarios are considered:
Optimistic (O)
Most likely (M)
Pessimistic (P)
These values are combined to produce a weighted average estimate.
Characteristics:
Accounts for risk and uncertainty
More structured than expert judgment
Still relatively quick
Applications:
Risk assessment
Early feasibility analysis
Schedule and cost forecasting
Advantages:
Reduces bias
Encourages realistic thinking
Although still partially perception-based, this method moves slightly upward on the accuracy scale, as shown in the image.
3. Comparative Estimate
A comparative estimate (also known as analogous estimation) uses historical data from similar completed projects as a reference.
Characteristics:
Relies on documented past projects
Adjustments made for size, location, complexity, and inflation
Moderately accurate
Applications:
Feasibility studies
Preliminary budgeting
Alternative evaluation
Strengths:
Faster than detailed estimation
More objective than judgment-based methods
Weaknesses:
Accuracy depends on similarity of reference projects
Adjustments may introduce errors
In the image, comparative estimates occupy the mid-zone, representing a balance between speed and reliability.
4. Parametric Estimate
The parametric estimating method uses statistical relationships between variables to estimate cost or time. For example, cost per square meter, cost per bed, or cost per classroom.
Characteristics:
Uses mathematical models and cost drivers
Requires reliable historical data
Scalable and repeatable
Applications:
Large-scale projects
Budget forecasting
Institutional and infrastructure planning
Advantages:
Higher accuracy than comparative estimates
Data-driven and transparent
Limitations:
Requires validated parameters
Less effective for unique or complex designs
As shown in the image, parametric estimation is closer to the “fact” end of the spectrum, offering higher accuracy and greater confidence.
5. Bottom-Up Estimate
The bottom-up estimate represents the most detailed and accurate estimation method shown in the image. It involves breaking the project into individual components or work items and estimating each separately before aggregating the total cost.
Characteristics:
Item-by-item quantity take-off
Detailed rate analysis
High time and effort requirement
Applications:
Tendering and bidding
Final project approval
Cost control during execution
Advantages:
Highest accuracy
Strong justification and traceability
Suitable for contracts and audits
Disadvantages:
Time-consuming
Requires complete drawings and specifications
This method appears at the far right and highest point in the image, clearly indicating maximum accuracy, detail, and factual basis.
The image conveys a powerful message: no single estimating method is universally best. Instead, the choice of method depends on:
Project stage
Availability of information
Required accuracy
Time and resources
Early-stage decisions benefit from fast, perception-based methods, while later stages demand rigorous, fact-based approaches. Attempting a bottom-up estimate too early can waste effort, while relying on expert judgment too late can lead to cost overruns.
Conclusion
The progression of estimating methods—from expert judgment to bottom-up estimation—reflects the natural evolution of project information and decision needs. As shown in the image, accuracy and detail increase as estimates move from perception to fact. Effective project management lies in selecting the right estimation method at the right time, ensuring informed decisions without unnecessary complexity.
Understanding this hierarchy of estimating methods enables engineers, planners, and project managers to balance speed, accuracy, and reliability, ultimately contributing to successful project outcomes.
Construction estimates are prepared at different stages of a project depending on the level of information available. The main types are:
1. Order of Magnitude Estimate
This is the earliest and roughest estimate prepared.
Purpose
To get a broad idea of project cost
Used for initial decision-making
Basis
Past experience
Cost of similar projects
Very limited data
Accuracy
±30–40%
Use
Project idea stage
Go / No-go decision
2. Feasibility Estimate
Prepared to assess whether the project is financially viable.
Purpose
To evaluate economic feasibility
To compare alternatives
Basis
Approximate quantities
Area or unit rates
Preliminary layouts
Accuracy
±20–25%
Use
Feasibility studies
Investment appraisal
3. Preliminary Estimate
Prepared once the basic design and layout are available.
Purpose
To obtain administrative approval
To estimate project budget
Basis
Plinth area / floor area / cubic content method
Approximate specifications
Accuracy
±15–20%
Use
Budget sanction
Planning stage decisions
4. Substantive Estimate
Prepared after the design is finalized.
Purpose
To obtain technical sanction
To refine cost estimates
Basis
Detailed drawings
Updated specifications
Refined quantities
Accuracy
±10–15%
Use
Before tendering
Final cost assessment
5. Detailed Estimate
This is the most accurate and comprehensive estimate.
Purpose
For tendering and execution
To control project cost
Basis
Item-wise quantity take-off
Rate analysis using SOR
Detailed specifications
Accuracy
±5–10%
Use
Contract award
Construction and payment
Summary Table
Type of Estimate
Project Stage
Accuracy
Order of Magnitude
Concept stage
Very Low
Feasibility Estimate
Feasibility stage
Low
Preliminary Estimate
Planning stage
Medium
Substantive Estimate
Design finalization
Medium–High
Detailed Estimate
Execution stage
High
Conclusion
As a project progresses, estimates become more detailed and accurate. Early estimates guide decisions, while detailed estimates ensure financial control and successful execution.
Item-wise cost is summarized.Total Cost=∑(Quantity×Rate)
Major heads:
Substructure cost
Superstructure cost
Finishing cost
Services cost
6. Additions to Basic Cost
Additional percentages are added to arrive at final project cost.
6.1 Contingencies
3%–5% of estimated cost
6.2 Work-Charged Establishment
1.5%–2%
6.3 Contractor’s Profit
10%–15%
6.4 Taxes and Duties
GST, royalty, cess (as applicable)
7. Cost per Square Meter (Plinth Area Method)
Used for preliminary estimates.Cost per sqm=Plinth AreaTotal Project Cost
This method is useful at the planning stage when detailed drawings are unavailable.
8. Final Estimated Cost
The final construction cost includes:
Civil works
Services
External development
Professional fees (if included)
This figure is used for:
Budget approval
Tendering
Financial planning
9. Accuracy and Revision
Preliminary estimate: ±15–20%
Detailed estimate: ±5–10%
Revised estimates prepared if cost exceeds sanctioned limit (usually 5–10%)
10. Summary Flow of Estimation Process
Define project scope
Study drawings & specifications
Measure quantities
Analyze rates
Prepare abstract of cost
Add contingencies, profit, taxes
Arrive at final estimated cost
References
V Montes, M., M Falcón, R., & Ramírez-de-Arellano, A. (2014). Estimating building construction costs by production processes. The Open Construction & Building Technology Journal, 8(1).
Holm, L., & Schaufelberger, J. E. (2021). Construction cost estimating. Routledge.
Asal, E. M. (2014). Factors affecting building construction projects’ cost estimating. Arab Academy for Science, Technology and Maritime Transport (AASTMT), 95.
Fazeli, A., Dashti, M. S., Jalaei, F., & Khanzadi, M. (2021). An integrated BIM-based approach for cost estimation in construction projects. Engineering, Construction and Architectural Management, 28(9), 2828-2854.
Ji, S. H., Park, M., & Lee, H. S. (2011). Cost estimation model for building projects using case-based reasoning. Canadian Journal of Civil Engineering, 38(5), 570-581.
New-build apartments in Cyprus are having a moment—and it’s not hard to see why. Buyers get modern layouts, better energy performance than older stock, cleaner legal documentation (in many cases), and the kind of building amenities that make day-to-day life look and feel easier: elevators that don’t creak, underground parking that actually fits modern cars, storage rooms that are planned from day one, and communal spaces designed for how people live now.
In Cyprus, the difference between a great new apartment and an expensive headache often comes down to one thing: the developer. Developers shape construction quality, project management, finishing specs, handover procedures, warranty handling, and—often—how smoothly paperwork progresses. A strong developer can make the buying experience predictable. A weak one can leave you chasing timelines, arguing over “included” features, or discovering that the building looks far less impressive after six months of real-life use.
This article covers the best new apartment property developers in Cyprus, what each is typically strongest at, and how to choose the right one depending on whether you’re buying for relocation, lifestyle, or investment.
What “best new apartment developer” really means in Cyprus
When buyers say “best,” they often mean “most famous.” But the smartest buyers define “best” differently. For new-build apartments, the best developer is the one that consistently delivers:
1) Consistent build quality (not just a pretty showroom)
Show apartments are staged to perfection. The truth is in details you can’t photograph easily: wall straightness, waterproofing, window sealing, sound insulation between units, elevator reliability, and how communal areas age after people move in.
2) Modern, livable layouts
New-build apartments should feel efficient: open-plan living that isn’t awkward, bedrooms that actually fit real furniture, storage that doesn’t feel like an afterthought, and balconies that add value rather than “marketing square meters.”
3) Transparent specifications
Great developers provide clear, written specs that make it hard for misunderstandings to happen. You want to know exactly what’s included: kitchen quality, wardrobes, sanitary ware, thermal insulation, glazing type, A/C provisions, electrical capacity, and whether smart-home features are real or just brochure language.
4) Clean handover + after-sales process
Every new apartment will have snagging items. The difference is whether you get a structured process and fast fixes—or vague promises and delays. A professional after-sales team is a major “quality signal.”
5) Strong project selection in high-demand zones
A new apartment’s value is not only inside the unit. It’s also the neighborhood, access to amenities, and whether the building makes sense for how people live and rent in Cyprus today.
Best new apartment developers in Cyprus (and who they’re best for)
Below are developers widely associated with modern residential delivery and strong new-build apartment pipelines. Each one fits a different buyer profile—so treat this as a matching exercise, not a popularity contest.
1) bbf (often paired with a strong modern design identity)
If your goal is a new apartment that looks and feels “current Cyprus”—clean lines, modern finishes, lifestyle branding, and a strong emphasis on aesthetics—bbf is often one of the first names buyers consider, especially in markets where newer luxury and “new urban” living is in demand.
Why buyers like them for new apartments
Strong design-forward positioning
Modern building concepts and contemporary interiors
Projects that often target the premium end of the new-build segment
Best for
Buyers who want a modern “statement” apartment
Investors targeting tenants who value style and building image
Buyers shopping in higher-demand, newer lifestyle zones
What to double-check Confirm thermal and glazing specs (design and performance must match Cyprus heat), and clarify what finishes are truly included versus upgrade packages.
2) Prime Property Group (new-build focus with contemporary planning)
Prime Property Group is frequently discussed in the context of contemporary residential development and modern new-build apartment concepts. Buyers often shortlist them when they want updated layouts and a “new standard” feel—better use of space, cleaner finishing language, and projects aligned with modern expectations.
Why buyers like them
Contemporary planning and modern finishes
Projects that often feel tailored to today’s lifestyle
Strong appeal for both end-users and rental markets in certain zones
Best for
Buyers seeking modern living rather than “traditional apartment blocks”
Investors who want strong tenant appeal in new-build stock
What to double-check Ask for a detailed spec sheet and clarity on included kitchen/wardrobes, A/C provisions, parking allocation, and storage.
3) Pafilia (master-planned living and new-build community feel)
Pafilia is one of the most recognized residential developers on the island and is widely associated with larger planned developments, particularly in markets where community-style living is a big selling point. While many people think first about Paphos, the broader idea matters: structured developments that often come with shared amenities and a cohesive environment.
Why buyers like them
Organized projects with community planning
Amenities and communal areas that feel intentionally designed
A “turnkey” vibe that appeals to overseas buyers and lifestyle purchasers
Best for
Buyers who want a managed community environment
Buyers who value amenities like pools, gyms, and landscaped common areas
Investors who want rental-friendly “resort-like” apartment settings
What to double-check Communal fees and what they cover. Also confirm whether the apartment’s finish level matches the show unit or differs by phase.
4) Aristo Developers (wide apartment selection and buyer-friendly processes)
Aristo is a major developer with a broad pipeline across Cyprus and strong presence in coastal markets. Many buyers like Aristo because it’s easier to compare multiple projects and locations without switching developers, which can reduce complexity when you’re buying from abroad.
Why buyers like them
Variety of projects and layouts
Often structured communication and purchase process
Experience working with international buyers
Best for
Buyers comparing multiple regions (coastal vs. suburban)
Buyers who want a clearer process and predictable handover steps
What to double-check Snagging process and warranty details. Ask how defects are reported, typical response time, and what’s considered warranty-covered.
5) Leptos Estates (legacy developer with new-build offerings)
Leptos is one of the longest-standing names in Cyprus development and has delivered many residential projects over the years. For buyers, the advantage of established developers is simple: you can often see how their completed buildings age and how communities function years after delivery.
Why buyers like them
Long-term track record and recognizable brand
Large base of completed projects (useful for real-life inspection)
Residential planning that often suits year-round living
Best for
Buyers who want stability and a long operating history
Families and retirees planning permanent living
Buyers who prefer “proven residential neighborhoods” over hype
What to double-check Energy performance and insulation standards for the specific new project—don’t assume all “new builds” are equally efficient.
6) Cyfield (construction strength and “engineering-first” confidence)
Cyfield is known as a major construction and development group, and buyers often associate that kind of profile with reliable structural execution. Not every buyer cares about trendy design. Many care about durability, technical soundness, and long-term building performance.
Why buyers like them
Strong construction DNA
Often perceived as more engineering-driven
Appeals to buyers prioritizing solidity over styling
Best for
Long-term owners who want durability and robust build fundamentals
Buyers who prioritize structural integrity and predictability
What to double-check Interior finishing packages and layout efficiency. Engineering strength is great—just make sure the apartment feels good to live in.
7) D. Zavos Group (prime-zone projects and urban value positioning)
D. Zavos is a well-known name in Cyprus real estate development, often associated with projects in prime or high-demand zones, particularly around major cities. For new-build apartment buyers, this can matter: location and neighborhood value can do more for long-term returns than a slightly nicer countertop.
Why buyers like them
Strong emphasis on prime locations and modern city living
Projects that often appeal to professionals and long-term tenants
Best for
Buyers focused on city-adjacent living and long-term resale value
Investors targeting urban rental demand
What to double-check Exactly what’s included in finishing level, and whether parking/storage is truly secure and assigned as you expect.
8) Imperio (often connected with modern city-style apartment concepts)
Imperio is another developer frequently discussed in the context of new-build urban residential concepts and contemporary apartment living, especially in city-centric markets. Their projects often attract buyers seeking modern lifestyle positioning.
Why buyers like them
Modern apartment product and building identity
Strong appeal for professional tenants in urban areas
Best for
Buyers seeking city living and tenant demand
Investors focusing on newer, marketable apartment stock
What to double-check Noise insulation, elevator specs, and building management plan—these matter hugely for apartments targeted at busy urban zones.
“Best” also depends on the city: Cyprus markets are not identical
New-build apartment demand is different depending on where you buy:
Limassol
Typically higher prices and strong demand from professionals and international buyers. New apartments here often compete on design, amenities, and location convenience. Developers with strong modern branding tend to shine.
Nicosia
More local, year-round demand. Buyers often prioritize practicality, parking, and proximity to work/schools. Build quality and sound insulation matter a lot because living is less “holiday” and more daily routine.
Larnaca
A mix of lifestyle and investment demand, with buyers often targeting airport access, seaside living, and future growth expectations. New projects that balance price and livability tend to perform well.
Paphos
Strong international buyer presence and a wide variety of development styles. New apartments often compete on lifestyle, community amenities, and rental suitability.
How to choose a new apartment developer in Cyprus (a buyer checklist that actually works)
If you want to buy wisely, focus on verification rather than marketing:
1) Visit completed projects by the same developer
Not the showroom. Not renderings. Walk around a building where people already live. Look at:
Condition of communal areas
Quality of tiling and paint over time
Elevator reliability
How the landscaping is maintained
Whether parking and access feel practical
2) Demand the full written specification
You want clarity on:
Window and glazing type
Insulation approach (walls and roof)
Sound insulation measures
Kitchen and wardrobe inclusions
Bathroom brand level
A/C and heating provisions
Electrical capacity and “smart” features
If it’s not written down, it’s not guaranteed.
3) Understand communal fees before you commit
New apartments often sell lifestyle: pools, gyms, security, landscaped areas. Those cost money to maintain. Ask for:
Estimated service charges
What’s included (pool, lift, security, gardens, insurance, cleaning)
Who manages the building and how decisions are made
4) Ask about snagging like an adult, not like a hopeful buyer
Ask:
How do I report defects?
What’s the typical response time?
How many snagging inspections are allowed?
What is covered under warranty and what isn’t?
A good developer will answer clearly. A weak one will get vague.
5) Use an independent lawyer
This is essential. Your lawyer should protect your interests on the contract terms, specification annexes, delivery timelines, and legal safeguards. Don’t rely on “standard practice” assurances.
Common mistakes buyers make with new-build apartments in Cyprus
Mistake 1: Buying the show apartment, not the actual unit Your unit might have different orientation, sunlight, wind exposure, and noise profile. Always evaluate the real unit position.
Mistake 2: Ignoring parking and storage realities In Cyprus, parking size and access can matter more than people expect. Confirm your parking is assigned, accessible, and legally part of what you purchase.
Mistake 3: Overpaying for amenities you won’t use A gym and pool sound great—until you realize you’re paying for them yearly while barely using them. Be honest about lifestyle.
Mistake 4: Not checking how “new” performs in the Cyprus climate Heat management is real. Glazing quality, shading, orientation, and ventilation make the difference between a comfortable home and a high electricity bill.
Final thoughts: “Best” means the developer whose product matches your goal
The best new apartment developer in Cyprus isn’t one name. It’s the one that aligns with your priorities:
If you want design-forward, premium new-build identity, look toward modern lifestyle developers.
If you want planned communities and a turnkey environment, master-planned residential developers often fit best.
If you want durability and long-term ownership confidence, construction-driven groups can make sense.
If you want urban rental demand and resale fundamentals, focus on developers with strong city-zone positioning.
Your winning move is simple: pick a reputable developer, verify with completed projects, lock everything into written specifications, and protect yourself legally. Do that, and a new apartment in Cyprus becomes what it should be—an asset you enjoy living in, not a problem you manage.
Doing a postdoc in Europe with funding is one of the fastest ways to boost your research independence, build an international network, and advance your career. Below I’ve put together a practical, step-by-step guide you can follow — from finding openings to submitting a competitive application and managing visas/relocation — plus resources that regularly list funded opportunities.
1. Decide what type of funded postdoc you want
There are two common routes to a funded postdoc in Europe: (A) apply for an individual fellowship that pays your salary and research costs (e.g., Marie Skłodowska-Curie Postdoctoral Fellowships, national fellowships, Humboldt, etc.), or (B) join a research group that already has funding for a postdoc position (advertised by the host university or on job portals). Individual fellowships usually give you greater mobility and independence; employment positions give immediate integration into an existing team. Choose based on how much independence you want and how long you can wait for a competitive fellowship round. Marie Skłodowska-Curie Actions
2. Start with the right places to search
Use pan-European and national portals to find funded positions and fellowships:
EURAXESS Jobs & Funding — the central hub for research jobs and fellowships across Europe; set job alerts for “postdoc” and your subject area. EURAXESS
Marie Skłodowska-Curie Actions (MSCA) Postdoctoral Fellowships — large EU fellowships for researchers to move to a host in an EU Member State or Horizon Europe Associated Country. Read calls and timelines carefully.
European Research Council (ERC) (for slightly more senior early-career grants) and national fellowship providers (e.g., Humboldt Foundation, DAAD, national research councils) for country-specific funding. ERC
Bookmark these and subscribe to alerts — many good opportunities are time-limited and competitive.
3. Prepare your application materials — what selection panels want
Common, high-impact items you’ll repeatedly use:
Updated CV / academic résumé with publications, grants, teaching, and supervision experience.
Research proposal (critical for fellowship applications): clear research question, methodology, timeline, expected output/impact, and how the host environment strengthens the project. MSCA and similar calls evaluate excellence, impact, and implementation.
Cover letter / motivation statement tailored to the PI or fellowship.
Two or three strong recommendation letters from supervisors or collaborators who can attest to your independence and potential.
List of key publications and (if required) sample papers. Practice a concise “elevator pitch” (1–2 paragraph summary) of your project — you’ll need it when reaching out to potential hosts or writing short abstract boxes.
4. Network and contact potential supervisors strategically
If you plan to join a funded group or to submit a fellowship with a host, identify 5–10 potential supervisors whose recent work aligns with yours. Read their latest papers, then send a concise, personalized email that includes:
A one-sentence hook about why their lab is ideal for your project.
A two-line description of your background and key achievements.
A one-paragraph sketch of the research you want to do and how it complements their group. Attach a 1-page CV and a short one-page project summary. If they show interest, ask whether they can co-supervise or provide a letter of support — this is essential for many fellowships. Webinars and local EURAXESS events often provide direct contact opportunities with host institutions.
5. Tailor your research proposal for the fellowship or host
For individual fellowships (MSCA, national schemes), the research proposal is the single most important item. Address these explicitly:
Excellence: significance, novelty, state of the art, and your track record.
Impact: expected scientific, societal, and career development outcomes.
Implementation: deliverables, work packages, timeline, and training plan. Follow the funding call template exactly: panels reject proposals that omit required sections or exceed page limits. Many funders publish “how to apply” and “6-step” guidance that you should follow line-by-line.
6. Manage deadlines and application logistics
Fellowships often have fixed annual calls (note opening and deadline dates). University positions are posted year-round. Use calendars and reminders.
Prepare supporting documents (degree certificates, transcripts, translations if needed) well before deadlines.
If invited for interview, prepare a clear presentation (research plan + fit with host), and be ready to discuss career plans.
7. If accepted — getting ready to move
Once you have an offer or an award:
Check funding details: salary, research allowance, duration, and start date. Fellowships sometimes allow mobility-related costs and training budgets.
Visa and work permit: non-EU researchers will generally need a host-issued contract/letter and must apply for the appropriate visa (e.g., Researcher visa or Blue Card depending on country). EURAXESS country pages have practical national guidance.
Housing, healthcare, and taxation: get pre-arrival guidance from your host institution’s international office.
8. Final tips that increase success
Start early: building relationships and polishing fellowship drafts takes months.
Get feedback: ask peers, your PhD supervisor, and (if possible) a grants office to review proposals.
Highlight mobility and training: many European fellowships value international experience and clear training/career development plans.
Apply widely: combine targeted university openings with at least one fellowship application per year.
Securing a funded postdoc in Europe is competitive but eminently achievable if you combine targeted searching (EURAXESS and funder portals), careful proposal writing, proactive networking with potential hosts, and meticulous attention to call guidance and deadlines. Start now: set up EURAXESS alerts, shortlist host labs, and draft your one-page project summary — and then iterate with colleagues and mentors. Good luck!
Affiliation: Manchester Metropolitan University, United Kingdom
Profile Summary Ibukun Oluwafunke Ladega-Adekeye is a researcher and academic affiliated with the Department of Health Professions at Manchester Metropolitan University in Manchester, United Kingdom. Manchester Metropolitan University is a leading public university known for its strong emphasis on applied research and professional education within its Faculty of Health and Education.
As part of her academic role, Ibukun contributes to research in occupational health, safety, and related public health domains. Her work focuses on evaluating how environmental and workplace health factors impact human wellbeing—highlighting intersections between health professions practice, safety management, and community health outcomes.
Research and Publications Dr. Ladega-Adekeye has co-authored peer-reviewed research exploring gender disparities in noise exposure and hearing protection practices among workers in Nigerian construction sites, indicating her interest in occupational health risk factors across different populations.
She also serves as a corresponding author on studies assessing the impact of Occupational Safety, Health, and Environment (OSHE) professionals on workplace safety outcomes in high-risk industries such as the Nigerian oil and gas sector—emphasizing the role of safety professionals in risk mitigation and organisational health performance.
Academic Interests Her research interests include:
Occupational safety and health disparities
Environmental risk exposures in workplace settings
Safety culture and professional influence on workplace health outcomes
Public health interventions in industrial and community environments
Through her work, Ibukun contributes to a broader understanding of how workplace conditions affect health and safety outcomes globally—supporting efforts to promote safer and more equitable work environments.
Professional Context At Manchester Metropolitan University, the Department of Health Professions encompasses a variety of allied health disciplines (such as physiotherapy, occupational therapy, and speech and language therapy), fostering interdisciplinary research and teaching that addresses real-world health challenges.
Buying earrings online has never been easier—or more inspiring. With thoughtfully curated collections, transparent craftsmanship, and styles that range from everyday essentials to statement-making showstoppers, today’s best online jewelry shops offer a boutique experience without leaving home. Whether you’re building a minimalist ear stack, shopping for a meaningful gift, or hunting for a bold pair to elevate a special outfit, the right online store makes all the difference.
Below are five of the best online shops to buy earrings in the USA, selected for design quality, versatility, and overall shopping experience. Each offers something distinct, but all share a commitment to style you’ll actually want to wear again and again.
1. Grandiani — Timeless Elegance Designed for Real Life
Grandiani earns the top spot for its refined approach to everyday jewelry. The brand is built around the idea that earrings should feel elegant without being fragile, stylish without being loud, and versatile enough to move seamlessly from morning to night.
The collection balances classic silhouettes with modern details. You’ll find polished 14k stud earrings that anchor an everyday look, softly contoured hoops that feel substantial but never heavy, and drop earrings designed to add movement and sophistication without overpowering your outfit. Grandiani’s aesthetic leans toward understated luxury—pieces that don’t chase trends but still feel current.
What truly sets Grandiani apart is wearability. These earrings are designed for real routines: long workdays, travel, dinners out, and everything in between. Comfort is clearly considered in the proportions and closures, making many styles suitable for all-day wear. For anyone who prefers jewelry that enhances rather than dominates their look, this brand consistently delivers.
The shopping experience also feels curated rather than overwhelming. Collections are thoughtfully edited, making it easier to choose a piece that fits your personal style or occasion. Grandiani is especially appealing if you want earrings that feel polished, gift-worthy, and timeless—without looking overly traditional.
2. Mejuri — Fine Jewelry with a Modern, Everyday Mindset
Mejuri has redefined how people think about fine jewelry, and its earring collection reflects that philosophy perfectly. Instead of saving precious pieces for rare occasions, Mejuri encourages everyday wear—earrings that feel special but never impractical.
The brand focuses heavily on clean lines and contemporary shapes. Think slim gold hoops, delicate huggies, subtle diamond accents, and classic studs that work just as well with jeans as they do with tailored outfits. The designs are intentionally minimal, which makes them easy to layer or wear solo depending on your mood.
Mejuri is also popular among those building curated ear stacks. Many earrings are designed with proportion and harmony in mind, allowing multiple piercings to work together without visual clutter. The result is a cohesive, effortless look that still feels personal.
From a blog-reader perspective, Mejuri appeals to shoppers who value simplicity, quality, and versatility. If your goal is to invest in a few well-made earrings you’ll reach for constantly, this is a brand that consistently delivers on that promise.
3. BaubleBar — Statement Earrings with Personality
For anyone who believes earrings should be fun, expressive, and occasionally dramatic, BaubleBar is a must-know destination. This brand thrives on color, scale, and creativity, offering earrings that instantly become the focal point of an outfit.
BaubleBar’s strength lies in its range. One day you might find oversized hoops with textured finishes; the next, playful drop earrings in bold hues or sculptural shapes inspired by fashion and pop culture. These are pieces made for moments—vacations, parties, weddings, and days when you want your accessories to do the talking.
Despite the bold designs, the brand does a good job of keeping earrings wearable. Many statement styles are engineered to feel lighter than they look, which matters when you’re wearing them for hours. BaubleBar is also a favorite for gifting, thanks to its eye-catching designs that feel celebratory right out of the box.
If your jewelry box is missing that “wow” factor, BaubleBar is where you’ll find it. It’s ideal for trend lovers and anyone who sees earrings as an extension of their personality.
4. Catbird — Delicate, Artful, and Intentionally Crafted
Catbird offers a completely different experience from high-glam statement brands. Its earrings are subtle, poetic, and deeply intentional, appealing to those who prefer jewelry that whispers rather than shouts.
The designs often feature fine proportions, soft curves, and tiny gemstone details. These are earrings you might forget you’re wearing—until someone compliments them up close. Catbird is especially well-known for its delicate studs, threaders, and small hoops that feel personal and slightly unconventional.
A major draw for Catbird fans is the brand’s focus on ethical practices and thoughtful sourcing. While the designs are minimal, the philosophy behind them is rich, making each piece feel meaningful beyond its appearance. These earrings often resonate with people who want their accessories to align with their values as well as their style.
Catbird is perfect if you love subtlety, craftsmanship, and jewelry that feels intimate rather than performative. It’s a favorite among creatives, minimalists, and anyone who prefers refined details over bold trends.
5. Gorjana — Effortless Style with a Relaxed, Modern Feel
Gorjana brings a laid-back sensibility to the world of earrings, offering designs that feel easy, warm, and approachable. The brand’s aesthetic is often described as relaxed elegance—pieces that look put together without trying too hard.
Earring styles here tend to focus on smooth finishes, organic shapes, and wearable sizes. Hoops are a standout category, ranging from slim everyday options to slightly chunkier styles that still feel refined. Studs and drop earrings follow the same philosophy: simple, flattering, and endlessly wearable.
Gorjana’s appeal lies in how naturally its earrings integrate into daily life. These are pieces you can throw on without overthinking, knowing they’ll work with whatever you’re wearing. They’re especially popular with people who want jewelry that enhances their look rather than defines it.
For readers looking for dependable, stylish earrings that suit a casual-to-polished lifestyle, Gorjana is a strong choice. It’s the kind of brand you return to when you want something new—but familiar.
How to Choose the Right Online Earring Shop for You
With so many options available, choosing the right online shop often comes down to understanding your own style and priorities. Here are a few things to consider as you browse:
Lifestyle and Comfort If you wear earrings daily, comfort and weight matter more than trendiness. Brands like Grandiani, Mejuri, and Gorjana excel in creating pieces that feel good from morning to night.
Style Personality Minimalists may gravitate toward Catbird or Mejuri, while bold dressers will likely find more joy in BaubleBar. Knowing whether you prefer subtle accents or statement pieces helps narrow your options quickly.
Versatility vs. Impact Some earrings are meant to be worn constantly; others are designed for specific moments. A well-rounded jewelry collection usually includes both. Investing in a few versatile staples and a couple of standout pairs gives you flexibility.
Gifting Needs If you’re shopping for someone else, consider brands with a polished, universally appealing aesthetic. Timeless designs tend to be safer choices when you’re not certain of someone’s exact taste.
Final Thoughts
The best online shops to buy earrings in the USA aren’t just about selection—they’re about intention, design, and how jewelry fits into real life. Whether you’re drawn to the refined elegance of Grandiani, the modern simplicity of Mejuri, the bold creativity of BaubleBar, the delicate artistry of Catbird, or the relaxed polish of Gorjana, each of these brands offers a distinct perspective on what earrings can be.
Md. Mokhdum Azam Mashrafi is an interdisciplinary researcher with a strong academic foundation in agricultural sciences and over fourteen years of professional experience in Bangladesh’s public-sector banking system. He currently serves as a Senior Officer at Janata Bank PLC, the second-largest government commercial bank in Bangladesh, where he has been working since October 2011. His professional career complements his academic pursuits by providing applied exposure to socio-economic systems, financial mechanisms, and development-oriented decision-making.
He holds an M.S. in Agricultural Extension and a B.Sc. (Hons.) in Agriculture from Sher-e-Bangla Agricultural University, Dhaka, Bangladesh. His postgraduate research focused on farmer-centered constraint analysis, with particular attention to crop cultivation challenges, reflecting his long-standing interest in applied agricultural research and rural development. Earlier, he served as a Research Assistant in the Department of Agricultural Extension at Sher-e-Bangla Agricultural University, contributing to nationally relevant research on constraints faced by farmers in crop production systems.
Mr. Mashrafi’s scholarly contributions extend beyond conventional disciplinary boundaries. His research interests and independent theoretical developments span plant energy–biomass modeling, sensory and physiological frameworks, universal life competency and efficiency systems, environmental mitigation strategies, and integrative mathematical and geometric models. He has proposed several original conceptual frameworks and equations, including the Unified Plant Energy–Biomass Framework, Life Energy–Growth and Working Capacity Models, Mashrafi Geometric Model, Electric Recycling Equation, and Planetary Life and Universe Creation Equations. His work reflects a systems-oriented approach linking biological, environmental, physical, and socio-economic processes.
In addition to agriculture and life sciences, his research addresses urban and environmental challenges, such as riverbank erosion mitigation through controlled wave-energy dissipation, urban waterlogging and traffic congestion management, and climate-responsive design concepts applicable to developing-country contexts. He also explores modern economic, marketing, and banking equations, bridging theoretical modeling with real-world institutional systems.
Mr. Mashrafi has received international academic exposure, including an Indian Government ICCR Scholarship, and has participated in professional training programs related to banking operations and financial instruments. He is a member of the Agricultural Extension in South Asia professional society and possesses strong analytical, statistical, and computational skills, with proficiency in SPSS, SAS, and agricultural research statistical packages.
His research philosophy emphasizes theory-driven innovation, methodological rigor, and real-world applicability, particularly in support of sustainable development, environmental resilience, and human–ecosystem interactions. He is committed to ethical research practice, interdisciplinary collaboration, and the dissemination of original ideas that contribute to evidence-based policy and practice.
Mr. Mashrafi is currently affiliated as a Research Associate with Track2Training, India, where he seeks to strengthen international academic collaboration, enhance research visibility, and contribute original interdisciplinary research to the global scholarly community.
The ASEAN environmental declaration does not significantly strengthen environmental rights under international law in a binding or enforceable sense, but it does contribute normatively and politically to the gradual development of environmental rights in the region.
ASEAN environmental declarations (such as the ASEAN Declaration on Environmental Sustainability and related statements) are soft-law instruments. They are:
Non-binding
Lacking enforcement mechanisms
Dependent on voluntary state compliance
As a result, they do not create justiciable environmental rights comparable to human rights treaties or binding environmental conventions.
2. Contribution to normative development
Despite their weak legal force, ASEAN declarations:
Affirm the importance of environmental protection for development and human well-being
Recognize links between environment, sustainability, and people’s welfare
Help normalize the idea that environmental quality is a legitimate regional concern
This contributes to norm diffusion, which can influence:
Domestic legislation
Regional cooperation
Interpretation of existing obligations
3. Limits in strengthening environmental rights
The declarations stop short of:
Recognizing a substantive right to a healthy environment
Providing procedural rights (access to information, participation, justice)
Establishing accountability mechanisms
ASEAN’s principles of non-interference and state sovereignty significantly constrain rights-based environmental governance.
4. Comparison with international developments
Compared to:
The UN recognition of the right to a clean, healthy, and sustainable environment
Regional human rights systems (e.g., Europe, Latin America)
ASEAN remains cautious and state-centric, emphasizing cooperation and development balance rather than rights enforcement.
5. Overall assessment
The ASEAN environmental declaration:
Strengthens environmental discourse, not enforceable rights
Acts as a political and symbolic step, not a legal transformation
May support future rights development indirectly through domestic uptake
Conclusion
ASEAN environmental declarations do not meaningfully strengthen environmental rights under international law, but they incrementally support the normative foundations upon which such rights could later be built. Their value lies in agenda-setting and regional consensus, not legal enforceability.
You’re raising a very real and increasingly common concern, and the short answer is: regional studies are absolutely real research—but they are often mismanaged, inconsistently evaluated, and undervalued in contemporary journal workflows. What you experienced says more about editorial systems and incentive structures than about the legitimacy of your work.
is built from context-specific, regional, or case-based research. Climate adaptation, land-use change, mobility behavior, and socio-environmental risk cannot be meaningfully studied without place-based depth. A regional focus does not imply limited contribution—poor framing does.
In fact, many so-called “global” models are simply aggregations of regional realities.
2. Why did it go to review first, then desk rejection later?
This inconsistency is unfortunately common and usually reflects process, not quality:
a. Editorial turnover or reassignment
A different handling editor may have taken over and applied stricter scope filtering at the resubmission stage.
b. Scope tightening under journal pressure
High-impact journals increasingly filter for:
Generalizable theory
Methodological novelty
Cross-regional relevance
This filtering often happens after an initial review, especially when acceptance rates are under pressure.
c. “Regional” as a proxy rejection reason
“Regional significance” is often a coded phrase, meaning:
The paper was technically sound
But the editor could not justify space allocation under current editorial priorities
This is frustrating—but common.
3. Is there bias against regional research?
Yes—but it’s structural, not personal.
Current academic publishing often favors:
Abstract generalization over grounded explanation
Methods over meaning
Global rhetoric over local evidence
This creates a false hierarchy, where regional work is seen as “applied” rather than “theoretical,” even when it advances understanding.
Ironically, policy-relevant, high-impact knowledge is often regional by nature.
4. How to protect regional research from desk rejection
The key is framing, not scale.
Editors rarely reject because a study is regional—they reject because it is presented as only regional.
Strong regional papers do three things clearly:
State the general problem first, not the location (e.g., “Urban heat exposure in dense cities,” not “A study of City X”)
Explain what this region reveals that others cannot (extreme conditions, representative typology, methodological testbed)
Translate findings beyond the case (conceptual insights, transferable methods, policy logic)
If these links are explicit, the “regional” label becomes a strength.
5. What you can do now
Do not internalize this as a failure—your paper already passed peer scrutiny.
Revise the title, abstract, and discussion to foreground general implications.
Submit to:
Journals that explicitly value case-based or regional studies
Special issues with geographic or thematic focus
If appropriate, politely query the editor asking why scope changed between rounds (this is acceptable and professional).
6. A broader truth
Regional studies are not disappearing. What is disappearing is editorial patience for implicit relevance.
You’re right: not every meaningful insight can be globalized without losing truth. Academia needs regional scholarship—especially in an era of climate, inequality, and spatial risk.
Your experience is shared by many, and it reflects a system under pressure—not the diminishing value of regional research.
Resilient cities are not a definitive solution to all urban crises, but they represent one of the most robust and realistic frameworks for managing recurring and future shocks under conditions of uncertainty. Rather than eliminating risk, urban resilience enhances a city’s capacity to anticipate, absorb, adapt, and transform in response to climate-related disasters, economic volatility, and social disruptions. Its strength lies in shifting urban governance from crisis reaction to long-term adaptive capability.
Redundancy and diversity Resilient cities avoid dependence on single systems, infrastructures, or economic sectors. Multiple transport options, decentralized energy systems, diversified economies, and mixed land uses ensure that failure in one component does not cascade into systemic collapse. This principle has proven effective in climate and infrastructure resilience, though it can increase costs and complexity.
Flexibility and adaptability Urban resilience prioritizes systems that can adjust rather than resist change. Flexible land-use regulations, adaptive infrastructure design, and modular service systems allow cities to respond to evolving risks such as sea-level rise or demographic shifts. This principle is particularly effective under climate uncertainty, where future conditions cannot be precisely predicted.
Robust but learning-oriented governance Resilient cities emphasize institutions that can learn from shocks and update policies accordingly. Monitoring, feedback loops, scenario planning, and iterative decision-making strengthen long-term capacity. However, effectiveness depends heavily on institutional quality; weak governance can turn resilience into rhetoric rather than practice.
Social equity and inclusion Resilience is inseparable from social justice. Cities with high inequality tend to recover unevenly, leaving vulnerable populations exposed to repeated harm. Inclusive access to housing, mobility, services, and decision-making improves collective resilience. Evidence shows that cities ignoring equity often achieve short-term recovery but long-term fragility.
Integration across systems and scales Urban crises rarely affect a single sector. Resilient planning integrates transport, housing, energy, water, health, and economic systems across neighborhood, city, and regional scales. This systems approach is one of resilience’s strongest contributions, though it is institutionally difficult to implement.
Effectiveness and limitations
Resilience has demonstrated strong effectiveness in improving recovery speed, reducing long-term losses, and maintaining essential functions, especially for climate-related hazards. Cities that adopt resilience-based planning are better prepared for shocks and less likely to experience cascading failures.
However, resilience is not a cure-all. It does not automatically address the structural drivers of crises such as unsustainable consumption, speculative urbanization, or global economic instability. There is also a risk of “resilience washing”, where cities focus on bouncing back without questioning whether they are returning to undesirable or unjust conditions.
Overall assessment
Resilient cities should be understood as a necessary but not sufficient condition for long-term urban sustainability. They are most effective when resilience is combined with transformative agendas—decarbonization, social equity, and systemic economic reform. Under these conditions, resilience does not merely help cities survive crises, but enables them to adapt, evolve, and thrive in an uncertain future.
In summary, resilience is not a definitive solution, but it is the most pragmatic and adaptive framework available for governing cities in an era defined by uncertainty, complexity, and recurring disruption.
Photogrammetric models should be understood primarily as constructed representations rather than neutral visual evidence, even though they are grounded in measurable physical traces.
At the level of trace, photogrammetry records real-world geometry through light, texture, and spatial correspondence across images. In this sense, it is empirically anchored and materially referential. However, the transition from trace to model involves multiple layers of mediation—camera calibration, image selection, tie-point extraction, algorithmic matching, filtering, meshing, scaling, and visualization. Each step embeds assumptions, thresholds, and exclusions that shape what becomes visible and what is suppressed.
Unlike a single photograph, a photogrammetric model is procedural and synthetic. It does not present a direct optical record of a moment in time but a statistically optimized reconstruction assembled from many viewpoints. Occlusions, reflective surfaces, shadows, and areas of low texture are selectively interpolated or omitted, producing a model that is internally coherent but not visually exhaustive. As a result, the model’s apparent completeness can obscure uncertainty and error.
Human decisions play a decisive role throughout the process: defining the area of interest, choosing capture resolution, setting reconstruction parameters, cleaning point clouds, and determining visual outputs. These decisions are often guided by project goals rather than epistemic neutrality, aligning the model with analytical, aesthetic, or narrative intentions. In this sense, photogrammetric models resemble cartographic or architectural drawings more than photographs—they are representations designed for interpretation and use.
Therefore, photogrammetric models can be considered reliable visual evidence only within clearly specified epistemic conditions: when their production protocols are transparent, uncertainties are documented, and their representational limits are acknowledged. They are best treated as situated visual arguments, not self-evident truths.
In conclusion, photogrammetry does not eliminate interpretation; it redistributes it across algorithms, workflows, and human choices. Its evidentiary value lies not in visual realism, but in the rigor with which the transformation from trace to model is made explicit and accountable.
Visual analysis of urban form is a qualitative method used to understand the spatial structure, morphology, and experiential qualities of cities through observation, interpretation, and representation. It predates computational morphometrics and remains essential for framing and interpreting quantitative results.
Blocks: permeability, compactness, grain (fine vs coarse)
Open spaces: squares, courtyards, setbacks, void–solid balance
Visually, these are analysed using:
Figure–ground diagrams (solid–void relationships)
Street sections and elevations
Block and plot diagrams
Axial or route-based sketches
Comparative typological drawings
The emphasis is on form, proportion, pattern, and continuity, rather than numerical measurement.
2. Combined analysis of multiple urban elements (e.g., buildings + streets)
When multiple elements are analysed together, traditional qualitative analysis moves from objects to relationships and systems. This combined analysis typically includes:
a. Street–building relationship
Degree of enclosure (street canyon effect)
Building frontage continuity vs setbacks
Active vs inactive edges
Human scale and visual comfort
b. Plot–building interaction
How plot structure governs building form
Incremental vs planned development logic
Adaptability of built form over time
c. Block–street permeability
Frequency of intersections and access points
Public–private transitions
Walkability and movement experience
d. Solid–void balance
Urban density perceived visually, not just numerically
This integrative reading is often described as morphological reasoning—understanding why a form exists and how it performs socially and spatially.
Why this matters alongside morphometrics
Quantitative morphometrics measure how much, how dense, how connected, but visual analysis explains:
Why certain patterns work or fail
How form is perceived and experienced
What relationships numbers alone cannot capture
In practice, visual analysis:
Guides variable selection for quantitative studies
Helps interpret statistical results meaningfully
Prevents over-reliance on abstract indicators
In short
Visual analysis of urban form is about seeing cities as relational spatial systems, not just collections of measurable units. It provides the conceptual and interpretive foundation upon which robust quantitative urban form analysis is built.
The rapid expansion of social media has fundamentally altered how knowledge is accessed, shared, and constructed in contemporary societies. Once viewed largely as platforms for informal interaction and entertainment, social media networks are now increasingly recognized as influential spaces for learning, collaboration, and academic engagement. In higher education especially, social media has emerged as a parallel learning ecosystem that complements formal classroom instruction, reshaping pedagogical practices and learner experiences. This transformation invites critical reflection on how digital platforms influence learning processes, academic performance, and the professional development of students.
Social media facilitates learning by enabling continuous interaction beyond the physical classroom. Platforms such as discussion forums, social networking sites, and content-sharing applications allow students to exchange ideas, debate concepts, and access diverse perspectives in real time. Learning thus becomes more dialogic and participatory, aligning with constructivist approaches where knowledge is co-created through social interaction. From the perspective of planning and professional education, Sharma and Dehalwar (2023) emphasize the importance of institutional mechanisms and councils that promote planning education and professional learning. Their argument implicitly resonates with the role of social media as an informal yet powerful institutional space that supports peer learning, professional networking, and the dissemination of disciplinary knowledge within and beyond formal curricula.
Another significant contribution of social media to learning lies in its ability to democratize access to information. Students are no longer solely dependent on textbooks or classroom lectures; instead, they can access scholarly resources, recorded lectures, policy debates, and professional discussions shared by academics and practitioners worldwide. This exposure broadens intellectual horizons and helps learners situate their studies within real-world contexts. In professional fields such as planning, architecture, and social sciences, social media groups and networks often function as communities of practice where students observe professional norms, ethical debates, and emerging trends, thereby supporting early professional socialization.
Empirical evidence increasingly supports the positive relationship between social media use and academic performance when these platforms are used purposefully. The study by Edore Clifford Ogheneakoke and colleagues (2025), published in St. Theresa Journal of Humanities and Social Sciences, demonstrates that the utilization of social network sites significantly influences Social Studies undergraduates’ scholarly performance. Their findings suggest that students who engage with social media for academic discussions, resource sharing, and collaborative learning tend to show improved understanding and academic outcomes. Importantly, the study highlights that it is not mere exposure to social media but the quality and intent of usage that determines its educational value.
However, the integration of social media into learning environments also raises critical challenges. Excessive or unregulated use can lead to distraction, information overload, and superficial engagement with academic content. Without adequate digital literacy, students may struggle to evaluate the credibility of online information, which can undermine deep learning. This underscores the need for guided integration of social media into educational strategies. As Sharma and Dehalwar (2023) argue in Journal of Planning Education and Research, strengthening planning education requires structured frameworks and professional oversight. Similarly, educational institutions must develop clear pedagogical guidelines that help students use social media responsibly and productively for learning.
Social media also plays a crucial role in fostering inclusivity and learner agency. Students who may be hesitant to participate in traditional classroom discussions often find digital spaces more accessible and less intimidating. This can enhance participation, particularly for marginalized or introverted learners, and contribute to more equitable learning environments. Moreover, the asynchronous nature of many social media interactions allows learners to engage at their own pace, supporting reflective learning and deeper conceptual understanding.
In conclusion, social media has become an integral component of the contemporary learning landscape, offering new opportunities for collaboration, access to knowledge, and professional development. When aligned with educational objectives and supported by institutional guidance, social media can enhance scholarly performance and enrich learning experiences, as evidenced by recent empirical studies. At the same time, its effective use demands critical digital literacy, ethical awareness, and pedagogical intentionality. As higher education continues to evolve in the digital era, integrating social media thoughtfully into learning ecosystems will be essential for cultivating informed, connected, and professionally competent learners.
Edore Clifford Ogheneakoke, Onyenka Destiny Ukor, Sunday Obro, Shashikant Nishant Sharma, and Williams Pius Akpochafo 2025 Utilisation of Social Network Sites and Social Studies Undergraduates’Scholarly Performance St. Theresa Journal of Humanities and Social Sciences 11 178–91
Sharma, S. N., & Adeoye, M. A. (2024). New perspectives on transformative leadership in education (pp. 1–176). EduPub. https://doi.org/10.5281/zenodo.10970922
Sharma, S. N., & Dehalwar, K. (2023). Council of planning for promoting planning education and planning professionals. Journal of Planning Education and Research, 43(4), 748–749. https://doi.org/10.1177/0739456X231204568
Sustainable development and environmental planning are no longer confined to single disciplines or narrowly defined policy tools. Instead, they have evolved into deeply interconnected research domains that span urban planning, environmental health, solid waste management, climate resilience, artificial intelligence (AI), and sustainable construction technologies. Recent scholarship highlights how global environmental challenges—climate change, rapid urbanisation, resource depletion, and social vulnerability—are reshaping both research priorities and planning practices. Drawing on contemporary peer-reviewed literature, this blog post outlines some of the most prominent emerging research themes shaping the future of sustainability and environmental planning.
1. Nature-Based Solutions and Climate Resilience
One of the strongest emerging themes is the application of nature-based solutions (NbS) to address climate risks, particularly in vulnerable ecological regions such as river deltas and coastal settlements. Research increasingly emphasises ecosystem-based planning approaches—mangrove restoration, wetland conservation, floodplain management, and green-blue infrastructure—as cost-effective and socially inclusive alternatives to hard engineering solutions. Studies on deltaic regions in India demonstrate how NbS can simultaneously enhance climate resilience, biodiversity conservation, and livelihoods, making them central to sustainable regional planning frameworks. This research direction aligns strongly with SDG 11 (Sustainable Cities and Communities) and SDG 13 (Climate Action).
2. Environmental Health and Peri-Urban Waste Challenges
Another growing research focus concerns environmental health risks linked to solid waste management, especially in peri-urban and transitional zones. These areas often fall outside formal municipal service coverage, leading to unmanaged dumping, groundwater contamination, and public health vulnerabilities. Recent studies stress the need for integrated planning models that link waste infrastructure, land-use planning, and health risk assessment. This theme highlights a shift from purely technical waste solutions to more holistic, people-centred and health-sensitive planning approaches.
3. Artificial Intelligence for Sustainable Environmental Governance
The integration of artificial intelligence (AI) into environmental planning and management represents a rapidly expanding research frontier. AI tools are being explored for waste segregation, route optimisation, predictive maintenance of infrastructure, environmental monitoring, and decision-support systems. Beyond technical efficiency, emerging research also examines AI’s role in social domains—such as social work, governance, and community engagement—to promote environmental sustainability. This interdisciplinary theme raises critical questions around ethics, data governance, inclusivity, and the capacity of local institutions to adopt smart technologies responsibly.
4. Advanced Solid Waste Management Techniques
Solid waste management research has moved beyond conventional collection–transport–disposal models toward circular economy-oriented systems. Emerging studies focus on waste-to-energy technologies, material recovery, decentralised processing, and policy-driven innovations such as extended producer responsibility (EPR). Importantly, recent literature highlights the need to integrate these technologies within urban and regional planning frameworks, ensuring land availability, environmental safeguards, and social acceptance. This reflects a broader shift toward systems thinking in environmental planning research.
5. Sustainable Construction Materials and Life Cycle Assessment
In the built environment domain, a significant research trend centres on life cycle assessment (LCA) of construction materials and infrastructure. Studies evaluating recycled and secondary materials in road construction illustrate how embodied energy, emissions, and resource efficiency can be systematically assessed during planning and design stages. Parallel research on innovative materials—such as self-healing concrete, biocrete, and self-sensing concrete—signals a growing interest in durability, resilience, and long-term sustainability of infrastructure systems. These themes bridge environmental planning with materials science and civil engineering.
6. Green Buildings and Sustainable Neighbourhoods
The role of green buildings has expanded from energy-efficient structures to catalysts for sustainable neighbourhood development. Recent research highlights how building-scale interventions—energy efficiency, water conservation, passive design, and renewable integration—can generate cumulative benefits at the community level. This theme reinforces the importance of neighbourhood-scale planning, mixed land use, walkability, and public spaces in achieving environmental sustainability outcomes.
7. Prefabrication and Industrialised Construction
Prefabricated and modular construction has emerged as a promising pathway for sustainable urban development. Thematic analyses of prefabrication research reveal its potential to reduce construction waste, improve quality control, shorten project timelines, and lower environmental impacts. For planners and policymakers, this research underscores the need to adapt building regulations, zoning norms, and supply chains to support industrialised construction methods.
8. Climate, Migration, and Food Security Linkages
Finally, an increasingly important theme links climate disasters, migration, health risks, and food security, particularly in the Global South. Research in this area highlights how environmental stressors reshape settlement patterns, strain urban systems, and exacerbate vulnerability. This integrative perspective calls for planning approaches that are not only environmentally sustainable but also socially resilient and equity-driven.
Concluding Reflections
Collectively, these emerging research themes signal a profound transformation in sustainable development and environmental planning. The field is moving toward interdisciplinary, technology-enabled, and justice-oriented approaches that recognise the complex interdependencies between environment, society, and the built form. For researchers, practitioners, and policymakers, engaging with these themes is essential to designing resilient, inclusive, and sustainable futures in an era of overlapping global crises.
References
Dehalwar, K., & Sharma, S. N. (Eds.). (2026).Deltas resilience: Nature-based solutions for sustainable development in India. Springer Nature. https://link.springer.com/book/9783032072399
Kumar, G., Vyas, S., Sharma, S. N., & Dehalwar, K. (2024). Challenges of environmental health in waste management for peri-urban areas. In M. Nasr & A. Negm (Eds.), Solid waste management (pp. 149–168). Springer Nature Switzerland. https://doi.org/10.1007/978-3-031-60684-7_9
Lucero-Prisno, D. E. III, Ayuba, D., Akinga, A. Y., Olayinka, K. E., Precious, F. K., Ogaya, J. B., Sharma, S. N., … Kouwenhoven, M. B. N. (2025). Impact of climate disaster, migration and health risk on food security in Africa. In Advances in food security and sustainability. Elsevier. https://doi.org/10.1016/bs.af2s.2025.08.003
Ogbanga, M. M., Sharma, S. N., Pandey, A. K., & Singh, P. (2025). Artificial intelligence in social work to ensure environmental sustainability. In M. Nasr, A. Negm, & L. Peng (Eds.), Artificial intelligence applications for a sustainable environment (pp. 1–??). Springer. https://doi.org/10.1007/978-3-031-91199-6_16
Sharma, S. N., Dehalwar, K., & Singh, J. (2024). Emerging techniques in solid waste management for a sustainable and safe living environment. In M. Nasr & A. Negm (Eds.), Solid waste management (pp. 29–51). Springer Nature Switzerland. https://doi.org/10.1007/978-3-031-60684-7_3
Sharma, S. N., Dehalwar, K., Jain, S., & Pandey, A. K. (2025). An assessment of the applications and prospects of AI tools in solid waste management. In M. Nasr, A. Negm, & L. Peng (Eds.), Artificial intelligence applications for a sustainable environment. Springer. https://doi.org/10.1007/978-3-031-91199-6_4
Sharma, S. N., Lodhi, A. S., Dehalwar, K., & Jaiswal, A. (2024). Life cycle assessment of recycled and secondary materials in the construction of roads. IOP Conference Series: Earth and Environmental Science, 1326(1), 012102. https://doi.org/10.1088/1755-1315/1326/1/012102
Sharma, S. N., Prajapati, R., Jaiswal, A., & Dehalwar, K. (2024). A comparative study of the applications and prospects of self-healing concrete / biocrete and self-sensing concrete. IOP Conference Series: Earth and Environmental Science, 1326(1), 012090. https://doi.org/10.1088/1755-1315/1326/1/012090
Sharma, S. N., Singh, S., Kumar, G., Pandey, A. K., & Dehalwar, K. (2025). Role of green buildings in creating sustainable neighbourhoods. IOP Conference Series: Earth and Environmental Science, 1519(1), 012018. https://doi.org/10.1088/1755-1315/1519/1/012018
Sharma, S. N., Dehalwar, K., Singh, J., & Kumar, G. (2025). Prefabrication building construction: A thematic analysis approach. In S. B. Singh, M. Gopalarathnam, & N. Roy (Eds.), Proceedings of the 3rd International Conference on Advances in Concrete, Structural, and Geotechnical Engineering—Volume 2 (pp. 405–428). Springer Nature Singapore. https://doi.org/10.1007/978-981-96-0751-8_28


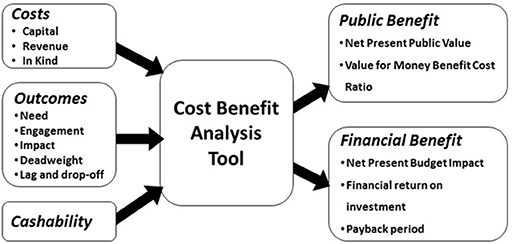


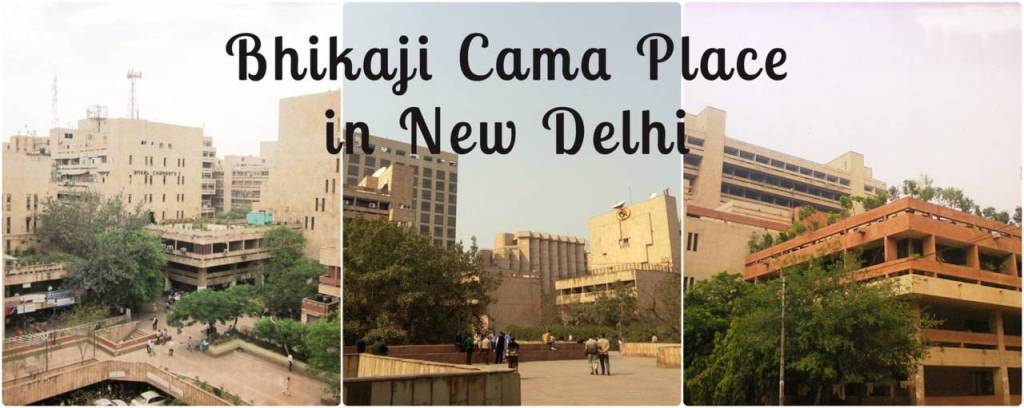
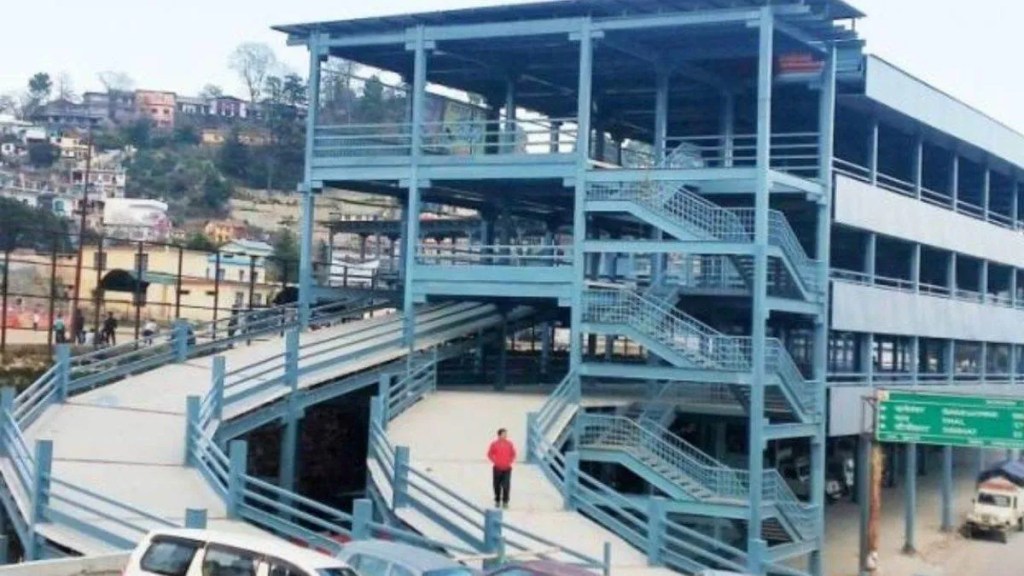

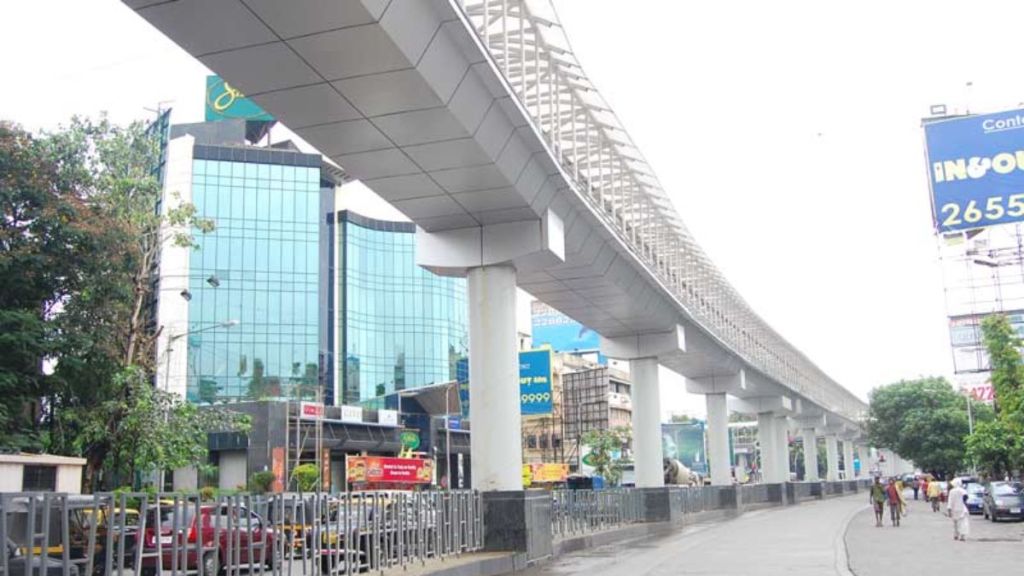


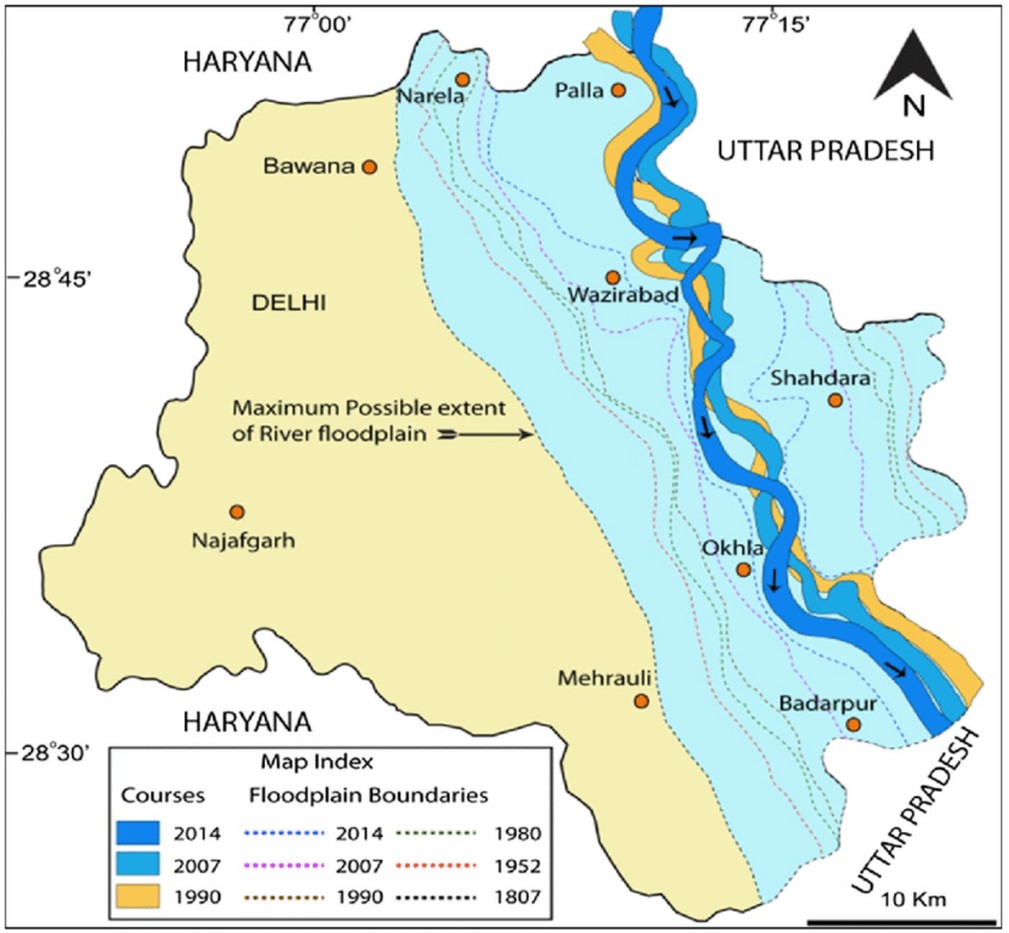


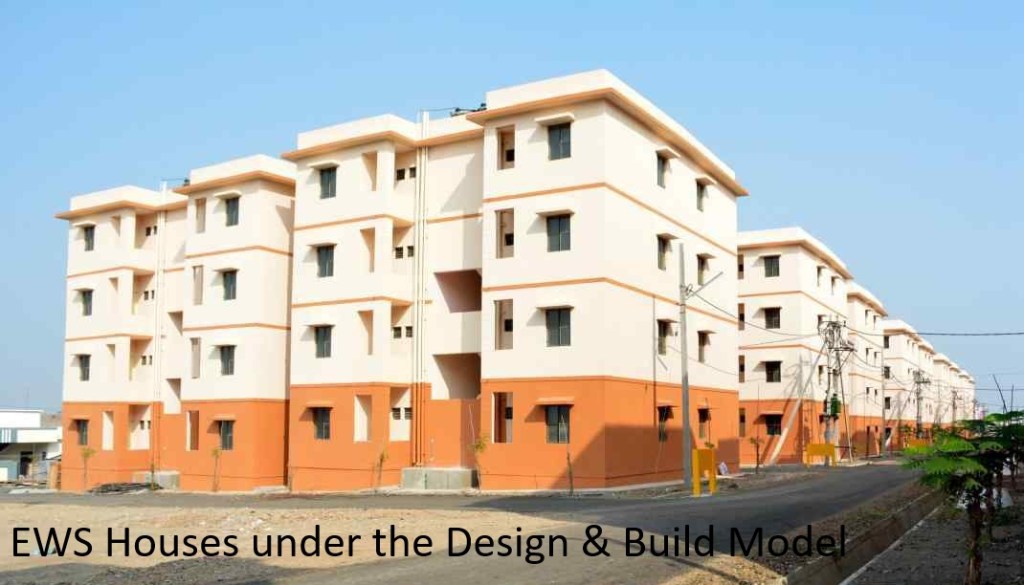
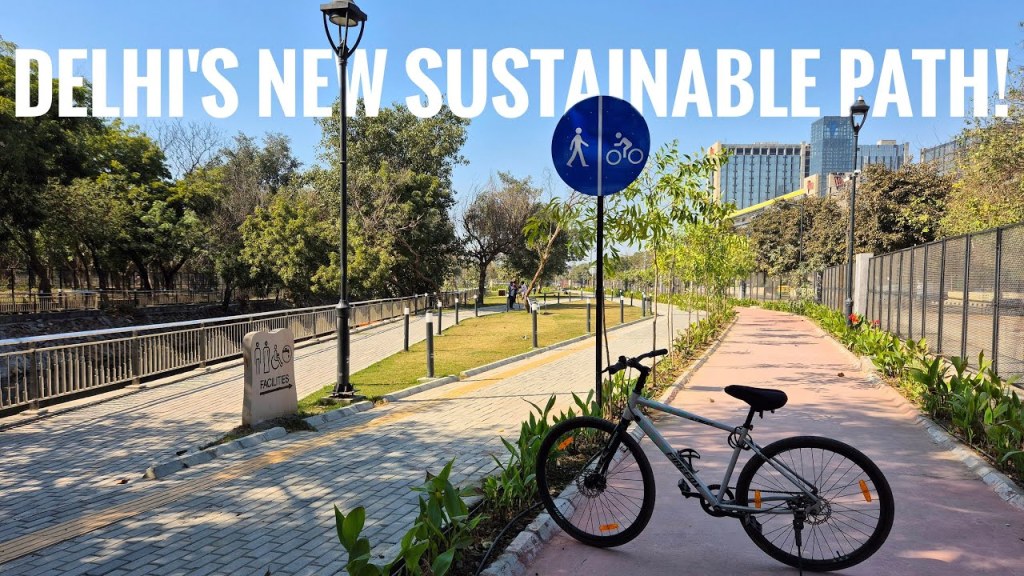
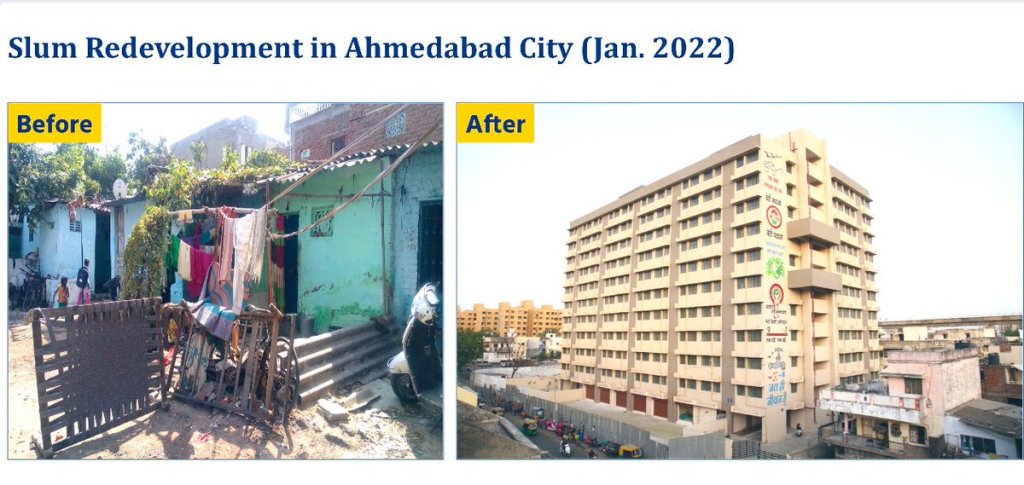


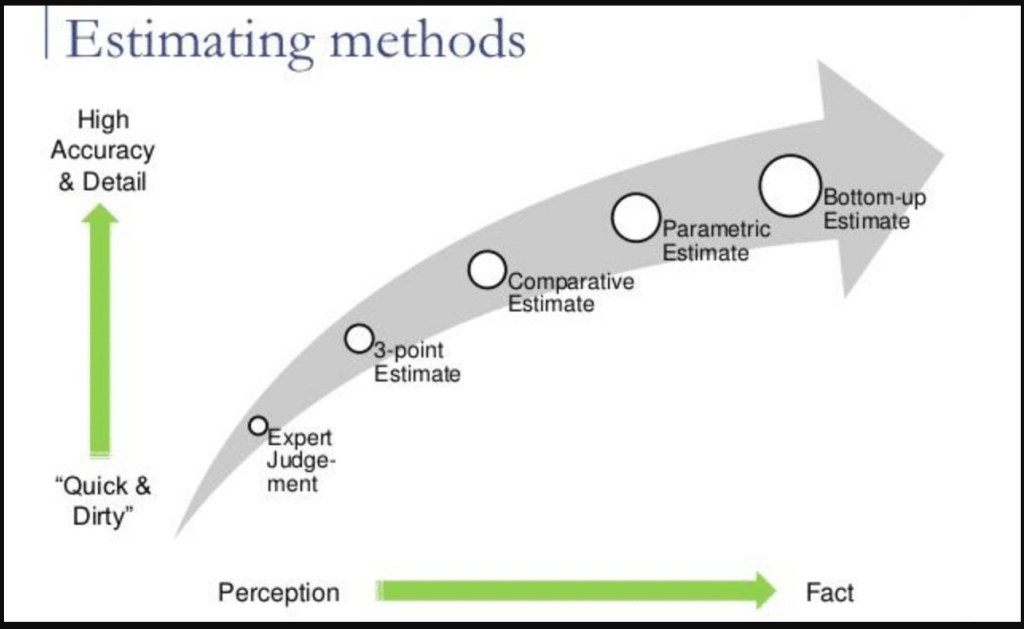


You must be logged in to post a comment.