The Yamuna Basin, particularly in Delhi, has been plagued by recurring floods caused by heavy rains. These floods have had devastating consequences on both human lives and the environment. To mitigate the impact of such natural disasters and safeguard the well-being of the populace, immediate and proactive measures must be taken to prevent future floods.
Critical Analysis:
Inadequate Infrastructure:
One of the primary causes of flooding in the Yamuna Basin is the inadequate infrastructure in Delhi. The city’s drainage system is ill-equipped to handle heavy rainfall, resulting in the water overflowing into residential areas. Insufficient stormwater drains and poorly maintained canals exacerbate the situation, leading to widespread inundation. The lack of investment and timely upgrades in infrastructure is a critical issue that must be addressed.
Encroachment and Enclosed River Channels:
Over the years, encroachments and unauthorized construction have obstructed the natural flow of the Yamuna River. Many of the river channels have been encased and converted into concrete structures, leaving no room for the river to expand during heavy rains. This not only disrupts the river’s ecological balance but also contributes to flood-related hazards. Strict enforcement of regulations to prevent encroachments and the revival of natural river channels are essential steps towards flood prevention.
Climate Change Impact:
The impact of climate change cannot be ignored when considering the causes of flooding in the Yamuna Basin. Increasingly unpredictable weather patterns and intense rainfall events have become more frequent due to climate change. Therefore, any long-term solution must acknowledge and account for the effects of climate change on the region’s hydrology. This necessitates the development and implementation of climate-resilient infrastructure and urban planning strategies.
Preventive Measures:
Improved Infrastructure:
Investments must be made to enhance the drainage system and build larger and efficient stormwater drains. These should be designed to accommodate heavy rainfall, reducing the risk of flooding in residential areas. Regular maintenance and periodic upgrades of existing infrastructure should also be prioritized.
River Channel Restoration:
Efforts should be directed towards restoring the natural flow of the Yamuna River by removing encroachments and revitalizing river channels. This can help create additional space for floodwaters to dissipate and reduce the pressure on residential areas during heavy rains. Adequate buffer zones should be maintained along the riverbanks to allow for natural expansion during flood events.
Climate-Resilient Urban Planning:
Long-term solutions should focus on incorporating climate-resilient urban planning strategies. This may include building sustainable and green infrastructure, promoting water harvesting and retention systems, and encouraging the use of permeable surfaces to facilitate groundwater recharge. Integrating climate change projections into urban planning frameworks can aid in creating flood-resistant cities.
Public Awareness and Emergency Preparedness:
Public awareness campaigns about flood risks and preparedness measures should be initiated to educate residents about safety protocols and evacuation procedures. Establishing early warning systems and emergency response mechanisms can significantly reduce the impact of floods and save lives.
Conclusion:
The recurring floods in the Yamuna Basin of Delhi demand immediate attention and action. Addressing the issues of inadequate infrastructure, encroachments, and climate change impact are crucial steps in flood prevention. By investing in improved infrastructure, restoring natural river channels, incorporating climate-resilient urban planning, and promoting public awareness, we can pave the way for a more resilient future, safeguarding lives and property from the devastating effects of flooding.
References
Kumar, M., Sharif, M., & Ahmed, S. (2019). Flood risk management strategies for national capital territory of Delhi, India. ISH Journal of Hydraulic Engineering, 25(3), 248-259.
Mazumder, S. K., Dhillon, M. S., & Kanwal, A. (2018). River Action Plan, Flood Management & Basin Development. Lead paper in a Souvenir “River Action Plan, Flood Management & Basin Development” published by Consulting Engineers Association of India, 27-28.
Patel, R. S., Taneja, S., Singh, J., & Sharma, S. N. (2024). Modelling of Surface Runoff using SWMM and GIS for Efficient Storm Water Management. CURRENT SCIENCE, 126(4), 463.
Sharma, M., Rawat, S., Kumar, D., Awasthi, A., Sarkar, A., Sidola, A., … & Kotecha, K. (2024). The state of the Yamuna River: a detailed review of water quality assessment across the entire course in India. Applied Water Science, 14(8), 175.
Tomar, P., Singh, S. K., Kanga, S., Meraj, G., Kranjčić, N., Đurin, B., & Pattanaik, A. (2021). GIS-based urban flood risk assessment and management—a case study of Delhi National Capital Territory (NCT), India. Sustainability, 13(22), 12850.
With reference to podcast on ‘Understanding Urban Digitalisation Projects in India: Platformisation, Infrastructuring, and Datafication’
Urban databases play a crucial role in shaping economic decision-making in urban environments. They serve as valuable repositories of information related to demographics, infrastructure, and various socio-economic factors. The availability and effective use of urban data can significantly enhance the understanding of urban dynamics, enabling policymakers and businesses to make more informed decisions. The discourse surrounding the use of urban databases for enhancing economic decision-making is a topic of increasing significance in the realm of urban planning and governance. This critical review aims to analyze the strengths and limitations of the concept, drawing upon the broader implications and challenges discussed in relevant literature.
One of the key strengths emphasized in the discourse is the potential for urban databases to provide a comprehensive understanding of the intricate dynamics within urban environments. By amalgamating data on demographics, infrastructure, and socio-economic factors, these databases promise to offer policymakers and businesses invaluable insights for more informed decision-making processes. This multifaceted approach is particularly laudable, given the complexity of urban ecosystems. However, a critical lens reveals certain limitations in the implementation and utilization of urban databases. One notable concern is the inherent challenge of data accuracy and reliability. The quality of decisions made based on urban databases is contingent on the accuracy of the data input. Inaccuracies, biases, or outdated information may lead to flawed analyses and misguided decisions. Additionally, issues of data privacy and security loom large, raising questions about the ethical considerations in the collection and storage of sensitive urban information.
Furthermore, the article under scrutiny may touch upon the potential pitfalls of over-reliance on quantitative data at the expense of qualitative insights. While databases provide a wealth of statistical information, they may fall short in capturing the nuanced, context-specific intricacies of certain urban phenomena. A comprehensive understanding of an urban environment requires a balanced integration of both quantitative and qualitative data. The review should also consider the contextual relevance of urban databases. The effectiveness of these databases may vary across different urban settings, influenced by factors such as governance structures, technological infrastructure, and socio-cultural contexts. The universal applicability of urban databases for economic decision-making should be critically evaluated, and efforts should be made to tailor these tools to specific urban landscapes.
In conclusion, while the concept of utilizing urban databases for better economic decision-making is promising, a critical review reveals a nuanced landscape of opportunities and challenges. The strength lies in the potential for comprehensive insights, but caution is warranted regarding issues of data accuracy, privacy, and contextual relevance. As the discourse continues to evolve, addressing these concerns will be paramount to harnessing the full potential of urban databases for effective economic decision-making in urban contexts.
References
Parkar, K., Zérah, M.-H., & Mittal, G. (2023). Understanding Urban Digitalisation Projects in India: Platformisation, Infrastructuring, and Datafication. Economic and Political Weekly, 58(14), 53–60.
Urban landscapes are constantly changing due to various factors such as human interventions, natural forces, and community actions. These transformations are aimed at meeting the needs of the people using the urban spaces, taking into account their social, psychological, political, cultural, financial, physical, and other needs. Urban planning research methods and tools have also been evolving, and this paper discusses the contemporary methods, tools, and technologies used in urban planning research. The article applies current trends and examples to illustrate the employment of these methods in designing, developing, and operating urban spaces. This paper aims to be a valuable introductory reference for emerging researchers in urban planning, particularly for undergraduate and postgraduate students with limited exposure to urban planning research. However, established researchers in the discipline can also find this article useful. The authors conclude that future research should not disregard established research techniques in addressing urban vulnerabilities.
Keywords
Research Methods, Urban Planning, Research Tools, Urban Governance, Sustainability
Introduction
Urban planning, like other disciplines, heavily relies on research to progress and adapt. Failure to do so can cause the discipline to become obsolete in today’s rapidly changing world. The Frascati Manual defines research and experimental development as creative work done systematically to increase knowledge of humans, culture, and society, and to develop new applications based on that knowledge. Universal research methods applicable to both physical and social sciences are identified by Gulbrandsen and Kyvik (2010), and this paper adopts three key research methods in urban planning: basic research, applied research, and experimental development.
In addition to these methods, Parnell and Piertese (2015) identify other modes of generating new knowledge in urban planning, including pure research, embedded research, city labs, professional networks, cityscapes, and exhibitions. This paper focuses on discussing the first three modes in detail, along with relevant examples of embedded techniques, and provides an overview of the other modes that readers can explore further. The following section on research technologies and tools will explain some of the latter modes identified by Parnell and Piertese (2015).
Findings and Discussion
Basic research, also known as pure or fundamental research, is focused on exploring and explaining the fundamental principles behind the functioning of the world. The OECD (2002) defines basic research as experimental or theoretical work undertaken purely to acquire new knowledge of observable phenomena and the underlying facts behind them. The aim of this research is to satisfy the curiosity of the researcher and to increase the existing base of scientific knowledge by presenting theoretical perspectives or alternatives to explain certain phenomena or behaviors in society. Pure research in urban planning involves examining existing theories, redesigning them or proposing new ones to offer better explanations for phenomena, such as the current drive to have green urban infrastructure to combat global warming or studies to develop theories on smart cities (Palys, 2018).
Pure research is not problem-solving, but it seeks to justify the status of a phenomenon, even if its applications may or may not have any use in the immediate or long-term future. Pure research in urban planning seeks to enhance an understanding of past legacies through an analysis of diverse aspects of urban complexity, such as culture, social identities, resource flows, labor regimes, regulations, urban politics, welfare regimes, and the design of a city. Pure research is often undertaken by universities and other higher-caliber research centers, but private commercial entities also engage in it resulting in theoretical researchers being drawn from there (Palys, 2018).
Pure research is primarily aimed at expanding the theoretical basis of a phenomenon, feeding researchers’ curiosities, and resulting in new ways of doing things (innovations) that then feed into investments and remodeling of the way things are done. Through pure research, old theories, standards or formulae can be tested, and those found to be incomprehensive or nonsensical are discarded. Pure research can be exploratory, descriptive or causal in nature, and it largely involves observation, polls/surveys, interviews, and focus group discussions as its primary means of investigation (Palys, 2018; Parnell & Pieterse, 2015).
In contrast to pure research, applied research aims to provide immediate solutions to existing problems and is based on pre-existing theories and assumptions from pure research. It uses its findings to address real-world issues, aids in decision-making, and enables policy and programme development. Applied research encompasses a range of methods, from large scale surveys to complex lab experiments, and is problem-solving in nature. It focuses on felt needs and non-hypothetical problems based on factual evidence to suggest meaningful solutions and testable hypotheses. Three types of applied research within social sciences include descriptive, experimental, and mixed-method studies. The applied research process involves defining the research problem, planning the study, executing data collection and analysis or experimentation, and reporting on findings with follow-up. Descriptive studies aim to paint a picture of a phenomenon, while correlational studies report negative, positive, or zero correlation between variables. Cross-sectional studies collect data from many different individuals, groups, or locations at the same time to observe variations or consistency in variables.
Klosterman (2015) describes experimental development in urban planning as the process of designing and redesigning land use maps over multiple decades, which are essential for determining land use regulations. On the other hand, Gulbrandsen & Kyvik (2010) define experimental development as a research methodology that aims to fill technical knowledge gaps to improve existing technologies or create new ones to address societal issues. Experimental development often leads to tangible products, such as software, hardware, or techniques that increase efficiency and effectiveness in service delivery. The goal of experimental development is to create prototypes that will lead to actual development. The OECD distinguishes between basic, applied research, and experimental development, which can transition from one to the next in a specific order. The primary aim of experimental development is to make technical improvements on products or processes, such as developing image processing technologies used in urban policing or alternative modes of transport and communication, among others.
here is a comparative table that summarizes the relationship between basic research, applied research, and experimental development:
Category
Goal
Output
Examples
Basic Research
Expand scientific knowledge and understanding
Theoretical frameworks, concepts, and principles
Research on subatomic particles, DNA structure
Applied Research
Solve practical problems by applying scientific ideas
Solutions to specific problems or issues
Developing a vaccine for a disease, improving a product
Experimental Development
Make technical improvements to products or processes
Developing image processing technologies for urban policing, alternative modes of transportation, innovative architectural designs
Note that there is some overlap between the categories and there may not always be a clear distinction between them. Additionally, the output of each category can inform and influence the others, leading to a cycle of innovation and discovery.
Parnell & Pieterse (2015) identified embedded research as a significant mode of undertaking urban planning studies, which involves close partnership between researchers and practitioners to co-produce outputs for society’s gains. This collaboration between academia and development organizations allows for the alignment of field practices with theory to address challenges in the use of developed technologies and practice models. Embedded research is a bridge that allows mutual collaboration and benefits between academia and industry practitioners. McGinity & Solakangas (2014) report that embedded research borrows from embedded journalism, which involves US media reporters being within the war environment and updating their audiences. While there are contradicting opinions on research methodologies, Palys (2018) insists that these categorizations of studies as either pure, applied, or experimental are strictly based on the motivation that compels a researcher to undertake a study at the beginning, whereas Gulbrandsen & Kyvik (2010) argue that there is very little difference between basic research, applied research, and experimental design. However, it is important to note that applied research and experimental development work does not necessarily have to take place in university labs. Many innovations driving the urban growth and development agenda today did not originate from urban planners, such as online shopping, which has been very vital in helping the world’s cities and their residents cope with the COVID-19 pandemic. The rise of online taxi services and shared rides also reduces the number of cars on the roads across cities, contributing to fighting transport-related greenhouse gas emissions and global warming. Although widely held perceptions exist that basic research no longer takes place in universities, many theories are still emerging in various disciplines, including urban and regional planning.
Conclusions
The authors argue that standardized urban research methodologies are inadequate for planning the development of cities. They suggest that the unique qualities of each city should be documented and incorporated into future planning. The authors note that research on urban planning is often constrained by a lack of funding and researchers willing to undertake field surveys. The authors also highlight the importance of community-based enumeration and participatory urban planning in ensuring that the needs of urban residents and decision-makers are met. However, the rapid pace of change in urban planning has created a gap in research, leaving many citizens unable to cope with the technological advancements being made. The authors call for the deliberate retention and incorporation of human-led studies on the urban environment, alongside the use of AI to solve urban problems.
References
Andrew, C. O., & Hildebrand, P. E. (1983). Planning and Conducting Applied Agricu tural Research. Canadian Journal of Agricultural Economics, 31, 275-277.
Baimyrzaeva, M. (2018). Beginners’ Guide for Applied Research Process: What Is It, and Why and How to Do It? University of Central Asia, 10-26.
Bentley, J. P., Gulbrandsen, M., & Kyvik, S. (2015). The Relationship between Basic and Applied Research in Universities. Higher Education, 70, 689-709 (21 pages). https://doi.org/10.1007/s10734-015-9861-2
Bunnell, T., & Maringanti, A. (2010). Practising Urban and Regional Research beyond Metro- centricity. International Journal of Urban and Regional Research, 34, 415-420. https://doi.org/10.1111/j.1468-2427.2010.00988.x
Cheetham, M., Wiseman, A., Khazaeli, B., Gibson, E. et al (2018). Embedded Research: A Promising Way to Create Evidence-Informed Impact in Public Health. Journal of Pub- lic Health, 40, i64-i70. https://doi.org/10.1093/pubmed/fdx125
Dehalwar, K., & Sharma, S. N. (2023). Fundamentals of Research Writing and Uses of Research Methodologies. Edupedia Publications Pvt Ltd.
Dehalwar, K., & Sharma, S. N. (2024). Exploring the Distinctions between Quantitative and Qualitative Research Methods. Think India Journal, 27(1), 7-15.
Gulbrandsen, M., & Kyvik, S. (2010). Are The Concepts Basic Research, Applied Research and Experimental Development Still Useful? An Empirical Investigation among Nor- wegian Academics. Science and Public Policy, 37, 343-353. https://doi.org/10.3152/030234210X501171
Harding, A., & Nevin, B. (2015). Cities and Public Policy: A Review Paper. Government Office for Science, Foresight.
Jain, Sarika, Kavita Dehalwar, and Shashikant Nishant Sharma. “Explanation of Delphi research method and expert opinion surveys.” Think India 27, no. 4 (2024): 37-48.
Klosterman, R. E. (2015). Urban Planning: Methods and Technologies. In J. D. Wright (Edi- tor-in-Chief) (Ed.), International Encyclopedia of the Social & Behavioral Sciences (2nd ed., Vol. 24, pp. 889-893). Elsevier.
McGinity, R., & Solakangas, M. (2014). Introduction: “Embedded Research” as an Approach into Academia for Emerging Researchers. Management in Education, 28, 3-5. https://doi.org/10.1177/0892020613508863
Ming, T. E. (2021). The Big Read: Feeling Lost in a Digital World, Some Elderly Shun Tech- nology. Today Online Newspaper.
OECD (Organization for Economic Co-Operation and Development) (2002). Proposed Standard Practice for Surveys on Research and Experimental Development (p. 77). Or- ganization for Economic Co-Operation and Development.
Owusu-Ansah, C., Rodrigues, A., & Walt, T. V.D. (2019). Integrating Digital Libraries into Distance Education: A Review of Models, Roles, and Strategies. The Turkish Online Journal of Distance Education, 20, 89-104. https://doi.org/10.17718/tojde.557742
Palys, T., & Atchison, C. (2021). Research Methods in the Social and Health Sciences.
Sage Publishing.
Parnell, S., & Pieterse, E. (2015). Translational Global Praxis: Rethinking Methods and Modes of African Urban Research. International Journal of Urban and Regional Research, 40, 236-246. https://doi.org/10.1111/1468-2427.12278
The debate over whether to refer to oneself as a “Planner” or a “Big Data Scientist” touches on the evolving nature of roles in data management, analytics, and decision-making. Each title implies a different focus, skill set, and approach to handling data and planning activities. To critically discuss this, let’s consider the distinctions and overlaps between the two roles.
1. Definitions and Roles
Planner: Traditionally, a planner is someone who devises strategies, coordinates activities, and allocates resources to achieve specific goals. This role is often seen in urban planning, business strategy, project management, and logistics. Planners focus on creating structured approaches to meet objectives, often relying on historical data, projections, and various planning tools.
Big Data Scientist: A Big Data Scientist, on the other hand, is someone specialized in handling, analyzing, and deriving insights from large volumes of complex data. This role involves using statistical methods, machine learning, and data mining to extract patterns, trends, and actionable insights from data. Big Data Scientists work extensively with structured and unstructured data, often using advanced computational techniques and software.
2. Skill Sets
Planners typically possess skills in project management, strategic thinking, resource allocation, and risk management. They may use data, but their focus is on the practical application of this data to achieve specific goals. Tools used by planners may include project management software, GIS (for urban planners), and various planning frameworks.
Big Data Scientists require strong analytical skills, proficiency in programming languages like Python or R, expertise in data analysis tools, and a deep understanding of statistical methods and machine learning algorithms. They must be able to work with large datasets, perform complex data manipulations, and create predictive models.
3. Approach to Data
Planners use data to support their planning processes but may not engage deeply with the data itself. Their focus is more on how to use available information to make strategic decisions. Data is one of many inputs into a broader decision-making process.
Big Data Scientists focus on the data itself. Their primary role is to uncover insights from data, which can then inform planning and decision-making processes. They are more concerned with the data’s quality, structure, and the methods used to analyze it.
4. Evolving Roles and Convergence
The line between planners and big data scientists is increasingly blurred. Modern planning often requires data-driven insights, and thus planners may need skills in data analysis. Conversely, Big Data Scientists might be involved in strategic planning based on the insights they generate. This convergence is seen in fields like smart city planning, where urban planners use big data analytics to understand traffic patterns, energy usage, and other urban dynamics.
5. Context and Industry Differences
In business contexts, a planner might focus on market strategies, supply chain logistics, or operational efficiency. A Big Data Scientist in the same company might analyze customer data, optimize product recommendations, or predict market trends. While both roles contribute to the company’s success, they do so in different ways.
In public policy or urban planning, a traditional planner might focus on land use, zoning, and community development. A Big Data Scientist could analyze social media data, census information, or transportation data to provide insights that shape these planning decisions.
6. Implications for Identity and Title
Choosing to call oneself a “Planner” or a “Big Data Scientist” reflects not only the skills one possesses but also the role one plays in the organization.
A Planner might emphasize their strategic, big-picture thinking, and their ability to integrate various inputs into a coherent plan. They may see their role as guiding an organization or community toward specific goals.
A Big Data Scientist might emphasize their technical skills, their ability to manage and analyze large datasets, and their role in uncovering hidden insights. They may see their role as providing the data-driven evidence needed to make informed decisions.
Conclusion
The choice between calling oneself a “Planner” or a “Big Data Scientist” ultimately depends on one’s primary focus and approach to their work. While there is overlap, the distinction lies in whether the individual is more focused on the strategic application of insights (Planner) or on the technical generation of those insights from data (Big Data Scientist). As roles continue to evolve with the integration of data science into various fields, professionals might increasingly identify with both roles, or new titles might emerge to capture this convergence.
References
Batty, M. (2013). Big data, smart cities and city planning. Dialogues in human geography, 3(3), 274-279.
Hazen, B. T., Boone, C. A., Ezell, J. D., & Jones-Farmer, L. A. (2014). Data quality for data science, predictive analytics, and big data in supply chain management: An introduction to the problem and suggestions for research and applications. International Journal of Production Economics, 154, 72-80.
Kayabay, K., Kılınç, A., Gökalp, M. O., Gökalp, E., & Daim, T. U. (2024). Technology Roadmapping: Data Science Roadmapping of Networked Organizations’ Strategic Planning for Artificial Intelligence. Future‐Oriented Technology Assessment: A Manager’s Guide with Case Applications, 273-300.
Sharma, S. N., Singh, D., & Dehalwar, K. Surrogate Safety Analysis-Leveraging Advanced Technologies for Safer Roads.
Shen, Z., & Li, M. (Eds.). (2017). Big Data Support of Urban Planning and Management: The Experience in China. Springer.
Steif, K. (2021). Public policy analytics: code and context for data science in government. CRC Press.
Van Der Aalst, W., & van der Aalst, W. (2016). Data science in action (pp. 3-23). Springer Berlin Heidelberg.
Climate change is one of the most pressing challenges facing humanity. It encompasses a wide range of issues, including rising temperatures, shifting weather patterns, melting glaciers, and increasing natural disasters. While its effects are global, they are not equally distributed, disproportionately affecting marginalized communities, particularly women in developing regions. Feminist environmentalism offers a critical lens to understand and address these inequities, integrating gender justice into the broader framework of environmental sustainability.
The Interplay Between Climate Change and Gender
The impacts of climate change are intricately tied to existing social and economic inequalities. Women, especially those in rural and marginalized communities, often rely on natural resources for their livelihoods, making them more vulnerable to environmental changes. For instance:
Agricultural Dependency: Women constitute a significant proportion of the agricultural workforce in many developing countries. Erratic rainfall and prolonged droughts threaten crop yields, directly impacting their income and food security.
Water Scarcity: Women are frequently responsible for water collection in many societies. Climate-induced water shortages force them to travel longer distances, exposing them to physical strain and potential violence.
Displacement: Climate disasters often lead to displacement, and women in refugee settings face unique challenges, including inadequate healthcare, limited access to education, and heightened risk of gender-based violence.
These examples underline how climate change is not just an environmental issue but also a social one, with profound implications for gender equality.
Feminist Environmentalism: A Transformative Approach
Feminist environmentalism bridges the gap between environmental and gender justice, emphasizing that sustainable solutions must address the structural inequalities that perpetuate both environmental degradation and gender oppression. This approach is rooted in several key principles:
Intersectionality: Feminist environmentalism recognizes the interconnectedness of various forms of oppression, such as race, class, and gender. For example, Indigenous women are often at the forefront of climate activism because their communities bear the brunt of resource exploitation and ecological destruction.
Empowerment and Agency: Women must be seen not merely as victims of climate change but as agents of change. Programs that empower women to participate in environmental decision-making lead to more equitable and effective solutions. For instance, studies show that women’s involvement in forest management improves conservation outcomes.
Care Ethics: Feminist perspectives highlight the value of care ethics in addressing environmental crises. This approach prioritizes nurturing relationships between humans and nature, moving away from extractive models of development.
Contributions of Women to Climate Action
Women have been pivotal in leading grassroots movements and advocating for climate justice:
Wangari Maathai: The Kenyan environmentalist and Nobel laureate founded the Green Belt Movement, which empowered women to plant trees, combat deforestation, and advocate for sustainable development.
Greta Thunberg: The young Swedish activist has galvanized global attention to the climate crisis, inspiring millions to demand urgent action from policymakers.
Indigenous Women Leaders: Across the globe, Indigenous women are defending their lands and advocating for the preservation of biodiversity, often at great personal risk.
These examples demonstrate the critical role women play in shaping a sustainable future.
Policy Recommendations for Integrating Feminist Environmentalism
To create a just and sustainable world, policymakers must incorporate feminist perspectives into climate strategies. Key recommendations include:
Gender-Inclusive Climate Policies: Policies should address the unique vulnerabilities of women and ensure their participation in decision-making processes. For example, allocating resources for women’s education and training in sustainable practices can build resilience in vulnerable communities.
Support for Women-Led Initiatives: Governments and international organizations should provide funding and technical support to women-led environmental projects. This not only fosters innovation but also ensures that solutions are tailored to local contexts.
Legal Protections: Strengthening legal frameworks to protect women environmental defenders from violence and harassment is crucial for sustaining their advocacy efforts.
Intersectional Data Collection: Collecting and analyzing gender-disaggregated data on climate impacts can help identify specific challenges and tailor interventions accordingly.
Conclusion
Climate change is not a gender-neutral phenomenon. Addressing it requires a nuanced understanding of the intersection between environmental degradation and social inequalities. Feminist environmentalism provides a powerful framework to tackle these challenges holistically, advocating for a world that values both ecological sustainability and gender justice. By empowering women and embracing inclusive policies, we can forge a path toward a more equitable and resilient future.
References
Amadi, L. A., Ogbanga, M. M., & Agena, J. E. (2015). Climate change and feminist environmentalism in the Niger Delta, Nigeria. African Journal of Political Science and International Relations, 9(9), 361-371.
Amadi, L., Wordu, S., & Ogbanga, M. (2015). Sustainable Development in Crisis? A Post Development Perspective. Journal of Sustainable Development in Africa, 17(1), 140-163.
Brick, P., & Cawley, R. M. (2008). Producing political climate change: the hidden life of US environmentalism. Environmental Politics, 17(2), 200-218.
Gilley, B. (2012). Authoritarian environmentalism and China’s response to climate change. Environmental politics, 21(2), 287-307.
Ogbanga, M. M. (2024). Oil, Gender and Unemployment: Social Issues in the Niger. Eduindex.
Pulver, S. (2007). Making sense of corporate environmentalism: An environmental contestation approach to analyzing the causes and consequences of the climate change policy split in the oil industry. Organization & environment, 20(1), 44-83.
Wright, C., & Nyberg, D. (2012). Working with passion: Emotionology, corporate environmentalism and climate change. Human Relations, 65(12), 1561-1587.
Stata is a powerful and user-friendly statistical software package widely used in academia, research, and professional fields for data analysis, data management, and graphics. It is especially popular among social scientists, economists, epidemiologists, and biostatisticians due to its comprehensive features and ease of use.
—
Key Features
1. Data Management
Stata offers a wide range of data management tools to efficiently handle datasets:
Import/export data from various formats like Excel, CSV, SPSS, SAS, and more.
Merge, append, reshape, and sort datasets.
Generate new variables, recode existing ones, and label data for clarity.
Handle missing data effectively with built-in commands.
2. Statistical Analysis
Stata supports a broad range of statistical analyses, including:
Descriptive Statistics: Mean, median, standard deviation, frequencies, and cross-tabulations.
2. Health Sciences: Analyzing clinical trials, epidemiological studies, and survival rates.
3. Social Sciences: Public policy evaluation, survey analysis, and social behavior research.
4. Business and Marketing: Predictive modeling, market segmentation, and financial analytics.
—
Pros and Cons
Pros
Comprehensive suite of features.
Intuitive syntax and user-friendly interface.
Highly active user community and robust documentation.
Suitable for both beginners and advanced users.
Cons
Steep learning curve for non-technical users.
Can be expensive compared to alternatives like R or Python.
Limited in advanced machine learning functionalities compared to specialized tools.
—
Getting Started with Stata
1. Installing Stata:
Visit Stata’s official website to purchase and download.
Install based on your operating system (Windows, Mac, or Linux).
2. Basic Commands:
Load a dataset:
use filename.dta
Summarize data:
summarize varname
Create a new variable:
generate newvar = expression
Run a regression:
regress y x1 x2
3. Learning Resources:
Stata’s inbuilt help system (help command).
Online tutorials, courses, and webinars.
Books and user guides provided by StataCorp.
—
Stata Editions
Stata offers various editions tailored to user needs:
1. Stata/MP: Multi-core processing for large datasets.
2. Stata/SE: Standard edition for moderately large datasets.
3. Stata/IC: Basic edition for smaller datasets.
4. Small Stata: Entry-level edition for educational purposes.
—
Stata remains a robust choice for data analysis due to its versatility and reliability, offering tools for handling complex data challenges across various fields.
PhD Students – How can you help your supervisors to give you the best supervision for your PhD?
In a PhD program, supervisor-supervisee relationship is very important.
Here are 10 things you can do on your part to get the best out of your PhD supervisors.
𝟏. 𝐒𝐡𝐨𝐰, 𝐝𝐨𝐧’𝐭 𝐭𝐞𝐥𝐥: Instead of telling your supervisor what you have worked on, show him/her the progress. For example, instead of saying that I have read 5 papers, you should say here are the critical summaries and 5 takeaways from these 5 papers that I think are useful for my research in these ways.
𝟐. 𝐓𝐚𝐤𝐞 𝐟𝐞𝐞𝐝𝐛𝐚𝐜𝐤 𝐩𝐨𝐬𝐢𝐭𝐢𝐯𝐞𝐥𝐲: If your supervisor criticizes you, actually he/she is not criticizing you but your work. This criticism is only for the purpose of improving your research and helping you to succeed.
𝟑. 𝐒𝐡𝐚𝐫𝐞 𝐦𝐞𝐞𝐭𝐢𝐧𝐠 𝐚𝐠𝐞𝐧𝐝𝐚 𝐚𝐧𝐝 𝐦𝐢𝐧𝐮𝐭𝐞𝐬: Send upfront the points about which you want to talk about in the meeting. Similarly, share what has been discussed in the meeting. It will only take around 10 minutes of your time.
𝟒. 𝐀𝐬𝐤, 𝐝𝐨𝐧’𝐭 𝐚𝐬𝐬𝐮𝐦𝐞: Do not assume outcomes from your supervisors. Instead, ask in a polite way. For example, do not assume that your supervisors will not allow you to apply for a research internship. Ask them.
𝟓. 𝐎𝐰𝐧 𝐲𝐨𝐮𝐫 𝐏𝐡𝐃: Your PhD is your project. After around 6 months, you are likely more expert on the topic than your supervisors. They are there to guide you through the process.
𝟔. 𝐑𝐞𝐦𝐢𝐧𝐝 𝐭𝐡𝐞𝐦: Supervisors have many things on their plates. It’s possible that their minds skip something. Give them a soft reminder if they need to get back to you on something such as feedback on a paper.
𝟕. 𝐒𝐞𝐞𝐤 𝐭𝐢𝐦𝐞𝐥𝐲 𝐟𝐞𝐞𝐝𝐛𝐚𝐜𝐤: Sending a paper draft to a supervisor one day before a submission deadline is a mistake on your end. Even if he/she provides the feedback, it might be shallow. Give them time.
𝟖. 𝐂𝐨𝐦𝐦𝐮𝐧𝐢𝐜𝐚𝐭𝐞 𝐜𝐥𝐞𝐚𝐫𝐥𝐲: Communicate clearly to your supervisors about any obstacles you are facing and any expectations you have. They have the experience to guide you accordingly but first, they need to know.
𝟗. 𝐃𝐨𝐧’𝐭 𝐫𝐞𝐩𝐞𝐚𝐭 𝐭𝐡𝐞 𝐬𝐚𝐦𝐞 𝐦𝐢𝐬𝐭𝐚𝐤𝐞𝐬: If your supervisors have corrected you about something, try not to repeat it. It will give them the impression that you did not value their feedback. If you don’t agree, discuss it with them.
𝟏𝟎. 𝐑𝐞𝐬𝐩𝐞𝐜𝐭, 𝐫𝐞𝐬𝐩𝐞𝐜𝐭, 𝐚𝐧𝐝 𝐫𝐞𝐬𝐩𝐞𝐜𝐭: Doesn’t matter how good or bad your relationship is with your supervisor, always respect them. I have hardly seen anyone successful who does not respect his/her teachers and supervisors.
The Dr. A.P.J. Abdul Kalam Young Research Fellowship (AKYRF) is an esteemed initiative established to encourage young researchers and scholars to make significant contributions to scientific and technological advancements in India. Named after Dr. A.P.J. Abdul Kalam, one of India’s most celebrated scientists and the 11th President of India, the fellowship is designed to honor his legacy of inspiring and nurturing young minds, fostering innovation, and promoting excellence in research.
Key Features and Objectives of the Fellowship
Inspiration from Dr. A.P.J. Abdul Kalam’s Vision: Dr. Kalam was deeply passionate about empowering youth and advancing India’s scientific and technological capabilities. The fellowship aims to continue his vision of fostering scientific and technological research, particularly in the fields of defense, space technology, and other cutting-edge areas that can contribute to the nation’s development.
Target Audience: The fellowship is primarily designed for young researchers, typically in the early stages of their career. The eligibility criteria often include:
Age limit (usually below 30 or 35 years depending on the program guidelines).
Researchers, scientists, or academicians working in areas aligned with Dr. Kalam’s vision of national progress, such as aerospace, defense, energy, environmental studies, and related fields.
Fields of Research: The fellowship encourages interdisciplinary research, with particular emphasis on areas of high strategic importance to India, such as:
Aerospace and space technology
Defense and national security
Renewable energy technologies
Biotechnology and healthcare
Environmental sustainability
Advanced computing and artificial intelligence
Research Grants and Support:
Funding: The fellowship provides financial support for research, including stipends for the researchers, travel grants, and project-based funding to carry out experiments and field studies.
Facilities and Infrastructure: Fellows are often provided access to world-class research facilities and labs, either within renowned institutions or through collaborations with industry partners.
Networking and Mentorship: Fellows have the opportunity to interact with leading scientists, professionals, and mentors, creating a conducive environment for learning, innovation, and growth.
Duration and Structure: The fellowship may typically last for one to two years, depending on the scope of the research proposal. During this time, the selected fellows are expected to focus on their research topics, present progress reports, and possibly engage with industry or academic institutions for collaboration.
Collaboration and Industry Linkages: One of the core aspects of the fellowship is its emphasis on collaboration with government research organizations, academic institutions, and industries. This creates a platform for translating research into practical, real-world applications that can benefit society and the country.
Promotion of Innovation: In line with Dr. Kalam’s own passion for innovation, the fellowship encourages young researchers to think creatively and engage in projects that have the potential for breakthroughs in scientific and technological knowledge.
Post-Fellowship Opportunities: After completing the fellowship, researchers often continue their work with further academic pursuits, industry partnerships, or as part of government projects. Many fellows go on to lead innovative projects, become part of strategic national institutions, or establish their own research initiatives.
Selection Criteria
The selection process for the Dr. A.P.J. Abdul Kalam Young Research Fellowship is rigorous and highly competitive. Some typical criteria include:
Academic Excellence: Applicants must have a strong academic background, usually with at least a postgraduate degree in the relevant field.
Research Proposal: A well-articulated research proposal outlining the objectives, methodology, expected outcomes, and potential impact of the research.
Recommendations: Letters of recommendation from academic or industry professionals who can vouch for the applicant’s capabilities and potential.
Innovative Thinking: The fellowship looks for individuals who exhibit original thinking, the ability to solve complex problems, and a desire to create a tangible impact on society.
Impact and Legacy
The Dr. A.P.J. Abdul Kalam Young Research Fellowship is more than just a financial aid program. It stands as a testament to Dr. Kalam’s commitment to nurturing the next generation of scientists and innovators. By focusing on high-impact areas such as defense, space exploration, and sustainability, the fellowship plays a crucial role in supporting India’s growth as a global leader in technology and research.
Many of the fellows go on to make significant contributions to their respective fields, advancing both scientific knowledge and the practical application of that knowledge. Moreover, the fellowship fosters a spirit of inquiry and excellence among the youth, aligning with Dr. Kalam’s vision of a developed India driven by innovation, research, and collaboration.
Conclusion
The Dr. A.P.J. Abdul Kalam Young Research Fellowship is a prestigious program that plays a pivotal role in supporting and motivating young researchers to pursue innovative and impactful scientific research. By providing financial support, research infrastructure, and valuable mentorship, it honors the legacy of Dr. A.P.J. Abdul Kalam and helps realize his dream of a technologically advanced and self-reliant India.
TERRE Policy Centre, environmental NGO based in Pune, Maharashtra dedicated to sustainable solutions, organises a Fellowship program every year for the young researchers of India in the remembrance of Late President and Scientist Dr. A. P. J. Abdul Kalam. This year we have announced the 07th Edition of Dr. A. P. J. Abdul Kalam Young Research Fellowship 2024-25.
Requesting you to encourage the young researchers of your University and Institutes to actively participate in the fellowship to make a considerable change for the future generation of our nation.
Important Dates: • Announcement of fellowship programme – 15th October 2024
Registration Open – 16th October 2024
Registration Last Date – 16th January 2025
Evaluation – March 2025
Interview of shortlisted applicants – April 2025
Result – May 2025
Fellowship Awardees Announcement – 27th July 2025
Attached below are the details of the fellowship.
Please consider the attached file as a personal invitation and kindly circulate the information among the students.
The field of Machine Learning (ML) is one of the most exciting and rapidly evolving domains in technology. With advancements in artificial intelligence, automation, and data science, the demand for skilled machine learning professionals has surged across industries. This article delves into the job prospects in machine learning, the skills required, the industries hiring, and future trends.
Why Machine Learning is in Demand
Machine Learning, a subset of Artificial Intelligence (AI), enables systems to learn from data and improve over time without explicit programming. Its applications span numerous fields such as healthcare, finance, e-commerce, and autonomous vehicles, driving innovation and efficiency. The global shift towards automation, data-driven decision-making, and intelligent systems has created a significant demand for ML professionals.
Key factors driving demand:
Explosion of Data: The massive growth of data from IoT devices, social media, and digital platforms requires sophisticated models to extract insights.
Advancements in Computing Power: With more accessible and powerful GPUs and cloud computing, ML solutions are becoming increasingly viable.
Cross-Industry Applications: From personalized recommendations to predictive maintenance, ML is transforming businesses.
Career Opportunities in Machine Learning
1. Data Scientist
Role: Use machine learning algorithms to analyze and interpret complex datasets.
Skills: Python/R, TensorFlow, statistical modeling, data visualization.
Industries: E-commerce, finance, healthcare, social media.
2. Machine Learning Engineer
Role: Develop, implement, and optimize machine learning models.
Skills: Proficiency in ML frameworks (Scikit-learn, PyTorch), software engineering, distributed computing.
Industries: Tech companies, startups, robotics.
3. AI Research Scientist
Role: Conduct research to develop new algorithms and advance ML techniques.
Skills: Deep learning, neural networks, mathematics, programming.
Industries: Research labs, universities, tech giants.
4. Business Intelligence Analyst
Role: Leverage ML to create actionable insights and improve business strategies.
Skills: Data analysis, SQL, business acumen, ML algorithms.
Industries: Retail, consulting, marketing.
5. NLP Specialist
Role: Work on language-based applications like chatbots, sentiment analysis, and translation tools.
Skills: Natural Language Processing, linguistics, deep learning.
Industries: Customer service, content management, social platforms.
6. Robotics Engineer
Role: Design and build intelligent systems for autonomous robots.
Skills: Robotics, reinforcement learning, control systems.
Industries: Manufacturing, defense, healthcare.
7. Autonomous Vehicle Engineer
Role: Develop systems for self-driving cars, including computer vision and sensor fusion.
Skills: Computer vision, C++, SLAM algorithms.
Industries: Automotive, transportation.
8. Cybersecurity Analyst
Role: Implement ML to predict and prevent cybersecurity threats.
Media and Entertainment: Content recommendation, video/audio processing.
Future Trends in Machine Learning Careers
Explainable AI (XAI): Demand for ML professionals who can create interpretable models.
Edge AI: Increased need for ML expertise in IoT and edge computing.
Hybrid Roles: Interdisciplinary skills combining ML with fields like genomics or environmental science.
AI Ethics: Specialists ensuring fairness, accountability, and transparency in ML models.
Conclusion
The job prospects in machine learning are vast and growing. As businesses and industries continue to adopt AI-driven solutions, the need for skilled professionals will only increase. For those with a passion for technology and innovation, a career in machine learning offers an exciting and lucrative pathway.
Whether you’re a recent graduate or a professional looking to pivot, now is the time to invest in developing machine learning skills and embrace a future shaped by intelligent systems.
Human Resources (HR) departments play a critical role in ensuring an organization’s workforce operates efficiently, ethically, and productively. With the increasing complexity of managing employees, HR professionals rely heavily on robust software solutions to streamline processes such as recruitment, payroll, performance evaluation, and compliance. In this article, we delve into the most popular HR management software, their features, and why they are essential for modern organizations.
1. Workday
Overview:
Workday is a cloud-based HR management software that provides a wide range of tools for workforce planning, talent management, and payroll operations. It is known for its intuitive user interface and data-driven insights.
Key Features:
Human Capital Management (HCM): Comprehensive tools for workforce planning, hiring, and employee management.
Payroll Management: Global payroll capabilities to handle multi-country operations.
Talent Optimization: Performance tracking, learning management, and succession planning.
Analytics: Real-time data analytics and reporting for better decision-making.
Why Workday?
Workday is particularly favored by large enterprises because of its scalability and integration capabilities. Its predictive analytics help HR teams proactively address workforce challenges.
2. BambooHR
Overview:
BambooHR is a highly popular HR management software among small and medium-sized businesses (SMBs). It focuses on simplifying HR tasks with its user-friendly platform.
Key Features:
Employee Database: Centralized storage for all employee information.
Recruitment Tools: Applicant tracking and onboarding features.
Performance Management: Tools for setting goals, tracking achievements, and conducting performance reviews.
Time-Off Tracking: Easy management of employee leave requests and vacation schedules.
Why BambooHR?
Its affordability and ease of use make BambooHR a go-to solution for SMBs. Additionally, its strong emphasis on employee engagement and feedback sets it apart.
3. SAP SuccessFactors
Overview:
SAP SuccessFactors is a cloud-based suite designed for enterprises seeking advanced HR tools. Its integration with other SAP modules makes it a comprehensive enterprise solution.
Key Features:
Core HR and Payroll: Centralized employee data and seamless payroll processing.
Recruiting and Onboarding: Advanced candidate search and automated onboarding workflows.
Learning and Development: Tools for employee training, certification, and career development.
Workforce Analytics: Advanced tools for workforce planning and analytics.
Why SAP SuccessFactors?
This software is ideal for organizations already using SAP products. It excels in handling complex HR needs for global organizations.
4. ADP Workforce Now
Overview:
ADP Workforce Now is a robust HR software aimed at businesses of all sizes. It is particularly well-known for its payroll and compliance features.
Key Features:
Payroll Processing: Handles payroll efficiently, including tax compliance.
HR Management: Tools for benefits administration, employee self-service, and performance tracking.
Time and Attendance: Timecard tracking and workforce scheduling.
Compliance Support: Regular updates to ensure compliance with changing labor laws.
Why ADP Workforce Now?
ADP’s longstanding reputation in payroll and compliance makes it a trusted solution. Its modular design also allows businesses to tailor it to their specific needs.
5. Zoho People
Overview:
Zoho People is part of the Zoho suite of business applications and is an excellent choice for small to medium-sized businesses.
Key Features:
Employee Management: Centralized database for employee records and personal details.
Time Tracking: Tools for attendance and timesheet management.
Performance Appraisals: Customizable appraisal systems for performance reviews.
Mobile App: Access HR functionalities on the go.
Why Zoho People?
Zoho People is known for its affordability and seamless integration with other Zoho applications, making it an excellent choice for companies already using the Zoho ecosystem.
In recent years, the conversation around gender equality in workplaces has gained significant momentum globally. While governments and organizations have made progress in public-sector employment through reservations and affirmative actions, the private sector often lags behind in ensuring adequate representation for women. The idea of introducing women reservation policies in private jobs is gaining traction as a necessary step toward fostering inclusive economic growth and addressing gender disparities in employment.
The Current Status of Women in Private Employment
Globally, women represent nearly half of the population, but their participation in the workforce, especially in leadership and technical roles, remains disproportionately low. According to a 2023 report by the World Economic Forum, women occupy only 26.7% of leadership positions in the private sector. Factors such as lack of access to quality education, societal expectations, and workplace discrimination contribute to these disparities.
In India, for instance, the female labor force participation rate in the private sector is as low as 23.3% (as per 2022 statistics), far below the global average of 47%. Despite advances in education and skill development, women remain underrepresented, especially in high-paying and decision-making roles. This trend has significant implications for economic growth, as studies show that gender-diverse organizations perform better and contribute positively to GDP.
Why Women Reservation in Private Jobs is Necessary
Addressing Systemic Discrimination Historical biases and social norms often marginalize women in private-sector hiring and promotions. By instituting reservation policies, companies can actively counter these biases and ensure fair representation in the workforce.
Promoting Economic Growth Women’s participation in the workforce is directly linked to economic prosperity. A McKinsey study suggests that closing the gender gap in employment could add $12 trillion to global GDP by 2025. Reservation policies can serve as a catalyst for unlocking this potential.
Reducing the Gender Pay Gap Women continue to earn less than men for the same roles, with a global pay gap of approximately 20%. By increasing the number of women in skilled and leadership positions, reservations can help narrow this gap.
Fostering Innovation and Productivity Diverse teams are proven to be more innovative and productive. Women’s inclusion at all levels of private employment can bring fresh perspectives, enhance decision-making, and improve workplace culture.
Achieving Social Equity Beyond economic considerations, reservation policies in private jobs promote social equity by empowering women and challenging patriarchal norms. It helps create role models for younger generations, inspiring them to pursue careers in diverse fields.
Challenges in Implementing Women Reservation in Private Jobs
While the benefits of women reservation are evident, its implementation in the private sector comes with challenges:
Resistance from Employers Many private-sector employers may view reservation policies as interference in their hiring practices, fearing it could compromise meritocracy.
Skill Gap Critics often point out that there is a mismatch between the skills women bring and the demands of certain roles. Addressing this requires parallel investments in education and vocational training.
Workplace Culture Without supportive policies like maternity leave, flexible hours, and anti-harassment measures, women may find it difficult to sustain long-term careers in male-dominated industries, even with reservations.
Legal and Policy Framework Unlike the public sector, the private sector operates on profit-driven motives, making it harder to enforce reservation policies without a robust legal framework.
Successful Models of Women Inclusion in Private Jobs
Several countries and companies have set examples in promoting women’s participation without formal reservation policies. For instance:
Nordic Countries: Through a combination of legislation and incentives, Nordic countries like Sweden and Norway have achieved nearly 40% female representation on corporate boards.
Diversity Quotas in Europe: Germany, France, and Italy have mandated gender quotas for boardrooms, leading to increased representation of women in leadership roles.
Corporate Initiatives: Companies like Unilever and TCS have introduced targeted programs to recruit, retain, and promote women, showcasing how private firms can take voluntary steps toward inclusivity.
How Women Reservation Can Work in Private Jobs
Legislation and Incentives Governments can mandate a minimum percentage of jobs in the private sector be reserved for women, especially in industries where they are underrepresented. Tax benefits and other incentives can encourage compliance.
Collaborative Skill Development Programs Partnerships between the government, private firms, and NGOs can help bridge the skill gap by providing vocational training tailored to industry demands.
Setting Benchmarks for Inclusion Companies should be encouraged to publish annual diversity reports and set benchmarks for female representation at all levels.
Supportive Workplace Policies Reservation should be complemented with policies that make workplaces more inclusive, such as mentorship programs, childcare facilities, flexible working hours, and robust anti-discrimination frameworks.
Monitoring and Accountability Regular audits and assessments are necessary to ensure companies meet their targets for women’s reservation and genuinely improve workplace diversity.
The Road Ahead: Striking a Balance
Introducing women reservation in private jobs is not just about meeting quotas; it’s about creating an ecosystem where women have equal opportunities to thrive. While legal mandates can kickstart the process, long-term success lies in building a culture of inclusivity and addressing systemic barriers. Governments, corporations, and civil society must work together to ensure these policies are both effective and sustainable.
As countries strive to achieve gender parity in all spheres of life, the private sector cannot remain an exception. Women reservation in private jobs is not just a moral imperative but also an economic and social necessity for a more equitable and prosperous future.
References
Bose, N., & Das, S. (2018). Political reservation for women and delivery of public works program. Review of Development Economics, 22(1), 203-219.
Dehalwar, K., & Sharma, S. N. (2024). Politics in the Name of Women’s Reservation. Contemporary Voice of Dalit, 2455328X241262562.
Dehalwar, K. Gender and Its Implications for Spatial Planning: Understanding the Impact. Track2Training
Kishwar, M. (2000). Equality of Opportunities vs Equality of Results: Improving Women’s Reservation Bill. Economic and Political Weekly, 35(47), 4151-4156.
Menon, N. (2000). Elusive’Woman’: feminism and women’s reservation bill. Economic and political weekly, 3835-3844.
Sharma, K. (2000). Power and representation: Reservation for women in India. Asian Journal of Women’s Studies, 6(1), 47-87.
Urban design is the interdisciplinary field that combines architecture, city planning, landscape architecture, and engineering to create functional, aesthetically pleasing, and sustainable urban environments. It is a critical discipline in shaping the future of cities, addressing challenges like population growth, climate change, and the need for more inclusive and equitable spaces.
1. What is Urban Design?
Urban design focuses on the large-scale organization and design of cities, towns, and communities. It encompasses the physical layout of neighborhoods, the arrangement of streets and public spaces, and the integration of buildings, infrastructure, and green spaces. Unlike architecture, which focuses on individual buildings, urban design deals with the broader spatial relationships between structures and their surroundings.
2. Key Principles of Urban Design
Urban design is guided by several core principles that ensure the creation of livable and sustainable urban environments:
Connectivity: Creating well-connected transport systems and pedestrian pathways to enhance accessibility and reduce reliance on cars.
Public Realm: Designing vibrant public spaces that encourage social interaction and community engagement.
Sustainability: Incorporating eco-friendly designs, such as green roofs, energy-efficient buildings, and renewable energy sources, to minimize environmental impact.
Resilience: Planning cities that can adapt to climate change, natural disasters, and economic shifts.
Identity and Place-Making: Preserving cultural heritage while fostering a sense of belonging through unique and meaningful urban spaces.
Inclusivity: Ensuring spaces are accessible and welcoming to people of all ages, abilities, and socio-economic backgrounds.
3. Components of Urban Design
Urban design involves several interconnected elements:
Urban Structure: The arrangement of zones, including residential, commercial, and industrial areas, as well as transport and infrastructure networks.
Public Spaces: Parks, plazas, streets, and other shared spaces that promote social interaction and enhance quality of life.
Buildings: The design and placement of buildings influence the aesthetic and functional character of a city.
Landscape: Incorporating natural elements such as trees, water bodies, and green belts to improve air quality and create appealing environments.
Transport and Mobility: Designing systems that balance the needs of pedestrians, cyclists, public transport, and private vehicles.
4. Historical Evolution of Urban Design
Urban design has evolved significantly over centuries, reflecting changing societal needs, technologies, and cultural values:
Ancient Cities: Cities like Mohenjo-Daro and Athens emphasized planned layouts, with streets, drainage systems, and public spaces.
Medieval Period: Walled cities with organic layouts focused on defense and community cohesion.
Industrial Revolution: Rapid urbanization led to overcrowded and polluted cities, prompting calls for better planning.
Modernist Movements: In the 20th century, urban design embraced geometric layouts, zoning, and high-rise buildings, as seen in Le Corbusier’s Radiant City.
Contemporary Approaches: Today, urban design emphasizes sustainability, inclusivity, and resilience, with smart cities
References
Adams, D., & Tiesdell, S. (2012). Shaping places: urban planning, design and development. Routledge.
Anttiroiko, A. V. (2013). U-cities reshaping our future: reflections on ubiquitous infrastructure as an enabler of smart urban development. AI & society, 28, 491-507.
Carmona, M. (2014). The place-shaping continuum: A theory of urban design process. Journal of Urban Design, 19(1), 2-36.
Dehalwar, K., & Sharma, S. N. (2023). Fundamentals of Area Appreciation and Space Perceptions.
Kumar, G., Vyas, S., Sharma, S. N., & Dehalwar, K. (2023). Planning and Development of Housing in Urban Fringe Area: Case of Bhopal (MP). GIS Business, 18(1), 1-14.
Palma Andrés, J. (2019). Modern Cities Need a Vision to Shape Their Future. City Policies and the European Urban Agenda, 21-65.
Sepe, M. (2020). Shaping the future: perspectives in research on, and the teaching of, urban design. Journal of Urban Design, 25(1), 28-31.
Sharma, S. N., & Dehalwar, K. (2023). Fundamentals of Planning and Design of Housing.
Are you passionate about journalism and eager to gain real-world experience in the media industry? Track2Training, a leading platform dedicated to skill development and professional growth, is offering an exciting internship opportunity for aspiring journalists. This internship is your chance to sharpen your writing, reporting, and media skills while contributing to a platform that values creativity and impactful storytelling.
About Track2Training
Track2Training is a dynamic platform focused on providing quality training and internship opportunities to students and professionals. It operates across multiple domains, including journalism, education, technology, and social impact. With a mission to nurture talent and foster innovation, Track2Training offers a robust learning environment for individuals looking to enhance their skills and make meaningful contributions to society.
Why Join the Journalism Internship at Track2Training?
This internship offers a unique blend of hands-on learning, mentorship, and professional exposure. Here’s why you should consider applying:
Practical Experience:
Work on real-time projects, including news reporting, feature writing, and content creation.
Gain experience in researching, editing, and publishing articles on a well-recognized platform.
Skill Development:
Develop essential journalism skills, including fact-checking, storytelling, and multimedia content creation.
Learn about journalistic ethics, audience engagement, and digital content strategies.
Guidance from Experts:
Receive mentorship from seasoned journalists and content creators at Track2Training.
Get valuable feedback to refine your writing and reporting skills.
Portfolio Building:
Publish your articles with bylines on Track2Training, building a professional portfolio to showcase your work.
Flexible Work Options:
The internship is designed to be remote, enabling you to work from anywhere.
Career Growth Opportunities:
Exceptional interns may be offered long-term collaborations or freelance opportunities with Track2Training.
Roles and Responsibilities
As a journalism intern at Track2Training, you will:
Research and write articles, blogs, and feature stories on various topics.
Conduct interviews and gather firsthand insights from subject matter experts.
Edit and proofread content to ensure accuracy, clarity, and relevance.
Collaborate with the editorial team to plan and execute engaging content.
Assist with multimedia projects, including podcasts, videos, and graphics.
Promote published content on social media to reach a wider audience.
Eligibility Criteria
Track2Training welcomes applications from students and recent graduates who meet the following requirements:
A background in journalism, mass communication, or related fields (preferred but not mandatory).
Strong writing and editing skills with a good command of the English language.
A passion for storytelling, current events, and digital media.
Familiarity with basic digital tools and social media platforms.
Self-motivated and able to meet deadlines in a fast-paced environment.
Internship Duration and Benefits
The internship duration ranges from 1 to 6 months, depending on the candidate’s availability and performance.
All interns will receive a certificate of completion at the end of the internship.
Top-performing interns may be considered for advanced roles or long-term opportunities.
How to Apply
To apply for the journalism internship at Track2Training, follow these steps:
Prepare a resume detailing your skills, education, and achievements.
Write a cover letter expressing your interest in journalism and why you want to join Track2Training.
Attach 2-3 samples of your written work (articles, essays, or blogs).
Submit your application via email to info@track2training.com with the subject line “Application for Journalism Internship.”
What Our Interns Say
“The internship at Track2Training was a turning point for me. The guidance I received helped me understand the nuances of journalism and build confidence in my abilities.” – Kavita Sharma
“Track2Training gave me the opportunity to publish my work and gain hands-on experience. The flexibility and mentorship were invaluable.” – Rohit Gupta
Conclusion
The journalism internship at Track2Training is more than just an opportunity—it’s a platform to learn, grow, and make a mark in the media industry. By joining this program, you’ll gain practical experience, build a strong portfolio, and develop the skills needed to succeed in journalism.
Don’t miss this chance to kickstart your journalism career. Apply now and become a part of Track2Training’s mission to empower aspiring professionals!
A technical paper is a specialized document that presents detailed information about a specific topic, often related to scientific research, engineering, technology, or other technical disciplines. These papers serve as a medium for researchers, professionals, and academics to share new findings, ideas, methodologies, or technologies with a targeted audience. Technical papers are characterized by their precision, depth of analysis, and reliance on data and evidence to support conclusions.
Purpose of a Technical Paper
The primary purpose of a technical paper is to:
Contribute to Knowledge: Disseminate new research findings, innovations, or advancements in a specific field.
Solve Problems: Address technical challenges or propose solutions based on research or experimentation.
Educate and Inform: Provide detailed explanations of complex concepts, making them accessible to other experts or practitioners in the field.
Facilitate Collaboration: Foster knowledge-sharing among professionals, academics, and industry leaders.
Key Features of a Technical Paper
Technical Rigor: A technical paper is grounded in accuracy, with well-defined methodologies and robust analysis. It relies on evidence, such as experimental results, theoretical models, or simulations.
Clear Structure: Technical papers follow a standardized format that allows readers to easily navigate the content. This structure often includes an abstract, introduction, methodology, results, discussion, and conclusion.
Specialized Audience: The language and depth of detail in a technical paper are tailored for a specific audience, such as engineers, scientists, or domain experts.
Use of Visuals: Figures, graphs, charts, and tables are commonly used to present data and enhance understanding.
Title: A concise and descriptive title that conveys the main topic of the paper.
Abstract: A brief summary of the paper, outlining the research problem, methods, key findings, and significance.
Introduction:
Defines the problem or question being addressed.
Provides background information and context.
States the objectives of the study or research.
Literature Review (if applicable):
Summarizes relevant research in the field.
Identifies gaps that the paper aims to address.
Methodology:
Describes the methods, tools, or processes used to conduct the research.
Provides enough detail for replication of the study.
Results:
Presents the findings of the study, often using visuals like graphs or tables.
Includes raw data, statistical analysis, or experimental outcomes.
Discussion:
Interprets the results and explains their implications.
Compares findings with existing literature.
Conclusion:
Summarizes key insights and contributions.
Highlights limitations and suggests directions for future research.
References:
Lists all sources cited in the paper, formatted according to a standard style (e.g., APA, IEEE, or MLA).
Appendices (if needed):
Includes supplementary material, such as raw data, mathematical derivations, or additional explanations.
Types of Technical Papers
Research Papers: Present original findings or discoveries in a specific field.
Review Papers: Summarize and synthesize existing research on a particular topic.
White Papers: Explain technical topics, often from an industry perspective, and advocate for a specific solution or approach.
Case Studies: Provide detailed accounts of real-world applications or projects.
Standards Papers: Define guidelines, standards, or protocols for technology or processes.
Tutorial Papers: Offer step-by-step instructions or educational content on a particular technique or methodology.
Importance of Technical Papers
Advancing Innovation: By sharing new insights, technical papers drive innovation in science and technology.
Building Expertise: They serve as a resource for professionals and students to deepen their knowledge.
Peer Review and Validation: Technical papers often undergo peer review, ensuring the credibility and reliability of the work.
Documentation and Record: They provide a permanent record of developments in a field, serving as a reference for future research.
Facilitating Communication: Technical papers enable collaboration and communication across academia, industry, and government.
Writing a Technical Paper
Plan and Research: Identify the key points, research thoroughly, and organize information logically.
Draft and Edit: Write the paper in a clear, concise style. Review multiple drafts to refine the content.
Use Visual Aids: Incorporate diagrams, tables, and charts to enhance clarity and support findings.
Seek Feedback: Share the draft with colleagues or mentors for constructive feedback.
Follow Guidelines: Adhere to formatting and submission guidelines specified by the intended publication or conference.
Common Challenges in Technical Paper Writing
Complexity: Striking a balance between technical detail and readability can be challenging.
Clarity: Avoiding jargon while maintaining precision requires careful word choice.
Plagiarism: Proper citation of sources is crucial to avoid academic misconduct.
Rejection: High standards in peer-reviewed journals mean many papers face rejection. Revisions and resubmissions are often part of the process.
Conclusion
Technical papers play a vital role in advancing knowledge and fostering innovation across technical and scientific fields. By adhering to rigorous standards and focusing on clarity, accuracy, and relevance, technical papers ensure the effective dissemination of information, enabling professionals and researchers to collaborate, innovate, and solve real-world problems. Whether contributing new findings or summarizing existing knowledge, technical papers are indispensable to the progression of technology and science.
References
Copeck, T., Barker, K., Delisle, S., Szpakowicz, S., & Delannoy, J. F. (1997). What is technical text?. Language Sciences, 19(4), 391-423.
Crowcroft, J. (2007). Net neutrality: the technical side of the debate: a white paper. ACM SIGCOMM Computer Communication Review, 37(1), 49-56.
Dehalwar, K., & Sharma, S. N. (2023). Fundamentals of Research Writing and Uses of Research Methodologies. Edupedia Publications Pvt Ltd.
Ehrenberg, A. S. C. (1982). Writing technical papers or reports. The American Statistician, 36(4), 326-329.
McConnell, S. (2002). How to write a good technical article. IEEE Softw., 19(5), 5-7.
A practice-oriented paper is a type of academic or professional writing that focuses on the practical application of theories, research findings, or concepts to real-world problems or settings. Unlike purely theoretical or research-focused papers, practice-oriented papers aim to bridge the gap between knowledge and action by offering insights, methods, tools, or strategies that practitioners can implement.
Key Characteristics of Practice-Oriented Papers:
Focus on Application:
Explains how concepts or findings can be applied in practical settings.
Often tailored to professionals or practitioners in a specific field (e.g., education, healthcare, engineering).
Actionable Recommendations:
Includes specific steps, tools, or techniques for solving a problem or improving outcomes.
Real-World Relevance:
Rooted in real-world challenges or case studies.
May draw on the author’s direct experience or data collected from practical scenarios.
Clear and Accessible Language:
Written to be understandable by non-academic audiences, such as field professionals.
Collaboration Between Theory and Practice:
Often links theoretical frameworks to their practical implementation.
Demonstrates how theoretical knowledge enhances practice.
Examples of Practice-Oriented Paper Topics:
In Education: “Strategies for Incorporating Technology into the Classroom for Enhanced Learning Outcomes.”
In Business: “Best Practices for Managing Remote Teams in a Post-Pandemic World.”
In Healthcare: “Implementing Evidence-Based Guidelines for Diabetes Management in Community Clinics.”
Common Formats:
Case studies.
How-to guides.
Policy briefs.
Reports on pilot programs or interventions.
Reflective essays based on practical experience.
Intended Audience:
The audience is usually professionals or stakeholders in the relevant field who are seeking actionable insights to improve their work, address challenges, or enhance effectiveness.
If you’re writing or using a practice-oriented paper, it’s essential to focus on actionable solutions and ensure that the content is both grounded in evidence and tailored to the practical needs of your audience.
References
Brem, A. (2024). Editorial Publishing in a Practice-Oriented Journal: Why and How You Should Do It. IEEE Engineering Management Review, 52(2), 6-8.
Castonguay, L. G., Atzil-Slonim, D., de Jong, K., & Youn, S. J. (2024). Practice-oriented research: An introduction to new developments and future directions. Administration and Policy in Mental Health and Mental Health Services Research, 51(3), 287-290.
Dehalwar, K., & Sharma, S. N. (2023). Fundamentals of Research Writing and Uses of Research Methodologies. Edupedia Publications Pvt Ltd.
Jonas, M., Littig, B., & Wroblewski, A. (Eds.). (2017). Methodological reflections on practice oriented theories. Springer.
Pettersen, I. N. (2015). Towards practice-oriented design for sustainability: the compatibility with selected design fields. International Journal of Sustainable Engineering, 8(3), 206-218.
Training and internship opportunities are critical for architecture and planning students as they bridge academic learning with practical application, enhancing skills and preparing students for professional careers. Below is a detailed discussion of various opportunities available:
1. Architectural Firms and Planning Consultancies
Roles: Interns in architectural firms work on design projects, develop CAD drawings, create 3D models, and assist with project documentation. In planning consultancies, tasks might include urban analysis, zoning studies, and report preparation.
Skills Developed:
Technical proficiency in software such as AutoCAD, SketchUp, Revit, and GIS tools.
Understanding client requirements and project feasibility.
Exposure to real-world constraints like budget, materials, and regulations.
Opportunities:
International firms like Foster + Partners, Gensler, or AECOM.
Local firms with a strong portfolio in housing, urban design, or infrastructure projects.
2. Government and Public Sector Internships
Opportunities:
Urban Development Authorities: Departments like municipal corporations, urban development ministries, or city planning bodies often offer internships to students in city planning, housing, or transport planning.
Heritage Conservation Departments: Roles in documentation, restoration planning, and heritage management.
Example:
Internships with agencies like HUDCO (Housing and Urban Development Corporation), Smart City Missions in India, or city planning departments in countries worldwide.
Benefits:
Exposure to policymaking and public-sector project execution.
Opportunities to work on large-scale public infrastructure projects.
3. Non-Governmental Organizations (NGOs) and Research Institutes
NGOs: Interning with organizations focused on sustainable development, disaster management, or housing for the underprivileged can offer unique experiences.
Research Institutes: Organizations like the National Institute of Urban Affairs (NIUA) or regional research bodies provide internships involving data analysis, policy formulation, or publishing research papers.
Skills Developed:
Social and environmental aspects of architecture and planning.
Grant-writing and stakeholder engagement.
4. Real Estate and Construction Companies
Roles: Interns may assist with site planning, feasibility studies, and project management tasks.
Notable Companies:
Real estate developers like CBRE, Jones Lang LaSalle (JLL), or regional property developers.
Learning Outcomes:
Insight into the commercial aspects of design and planning.
Hands-on experience with construction technologies and sustainability practices.
5. Academic and Teaching Assistantships
Many universities and colleges offer opportunities for students to work as teaching or research assistants during their studies.
Activities:
Assisting professors in research projects, model-making, or preparing teaching materials.
Benefits:
Deepened theoretical knowledge and academic networking.
Opportunities to publish papers or participate in conferences.
6. Specialized Design and Software Training Programs
Purpose: Enhance technical skills in areas like parametric design, Building Information Modeling (BIM), or GIS.
Programs:
Workshops and certifications by software companies such as Autodesk, Rhinoceros, or ESRI.
Online platforms like Coursera, edX, and LinkedIn Learning offer project-based learning modules.
Impact:
Stand out in the job market with advanced technical skills.
Learn about cutting-edge tools used in industry and academia.
7. Internships in Sustainability and Green Building Design
Opportunities: Internships in firms specializing in LEED certification, renewable energy integration, and sustainable urban design.
Example:
Green building councils or eco-architecture firms.
Skills Gained:
Techniques for energy modeling, water management, and lifecycle cost analysis.
Knowledge of global standards like LEED, BREEAM, or GRIHA.
8. International Internships and Exchange Programs
Organizations: Programs such as Erasmus+ in Europe or IAESTE (International Association for the Exchange of Students for Technical Experience) provide placements worldwide.
Advantages:
Exposure to global architectural and planning standards.
Networking with international professionals and peers.
Challenges:
May require competitive application and sponsorship for travel or accommodation.
9. Competitions and Live Projects
Competitions such as the Archiprix, Urban Labs, or national student design contests often include mentorship and training components.
Participating in these provides:
Practical problem-solving skills.
A portfolio of innovative projects.
10. Construction Site Internships
Experience:
Shadowing construction managers and understanding site operations.
Skills:
Learning construction techniques, material properties, and project coordination.
Suitability:
Essential for students interested in execution and project management.
Conclusion
Training and internship opportunities provide invaluable experiences for architecture and planning students, aligning their academic knowledge with professional needs. Proactively seeking internships in varied sectors such as design firms, NGOs, government bodies, and international platforms equips students with a diverse skill set and prepares them for multifaceted roles in their careers.
The inclusion of women in management positions is a critical marker of gender equality and organizational diversity. Over the decades, there has been progress in bridging the gender gap in leadership roles, but significant challenges remain. This discussion explores the current landscape, benefits of gender diversity in management, barriers faced by women, and strategies for achieving equitable representation.
1. Current Status of Women in Management
Global Trends: Despite growing awareness, women remain underrepresented in management positions worldwide. According to reports by organizations like the International Labour Organization (ILO) and McKinsey, women occupy about 29% of senior management roles globally as of 2023, with significant variation across industries and regions.
Regional Disparities:
In North America and Europe, women have made strides, particularly in the corporate and public sectors, supported by diversity policies and quotas.
In Asia-Pacific and the Middle East, cultural norms and societal expectations pose barriers, resulting in slower progress.
In Sub-Saharan Africa, entrepreneurship among women has risen, but their presence in formal management roles remains limited.
Industry-Specific Representation: Women are better represented in industries like healthcare, education, and hospitality, but their presence is significantly lower in technology, engineering, and manufacturing sectors.
2. Benefits of Women in Management
Enhanced Organizational Performance: Studies consistently show that companies with diverse leadership teams outperform those without in terms of profitability, innovation, and decision-making quality. Diverse perspectives lead to better problem-solving and strategic planning.
Improved Workplace Culture: Women leaders often promote inclusive workplace policies and practices, fostering an environment of collaboration, trust, and employee satisfaction.
Social and Economic Growth: Gender-diverse management contributes to economic growth by leveraging the full talent pool. When women thrive in leadership roles, they inspire and mentor future generations.
3. Challenges Facing Women in Management
Structural Barriers:
Glass Ceiling: Unofficial barriers prevent women from advancing to top leadership roles despite qualifications and performance.
Pay Gap: Women in management often earn less than their male counterparts for similar roles, perpetuating financial inequity.
Societal and Cultural Norms:
Gender stereotypes portray leadership as a predominantly male domain, creating biases in hiring and promotion.
Women often face societal expectations to prioritize family responsibilities, limiting their career advancement opportunities.
Organizational Challenges:
Lack of mentorship and sponsorship opportunities hinders career progression for women.
Workplace cultures that favor “masculine” leadership traits can marginalize women with different leadership styles.
Intersectional Disparities: Women from marginalized communities face compounded discrimination based on race, ethnicity, or socio-economic status, further limiting their opportunities.
4. Strategies to Promote Women in Management
Policy Interventions:
Quotas and Targets: Governments and organizations can set targets for female representation in leadership to drive accountability.
Equal Pay Policies: Enforcing transparency in pay structures ensures women receive equitable compensation.
Organizational Initiatives:
Leadership Development Programs: Offering training and development opportunities tailored to women prepares them for managerial roles.
Flexible Work Policies: Enabling work-life balance through remote work, parental leave, and flexible hours supports women in leadership.
Diversity and Inclusion Committees: Establishing committees to monitor and promote diversity initiatives ensures sustained progress.
Mentorship and Sponsorship: Senior leaders should mentor and sponsor aspiring women managers, providing them with guidance, networking opportunities, and advocacy.
Addressing Biases: Conducting unconscious bias training helps organizations identify and mitigate discriminatory practices in recruitment, evaluation, and promotion.
5. Case Studies
Norway’s Gender Quota in Boardrooms: Norway introduced a mandatory quota requiring 40% of board members in public companies to be women. This policy significantly increased female representation in senior roles and inspired similar initiatives globally.
Lean In Movement: Founded by Sheryl Sandberg, this initiative encourages women to pursue leadership roles while advocating for systemic changes in workplace policies and culture.
UN Women’s Empowerment Principles (WEPs): The WEPs provide guidance to businesses on promoting gender equality in the workplace, marketplace, and community. Companies adopting these principles report better gender balance in management.
6. Future Directions
Technological Innovation: Leveraging technology to provide virtual mentorship, networking platforms, and data-driven approaches to address gender disparities can accelerate change.
Focus on Intersectionality: Policies must consider intersectional barriers to ensure inclusivity for all women, including those from underrepresented groups.
Corporate Accountability: Organizations should publish annual diversity reports and set measurable goals to track progress in promoting women in management.
Cultural Shifts: Encouraging society to redefine leadership as inclusive and diverse is crucial. Schools, media, and community programs can play a role in challenging stereotypes.
7. Conclusion
The presence of women in management positions is not only a matter of fairness but also a strategic imperative for organizations aiming to thrive in a competitive, globalized world. While progress has been made, achieving gender parity in leadership requires a collective effort from governments, organizations, and society at large. By dismantling systemic barriers, promoting inclusive policies, and fostering cultural change, the vision of gender-equal leadership can become a reality.
References
Broadbridge, A., & Simpson, R. (2011). 25 years on: reflecting on the past and looking to the future in gender and management research. British journal of management, 22(3), 470-483.
Brush, C. G. (1992). Research on women business owners: Past trends, a new perspective and future directions. Entrepreneurship theory and practice, 16(4), 5-30.
Dehalwar, K., & Sharma, S. N. (2024). Politics in the Name of Women’s Reservation. Contemporary Voice of Dalit, 2455328X241262562.
Lyness, K. S., & Terrazas, J. M. (2006). Women in management: An update on their progress and persistent challenges. International Review of Industrial and Organizational Psychology 2006, 21, 267-294.
Madsen, S. R. (2012). Women and leadership in higher education: Current realities, challenges, and future directions. Advances in Developing Human Resources, 14(2), 131-139.
Concrete is one of the most widely used construction materials globally, accounting for a significant portion of the built environment. However, its production is responsible for approximately 8% of global carbon dioxide emissions, mainly due to cement manufacturing. In response to this environmental challenge, scientists and engineers have developed biocrete, a cutting-edge material poised to revolutionize the construction industry.
What is Biocrete?
Biocrete, also known as bio-concrete or living concrete, is an innovative material infused with biological components, typically microorganisms, to enhance its properties and sustainability. Unlike traditional concrete, biocrete integrates living systems that provide self-healing, reduced carbon footprint, and improved durability.
Biocrete comes in various forms, tailored to specific applications:
Self-healing biocrete: Incorporates bacteria that produce calcium carbonate to seal cracks.
Biologically-derived cement replacements: Use microbial processes to generate bio-based binders.
Algae-based biocrete: Employs algae for carbon sequestration during production.
The Science Behind Biocrete
1. Self-Healing Mechanism
Biocrete’s self-healing properties leverage bacteria such as Bacillus species, which remain dormant within the material until a crack forms. When exposed to water and oxygen through the crack, these bacteria become active, consuming calcium lactate and producing calcium carbonate. This calcium carbonate fills and seals the cracks, restoring the material’s integrity.
Microorganisms, such as Sporosarcina pasteurii, are utilized to precipitate calcium carbonate through metabolic processes. This biological method offers a sustainable alternative to conventional cement by reducing the need for high-temperature processes.
3. Algae-Based Solutions
Certain strains of algae, like Chlamydomonas reinhardtii, capture atmospheric CO₂ during photosynthesis and produce biomass and calcium carbonate. Integrating these algae into concrete production not only offsets carbon emissions but also creates a renewable cycle.
Advantages of Biocrete
Environmental Benefits:
Reduced Carbon Emissions: Biocrete eliminates or minimizes the use of traditional Portland cement, significantly lowering greenhouse gas emissions.
Carbon Sequestration: Algae-based and microbial processes can actively sequester carbon during production.
Durability:
Self-healing properties extend the lifespan of structures by reducing maintenance and preventing water infiltration through cracks.
Enhanced resistance to chemical attacks, especially in marine environments.
Resource Efficiency:
Utilizes biological and renewable inputs, reducing reliance on non-renewable resources.
Potential for using waste products, such as agricultural residues, as feedstocks for microbial processes.
Cost Savings:
Lower long-term maintenance costs due to self-healing.
Potential for reduced material costs as production scales up.
Applications of Biocrete
Infrastructure Repair: Self-healing biocrete is particularly useful for repairing bridges, tunnels, and roadways, where traditional maintenance is challenging and costly.
Green Building Projects: Architects and developers increasingly use biocrete in sustainable construction to meet environmental certifications.
Marine Structures: Biocrete’s resistance to seawater makes it ideal for offshore platforms, seawalls, and docks.
Customizable Design: Its properties can be tailored for specific applications, such as soundproofing or thermal insulation.
Challenges and Limitations
While biocrete holds immense promise, it faces several challenges:
Production Costs: Currently, biocrete is more expensive to produce than traditional concrete due to limited scalability and the cost of biological components.
Standardization: The construction industry lacks clear guidelines and standards for integrating biocrete into mainstream projects.
Durability in Extreme Conditions: The long-term performance of biocrete under extreme environmental stress requires further testing.
Public Perception: Adoption may be hindered by skepticism about the reliability of living materials in construction.
The Future of Biocrete
The growing emphasis on sustainable development and green technologies is likely to accelerate the adoption of biocrete. Researchers are exploring ways to:
Scale up production while reducing costs.
Improve the efficiency and resilience of biological processes.
Integrate biocrete with other smart construction technologies, such as sensors and robotics.
Governments and private organizations can play a pivotal role by funding research, creating incentives, and establishing standards that encourage the adoption of biocrete in construction projects.
Conclusion
Biocrete represents a transformative innovation in the construction industry. By blending biology with traditional materials, it offers a sustainable solution to the environmental challenges posed by conventional concrete. While hurdles remain, ongoing advancements in material science and biotechnology are set to make biocrete a cornerstone of sustainable infrastructure. As the world strives to reduce its carbon footprint, biocrete stands out as a promising step toward a greener future.
References
Hayakawa, M., Matsuoka, Y., & Shindoh, T. (1993). Development and application of superworkable concrete. In Special Concretes-Workability and Mixing (pp. 185-192). CRC Press.
Kerley, M. (2004). Structural identification of phases constituting biocrete acid resistant mortar.
Sharma, S. N., Prajapati, R., Jaiswal, A., & Dehalwar, K. (2024, June). A Comparative Study of the Applications and Prospects of Self-healing Concrete/Biocrete and Self-Sensing Concrete. In IOP Conference Series: Earth and Environmental Science (Vol. 1326, No. 1, p. 012090). IOP Publishing.
FormsPal.com is a dedicated organization that works to better support our communities and every individual, regardless of gender, age, nationality, or religion, by providing high-quality free legal templates and information online. This resource provides thousands of templates that are available for download with detailed instructions for filling. While everyone needs to have fundamental legal arrangements in place, such as a will of inheritance, real estate insurance, power of attorney in case of an emergency, and rental agreements, minorities are at a disadvantage when it comes to paying high attorney fees, taking time off their demanding jobs, and dealing with pre-tenancy issues. FormsPal solves this issue by providing legal documents for free. Thousands of templates are available for download with detailed instructions for filling.
Writing and Editing Services from Track2Training
Track2Training offers comprehensive writing and editing services tailored to meet the diverse needs of students, researchers, and professionals. Whether you are preparing academic manuscripts, articles, research papers, or creative works, their services ensure high-quality content with a professional touch.
Services Offered
Academic Writing Assistance
Research papers
Theses and dissertations
Essays and coursework
Editing and Proofreading
Grammar and syntax checks
Formatting as per specific style guides (APA, MLA, Chicago, etc.)
Ensuring clarity, coherence, and logical flow
Content Development
E-books
Articles and blog posts
Reports and white papers
Resume and Cover Letter Writing
Professional CV creation
Custom cover letters tailored for job applications
Creative Writing
Stories, poetry, and scripts
Editing for tone, style, and audience engagement
Plagiarism Checking and Reduction
Advanced tools for plagiarism detection
Assistance in rephrasing and citation
Why Choose Track2Training?
Expert Team: Experienced professionals from diverse fields.
Quick Turnaround: Timely delivery without compromising quality.
Customized Solutions: Services tailored to individual project requirements.
Affordable Rates: Competitive pricing with high value.
For more details, visit Track2Training or contact their support team to get started on your writing and editing needs.
The incidents of women lynching in Manipur have drawn significant attention to the issue of vigilantism and the dangers it poses, particularly to vulnerable groups such as women. It’s important to address the issue of mob attacks on women in the context of India and examine the complex factors contributing to such incidents. India, like many other societies, has deep-rooted gender inequalities and a patriarchal social structure. Despite significant progress in women’s rights and empowerment, there are still pockets of society where traditional gender norms and attitudes persist, leading to the marginalization and vulnerability of women. Some cultural norms and beliefs may perpetuate the notion that women are subordinate to men and should not challenge authority. This can result in the objectification and disrespect of women, making them targets of mob attacks in certain situations. In some cases, mob attacks on women may be used as a means of exerting control or punishment. Women who are perceived as deviating from societal norms or who assert their rights and freedoms may face hostility from conservative elements.
Despite progress in women’s empowerment, there are still areas where women face limited access to education, healthcare, and economic opportunities. This lack of empowerment can make them more susceptible to violence and abuse. The effectiveness of law enforcement and the justice system in addressing crimes against women can vary widely across regions in India. Weak law enforcement and slow justice processes may embolden perpetrators and encourage mob violence. Mob attacks often involve a group mentality where individuals may feel less accountable for their actions, leading to a sense of impunity. This can lead to the escalation of violence, especially against vulnerable targets like women. In some cases, mob attacks against women may be linked to underlying communal or caste tensions. Women from minority or marginalized communities may be targeted as part of larger conflicts.
Addressing these issues requires a multi-faceted approach:
Promoting gender equality and women’s empowerment through education, awareness campaigns, and economic opportunities.
Strengthening law enforcement and the justice system to ensure swift and fair action against perpetrators of violence.
Challenging cultural norms and beliefs that perpetuate gender inequality and discrimination.
Encouraging community engagement and dialogue to counter mob mentality and promote respect for women’s rights.
Enhancing women’s safety through measures like improved street lighting, safe public transportation, and community watch programs.
It’s important to recognize that progress is being made in India towards addressing these challenges, and numerous individuals and organizations are working tirelessly to improve the status of women and their safety. However, the issue remains complex and will require sustained efforts from all sections of society to achieve lasting change.
Animal husbandry, the practice of raising and breeding animals for various purposes, has been an integral part of human civilization for thousands of years. It plays a crucial role in improving livelihoods worldwide, particularly in rural communities. Animal husbandry offers a wide range of benefits, including food security, economic opportunities, environmental sustainability, and social development. This essay explores the usefulness of animal husbandry in enhancing livelihoods and highlights its significance in meeting the challenges of a rapidly changing world.
Food Security and Nutrition
One of the primary advantages of animal husbandry is its contribution to food security and nutrition. Livestock serves as an essential source of high-quality protein, essential minerals, and vitamins. Animal products such as meat, milk, and eggs provide vital nutrients necessary for human growth and development. Moreover, animal husbandry diversifies dietary options, making communities less reliant on a limited range of crops. This resilience is especially valuable in areas prone to agricultural risks, such as droughts or pests, as livestock can utilize marginal lands and convert low-quality forage into valuable protein sources.
Economic Opportunities
Animal husbandry offers numerous economic opportunities, particularly for rural communities. Livestock production creates jobs along the entire value chain, from breeding and rearing animals to processing and marketing animal products. Many small-scale farmers and pastoralists depend on livestock as a primary source of income and livelihood. By engaging in animal husbandry, individuals can generate a sustainable income, improve their financial stability, and escape the cycle of poverty.
Furthermore, animal husbandry contributes to rural economies by stimulating local markets. It encourages the growth of supporting industries such as veterinary services, animal feed production, and equipment manufacturing. Additionally, the sale of animals and their by-products generates revenue that can be invested in education, healthcare, and infrastructure development, leading to overall community advancement.
Environmental Sustainability
Animal husbandry, when practiced sustainably, plays a vital role in environmental conservation. Well-managed livestock systems can contribute to soil fertility, enhance nutrient cycling, and promote biodiversity. Animals, through their grazing patterns, help maintain grasslands and prevent the encroachment of invasive species. Moreover, livestock waste can be used as organic fertilizer, reducing the dependency on chemical inputs and enhancing soil health.
Furthermore, animal husbandry can foster sustainable land management practices. By employing rotational grazing and adopting agroforestry techniques, farmers can optimize land utilization and minimize soil erosion. Additionally, integrated farming systems that combine crop cultivation with livestock rearing contribute to resource efficiency and reduce waste. Such practices promote the preservation of natural resources and mitigate the environmental impact of agricultural activities.
Social Development and Resilience
Animal husbandry plays a pivotal role in social development, especially in marginalized communities. By engaging in animal husbandry, individuals gain valuable skills and knowledge, empowering them to become self-reliant and independent. Livestock rearing provides opportunities for vocational training and capacity building, enabling individuals to enhance their agricultural practices and improve productivity.
Moreover, animal husbandry can contribute to gender equality and women empowerment. In many societies, women play a significant role in livestock management, which allows them to generate income and actively participate in decision-making processes. By recognizing and supporting women’s involvement in animal husbandry, communities can achieve more equitable and inclusive development.
Furthermore, animal husbandry can enhance community resilience in the face of external shocks such as natural disasters or economic downturns. Diversifying livelihood options by incorporating livestock rearing reduces vulnerability and provides a safety net during difficult times. It creates opportunities for income generation and asset accumulation, enabling communities to bounce back from crises and secure their future.
Conclusion
Animal husbandry offers a range of benefits that contribute to improving livelihoods globally. It plays a critical role in ensuring food security, creating economic opportunities, promoting environmental sustainability, and fostering social development. By recognizing the importance of animal husbandry and supporting sustainable practices, societies can harness its full potential for the betterment of individuals and communities. As we navigate the challenges of a rapidly changing world, animal husbandry will continue to play a pivotal role in shaping resilient and prosperous livelihoods.
References
Adepoju Abimbola, O., & Oluwakemi, A. O. (2013). Livelihood diversification and welfare of rural households in Ondo State, Nigeria. Journal of Development and Agricultural, 5(12), 482-489.
Allison, E. H., & Ellis, F. (2001). The livelihoods approach and management of small-scale fisheries. Marine policy, 25(5), 377-388.
Belcher, B., Ruiz-Pérez, M., & Achdiawan, R. (2005). Global patterns and trends in the use and management of commercial NTFPs: implications for livelihoods and conservation. World development, 33(9), 1435-1452.
Chambers, R., & Conway, G. (1992). Sustainable rural livelihoods: practical concepts for the 21st century. Institute of Development Studies (UK).
Herrero, M., Thornton, P. K., Gerber, P., & Reid, R. S. (2009). Livestock, livelihoods and the environment: understanding the trade-offs. Current Opinion in Environmental Sustainability, 1(2), 111-120.
Serrat, O., & Serrat, O. (2017). The sustainable livelihoods approach. Knowledge solutions: Tools, methods, and approaches to drive organizational performance, 21-26.
Sharma, S. N., Chatterjee, S., & Dehalwar, K. (2023). Mahatma Gandhi National Rural Employment Guarantee Scheme: Challenges and Opportunities. Think India Journal, 26(1), 7-15.
Williams, T. O. (2004). Sustainable crop-livestock production for improved livelihoods and natural resource management in West Africa. ILRI (aka ILCA and ILRAD).
GIS Day is an international event celebrated annually on the third Wednesday of November. It serves as a platform to showcase the significant contributions of Geographic Information Systems (GIS) to society, science, and various industries. This day was first initiated in 1999 by Esri, a leading GIS software company, as a part of Geography Awareness Week. The idea was to inspire curiosity about geography and promote the importance of spatial thinking.
Purpose of GIS Day
GIS Day is dedicated to:
Raising Awareness: Educating people about GIS technology and its transformative applications in understanding spatial patterns, solving complex problems, and making informed decisions.
Showcasing Innovation: Demonstrating real-world GIS applications in areas such as urban planning, environmental conservation, disaster management, transportation, and public health.
Building Community: Bringing together GIS professionals, students, educators, and enthusiasts to share knowledge, experiences, and innovations.
Importance of GIS
GIS is a powerful tool that integrates data from various sources to visualize, analyze, and interpret spatial relationships. Its applications are vast:
Urban Planning: Designing sustainable cities, optimizing land use, and improving infrastructure.
Environmental Management: Tracking deforestation, monitoring wildlife, and managing water resources.
Disaster Response: Mapping areas affected by natural disasters to coordinate relief efforts.
Health Care: Identifying disease outbreaks and improving healthcare delivery.
Transportation: Optimizing logistics, route planning, and managing traffic systems.
How GIS Day is Celebrated
Workshops and Seminars: Educational institutions, government bodies, and organizations host workshops and seminars to introduce GIS concepts and software.
Exhibitions: Professionals and students showcase GIS projects, demonstrating its impact on various fields.
Hands-On Activities: Participants engage in interactive activities, such as map-making and geocaching, to explore the fun side of GIS.
Community Mapping: Collaborative mapping projects are organized to address local issues, like mapping safe routes, water sources, or underserved areas.
Guest Lectures: GIS experts share insights, latest trends, and real-world applications of GIS technology.
Significance for Students and Enthusiasts
For students and budding GIS professionals, GIS Day offers an excellent opportunity to:
Explore career prospects in GIS and related fields.
Network with industry leaders and academics.
Gain hands-on experience with GIS tools and software.
Themes and Innovations
Every GIS Day may highlight specific themes such as smart cities, climate change, or disaster resilience. It is also a platform to unveil advancements in GIS technology, like 3D mapping, AI integration, or real-time geospatial analysis.
Impact of GIS Day
GIS Day fosters a deeper understanding of geography and geospatial technology. It encourages the next generation to pursue careers in geospatial sciences, contributing to solutions for global challenges like urbanization, climate change, and natural disasters.
Key Takeaway
GIS Day is more than just a celebration of technology; it is a reminder of the interconnectedness of our world and the potential of spatial thinking to address complex problems. Whether you’re a professional, a student, or simply curious, GIS Day offers a window into the power of mapping and the endless possibilities it holds.
References
Sadvari, J., Koshoffer, A., Gorham, R. B., & Phillips, K. (2020). GIS Day across the Association of Research Libraries: Outreach, Education, and Collaboration. Journal of Map & Geography Libraries, 16(3), 283-299.
Sharma, S. N., Dehalwar, K., & Singh, J. (2023). Cellular Automata Model for Smart Urban Growth Management.
Weimer, K. H., Olivares, M., & Bedenbaugh, R. A. (2012). GIS day and web promotion: Retrospective analysis of US ARL libraries’ involvement. Journal of Map & Geography Libraries, 8(1), 39-57.
Coupling and coordination are two key concepts often studied together in software engineering, systems design, and organizational research. When used as part of a research technique, these concepts explore how components of a system or organization interact and depend on each other. Here’s a detailed explanation:
1. Coupling
Coupling refers to the degree of interdependence or linkage between components in a system. It measures how tightly two or more elements (modules, teams, or subsystems) are connected or reliant upon each other.
Types of Coupling in Software and Research:
Tight Coupling:
Strong dependency between components.
Changes in one component heavily affect others.
Leads to reduced flexibility and scalability.
Example: In software, tightly coupled modules require simultaneous modification for changes.
Loose Coupling:
Minimal dependency between components.
Greater flexibility and easier maintenance.
Preferred for modular designs, as each component can evolve independently.
Example: Microservices architecture.
Data Coupling:
When modules share data explicitly.
Example: Passing parameters between functions.
Control Coupling:
One component dictates the behavior of another by sending control information.
Example: Passing a flag that alters execution.
Research Focus on Coupling:
Coupling is analyzed to understand system behavior, predict change impacts, or identify potential failures.
In organizations, coupling research examines how closely teams or departments depend on one another and how this impacts productivity, resilience, and innovation.
2. Coordination
Coordination refers to the mechanisms and processes used to manage dependencies between different entities (e.g., software modules, organizational teams, or processes).
Coordination Techniques:
Direct Coordination:
Entities communicate directly, often through real-time communication or interaction.
Example: Standup meetings in agile teams.
Indirect Coordination:
Managed through intermediaries like shared resources, schedules, or tools.
Example: Using version control systems in software development.
Synchronous vs. Asynchronous Coordination:
Synchronous: Real-time interaction, e.g., video calls.
Asynchronous: Delayed interaction, e.g., emails or task boards.
Implicit vs. Explicit Coordination:
Implicit: Coordination happens automatically through shared understanding or workflows.
Explicit: Clearly defined roles, processes, and instructions.
Research Focus on Coordination:
Studying coordination helps identify bottlenecks, inefficiencies, and communication barriers.
Investigates how systems adapt to changes in requirements or unexpected events.
Coupling and Coordination in Research:
When studied together, coupling and coordination provide insights into the complexity of systems and their efficiency:
Key Research Techniques:
Dependency Analysis:
Identifying and mapping dependencies in a system or organization.
Used in system design and organizational behavior studies.
Network Analysis:
Visualizing and analyzing the relationships and dependencies between entities.
Example: Social network analysis for team coordination.
Simulation Models:
Simulating tightly coupled or loosely coupled systems to observe performance under different coordination mechanisms.
Case Studies:
In-depth exploration of specific instances of coupled systems or coordinated teams to identify best practices and challenges.
Empirical Studies:
Data-driven approaches using surveys, interviews, or metrics to measure coupling and coordination.
Applications Across Domains:
Software Engineering:
Design loosely coupled modules with effective coordination through APIs or middleware.
Example: Object-oriented programming promotes low coupling and high cohesion.
Organizational Research:
Analyzing how inter-team dependencies and coordination tools affect productivity.
Example: Investigating the use of agile practices for team collaboration.
System Design:
Balancing tight coupling for performance with loose coupling for flexibility.
Example: Designing IoT systems with minimal interdependence between devices.
Process Management:
Studying how manufacturing or logistics systems handle coupling and coordination.
Summary
Coupling and coordination research techniques involve analyzing interdependencies and communication mechanisms within systems or organizations. While coupling focuses on how tightly entities are linked, coordination emphasizes the processes for managing these dependencies. Together, these concepts guide the design of efficient, adaptable, and scalable systems.
References
Li, J., Fang, H., Fang, S., & Siddika, S. E. (2018). Investigation of the relationship among university–research institute–industry innovations using a coupling coordination degree model. Sustainability, 10(6), 1954.
Lodhi, A. S., Jaiswal, A., & Sharma, S. N. (2024). Assessing bus users satisfaction using discrete choice models: a case of Bhopal. Innovative Infrastructure Solutions, 9(11), 1-27.
Sharma, S. N., & Adeoye, M. A. (2024). New Perspectives on Transformative Leadership in Education.
Yan, B. R., Dong, Q. L., Li, Q., Amin, F. U., & Wu, J. N. (2021). A study on the coupling and coordination between logistics industry and economy in the background of high-quality development. Sustainability, 13(18), 10360.
Zhao, Y., Hou, P., Jiang, J., Zhai, J., Chen, Y., Wang, Y., … & Xu, H. (2021). Coordination study on ecological and economic coupling of the Yellow River Basin. International journal of environmental research and public health, 18(20), 10664.
The phenomenon of rising land prices in urban areas is a critical issue affecting urban planning, housing affordability, and economic development. Over recent decades, urban land prices have surged globally, driven by complex interrelated factors. This escalation impacts individuals, businesses, and governments alike, shaping urban landscapes and influencing societal structures.
Key Factors Influencing Land Prices in Urban Areas
1. Demand and Supply Dynamics
Population Growth: Urbanization leads to an influx of people into cities, increasing demand for residential, commercial, and industrial spaces. As the urban population grows, the limited availability of land drives up prices.
Limited Land Availability: Urban areas often face constraints such as geographical boundaries, zoning regulations, and environmental considerations, which limit the supply of developable land, thereby pushing prices higher.
2. Economic Development
Infrastructure Development: Proximity to infrastructure such as transportation networks, schools, hospitals, and utilities makes certain areas more desirable, increasing land values.
Economic Opportunities: Cities with robust economic activity attract businesses and workers, increasing demand for land. Regions with thriving industries, tech hubs, or business districts experience sharper price increases.
3. Government Policies and Regulations
Zoning Laws: Regulations that dictate land use can impact prices significantly. For instance, limiting residential development in certain areas can lead to higher prices due to scarcity.
Taxation and Subsidies: Policies such as property taxes, incentives for development, or subsidies for affordable housing can indirectly affect land prices.
4. Speculation and Investment
Real Estate Speculation: Land is often purchased as an investment with the expectation of price appreciation. Speculative activities can artificially inflate land prices, especially in rapidly growing urban centers.
Foreign Investment: In some cities, foreign investors buy land or property as an asset, driving up local prices and reducing affordability for residents.
5. Economic Indicators
Inflation: As inflation increases, the nominal value of land rises, reflecting the general increase in prices within an economy.
Interest Rates: Lower interest rates make borrowing cheaper, encouraging investment in real estate and driving up land prices. Conversely, higher rates can cool demand.
6. Urbanization and Changing Lifestyles
Lifestyle Shifts: Preferences for urban living due to employment opportunities, better education, healthcare, and entertainment options drive demand for land in cities.
Densification Trends: With limited horizontal expansion possibilities, cities grow vertically, increasing the value of land plots that allow high-density development.
7. Technological Advancements
Smart Cities and Digital Connectivity: Land in areas with advanced digital infrastructure, such as high-speed internet and smart utilities, tends to command a premium.
Impact of Remote Work: While remote work trends during the COVID-19 pandemic initially shifted demand to suburban areas, urban hubs with diversified economic bases remain attractive.
8. Environmental and Geographic Factors
Geographical Constraints: Cities located near coastlines, mountains, or other natural barriers face limitations on expansion, making available land more valuable.
Climate Change and Resilience: Land in areas considered less vulnerable to climate risks such as flooding or hurricanes can become more desirable, increasing prices.
9. Cultural and Social Factors
Prestige and Reputation: Certain neighborhoods gain a reputation for prestige, safety, or cultural vibrancy, attracting affluent buyers and increasing prices.
Educational and Social Amenities: Proximity to top schools, universities, or cultural institutions can elevate land values in specific urban pockets.
10. Global and Local Events
Pandemics and Crises: Events like pandemics may temporarily disrupt trends, such as by increasing interest in suburban living. However, cities often rebound due to their economic and social advantages.
Major Events: Hosting global events like the Olympics or World Expos can boost land prices in the host city due to infrastructure development and international attention.
Consequences of Rising Land Prices
The increase in land prices in urban areas leads to several consequences, including:
Housing Affordability Crisis: High land prices make housing unaffordable for lower and middle-income groups, exacerbating social inequalities.
Urban Sprawl: People move to suburban or peri-urban areas in search of affordable housing, leading to sprawling cities and increased commuting times.
Displacement and Gentrification: Long-standing communities may be displaced as wealthier groups purchase properties, altering the social fabric of neighborhoods.
Economic Polarization: High land costs can deter small businesses and startups, concentrating economic power in the hands of larger entities.
Conclusion
The rise in urban land prices is a multifaceted issue shaped by economic, social, environmental, and political factors. Managing this trend requires a delicate balance of policy interventions, such as encouraging sustainable urban planning, enforcing regulations to curb speculation, and promoting equitable access to affordable housing. Understanding these dynamics is crucial for governments, developers, and residents to navigate the challenges and opportunities posed by urban land price escalation.
References
Bogin, A., Doerner, W., & Larson, W. (2019). Local house price dynamics: New indices and stylized facts. Real Estate Economics, 47(2), 365-398.
Colsaet, A., Laurans, Y., & Levrel, H. (2018). What drives land take and urban land expansion? A systematic review. Land Use Policy, 79, 339-349.
Ma, J., Cheng, J. C., Jiang, F., Chen, W., & Zhang, J. (2020). Analyzing driving factors of land values in urban scale based on big data and non-linear machine learning techniques. Land use policy, 94, 104537.
Quigley, J. M., & Rosenthal, L. A. (2005). The effects of land use regulation on the price of housing: What do we know? What can we learn?. Cityscape, 69-137.
Sharma, S. N. Land-Use Zones in Urban Planning.
Dehalwar, K., & Sharma, S. N. (2024). Social Injustice Inflicted by Spatial Changes in Vernacular Settings: An Analysis of Published Literature.
The Core-Periphery Model, developed by John Friedmann in 1966, is a framework used to understand the spatial structure of economic development and regional disparities. It explores how economic activities, resources, and development tend to concentrate in certain areas (the core), leaving other areas (the periphery) less developed. The model is particularly significant in the fields of geography, regional planning, and development economics, as it highlights the unequal distribution of economic power and resources across different regions.
Key Concepts of the Core-Periphery Model
Core Region:
The core is the center of economic, political, and social power.
It is characterized by high levels of industrialization, urbanization, and infrastructure development.
The core regions typically have a concentration of capital, technology, skilled labor, and investment.
Examples include major metropolitan cities or developed countries (e.g., New York, London, Tokyo).
Periphery Region:
The periphery consists of areas that are less economically developed, with lower levels of industrialization and urbanization.
These regions often depend on primary economic activities like agriculture, mining, or raw material extraction.
Peripheral regions tend to have lower levels of income, education, and infrastructure.
Examples include rural areas or developing countries that are economically dependent on the core.
Semi-Periphery Region (added in later refinements of the model):
These are transitional regions that lie between the core and periphery.
They exhibit some characteristics of the core but still face challenges similar to those in the periphery.
Semi-peripheral regions may be emerging economies or rapidly developing cities (e.g., India, Brazil, South Africa).
Stages of Development According to Friedmann
Friedmann’s model identifies four stages in the spatial development of regions:
Pre-Industrial Society:
Economic activities are widely dispersed with little concentration.
Traditional economies dominate, with a focus on agriculture and subsistence activities.
There is minimal differentiation between core and periphery regions.
Emergence of the Core:
Industrialization leads to the growth of certain regions, creating a core area.
The core attracts investments, industries, and skilled labor, becoming an economic hub.
Peripheral areas remain underdeveloped, leading to a spatial economic imbalance.
Core-Dominated Economy:
The core continues to expand, accumulating more economic power and resources.
The periphery becomes increasingly dependent on the core for economic activities, capital, and technology.
This dependence creates a hierarchical relationship, reinforcing regional disparities.
Spatial Integration:
Over time, development policies, infrastructure projects, and technological advancements may reduce regional disparities.
The economic benefits of the core can spill over to the periphery, promoting regional integration.
This stage aims for a more balanced spatial distribution of economic activities.
Mechanisms of Core-Periphery Dynamics
Polarization Effect:
Economic growth tends to concentrate in the core, attracting more resources, investments, and skilled labor.
This process, known as “cumulative causation,” leads to the growth of core regions at the expense of peripheral regions.
Backwash Effect:
The core extracts resources, labor, and capital from the periphery, further weakening the peripheral regions.
This can lead to a drain of talent and resources from rural or underdeveloped areas to more prosperous urban centers.
Spread Effect:
The core’s growth may eventually lead to positive spillover effects in the periphery, such as increased investments, technology transfer, and job creation.
This can happen through policies aimed at decentralization, regional development, and infrastructure improvements.
Implications of the Core-Periphery Model
Economic Inequality:
The model highlights the uneven economic development between core and peripheral regions, which can lead to social and economic inequalities.
Policy Formulation:
Policymakers can use this model to devise strategies for balanced regional development, such as promoting investment in peripheral areas, decentralizing industries, and improving infrastructure.
Urbanization Trends:
It explains the rapid urbanization and concentration of population in metropolitan areas, as people migrate from rural peripheries to urban cores in search of better economic opportunities.
Criticisms of the Core-Periphery Model
Over-Simplification:
The model is criticized for being too simplistic, as it divides regions into binary categories of core and periphery without accounting for the complexities of regional dynamics.
Lack of Consideration for Globalization:
The model was developed in the 1960s, before the rise of globalization and digital technologies, which have altered the spatial distribution of economic activities.
Limited Applicability:
The model may not be fully applicable to all regions, especially in the context of modern economies where multiple cores and decentralized economic activities exist.
Applications of the Core-Periphery Model
Regional Planning and Development:
The model is used to guide regional development policies, focusing on reducing disparities between core and peripheral areas.
Urban Studies:
It helps in analyzing urbanization patterns, city growth, and migration trends.
Economic Geography:
The model provides insights into the spatial distribution of economic activities, helping economists understand the factors driving regional disparities.
Example: Application in India
Core Regions:
Major metropolitan areas like Mumbai, Delhi, and Bengaluru serve as economic cores, with high levels of industrialization, services, and technology.
Peripheral Regions:
Rural areas in states like Bihar, Odisha, and parts of Northeast India remain less developed, with economies primarily dependent on agriculture and limited industrialization.
Semi-Periphery Regions:
States like Gujarat, Tamil Nadu, and Maharashtra show mixed characteristics, with both developed urban centers and underdeveloped rural areas.
Conclusion
The Core-Periphery Model by Friedmann offers a valuable framework for understanding the spatial dynamics of economic development. While it has limitations, it provides a useful lens for examining regional disparities, informing policy interventions aimed at promoting balanced development and reducing economic inequality.
References
Baldwin, R. E. (2001). Core-periphery model with forward-looking expectations. Regional science and urban economics, 31(1), 21-49.
Borgatti, S. P., & Everett, M. G. (2000). Models of core/periphery structures. Social networks, 21(4), 375-395.
Castro, S. B., Correia‐da‐Silva, J., & Mossay, P. (2012). The core‐periphery model with three regions and more. Papers in Regional Science, 91(2), 401-419.
Forslid, R., & Ottaviano, G. I. (2003). An analytically solvable core‐periphery model. Journal of Economic Geography, 3(3), 229-240.
Klimczuk, A., & Klimczuk-Kochańska, M. (2023). Core-periphery model. In The palgrave encyclopedia of global security studies (pp. 239-245). Cham: Springer International Publishing.
Sharma, S. N. Exploring the Urban Growth Pole Theory.
Sharma, S. N., Dehalwar, K., Kumar, G., & Vyas, S. (2023). Redefining Peri-urban Urban Areas. Thematics Journal of Geography, 12(3), 7-13.
Increasing public participation in the planning process is vital to ensure inclusive, transparent, and community-centered outcomes. Effective measures to enhance public engagement in plan-making involve a mix of education, accessibility, technology, and trust-building. Below are detailed steps to increase public participation in planning:
1. Education and Awareness
Public Awareness Campaigns: Use media campaigns, workshops, and community meetings to educate citizens about the importance of planning and its impact on their lives.
Simplified Information: Create easy-to-understand summaries of technical documents to help non-experts grasp the issues.
Outreach in Schools and Colleges: Engage younger generations through educational programs in schools and colleges to cultivate a culture of civic participation.
Citizen Guides: Publish “How-to” guides to explain how citizens can contribute meaningfully to planning processes.
2. Accessible Communication Channels
Multi-Language Communication: Provide documents and announcements in multiple languages relevant to the local population.
Use of Visual Aids: Share maps, charts, and infographics to present complex plans in a more comprehensible manner.
Inclusive Venues and Timings: Host meetings in locations accessible to all, including those with disabilities, and schedule them at times convenient for working individuals.
Helplines and Support Desks: Offer dedicated phone lines, email support, and in-person helpdesks to address public queries.
3. Digital Tools and Technology
Interactive Websites and Apps: Create platforms where people can view plans, submit feedback, and track the progress of their inputs.
Virtual Public Meetings: Offer live streaming and interactive Q&A sessions for those who cannot attend in person.
Online Surveys and Polls: Use digital surveys to gather broad-based opinions efficiently.
GIS Tools: Enable the public to view geographic data interactively, allowing them to understand spatial planning implications better.
4. Participatory Workshops and Forums
Community Visioning Workshops: Facilitate workshops where residents can brainstorm ideas and prioritize issues.
Focus Groups: Conduct small, focused discussions with specific demographic groups (e.g., women, youth, seniors) to ensure their voices are heard.
Citizen Panels: Form panels or advisory groups of residents to regularly consult during the planning process.
Hackathons and Design Jams: Organize events where participants collaborate on innovative solutions for urban challenges.
5. Proactive Outreach
Door-to-Door Engagement: Send planners or volunteers to homes to distribute materials and discuss the process.
Engagement with Local Organizations: Partner with community groups, NGOs, and resident welfare associations to act as bridges between the government and the public.
Mobile Units: Use vans or kiosks to reach underserved or remote areas to engage with the public directly.
6. Feedback Mechanisms
Transparent Feedback Loops: Regularly update participants on how their feedback has been incorporated or why certain suggestions were not feasible.
Public Dashboards: Create online dashboards showing public contributions and decisions made at each stage.
Recognition Programs: Acknowledge active participants through certificates, public mentions, or awards.
7. Legal and Policy Frameworks
Mandatory Public Consultation Requirements: Ensure legal provisions for minimum public consultation periods and incorporate public input as a mandatory step in the planning process.
Citizen Assemblies: Institutionalize regular citizen assemblies to discuss and deliberate on planning issues.
Grievance Redressal Systems: Establish mechanisms to address concerns or complaints related to the planning process.
8. Building Trust and Transparency
Anti-Corruption Measures: Ensure that the planning process is free from corruption and favoritism to build trust.
Open Data Policies: Share all non-confidential planning data publicly to allow independent analysis.
Public Monitoring Committees: Enable community representatives to monitor and report on planning developments.
9. Incentives for Participation
Stipends or Honorariums: Provide compensation for time and effort spent by citizens participating in lengthy consultations.
Recognition of Contributions: Highlight contributions through media or social media platforms.
Gamification: Use gamified approaches like reward points for participating in surveys or contributing ideas.
10. Cultural and Contextual Sensitivity
Local Festivals and Events: Tie consultations to popular cultural events to attract larger audiences.
Tailored Approaches: Adapt engagement strategies to align with the social, cultural, and economic dynamics of the community.
11. Long-Term Engagement Strategies
Citizen Capacity Building: Invest in long-term training for citizens to enhance their understanding of planning principles and decision-making processes.
Institutionalized Roles: Form permanent citizen committees that regularly interact with planning authorities.
Continual Feedback Opportunities: Provide year-round avenues for citizens to provide feedback beyond formal consultation periods.
By combining these measures, authorities can foster greater public involvement, resulting in plans that are not only better aligned with community needs but also enjoy broader support and legitimacy.
References
Dehalwar, K., & Sharma, S. N. (2023). Fundamentals of Area Appreciation and Space Perceptions.
Dehalwar, K., & Sharma, S. N. (2024). Social Injustice Inflicted by Spatial Changes in Vernacular Settings: An Analysis of Published Literature.
Dehalwar, K., & Sharma, S. N. (2024). Politics in the Name of Women’s Reservation. Contemporary Voice of Dalit, 2455328X241262562.
Haklay, M., Jankowski, P., & Zwoliński, Z. (2018). Selected modern methods and tools for public participation in urban planning–a review. Quaestiones Geographicae, 37(3), 127-149.
Lane, M. B. (2005). Public participation in planning: an intellectual history. Australian geographer, 36(3), 283-299.
Sharma, S. N. (2014). Participatory Planning in Plan Preparation. BookCountry.
Sharma, S. N. (2013). Participatory Planning in Practice. Lulu. com.
Sharma, S. N. (2018). Review of National Urban Policy Framework 2018. Think India Journal, 21(3), 74-81.
Sharma, S. N. (2018). Transformation of Aspirational Districts Programme: A Bold Endeavor Towards Progress. Think India Journal, 21(4), 197-206.
Sharma, S. N. (2005). Evaluation of the JnNURM Programme of Government of India for Urban Renewal. Think India Journal, 8(2), 1-7.
Thomas, H. (2003). Public participation in planning. In British planning policy (pp. 187-206). Routledge.
Unplanned waste disposal is a critical environmental issue that affects ecosystems, public health, and the planet’s overall sustainability. It occurs when waste materials are discarded without proper treatment or consideration for their impact, leading to environmental contamination, health hazards, and socio-economic challenges.
The World Bank estimates that global waste production will increase by 70% by 2050 unless urgent action is taken. Rapid urbanization, population growth, and consumerism exacerbate the problem, particularly in developing nations where waste management infrastructure is often inadequate.
Types of Waste and Their Impact
Municipal Solid Waste (MSW): Includes household garbage, food waste, and packaging materials. Improper disposal results in unsanitary conditions, pest infestations, and methane emissions from landfills.
Hazardous Waste: Includes industrial chemicals, batteries, and medical waste. These materials can leach toxic substances into soil and water, harming ecosystems and human health.
Plastic Waste: Plastics take centuries to decompose and often end up in oceans, harming marine life and entering the food chain.
E-Waste: Discarded electronics release heavy metals like lead and cadmium, contaminating soil and groundwater.
Environmental Consequences of Unplanned Waste Disposal
Soil Contamination: Leachates from landfills contain toxic chemicals that degrade soil quality, making it unsuitable for agriculture.
Water Pollution: Improperly disposed waste can contaminate rivers, lakes, and groundwater with harmful substances, disrupting aquatic ecosystems and jeopardizing clean water supplies.
Air Pollution: Open burning of waste releases dioxins, furans, and other harmful pollutants, contributing to respiratory diseases and climate change.
Biodiversity Loss: Waste in natural habitats harms wildlife, either through ingestion, entanglement, or habitat destruction.
Climate Change: Decomposing organic waste generates methane, a potent greenhouse gas contributing to global warming.
Public Health Implications
Disease Outbreaks: Unmanaged waste creates breeding grounds for disease vectors such as mosquitoes and rodents, increasing the prevalence of diseases like malaria and dengue fever.
Respiratory Issues: Pollutants from waste burning cause respiratory problems, particularly among vulnerable groups such as children and the elderly.
Chemical Exposure: Direct contact with hazardous waste or contaminated water can lead to skin disorders, neurological issues, and even cancer.
Mental Health Impact: Communities living near poorly managed waste sites often experience stress, anxiety, and reduced quality of life.
Socio-Economic Effects
Economic Burden: Healthcare costs rise due to increased disease prevalence, while local governments face escalating expenses for cleanup and mitigation.
Aesthetic and Property Value Loss: Unplanned waste disposal reduces the attractiveness of neighborhoods and lowers property values.
Impact on Livelihoods: Fisherfolk, farmers, and tourism-dependent communities suffer due to environmental degradation.
Solutions and Strategies for Sustainable Waste Management
Policy and Regulation:
Governments should enforce strict regulations on waste disposal and management.
Polluter pays principle and extended producer responsibility can incentivize businesses to minimize waste.
Infrastructure Development:
Building modern recycling facilities, composting units, and waste-to-energy plants.
Implementing robust waste collection and segregation systems.
Community Engagement:
Educating the public about the importance of reducing, reusing, and recycling.
Organizing community clean-up drives and awareness campaigns.
Innovative Technologies:
Using AI and IoT for efficient waste tracking and management.
Developing biodegradable alternatives to plastic and other non-decomposable materials.
International Cooperation:
Sharing best practices and technologies between nations.
Supporting global agreements like the Basel Convention on hazardous waste.
Conclusion
Unplanned waste disposal poses a significant threat to environmental health, public safety, and economic stability. Addressing this challenge requires collective action from governments, businesses, and individuals. By adopting sustainable practices and investing in effective waste management systems, society can mitigate the adverse effects and move toward a cleaner, healthier future.
References
Dehalwar, K., & Sharma, S. N. (2024). Social Injustice Inflicted by Spatial Changes in Vernacular Settings: An Analysis of Published Literature.
Guerrero, L. A., Maas, G., & Hogland, W. (2013). Solid waste management challenges for cities in developing countries. Waste management, 33(1), 220-232.
Imam, A., Mohammed, B., Wilson, D. C., & Cheeseman, C. R. (2008). Solid waste management in Abuja, Nigeria. Waste management, 28(2), 468-472.
Kumar, G., Vyas, S., Sharma, S. N., & Dehalwar, K. (2024). Challenges of Environmental Health in Waste Management for Peri-urban Areas. In Solid Waste Management: Advances and Trends to Tackle the SDGs (pp. 149-168). Cham: Springer Nature Switzerland.
Nanda, S., & Berruti, F. (2021). Municipal solid waste management and landfilling technologies: a review. Environmental chemistry letters, 19(2), 1433-1456.
Sharma, S. N., Dehalwar, K., & Singh, J. (2024). Emerging Techniques of Solid Waste Management for Sustainable and Safe Living Environment. In Solid Waste Management: Advances and Trends to Tackle the SDGs (pp. 29-51). Cham: Springer Nature Switzerland.
Sharma, S. N. (2013). Sustainable development strategies and approaches. International Journal of Engineering and Technical Research (IJETR), 2.
Shekdar, A. V. (2009). Sustainable solid waste management: An integrated approach for Asian countries. Waste management, 29(4), 1438-1448.
AuthorAID is a global network and online platform aimed at helping researchers in developing countries, especially early-career researchers, improve their academic writing, publication skills, and overall research capabilities. It is an initiative that supports the development of high-quality research by providing mentorship, resources, and training to researchers who often face significant challenges in accessing academic publishing, funding, and networking opportunities.
The program is a project of the International Network for the Availability of Scientific Publications (INASP), a UK-based development organization that works to improve the quality and accessibility of research and knowledge in developing countries.
AuthorAID’s mission is to bridge the gap between researchers from developed and developing countries in terms of research development, capacity building, and access to scientific knowledge. Specifically, AuthorAID aims to:
Improve Research Quality: Help researchers enhance the quality of their academic papers and publications through training, feedback, and peer review support.
Facilitate Publication: Assist early-career researchers in navigating the academic publishing process, including how to write, format, and submit papers for journals.
Mentorship: Connect early-career researchers with mentors from around the world who can provide guidance on improving research and career development.
Foster Networking and Collaboration: Encourage collaboration between researchers across different countries, regions, and academic disciplines.
Enhance Capacity: Provide training and resources on a wide range of research-related topics, from research methodology and grant writing to effective communication and academic writing skills.
Key Features and Services of AuthorAID
Online Platform and ResourcesAuthorAID offers a comprehensive online platform that includes:
Webinars and Online Courses: Free webinars and self-paced online courses on various topics, such as writing research papers, publishing in journals, understanding impact factors, and navigating peer review.
Research and Writing Guides: A library of articles, manuals, and guides on research methods, writing techniques, and publication strategies tailored to the needs of researchers in developing countries.
Discussion Forums: A platform for researchers to share experiences, ask questions, and discuss challenges related to academic writing, publishing, and research.
Mentorship ProgramOne of the core offerings of AuthorAID is its mentorship program, which connects early-career researchers with experienced mentors in their respective fields. Mentors provide advice and guidance on a wide range of issues, including:
Improving research methodology and writing skills.
Navigating the complexities of the peer review process.
Identifying appropriate journals for submission.
Developing successful grant proposals.
Career guidance and professional development.
Researchers seeking mentorship can sign up through the AuthorAID platform, where they are matched with mentors who have expertise in their specific areas of research.
Researcher NetworkingThe AuthorAID platform facilitates networking among researchers through the following:
Collaborative Projects: Researchers can find potential collaborators, both within their country and internationally, for joint research projects, papers, and publications.
Social Media and Community Engagement: Through social media groups (e.g., LinkedIn, Twitter, and Facebook), AuthorAID connects researchers, providing opportunities for interaction and knowledge-sharing.
Publication and Peer Review SupportOne of the most significant barriers for researchers from developing countries is navigating the publication process. AuthorAID offers a variety of tools to assist researchers, including:
Publication Advice: Practical advice on how to write and submit manuscripts for peer review and how to interpret reviewer feedback.
Peer Review Training: Offering workshops and materials to help researchers become better at reviewing papers and understanding the peer review process.
Journal Matching Service: A tool that helps researchers find appropriate journals for their work based on the content of their papers.
Grants and Funding InformationWhile AuthorAID does not provide direct funding, the platform offers valuable information and advice on where to find research funding and how to write successful grant proposals. This includes:
Funding Databases: Access to information about various funding opportunities for researchers in developing countries.
Grant Writing Workshops: Practical training on how to write strong and competitive research grant applications.
Impact of AuthorAID
AuthorAID has made a significant impact on the research community, particularly in the Global South. By providing critical support to researchers in low- and middle-income countries, the platform has:
Improved Research Outcomes: Many researchers have been able to successfully publish in high-impact journals, leading to greater visibility for their work.
Enhanced Collaboration: By connecting researchers from around the world, AuthorAID has helped establish research partnerships that may not have otherwise occurred.
Increased Confidence: Early-career researchers who may have felt isolated or unsure about their work have gained confidence through mentoring and peer support.
Capacity Building: The wide variety of resources and training available on the platform has helped researchers build essential skills for their academic careers.
Challenges and Future Directions
Despite its success, AuthorAID faces several challenges:
Language Barriers: Many researchers in developing countries struggle with English-language proficiency, which can limit their ability to publish in international journals. AuthorAID is working to address this by offering resources and support in multiple languages.
Funding Limitations: While AuthorAID helps researchers find funding, the availability of grants and financial support for researchers in developing countries remains a critical issue.
Infrastructure and Access to Technology: In some regions, internet access and access to the necessary tools for online research and publication remain barriers.
Looking to the future, AuthorAID aims to expand its services, enhance the reach of its mentorship program, and continue developing resources tailored to the needs of researchers in diverse settings.
Conclusion
AuthorAID plays a vital role in strengthening the research capacity of scholars in developing countries. By providing mentorship, resources, and training on academic writing, publishing, and networking, the platform empowers researchers to overcome the barriers they face and contribute valuable knowledge to the global scientific community. It is a powerful tool for anyone seeking to make a meaningful impact through research and to foster greater collaboration between the Global South and Global North.
The initiative stands as a testament to the importance of global cooperation in advancing knowledge and research, ensuring that scholars from all parts of the world have the resources and support they need to succeed.
References
Bruijns, S. R., Banner, M., & Jacquet, G. A. (2017). Improving publication quality and quantity for acute care authors from low-and middle-income settings. Annals of Emergency Medicine, 69(4), 462-468.
Dehalwar, K., & Sharma, S. N. (2023). Fundamentals of Research Writing and Uses of Research Methodologies. Edupedia Publications Pvt Ltd.
Gastel, B. (2013). AuthorAID: An international service and chance to serve. Medical Writing, 22(4), 284-287.
Gastel, B. (2015). AuthorAID and editors: collaborating to assist authors in developing countries.
Harris, S. (2019). Truth and Lies in Academic Publishing: Distrust in Research Highlights the Importance of Education in Critical Thinking Skills. Refer, 35(2), 30-34.
Nobes, A. (2016). AuthorAID–supporting early career researchers in developing countries. The Biochemist, 38(5), 39-41.
Obino, F., Salomon, S., & Zanfini, L. (2023). Financing without doing harm: for virtuous mechanisms to support African social science research. In Financing without doing harm: for virtuous mechanisms to support African social science research: Obino, Francesco| uSalomon, Sophie| uZanfini, Linda. Paris, France: Éditions AFD.
Shashok, K. (2010). How AuthorAID in the Eastern Mediterranean helps researchers become authors. The Write Stuff, 9(1), 43-6.
As a ritual/festival, Halloween is celebrated on October 31 worldwide. Since this year, Diwali/Kali Puja will be celebrated on October 31, 2024, so, on October 30, 2024, in the gated community, Hyderabad, where I have been living with my family for 7/8 years, Halloween was celebrated on October 30, 2024. In the gated community known as Libdom Luxury Villas (Raj Reddy Valley), Bandlaguda Jagir, Hyderabad, children, irrespective of age and gender, celebrate different festivals and rituals, including Halloween. Before writing about the Halloween ritual enjoyed by our campus children, let me highlight a few points about our gated community. This gated community is spread over 17 acres of land with indoor and outdoor games, a gym, a park, a swimming pool, a function hall, etc. Altogether, 190 families (a few might be unoccupied) live in this gated community; each has a duplex house and little land surrounding it. In the land, all nurture flowers, some vegetables, fruits, etc. The most highlighting point is that this gated campus consists of different religions, castes, and languages (people of various States), representing a mini-India in the true sense. On October 30, 2024, children enjoyed Halloween by dressing vis-à-vis wearing masks like ghosts, vampires, witches, animals, and others. Around 70 children, irrespective of age and gender, participated in the Halloween. It is noteworthy to mention that kids and teenagers, by forming groups – each group consisting of 7 to 8 children based on their age group and friendship enthusiastically visited almost every villa (wearing different dresses or masks as mentioned already), and elders of each villa spontaneously provided them candy, chocolate, or sweets. As a senior citizen, I thoroughly enjoyed their enthusiasm, happiness, joy, and cheerfulness. Regarding Halloween, I am presenting a few lines collected from Britannica (britannica.com/story/why-do-we-celebrate-halloween). “Halloween has been around for more than a thousand years. Originally a religious observance, it became increasingly secular over the centuries until its religious trappings disappeared. Today, Halloween is considered a holiday for dress-up and fun, especially for children. Halloween’s origins can be traced back to the ancient Celtic festival known as Samhain, held on November 1 in contemporary calendars. It was believed that on that day, the souls of the dead returned to their homes, so people dressed in costumes and lit bonfires to ward off spirits. This way, popular Halloween tropes such as witches, ghosts, and goblins became associated with the holiday. In the 7th century CE, Pope Boniface IV created All Saints Day, originally celebrated on May 13. A century later, Pope Gregory III moved the holiday to November 1, likely as a Christian substitute for the pagan festival of Samhain. The day before, the saintly celebration became known as All Hallows Eve or Halloween. Though the holiday began in Celtic regions of Ireland, the United Kingdom, and France, it quickly spread to other parts of the world. The first American colonists in New England were forbidden to celebrate it for religious reasons, though it enjoyed some popularity in the Southern colonies. By the 1800s, fall festivals marking the seasonal harvest incorporated Halloween elements, and Irish immigrants escaping the devastating Potato Famine brought with them many Halloween traditions that remain today.” Incidentally, this year, on October 30, 2024, there is a ritual associated with Hindu belief known as Bhoot Chaturdashi Tithi. There are different opinions about Bhoot Chaturdashi Tithi. Many people also think that the soul of the ancestors comes to the mortal world on this date. Anyway, in all cases, there is a reference to the arrival of evil forces. Fourteen lamps are lit to get rid of this evil energy. The light of these fourteen lamps is believed to destroy all evil forces. I am a senior citizen, 68 years old, so I was happy to observe our children’s enthusiasm for performing Halloween. ( I express my deep sense of gratitude to Dr. P. Vidya Sagar, Forensic Expert, Villa 161, Libdom Villa, for organising the event) Prof Shankar Chatterjee, Hyderabad
Interviews are a central method of gathering qualitative data across disciplines, particularly in research, psychology, human resources, and customer service. Broadly, interviews can be classified into structured, semi-structured, and unstructured types. Each of these types serves a unique purpose and provides varying levels of flexibility and control over the data-gathering process. Here’s a detailed breakdown of each type:
1. Structured Interviews
Definition: Structured interviews are a standardized approach to interviewing where the interviewer follows a predetermined set of questions, asked in a specific order, with little to no deviation. The questions are often closed-ended, focusing on eliciting specific information from respondents.
Key Characteristics:
Standardization: All interviewees are asked identical questions in the same sequence, ensuring consistency across interviews.
Fixed Response Options: Often, structured interviews include closed-ended questions, allowing for objective comparison across responses.
Limited Flexibility: The interviewer does not deviate from the script, leaving little room for follow-up or probing questions.
Objective Scoring: In many cases, responses can be scored or rated, making it possible to quantify results.
Advantages:
Reliability and Consistency: Because the structure is rigid, responses are easier to compare and analyze statistically, which improves the reliability of findings.
Efficiency: Structured interviews tend to be shorter and more focused, making them ideal when time or resources are limited.
Reduced Interviewer Bias: With a fixed set of questions, the likelihood of interviewer bias affecting responses is minimized.
Disadvantages:
Limited Depth: Structured interviews lack flexibility, making it difficult to explore topics beyond the predetermined questions, which may limit the depth of information gathered.
Inflexible Responses: Respondents may find it challenging to fully express their thoughts within the confines of closed-ended questions.
Applications:
Hiring and Recruitment: Structured interviews are common in initial screening processes, where specific job-related competencies are evaluated.
Surveys: Many survey-based interviews (e.g., census interviews) use structured formats for consistency and reliability.
Research Studies: Structured interviews are often used in studies that require quantifiable data, such as psychological assessments or standardized tests.
2. Semi-Structured Interviews
Definition: Semi-structured interviews use a blend of predetermined questions and the flexibility to explore topics as they arise. Interviewers start with a set of key questions but can deviate to probe for additional information based on the respondent’s answers.
Key Characteristics:
Guided Structure: A framework of core questions is provided, but the interviewer can ask follow-up questions, depending on responses.
Flexibility: Unlike structured interviews, semi-structured interviews allow for spontaneous questions that provide richer data.
Open-Ended Questions: Questions are generally open-ended, allowing interviewees to elaborate and provide nuanced responses.
Advantages:
Balance of Consistency and Flexibility: Semi-structured interviews combine the structure needed to guide the conversation with the flexibility to explore unplanned topics in depth.
In-Depth Data Collection: The open-ended nature allows for deeper insights, as participants can share more detailed, personal information.
Improved Rapport: Semi-structured interviews foster a more conversational style, which can make interviewees feel more comfortable and open.
Disadvantages:
Time-Consuming: Semi-structured interviews require more time to conduct and analyze, as responses are often longer and more complex.
Interviewer Skill Dependency: The effectiveness of semi-structured interviews depends on the interviewer’s ability to ask relevant follow-up questions and guide the conversation.
Subjective Interpretation: Because responses are open-ended, interpretation can be subjective, requiring careful analysis to avoid biases.
Applications:
Qualitative Research: Semi-structured interviews are frequently used in fields like sociology, anthropology, and psychology to gather rich qualitative data.
Customer Feedback: Organizations often use semi-structured interviews to understand customer needs and preferences in detail.
Performance Appraisals: Semi-structured interviews are common in performance evaluations, where feedback can be explored in depth through a blend of preset and flexible questions.
3. Unstructured Interviews
Definition: Unstructured interviews are the most flexible type, with no predetermined set of questions. Instead, the interviewer and interviewee engage in an open, free-flowing conversation where topics can evolve based on the participant’s responses.
Key Characteristics:
Complete Flexibility: The interviewer can ask any question based on the conversation flow, without being constrained by a script or structure.
Participant-Led: Often, the participant’s responses guide the direction of the interview, allowing for exploration of topics that might not have been initially considered.
High Depth and Detail: Unstructured interviews often yield highly detailed and personal insights, as interviewees are free to discuss topics in-depth.
Advantages:
Depth and Richness of Data: Because there is no structure, interviewees can express themselves freely, leading to unique, valuable insights.
Adaptability: Unstructured interviews are ideal for exploring complex, sensitive topics where a structured approach might limit expression.
Rapport Building: The conversational nature often helps interviewees feel at ease, fostering a sense of trust that can yield honest responses.
Disadvantages:
Difficulty in Analysis: Data from unstructured interviews can be challenging to organize and analyze, as responses vary widely and lack uniformity.
Interviewer Skill Requirement: Successful unstructured interviews require high interviewer skills, including active listening, adaptability, and the ability to ask relevant probing questions.
Time-Consuming: Without a predetermined structure, unstructured interviews can be lengthy, both in conducting and analyzing responses.
Applications:
Exploratory Research: Often used in exploratory studies where the objective is to uncover new insights or hypotheses rather than test existing ones.
Therapy and Counseling: Therapists often use an unstructured approach, allowing clients to direct conversations based on what they feel comfortable sharing.
Investigative Journalism: Journalists frequently use unstructured interviews to gather in-depth, personal stories that may reveal new angles to a story.
Summary Table
Interview Type
Structure
Flexibility
Data Depth
Common Applications
Structured
High
Low
Low
Surveys, hiring, standardized research
Semi-Structured
Moderate
Moderate
Moderate
Qualitative research, feedback, appraisals
Unstructured
None
High
High
Therapy, exploratory research, journalism
In choosing an interview type, one should consider the purpose of the interview, the desired depth of information, available time, and the skills of the interviewer. Structured interviews provide consistency, while unstructured ones allow for richer insights, and semi-structured interviews offer a balance between the two.
References
Adeoye‐Olatunde, O. A., & Olenik, N. L. (2021). Research and scholarly methods: Semi‐structured interviews. Journal of the american college of clinical pharmacy, 4(10), 1358-1367.
Brinkmann, S. (2014). Unstructured and semi-structured interviewing. The Oxford handbook of qualitative research, 2, 277-299.
Dehalwar, K., & Sharma, S. N. (2023). Fundamentals of Research Writing and Uses of Research Methodologies. Edupedia Publications Pvt Ltd.
Dehalwar, K., & Sharma, S. N. (2024). Exploring the Distinctions between Quantitative and Qualitative Research Methods. Think India Journal, 27(1), 7-15.
Dehalwar, K. (Ed.). (2024). Basics of Research Methodology-Writing and Publication. EduPedia Publications Pvt Ltd.
Kumar, G., Vyas, S., Sharma, S. N., & Dehalwar, K. (2024). Challenges of Environmental Health in Waste Management for Peri-urban Areas. In Solid Waste Management: Advances and Trends to Tackle the SDGs (pp. 149-168). Cham: Springer Nature Switzerland.
Low, J. (2019). Unstructured and semi–structured interviews in Health Research. Researching Health: Qualitative, Quantitative and Mixed methods. London: Sage publications, 123-41.
Miller, P. R., Dasher, R., Collins, R., Griffiths, P., & Brown, F. (2001). Inpatient diagnostic assessments: 1. Accuracy of structured vs. unstructured interviews. Psychiatry research, 105(3), 255-264.
Segal, D. L., Coolidge, F. L., O’Riley, A., & Heinz, B. A. (2006). Structured and semistructured interviews. In Clinician’s handbook of adult behavioral assessment (pp. 121-144). Academic Press.
Sharma, S. N., Lodhi, A. S., Dehalwar, K., & Jaiswal, A. (2024, June). Life Cycle Assessment (LCA) of Recycled & Secondary Materials in the Construction of Roads. In IOP Conference Series: Earth and Environmental Science (Vol. 1326, No. 1, p. 012102). IOP Publishing.
Statistical software is essential for data analysis across various fields such as social sciences, medicine, economics, and more. Below is a detailed discussion of four popular statistical software packages: SPSS, R, STATA, and SAS.
1. SPSS (Statistical Package for the Social Sciences)
SPSS is widely used in the social sciences, market research, health research, and various other fields for data management and statistical analysis.
Key Features:
User-Friendly Interface: SPSS is known for its intuitive graphical interface, making it easy to use even for those with limited programming knowledge. It offers a drag-and-drop feature and allows users to run statistical analyses through menus.
Statistical Procedures: It offers a range of statistical tests such as t-tests, chi-square tests, ANOVA, regression (linear and logistic), factor analysis, and more.
Data Handling: SPSS allows for efficient data management, such as handling missing data, merging files, and transforming data. It also supports large datasets.
Graphical Representation: Users can create various types of graphs (e.g., histograms, bar charts, scatterplots) to visualize data.
Integration with Other Software: SPSS integrates well with Excel, databases, and other statistical tools. It also offers scripting capabilities through its syntax language.
Applications: SPSS is commonly used in academia for research projects, surveys, and experiments. It’s also popular in businesses for data mining and forecasting.
Advantages:
Easy to learn and user-friendly.
Ideal for basic to intermediate statistical analysis.
Good for quick data analysis without needing to learn extensive programming.
Limitations:
Can be limited for more advanced or complex analyses.
Expensive for individual users and institutions compared to some open-source alternatives.
2. R (for Statistical Computing and Graphics)
R is an open-source statistical software used extensively for statistical analysis, graphics, and data visualization. It’s highly popular among data scientists, researchers, and statisticians.
Key Features:
Programming Language: R is both a software environment and a programming language specifically designed for statistical computing and graphics. It allows users to write custom scripts for complex statistical analyses.
Advanced Statistical Capabilities: R supports advanced statistical techniques such as machine learning, time-series analysis, multivariate statistics, and Bayesian analysis. It has thousands of user-contributed packages in CRAN (Comprehensive R Archive Network) for specialized tasks.
Graphical Capabilities: R is known for producing publication-quality graphics and visualizations. Packages like ggplot2 offer extensive customizability for creating detailed graphs.
Open-Source and Community-Driven: R is free and open-source, with an active community constantly contributing packages and updates.
Data Handling: R handles a wide range of data types and can process large datasets efficiently. It also integrates well with databases and other software (e.g., Python, SQL).
Advantages:
Free and open-source.
Capable of handling complex and cutting-edge statistical techniques.
Strong visualization tools for both basic and advanced users.
Highly flexible and customizable through numerous packages.
Limitations:
Steeper learning curve compared to SPSS or other GUI-based tools.
Less user-friendly for beginners due to its command-line interface.
Memory-intensive, which can limit its performance for very large datasets.
3. STATA (Data Analysis and Statistical Software)
STATA is a powerful software used for data management, statistical analysis, graphics, and simulations. It’s popular in fields such as economics, sociology, and epidemiology.
Key Features:
Comprehensive Statistical Tools: STATA supports a wide range of statistical methods, including linear and nonlinear models, time series analysis, panel data analysis, survival analysis, and more.
User Interface: STATA offers both a graphical user interface (GUI) and a command-line interface. The GUI is user-friendly and allows users to perform tasks without programming knowledge, while the command-line is favored by advanced users.
Data Management: STATA excels in managing large datasets, providing tools for reshaping, combining, and manipulating data.
Reproducible Research: It supports dynamic documents for reproducible research, meaning that users can combine code, output, and written reports in one place.
Econometric Focus: STATA is particularly strong in econometric analysis and is widely used in academic and policy research for this reason.
Automation and Customization: Users can write custom STATA programs (known as “do-files”) to automate repetitive tasks or create custom analyses.
Advantages:
Excellent for handling large datasets efficiently.
Widely used in econometrics, social sciences, and health research.
Strong community support and extensive documentation.
Good balance between ease of use and depth of statistical tools.
Limitations:
Expensive for individuals, though it offers different pricing tiers based on use.
Not as flexible as R when it comes to customization and adding cutting-edge techniques.
Graphical capabilities are more limited compared to R.
4. SAS (Statistical Analysis System)
SAS is a robust software suite for advanced analytics, business intelligence, data management, and predictive analytics.
Key Features:
Advanced Analytics: SAS offers a broad range of statistical and mathematical procedures, including descriptive statistics, predictive modeling, forecasting, econometrics, data mining, and machine learning.
Data Integration and Management: SAS is excellent at handling, transforming, and managing large, complex datasets. It integrates seamlessly with a variety of data sources.
Programming and GUI: SAS provides a mix of programming (through the SAS programming language) and a graphical interface, allowing users flexibility depending on their expertise. Its GUI is particularly useful for business users who may not be familiar with coding.
Enterprise-Level Solution: SAS is designed for large-scale, enterprise-level applications and is used by organizations for decision-making, fraud detection, risk management, and more.
Custom Procedures: Users can write custom SAS procedures using its macro language and integrate these into existing workflows.
Security and Compliance: It is known for its strong data security and compliance features, making it popular in industries like healthcare and finance.
Advantages:
Best suited for large-scale, enterprise applications.
Strong in advanced analytics, particularly for business applications.
Excellent data management and integration capabilities.
Scalable and secure, with features to handle compliance and governance.
Limitations:
High cost, making it less accessible for individuals or smaller organizations.
Steep learning curve, especially for those unfamiliar with the SAS language.
Not open-source, limiting flexibility in terms of updates and customizations compared to R.
Summary Comparison:
Feature/Software
SPSS
R
STATA
SAS
Ease of Use
High
Low
Medium
Medium
Cost
Paid
Free
Paid
Paid
Advanced Stats
Moderate
High
High
High
Customization
Low
High
Medium
Medium
Best For
Beginners, social scientists
Data scientists, statisticians
Econometricians, health researchers
Enterprise-level analytics
Each of these statistical software packages has unique strengths and is suited for different types of users and projects. The choice depends on the complexity of the analysis, budget, and familiarity with programming languages.
References
Asprey, S. P., & Macchietto, S. (2000). Statistical tools for optimal dynamic model building. Computers & Chemical Engineering, 24(2-7), 1261-1267.
Čížek, P., Härdle, W., Weron, R., & Härdle, W. (2011). Statistical tools for finance and insurance. Berlin: Springer.
Dehalwar, K., & Sharma, S. N. (2023). Fundamentals of Research Writing and Uses of Research Methodologies. Edupedia Publications Pvt Ltd.
Dehalwar, K. (Ed.). (2024). Basics of Research Methodology-Writing and Publication. EduPedia Publications Pvt Ltd.
Dehalwar, K., & Sharma, S. N. (2024). Exploring the Distinctions between Quantitative and Qualitative Research Methods. Think India Journal, 27(1), 7-15.
Dehalwar, K., & Sharma, S. N. (2024). Social Injustice Inflicted by Spatial Changes in Vernacular Settings: An Analysis of Published Literature.
Lin, L., Hedayat, A. S., & Wu, W. (2012). Statistical tools for measuring agreement.
Meeker, W. Q., & Hamada, M. (1995). Statistical tools for the rapid development and evaluation of high-reliability products. IEEE transactions on reliability, 44(2), 187-198.
Sharma, S. N., Dehalwar, K., & Singh, J. (2024). Emerging Techniques of Solid Waste Management for Sustainable and Safe Living Environment. In Solid Waste Management: Advances and Trends to Tackle the SDGs (pp. 29-51). Cham: Springer Nature Switzerland.
Sharma, S. N., Prajapati, R., Jaiswal, A., & Dehalwar, K. (2024, June). A Comparative Study of the Applications and Prospects of Self-healing Concrete/Biocrete and Self-Sensing Concrete. In IOP Conference Series: Earth and Environmental Science (Vol. 1326, No. 1, p. 012090). IOP Publishing.
Tanner, M. A. (1993). Tools for statistical inference (Vol. 3). New York: Springer.
Surveys and questionnaires are widely used research tools designed to collect data from a target population. They are integral to fields such as social sciences, marketing, healthcare, and education, providing insight into behaviors, opinions, experiences, and trends. While these terms are often used interchangeably, a distinction exists between the two: surveys typically refer to the broader method of data collection, whereas questionnaires refer to the specific set of questions used in the survey process.
Purpose of Surveys and Questionnaires
The primary purpose of surveys and questionnaires is to gather information systematically from a predefined group of people. This information can be used to:
Identify trends and patterns in attitudes or behaviors.
Test hypotheses and theories in academic research.
Collect feedback on products, services, or policies.
Support decision-making in business and policy contexts.
Assess needs for program development or resource allocation.
Key Components of Surveys
Survey Design: A well-designed survey ensures the collection of reliable and valid data. Key considerations include:
Objectives: Defining the purpose and what you aim to achieve with the survey.
Population and Sampling: Identifying the target audience and determining how they will be selected (sampling techniques such as random, stratified, or convenience sampling).
Mode of Distribution: Selecting a method for delivering the survey (online, mail, phone, or in-person).
Questionnaire Development: The core of a survey is the questionnaire, which should be carefully designed to minimize bias and gather meaningful data. Considerations for question design include:
Type of Questions: Closed-ended (e.g., multiple choice, yes/no) or open-ended (allowing detailed responses).
Wording: Questions should be clear, unambiguous, and neutral to avoid leading respondents.
Order of Questions: Grouping similar topics together, ensuring a logical flow, and starting with less sensitive or easier questions to engage respondents early.
Scale: Likert scales, semantic differential scales, and numerical rating systems are often used to measure attitudes or perceptions.
Pretesting: Before deploying the survey, it is important to pilot test it on a small subset of the target population. This ensures that the questions are interpreted correctly and that there are no technical issues in administration.
Types of Surveys
Descriptive Surveys: These are designed to describe the characteristics of a population. For example, a survey may aim to understand consumer preferences for a particular product or gather demographic data about a community.
Analytical Surveys: These surveys seek to understand relationships between different variables, often used to explore cause and effect. Analytical surveys may use more complex designs, including longitudinal surveys to track changes over time.
Cross-sectional vs. Longitudinal Surveys:
Cross-sectional Surveys collect data from respondents at a single point in time, providing a snapshot of the population.
Longitudinal Surveys collect data from the same respondents over multiple time points, allowing for the observation of changes and trends over time.
Types of Questions in Questionnaires
Closed-ended Questions: These limit responses to predefined options, making them easy to analyze but potentially limiting in detail.
Dichotomous: Yes/No or True/False responses.
Multiple Choice: Offering several options for respondents to choose from.
Ranking: Asking respondents to rank items in order of preference or importance.
Scaled Questions: Using scales (e.g., 1-5 or 1-10) to measure the intensity of a response.
Open-ended Questions: These allow respondents to provide their own answers, giving more in-depth insights but requiring more effort to analyze. They are particularly useful in exploratory research or when seeking qualitative data.
Advantages of Surveys and Questionnaires
Cost-effective: Especially when conducted online or via mail, surveys can reach a large audience without incurring significant costs.
Scalability: Surveys can collect data from hundreds or even thousands of respondents, making them an efficient tool for studying large populations.
Anonymity and Confidentiality: Surveys can be designed to ensure anonymity, making respondents more comfortable when answering sensitive or personal questions.
Data Analysis: Closed-ended questions allow for easy quantification and statistical analysis, providing clear insights into trends and patterns.
Flexibility: Surveys can be tailored to a variety of topics and settings, making them applicable across many industries and fields of study.
Limitations of Surveys and Questionnaires
Response Bias: Respondents may provide answers they believe are socially acceptable rather than their true thoughts, especially when sensitive topics are involved.
Sampling Bias: If the sample is not representative of the population, the results may not be generalizable.
Inaccurate Responses: Memory recall errors or misunderstanding of questions can lead to inaccurate data.
Low Response Rates: Especially in mail or online surveys, response rates can be low, which may skew the data.
Superficial Data: Closed-ended questions often limit the depth of response, and important nuances might be missed.
Best Practices for Creating Effective Surveys and Questionnaires
Be Clear and Concise: Avoid overly complex or technical language. Ensure that questions are easy to understand and do not overwhelm respondents with long or complicated instructions.
Avoid Leading Questions: Ensure that questions do not suggest a particular answer. For example, instead of asking “How much do you enjoy our excellent customer service?” ask “How would you rate our customer service?”
Use Neutral Language: Avoid emotionally charged or biased terms that could influence responses.
Pilot Test: Always test your questionnaire on a small group before full deployment to identify any issues with question interpretation or flow.
Optimize for Devices: For online surveys, ensure that the questionnaire is mobile-friendly, as a large percentage of respondents may complete it on their phones or tablets.
Survey Data Analysis
Once the survey data is collected, it needs to be analyzed effectively. For closed-ended questions, quantitative analysis is often performed using statistical software like SPSS, R, or Excel. Descriptive statistics (mean, median, mode) or inferential statistics (correlation, regression) can provide insights into the relationships and trends in the data.
Open-ended questions are typically analyzed using qualitative methods, such as thematic analysis or content analysis. This involves coding the responses into themes or categories that capture the essence of what respondents are saying.
Conclusion
Surveys and questionnaires are invaluable tools for collecting information from diverse groups. When designed and implemented correctly, they provide accurate, reliable data that can inform decision-making, contribute to research, and offer insight into public opinion or customer satisfaction. However, it is crucial to carefully consider design, sampling, question wording, and analysis methods to ensure that the data gathered is both valid and actionable.
References
Dalati, S., & Marx Gómez, J. (2018). Surveys and questionnaires. Modernizing the Academic Teaching and Research Environment: Methodologies and Cases in Business Research, 175-186.
Dehalwar, K., & Sharma, S. N. (2023). Fundamentals of Research Writing and Uses of Research Methodologies. Edupedia Publications Pvt Ltd.
Dehalwar, K. (Ed.). (2024). Basics of Research Methodology-Writing and Publication. EduPedia Publications Pvt Ltd.
Siraj-Blatchford, J. (2020). Surveys and questionnaires: An evaluative case study. In Doing early childhood research (pp. 223-238). Routledge.
Slattery, E. L., Voelker, C. C., Nussenbaum, B., Rich, J. T., Paniello, R. C., & Neely, J. G. (2011). A practical guide to surveys and questionnaires. Otolaryngology–Head and Neck Surgery, 144(6), 831-837.
Testa, M. A., & Simonson, D. C. (2017). The use of questionnaires and surveys. In Clinical and translational science (pp. 207-226). Academic Press.
Surveys and Questionnaires: Used to gather large amounts of data from a specific population.
Statistical Software:
SPSS (Statistical Package for the Social Sciences)
R (for statistical computing and graphics)
STATA (data analysis and statistical software)
SAS (Statistical Analysis System)
Sampling Methods: Random, stratified, cluster, and systematic sampling.
Regression Analysis: Used to understand relationships between variables.
Factor Analysis: Identifies underlying relationships between variables.
ANOVA (Analysis of Variance): Compares means among groups.
Structural Equation Modeling (SEM): Tests relationships between observed and latent variables.
2. Qualitative Tools and Techniques
Interviews:
Structured, semi-structured, and unstructured.
Focus Groups: Facilitated group discussions to gather insights.
Case Studies: In-depth exploration of a specific case or phenomenon.
Ethnography: Fieldwork that involves immersion in a particular community or group.
Content Analysis: Systematic analysis of communication and media content.
Narrative Analysis: Interpreting personal stories or life histories.
Discourse Analysis: Examining language, conversations, and texts.
3. Mixed Methods:
Triangulation: Combining multiple research methods to cross-verify data.
Convergent Parallel Design: Quantitative and qualitative data collected simultaneously but analyzed separately.
Explanatory Sequential Design: Quantitative data collected first, followed by qualitative analysis for deeper insights.
4. Digital and Online Research Tools
NVivo: Software for qualitative and mixed-methods data analysis.
MAXQDA: Another qualitative data analysis tool.
Google Scholar: Database for academic research and citation tracking.
EndNote and Zotero: Reference management tools.
Mendeley: Reference manager and academic social network.
SurveyMonkey or Google Forms: Tools for creating and distributing surveys online.
Atlas.ti: Qualitative research tool for coding and analyzing qualitative data.
Dedoose: Web-based tool for mixed-methods research.
5. Other Techniques
Comparative Analysis: Systematically comparing cases, phenomena, or groups.
Grounded Theory: Developing a theory grounded in empirical data.
Social Network Analysis (SNA): Analyzing social structures through networks and relationships.
Participatory Action Research (PAR): Involving participants in the research process to foster change.
6. Experimental Methods
Randomized Controlled Trials (RCTs): Used in social experiments to test interventions.
Quasi-Experimental Designs: Non-randomized studies used when RCTs are not feasible.
These tools and techniques allow social science scholars to explore various social phenomena in both quantitative and qualitative dimensions.
References
Dehalwar, K., & Sharma, S. N. (2023). Fundamentals of Research Writing and Uses of Research Methodologies. Edupedia Publications Pvt Ltd.
Dehalwar, K. (Ed.). (2024). Basics of Research Methodology-Writing and Publication. EduPedia Publications Pvt Ltd.
Dehalwar, K., & Sharma, S. N. (2024). Exploring the Distinctions between Quantitative and Qualitative Research Methods. Think India Journal, 27(1), 7-15.
Foster, I., Ghani, R., Jarmin, R. S., Kreuter, F., & Lane, J. (2016). Big data and social science: A practical guide to methods and tools. Chapman and Hall/CRC.
Kuechler, M. (1998). The survey method: An indispensable tool for social science research everywhere?. American Behavioral Scientist, 42(2), 178-200.
Rose, J. (1997). Soft systems methodology as a social science research tool. Systems Research and Behavioral Science: The Official Journal of the International Federation for Systems Research, 14(4), 249-258.
Sharma, S. N. (2023). An Insight into the Book Titled Why Stories Work. Think India Journal, 26(4), 19-24.
Suleiman, R., Troitzsch, K. G., & Gilbert, N. (Eds.). (2012). Tools and techniques for social science simulation. Springer Science & Business Media.
As an Indian, I am proud of my country. India is a country of pluralism and diversity, whether religions are concerned or languages, cultural issues, food habits, etc. Such diversity cannot be found in any other country, as I have visited many countries and heard from many foreigners. Our judiciary is neutral, and judges have been doing their best. Here, I wish to mention the activities of an honourable judge of Tamil Nadu whom I know closely, as I have visited Tamil Nadu many times. He is the Honourable Judge of the State Human Rights Commission (SHRC) of Tamil Nadu, V. Kannadasan, who was selected and joined in December 2022. It is pertinent to mention that the SHRC of Tamil Nadu is for the protection and promotion of human rights. V Kannadasan, a native of Mayiladuthurai, has more than 25 years of professional experience. He is a scholarly person in the legal field, particularly in civil, criminal, and human rights cases, and also an expert in prison and prisoner rights issues. He served as a special public prosecutor for the human rights court in Chennai from 2006 to 2011. Among his many praiseworthy activities, I wish to mention a few covering the period from December 2022 to mid-October 2024. Case 1: The Honourable Judge passed an order during his tenure while allowing a complaint moved by a woman, R. Vasuki, a resident of Besant Nagar, Tamil Nadu. Although the incident occurred on July 11 2013, the order was passed during his tenure. On July 11, 2013, sub-inspectors S. Rajasekharan and S. Ismayil, with the constables Padmanabhan and L. Umashankar attached to an anti-land grabbing cell, Kancheepuram, trespassed in her house. For these illegal activities, after the hearing, Honourable Judge Kannadasan directed the Tamil Nadu government to pay an amount of Rs 1.5 lakh as compensation to the victim of police access. Further, he directed the State Government to recover the money from the salaries of police personnel who were the culprits. Case 2: This is the case of death because of drowning in a quarry. Divya, with her son Ariyan, went to an abundant quarry full of water for bathing. During the time of bathing, both died in drowning. The husband, M. Sankar, filed a complaint on June 13, 2020. After a thorough review, Honourable Judge Kannadasan directed the State Government to pay Rs. 5 lakh. Also, it is not noteworthy that the District Collector was directed to close the quarry. Case 3: This case is related to the accident of a woman who was initially victimized by police inaction. Devi, a young woman going by two-wheelers, suffered severely as one pickup van dashed her two-wheelers from the back side on March 7, 2019. Subsequently, her left hand was amputated. But she did not get any justice from the police; Thiruvarur taluk police tried to hush up the case. After running from pillar to post, she filed a complaint to the State Human Rights Commission. The Honourable Judge of the SHRC passed a judgment and ordered the Tamil Nadu government to pay her an amount of Rs 3 lakh as compensation. Also, the honourable judge reprimanded the police for their inaction and recommended the government for appropriate departmental action. Case 4: This case is from Tirunelveli, and the incident occurred recently. It happened in a NEET coaching centre run by a person from Kerala, where more than 250 students had undergone coaching. The owner was inhuman in his behaviour. For instance, one day during the class hour, one boy slept, and he was beaten with a stick by the owner of this Centre. Secondly, students should usually keep their chappals outside the class in order. One girl student kept her chappals improperly. So, the owner took the chappals and threw them over the students amidst all their classmates. All these inhuman activities were brought to Judge Kannadasan’s notice, and he took this case on his own and wanted to take action against the owner. But the owner fled to Kerala. Anyway, a police complaint has been filed. Case 5: This is a case of custodial death in Madurai Central prison in 2007. One person, Pulipandi, was brutally killed in Madurai Central Prison, and later on, his father alleged that the prison authorities brutally assaulted his son. Judge Kannadasan, after a thorough hearing and review, recommended to the Tamil Nadu Government to pay a compensation of Rs. 3 lakh to the legal heirs. He concluded that it was a violation of human rights. In addition to compensation, he held Assistant Jailor Syed Shahul Hammeed and two Grade I Warders, Natarajan and Jayasrelan, responsible and legal action was recommended against them. I have presented his few verdicts out of many so that readers can understand his dynamism. I have observed that he is a fair-minded judge. I wish him more laurels in his life. Prof Shankar Chatterjee, Hyderabad
Soundscape research is a technique used to study the auditory environment, focusing on how people perceive, interact with, and respond to sounds in their surroundings. It involves the analysis of both natural and human-made sounds, taking into account the physical, social, and cultural aspects of sound in different environments. This interdisciplinary research is used in fields such as urban planning, ecology, and architecture.
Acoustic Measurements: Objective measurements, such as sound level (decibels) and frequency analysis, are conducted to understand the intensity and characteristics of different sounds in a specific area. Tools like sound level meters and frequency analyzers are commonly used.
Subjective Perception: This involves the human experience of soundscapes, including how pleasant or annoying certain sounds are. Researchers use surveys, interviews, or psychoacoustic experiments to gather data on human responses to sounds in specific environments.
Contextual Factors: Soundscape research does not just focus on sounds in isolation but considers how context, such as the time of day, the location, and the activity taking place, influences sound perception. For example, a busy marketplace might be perceived differently from a quiet park, even if both have similar sound levels.
Qualitative Sound Mapping: Sound maps visually represent the distribution of sounds across a space, showing where particular sounds dominate. This can help in identifying noise pollution hotspots or areas where certain sounds (e.g., birdsong) enhance the environment.
Biophony, Geophony, and Anthrophony: Soundscape research often categorizes sounds into these three broad types:
Biophony: Sounds produced by living organisms, like birds or insects.
Geophony: Sounds from non-biological natural sources, like wind or rain.
Anthrophony: Human-generated sounds, such as traffic or industrial noise.
Applications of Soundscape Research:
Urban Design and Planning: Soundscape research informs city planners about how to create more pleasant acoustic environments, reducing noise pollution and improving public spaces’ sound quality.
Conservation and Ecology: Ecologists use soundscape analysis to monitor biodiversity. The presence or absence of certain animal sounds can provide insight into the health of ecosystems.
Public Health: Understanding the impact of noise on mental and physical well-being is an important aspect of soundscape research. Studies have shown that excessive noise can lead to stress and other health problems, making this research vital for improving urban health policies.
Architecture: Architects use soundscape techniques to design buildings and spaces that optimize acoustic comfort, such as theaters or public squares, where sound quality is a critical design factor.
By combining acoustic data with human perception, soundscape research offers a holistic approach to understanding and improving the auditory experiences in various environments.
References
Chen, C., Jain, U., Schissler, C., Gari, S. V. A., Al-Halah, Z., Ithapu, V. K., … & Grauman, K. (2020). Soundspaces: Audio-visual navigation in 3d environments. In Computer Vision–ECCV 2020: 16th European Conference, Glasgow, UK, August 23–28, 2020, Proceedings, Part VI 16 (pp. 17-36). Springer International Publishing.
Harrison, J. (1998). Sound, space, sculpture: some thoughts on the ‘what’,‘how’and ‘why’of sound diffusion. Organised Sound, 3(2), 117-127.
Kraugerud, E. (2016). Spaces of sound: Meanings of spatiality in recorded sound (Master’s thesis).
Solomos, M. (2018). From sound to sound space, sound environment, soundscape, sound milieu or ambiance…. Paragraph, 41(1), 95-109.
Planning theories and concepts are diverse and multidisciplinary, reflecting the wide range of issues that urban and regional planning addresses. Here is a comprehensive list of key planning theories and concepts along with the theorists or scholars who proposed or significantly developed them:
—
1. Rational Planning Model
Proponent: Herbert A. Simon, Robert M. Solow
Concept: This model emphasizes logical and scientific decision-making, where planners identify goals, gather information, generate alternatives, and select the best solution through cost-benefit analysis.
2. Incrementalism
Proponent: Charles E. Lindblom
Concept: Also known as “muddling through,” this theory suggests that planning occurs in small, incremental steps rather than through comprehensive, large-scale planning. It acknowledges the limitations of complete rationality in decision-making.
3. Advocacy Planning
Proponent: Paul Davidoff
Concept: Emphasizes the need for planners to act as advocates for underrepresented or marginalized groups. It promotes multiple voices and perspectives in the planning process, rather than a single “objective” approach.
4. Communicative Planning
Proponent: Judith Innes, John Forester, Patsy Healey
Concept: Focuses on communication and dialogue between stakeholders in the planning process. It highlights collaboration, consensus-building, and the importance of public participation.
5. Collaborative Planning
Proponent: Patsy Healey
Concept: An extension of communicative planning, this approach focuses on bringing diverse stakeholders together to collectively solve planning problems, with an emphasis on power relations and social equity.
6. Transactive Planning
Proponent: John Friedmann
Concept: This theory emphasizes the interaction between planners and the public, where knowledge is co-produced through dialogue and mutual learning. The focus is on understanding and adapting to local needs through a process of action and feedback.
7. Equity Planning
Proponent: Norman Krumholz
Concept: Argues for planning to focus on redistributive policies that address social inequalities and injustices, particularly in urban settings. Equity planning seeks to ensure that marginalized groups benefit from urban development.
8. Radical Planning
Proponent: Stephen Grabow, John Heskin
Concept: Advocates for a bottom-up approach to planning that challenges existing power structures and promotes social change through community empowerment and direct action.
9. Just City Theory
Proponent: Susan Fainstein
Concept: This theory advocates for the development of cities that prioritize justice, equity, and fairness, rather than efficiency or economic growth alone. It integrates ideas of social justice into urban planning practice.
10. New Urbanism
Proponents: Andrés Duany, Elizabeth Plater-Zyberk, Peter Calthorpe
Concept: A movement that promotes walkable, mixed-use, and human-scaled urban environments. It seeks to counter urban sprawl and create sustainable, livable communities.
Concept: Focuses on meeting the needs of the present without compromising the ability of future generations to meet their own needs. This concept integrates environmental, social, and economic dimensions into planning.
12. Smart Growth
Proponents: Various urban planners, U.S. EPA (Environmental Protection Agency)
Concept: A set of planning principles that promote sustainable urban growth through compact, transit-oriented, walkable, and mixed-use development to curb urban sprawl.
13. Growth Machine Theory
Proponent: Harvey Molotch
Concept: Focuses on the coalition of business, political, and social elites who work to influence urban growth and land development for economic gains. It examines how these interests drive urban policy and development.
14. Urban Regime Theory
Proponents: Clarence Stone, Regime theorists
Concept: Examines how coalitions of public and private actors work together to govern cities. Urban regimes influence the distribution of resources and decision-making in cities.
15. Modernist Planning
Proponents: Le Corbusier, Ebenezer Howard, Frank Lloyd Wright
Concept: A style of planning that emerged in the early 20th century, emphasizing rationality, functional zoning, large-scale urban development, and the separation of land uses (residential, commercial, industrial).
16. Garden City Movement
Proponent: Ebenezer Howard
Concept: Proposes self-contained, planned communities surrounded by greenbelts to combine the best elements of both urban and rural life. The goal was to counteract the overcrowded, unhealthy conditions of industrial cities.
17. City Beautiful Movement
Proponent: Daniel Burnham
Concept: Advocates for beautification and monumental grandeur in cities to promote civic pride and improve urban living conditions. It emphasized formal planning, public spaces, and neoclassical architecture.
18. Central Place Theory
Proponent: Walter Christaller
Concept: This geographic theory explains the distribution of services, settlements, and market centers in a region, based on a hierarchy of central places that provide goods and services to surrounding areas.
19. Concentric Zone Theory
Proponent: Ernest Burgess
Concept: A model of urban land use that suggests cities grow outward in concentric rings, with the central business district at the core, followed by zones of residential and industrial development.
20. Sector Model
Proponent: Homer Hoyt
Concept: This theory suggests that urban areas develop in wedge-shaped sectors radiating outward from the city center, with different types of land uses occupying these sectors.
21. Multiple Nuclei Theory
Proponents: Chauncy Harris, Edward Ullman
Concept: Proposes that cities have multiple centers (nuclei) around which different types of activities cluster, as opposed to having a single central business district.
22. Participatory Planning
Proponent: Sherry Arnstein (Ladder of Citizen Participation)
Concept: Promotes the involvement of citizens in decision-making processes in planning. Arnstein’s “Ladder of Citizen Participation” outlines different levels of public involvement, from tokenism to full citizen control.
23. Postmodern Planning
Proponent: David Harvey, Edward Soja
Concept: Challenges the uniform, top-down approaches of modernist planning and promotes diverse, context-sensitive approaches that acknowledge complexity, multiplicity, and the importance of place.
24. Political Economy of Planning
Proponents: Manuel Castells, David Harvey
Concept: This theory focuses on how economic and political power influences planning and urban development. It emphasizes the role of capital, class struggle, and economic systems in shaping cities.
25. Ecological Urbanism
Proponent: Mohsen Mostafavi, Gareth Doherty
Concept: Emphasizes the integration of ecological and environmental principles into urban planning and design, addressing sustainability, climate change, and the balance between natural and built environments.
—
Conclusion
These theories and concepts reflect the evolution of planning thought over time, from early rational models to more contemporary approaches that prioritize equity, sustainability, and public participation. Each theory offers a distinct perspective on how cities should grow and be managed, influenced by social, political, and economic forces.
References
—
1.Rational Planning Model
Proponent: Herbert A. Simon, Robert M. Solow
2. Incrementalism
Proponent: Charles E. Lindblom
3. Advocacy Planning
Proponent: Paul Davidoff
4. Communicative Planning
Proponent: Judith Innes, John Forester, Patsy Healey
5. Collaborative Planning
Proponent: Patsy Healey
6. Transactive Planning
Proponent: John Friedmann
7. Equity Planning
Proponent: Norman Krumholz
8. Radical Planning
Proponent: Stephen Grabow, John Heskin
9. Just City Theory
Proponent: Susan Fainstein
10. New Urbanism
Proponents: Andrés Duany, Elizabeth Plater-Zyberk, Peter Calthorpe
The cryptocurrency sector is getting mature, and the demand for secure, scalable, and efficient platforms for institutional needs is growing rapidly. Institutional crypto platforms offer services that go far beyond the scope of typical retail trading platforms, making it a preferred choice for large financial entities, hedge funds, and corporations. An example is the institutional crypto platform WhiteBIT – the largest European exchange that offers advanced tools for companies tapping into the crypto market. Let’s see what services can be found on platforms like WhiteBIT.
The Essence of Institutional Cryptocurrency Trading
Institutional crypto trading differs significantly from individual or retail trading in several key aspects. While retail traders may focus on short-term gains and smaller trades, institutions often deal with substantial volumes of cryptocurrency assets, requiring more robust trading infrastructures. These entities engage in large-scale, high-frequency trading, which demands access to deep liquidity pools, advanced trading algorithms, and over-the-counter (OTC) markets that offer higher transaction limits.
Advantages of Using an Institutional Trading Platform
Institutional crypto exchanges offer various extended services and specialized tools to enhance trading efficiency, security, and compliance. Below are some of the key services available on these platforms:
Market-making. It provides liquidity to the market by ensuring that buy and sell orders are consistently filled. Institutions benefit from market-making because it minimizes the slippage and volatility that can arise from large-volume trades. Institutional traders often engage in liquidity provision themselves or partner with market makers to optimize their trading strategies.
Token listing. Institutional platforms typically provide a seamless and secure environment for token listings, which is essential for projects looking to attract institutional investors. On the other hand, institutions that plan to launch their own crypto can also use institutional cryptocurrency exchange services, including launchpads and marketing solutions.
Lending and borrowing. Lending services are particularly appealing to institutional investors who may need to leverage their positions or borrow assets for strategic purposes. A b2b crypto exchange may offer dedicated lending platforms where businesses can lend out digital assets, often under favorable terms compared to retail platforms.
Over-the-counter (OTC) trading. OTC trading desks provide institutions with the ability to execute large trades without directly impacting the market price. OTC trades are negotiated directly between two parties, allowing institutions to buy or sell large volumes of cryptocurrency without causing price fluctuations.
Advanced security and AML/KYC compliance. Institutional cryptocurrency platforms are equipped with advanced security protocols, including multi-signature wallets, cold storage, and encrypted data transfers. Additionally, these platforms must comply with rigorous AML and KYC requirements, ensuring that all transactions are transparent and meet regulatory standards.
Institutional crypto exchanges are a critical part of the digital asset landscape, offering extended services and tools that meet the specific needs of large financial institutions, fun
Writing effective answers in exams like the UPSC Civil Services Examination requires a strategic approach. Here are some essential tips to enhance your answer-writing skills:
Read Carefully: Make sure you comprehend what is being asked. Look for keywords and specific instructions.
Identify the Demand: Determine if the question is asking for an explanation, analysis, comparison, or opinion.
2. Structure Your Answer
Introduction: Start with a brief introduction that outlines the key points you will discuss. This sets the context for your answer.
Body: Present your arguments and points systematically. Use subheadings or bullet points where appropriate for clarity.
Conclusion: End with a concise conclusion that summarizes your main points and, if applicable, provides a perspective or recommendation.
3. Be Concise and Relevant
Stick to the Point: Avoid unnecessary elaboration. Focus on the question and avoid tangents.
Use Clear Language: Write in simple and straightforward language. Avoid jargon unless necessary.
4. Incorporate Facts and Examples
Use Data and Statistics: Support your arguments with relevant facts, figures, and examples. This adds credibility to your answer.
Real-Life Examples: Referencing current events, historical instances, or case studies can illustrate your points effectively.
5. Practice Time Management
Plan Your Time: Allocate a specific amount of time for each question. Practice writing answers within the set time limits to build efficiency.
Review Your Answers: If time permits, quickly review your answers for clarity and completeness.
6. Develop Your Own Style
Practice Regularly: Write practice answers to previous years’ questions to improve your style and speed.
Seek Feedback: Share your answers with peers or mentors to get constructive feedback and improve.
7. Use Diagrams and Flowcharts
Visual Aids: Where applicable, use diagrams, flowcharts, or tables to summarize information. Visuals can make complex information easier to digest.
8. Be Objective and Analytical
Critical Thinking: Show your ability to analyze different viewpoints. Weigh pros and cons where necessary, demonstrating depth in your understanding.
Balanced Approach: If the question requires an opinion, present a balanced view rather than a one-sided argument.
9. Stay Updated on Current Affairs
Integrate Relevant Current Events: Relate your answers to current affairs when relevant. This shows your awareness of the world and how it relates to the topic.
10. Stay Calm and Focused
Maintain Composure: Manage exam stress with relaxation techniques. A calm mind enhances clarity and focus while writing.
Stay Positive: Believe in your preparation and skills. Confidence can greatly influence your performance.
Conclusion
Effective answer writing in UPSC exams is a skill that develops over time with practice and reflection. By following these tips and continuously honing your writing ability, you can enhance your chances of success in the examination.
References
Clayton, D. L. K., Rogers, S., & Stuifbergen, A. (1999). Answers to unasked questions: Writing in the margins. Research in Nursing & Health, 22(6), 512-522.
Dehalwar, K., & Sharma, S. N. (2023). Fundamentals of Research Writing and Uses of Research Methodologies. Edupedia Publications Pvt Ltd.
Dehalwar, K. (Ed.). (2024). Basics of Research Methodology-Writing and Publication. EduPedia Publications Pvt Ltd.
Hand, B., Prain, V., & Wallace, C. (2002). Influences of writing tasks on students’ answers to recall and higher-level test questions. Research in Science Education, 32, 19-34.
Rijlaarsdam, G., & Van den Bergh, H. (2013). The dynamics of composing—An agenda for research into an interactive compensatory model of writing: Many questions, some answers. In The science of writing (pp. 107-125). Routledge.
The present paper is on the assessment of commonly used forms of energy in the study area in Okrika Local Government Area. The researcher adopted the descriptive survey research design. Taro Yamene was used to derive a representative sample size from the target population. Data were sourced from both primary and secondary sources. Primary data were generated with use of a close-ended questionnaire. Secondary data which were used to compliment the primary data were collected from journal articles. Descriptive method of data analysis was employed for the analysis of primary data. This involved the use of percentage and frequency distribution tables, pie charts and bar charts. The results of the analysis show high level of non-patronage for clean energy. It was recommended that there is need for enlightenment on the long term economic and environmental cost benefits of clean energy for cooking.
For the past decades, the world has been dominated by fossil fuel energy sources; and literature evidence has proved that the heavy reliance on fossil-fuel based energy sources remains at the heart of the current global challenge of significant climate change which poses severe threat to the generality of mankind. Realising the huge environmental and social costs of using fossil fuel energy sources, there has been a call from international organisations, as well as researchers for the adoption of clean energy which is believed to hold the key potential to displace greenhouse gas emissions from fossil fuel-based sources of energy. Notwithstanding, many nations of the world still rely heavily on the use of traditional sources of energy, especially in the sphere of cooking at the household level (Crosby, 2016). In Nigeria, this challenge has gone for decades despite the abundance of other natural resources such as liquid natural gaswhich could be utilised for the generation of clean energy for cooking purposes (Azubuike, 2016). In most Nigerian societies, mosthouseholds can only access or use traditional energy sources and non-clean fuel such as firewood (traditional biomass), charcoal, kerosene, plant residue and animal waste; which are of very low technological-base. On daily basis, women, who do the major household cooking are seen engaging in fuel-gathering which they depend on for cooking. The cooking fuel mainly consists of cut wood, twigs, small branches, thorns, small herbs and crop residues, and dung-cakes.The use of these substances poses serious environmental and social health problems. Since major household cooking is done by the women, this study has been designed to examine the role women organisations could play to promote the use of clean energy for household cooking purposes.
Aim and objective of the study
The aim of this paper is to assess the commonly used forms of energy for household cooking.
Research question
What are the commonly used forms of energy for household cooking?
Significance of the study
Theoretical significance: this study is designed to investigate the place of women organisations is promoting the adoption of clean energy for household cooking. This is an area that does not enjoy major scholarly documentations. Therefore, findings made from this study would fill a major gap in literature. Also, the data generated from this study would prove useful for the conduct of future researches related to the subject matter.
Scope of the study
The study examines the role of women organisations in promoting the use of clean energy for household cooking. The specific issues to be considered are: the factors that influence a family’s cooking energy; the barriers affecting the adoption of clean energy for household cooking; the potential of women organisations in promoting the use of clean energy for household cooking and the implications of heavy use of non-clean energy for household cooking. All these would follow a critical look at the commonly used forms of energy. The study locale is Okrika Local Government Area of Rives State.
Definition of terms
Women: these are members of the female gender
Organisations: a group of people with an explicit purpose and written rules.
Women organisations: these are cultural associations comprising women who unite on the bases of certain socio-cultural factors such as age, marital status and economic standing.
Energy: a substance that allows people to do work.
Clean energy: clean energy refers to any source of fuel that is efficient and poses less environmental health challenges.
Promotion: a practice is promoted when its use is supported ad encouraged
Household: a household is a family, comprising people who are related by blood or other some socially recognised process such as adoption and marriage.
Cooking: this refers to the activity or preparing food for personal or public consumption.
An overview of the concept of clean energy.
Concept of clean energy
The term clean energy refers to fuels which are more environmentally sustainable, energy efficient and when used do not have any harm on the health of those in the households (IEA, 2017). The following sources of clean energy are commonly cited in literature:
Hydropower:
Hydropower is an essential energy source harnessed from water (Asumadu-Sarkodie, Owusu, and Jayaweera, 2015; Asumadu-Sarkodie, Owusu, and Rufangura, 2015). It is generated from reservoirs created in dams, run-off-rivers or in-streams. When water is released, the reservoir level changes to some extent and accordingly influences electricity production (Førsund, 2015). Hydropower discharges practically no particulate pollution, can upgrade quickly, and is capable of storing energy for many hours (Hamann, 2015).
Bioenergy:
Bioenergy is a renewable energy source derived from biological sources. Bioenergy is an important source of energy which can be used for transport using biodiesel, electricity generation, cooking and heating. Electricity from bioenergy attracts a large range of different sources, including forest byproducts such as wood residues; agricultural residues such as sugar cane waste; and animal husbandry residue such as cow dung. One advantage of biomass energy-based electricity is that fuel is often a by-product. Significantly, it does not create a competition between land for food and land for fuel (Urban and Mitchell, 2018). Presently, global production of biofuels is comparatively low, but continuously increasing (Ajanovic, 2017). The annual biodiesel consumption in the United States was 15 billion litres in 2006. It has been growing at a rate of 30–50% per year to achieve an annual target of 30 billion litres at the end of year 2020 (Ayoub and Abdullah, 2015). Biomass has a large potential which meets the goal of reducing greenhouse gases and could insure fuel supply in the future. A lot of research is being done in this area trying to quantify global biomass technology. According to Hoogwijk, Faaij, Eickhout, de Vries, and Turkenburg (2015), the theoretical potential of bioenergy at the total terrestrial surface is about 3,500 EJ/year. The greater part of this potential is located in South America and Caribbean (47–221 EJ/year), Sub-Saharan Africa (31 – 317 EJ/year), the Commonwealth of Independent States (C.I.S) and Baltic states (45–199 EJ/ year). The yield of biomass and its potential varies from country to country, from medium yields in temperature to high level in sub tropic and tropic countries. With biomass, a lot of research is focusing on an environmentally acceptable and sustainable source to mitigate climate change (Demirbas, Balat, andBalat, 2019).
Direct solar energy:
The word “direct” solar energy refers to the energy base for those renewable energy source technologies that draw on the Sun’s energy directly. Some renewable technologies, such as wind and ocean thermal, use solar energy after it has been absorbed on the earth and converted. Solar energy technology is obtained from solar irradiance to generate electricity using photovoltaic (PV) (Asumadu-Sarkodie and Owusu, 2016) and concentrating solar power (CSP) to produce thermal energy, to meet direct lighting needs and, potentially, to produce fuels that might be used for transport and other purposes (Edenhofer, 2016). According to the World Energy Council (2013), the total energy from solar radiation falling on the earth was more than 7,500 times the World’s total annual primary energy consumption of 450 EJ” (Urban and Mitchell, 2018).
Geothermal energy:
Geothermal energy is obtained naturally from the earth’s interior as heat energy source (Barbier, 2017). Heat is mined from geothermal reservoirs using wells and other means. Reservoirs that are naturally adequately hot and permeable are called hydrothermal reservoirs, while reservoirs that are satisfactorily hot but are improved with hydraulic stimulation are called enhanced geothermal systems (ESG). Once drawn to the surface, fluids of various temperatures can be used to generate electricity and other purposes that require the use of heat energy (Edenhofer, 2016).
Wind energy:
The emergence of wind as an important source of the World’s energy has taken a commanding lead among renewable sources. Wind exists everywhere in the world, in some places with considerable energy density (Manwell, McGowan, and Rogers, 2016). Wind energy harnesses kinetic energy from moving air. The primary application of the importance to climate change mitigation is to produce electricity from large turbines located onshore (land) or offshore (in sea or fresh water) (Asumadu-Sarkodie & Owusu, 2016). Onshore wind energy technologies are already being manufactured and deployed on large scale (Edenhofer, 2016). Wind turbines convert the energy of wind into electricity.
Ocean energy (tide and wave):
Surface waves are created when wind passes over water (Ocean). The faster the wind speed, the longer the wind is sustained; the greater distance the wind travels, the greater the wave height, and the greater the wave energy produced (Jacobson & Delucchi, 2016). The ocean stores enough energy to meet the total worldwide demand for power many times over in the form of waves, tide, currents and heat. The year 2008 saw the beginning of the first generation of commercial ocean energy devices, with the first units being installed in the UK-SeaGen and Portugal-Pelamis. There are presently four ways of obtaining energy from sea areas, namely from Wind, Tides, Waves and Thermal differences between deep and shallow Sea water (Esteban and Leary, 2014).
Research Methodology
Research Design
According to Cooper and Schindler (2016), a research design is like a plan by which a given research work is to be carried out. The descriptive survey research design is adopted for this study. The descriptive survey design is a method of collecting information by interviewing or administering a questionnaire to a sample of individuals (Kombo & Tromp, 2016). This type of design is also useful when collecting information about people’s attitudes, opinions, and habits (Kombo and Tromp, 2016). Since this falls within the focus of this study, the descriptive survey would be the most appropriate design to be used.
Population of the study
According to Mugenda and Mugenda (2019), the population of a study is that population to which a researcher wants to generalise the results of the study. The target population for this study are women in Okrika Local Government Area of Rivers State. According to the National Population Commission’s (2016) projection, the number of women in Okrika Local Government Area is 108,323.
Sample Size and Sampling Techniques
A sample is a smaller part of a statistical population where properties are studied to gain information about the whole (Kombo and Tromp, 2016). A sample size of 399 is adopted for the study. This is based on the application of the Taro Yamene statistical formula as represented below:
Where n is the subject of the formula
1 is constant
E2 = margin of error (0.05)
N is the study population of the study (108323).
Therefore,
n = 108323/1+ 108323 (0.0025).
n = 108323/1+270.8075
n = 108323/271.8075
n = 399
The selection of the sample elements will be based on the accidental sampling technique. The accidental sampling technique involves selecting available individuals who indicate readiness to participate in the study. The respondents do not have to meet any predetermined criteria. Ten out of the towns/villages that make up Okrika LGA are selected for the study. This is based on the simple random sampling technique which involves writing the names of all constituent towns in separate pieces of papers which are put in a hat; and picking ten pieces after the hat would have shaken to shuffle the pieces of papers. From each of the selected communities, at least 39 respondents would be chosen to ensure fair representation. (See table 1 below for details)
Table 1 showing selected communities and sample size.
Serial number
List of randomly selected towns
Sample size
1.
Abam–Ama
39
2
Okochiri
39
3
Opuado-Ama
39
4
Sara- Ama
39
5
Semembiri-Ama
39
6
Otobipi
39
7
Okujagu-Ama
39
8
Okumgba-Ama
39
9
Omoaobi
43
10
Ogoloma
44
Total
10
399
Sources of data
Two kinds of data are used for this work. First are primary data which are sourced first hand by the researcher from the field using questionnaires. The other are secondary data, sourced from secondary materials including books, magazines, journal articles, newspaper publications and encyclopedia.
Research setting
Okrika is one of the local Government areas of Rivers State. It has its headquarters located in Okrika town. The local government area is made up of several villages with four major districts. The 2006 census determined that the population of Okrika LGA was 222,026. The people of Okrika, like other Ijo sub-groups of the Niger Delta are organised into autonomous and co-equal canoe houses. Kinsmen leaving together in same area make up each War-canoe house. The languages spoken by the Okrika people are okrika and kalabari. Historically, the okrika people of old were polytheists, believing in several gods and deities. Others were animists who believed in many spirits including marine spirits and in the spirits of their ancestors. In modern Okrika, Christianity has emerged as the dominant religion. Traditional religion however still exists side by side with Christianity. Before the onset of oil and gas activities, the people of Okrika were predominantly farmers, fishers and traders.
Instrument of data collection
The research instruments used in this study are questionnaires. The questionnaires are designed using close-ended questions. The questionnaires have two sections. The items in the first section seek demographic information about the respondents such as age, experience and qualifications. The second part seek information on the research questions.
Validity and reliability of research instrument
Orodho (2015) defines validity as a prior qualitative procedure test of the research instrument in attempting to ascertain how they are accurate, correct, true, meaningful and right in enhancing the intended data for the study. Reliability on the other handis a measure of the degree to which the instrument yields consistent data after repeated trials (Mugenda and Mugenda 2013). After preparing the questionnaire, it would be submitted to the project supervisor for perusal. Her contributions would be incorporated to enhance content validity and reliability.
Method of data analysis
The analysis of the research questions would be done using simple percentage, pie-charts and histograms.
Data Presentation and Analysis, And Discussion Of Findings
Table 2 Questionnaire Response
Copies administered
Copies retrieved
Invalid copies
Valid and useful copies
Response rate
399
312
97
215
67%
The data in table 2 above represent the questionnaire response rate. It is shown in the table that a total of 399 questionnaires were distributed for the study. However, the researcher was able to retrieve only 312, 97 of which were not properly filled by the respondents; leaving only 215 copies of valid questionnaire and a response rate of 69%.
Table 3 commonly used household energy cooking sources
No.
Item
Very commonly usedF (%)
Commonly usedF (%)
Not commonly usedF (%)
Not used at allF (%)
No ideaF (%)
F total
% total
1
Charcoal
111 (51.6)
64 (29.8)
12 (5.6)
18 (8.4)
10 (4.7)
215
100
2
Firewood
89 (41.4)
96 (44.7)
16 (7.4)
4 (1.9)
10(4.7)
215
100
3
Kerosene stove
6(2.8)
115(53.5)
4 (1.9)
62 (28.8)
28 (13.02)
215
100
4
Gas stove
6 (2.8)
19 (8.9)
90 (41.9)
41 (19.07)
59 (27.4)
215
100
5
Electric cooker
4 (1.9)
16 (7.44)
108 (50.2)
12 (5.6)
70 (32.6)
215
100
The data in table 3 represent respondents’ report on the frequency of use of some common energy for household cooking purposes. For charcoal, 51.6% indicated that it is very commonly used. 29.8% reported that it is commonly used; 5.6% reported that it is not commonly used; 8.4% reported that it is not used at all; while 4.7% indicated that they have no idea on the frequency of use of the charcoal. The results for firewood are: 41.45 very commonly used, 44.7%; 44.7% commonly used; 7.4% not commonly used; 1.9% not used at all and 4.7% no idea. The results for kerosene stove are presented as: 2.8% (very commonly used); 53.5% commonly used; 1.9% not commonly used; 28.8% not used at all and 13.02% no idea. A completely different trend is observed in gas stove where 2.8% reported that it is very commonly used; 8.9% reported that it is commonly used; 19.07% reported that it is not used at all; while 27.4% reported that had no idea. A similar response pattern is observable for electric cooker which has 1.9% (very commonly used); 7.4% (commonly used); 50.2% (not commonly used); 5.6% (not used at all) and 32.6% (no idea).
Discussion of findings
The objective was to examine the commonly used forms of energy in the study area. The results of the analysis show high level of non-patronage for clean energy. In table 3, it is shown that charcoal and fuel remain the dominant sources of cooking energy. Only a small proportion of the respondents make use of gas stove and electric cooking gadgets. This findings validate the reports by Crosby (2016) and Azubuike (2016) that many nations of the world still rely heavily on the use of traditional sources of energy in the sphere of cooking at the household level.
Recommendations
Based on the findings of this study, the following recommendations are provided:
1. There is need for enlightenment on the long term economic and environmental cost benefits of clean energy for cooking.
2. There should be intensive, monitored and sustainable development programme targeted at rural areas in Nigeria. These programmes should include massive deployment of infrastructures which will aid easy access to cleaner cooking fuel energy for households use.
References
African Women Power Network Reviews (2015). Fourteen (14) Leading
Asumadu-Sarkodie S, &Owusu, P. A. (2016f). The relationship between carbon dioxide and agriculture in Ghana, a comparison of VECM and ARDL model. Environmental Science and Pollution Research. doi:10.1007/ s11356-016-6252-x
Asumadu-Sarkodie, S., &Owusu, P. A. (2016a). Feasibility of biomass heating system in Middle East Technical University, Northern Cyprus campus. Cogent Engineering,
Asumadu-Sarkodie, S., &Owusu, P. A. (2016b). A review of Ghana’s energy sector national energy statistics and policy framework. Cogent Engineering.
Asumadu-Sarkodie, S., &Owusu, P. A. (2016c). Multivariate co-integration analysis of the Kaya factors in Ghana.
Asumadu-Sarkodie, S., &Owusu, P. A. (2016d). The potential and economic viability of solar photovoltaic in Ghana. Energy Sources, Part A: Recovery, Utilization, and Environmental Effects. doi:10.1080/15567036.2015.112 2682
Asumadu-Sarkodie, S., &Owusu, P. A. (2016e). The potential and economic viability of wind farms in Ghana Energy Sources, Part A: Recovery, Utilization, and Environmental Effects. doi:10.1080/15567036.2015.1122680
Asumadu-Sarkodie, S., &Owusu, P. A. (2016g). Carbon dioxide emissions, GDP, energy use and population growth: A multivariate and causality analysis for Ghana, 1971–2013. Environmental Science and Pollution Research International. doi:10.1007/s11356-016-6511-x
Asumadu-Sarkodie, S., Owusu, P. A., &Jayaweera, H. M. (2015). Flood risk management in Ghana: A case study in Accra. Advances in Applied Science Research, 6, 196–201.
Asumadu-Sarkodie, S., Owusu, P. A., &Rufangura, P. (2015). Impact analysis of flood in Accra, Ghana. Advances in Applied Science Research, 6, 53–78.
Asumadu-Sarkodie, S., Rufangura, P., Jayaweera, H. M., &Owusu, P. A. (2015). Situational analysis of flood and drought in Rwanda. International Journal of Scientific and Engineering Research, 6, 960–970. doi:10.14299/ ijser.2015.08.013
Ayoub, M., & Abdullah, A. Z. (2016). Critical review on the current scenario and significance of crude glycerol resulting from biodiesel industry towards more sustainable renewable energy industry. Renewable and Sustainable Energy Reviews, 16, 2671–2686.
Baiyegunhi, L.J.S., Hassan, M.B. (2014), Rural household fuel energy transition: Evidence from Giwa LGA Kaduna State, Nigeria. Energy for Sustainable Development, 20(1), 30-35.
Barbier, E. (2016). Geothermal energy technology and current status: An overview. Renewable and Sustainable Energy Reviews, 6, 3–65. Demirbas, M. F., Balat, M., &Balat, H. (2019). Potential contribution of biomass to the sustainable energy development. Energy Conversion and Management, 50, 1746–1760. http://dx.doi.org/10.1016/S1364-0321(02)00002-3
Bhattacharyya, S.C., Timilsina, G.R. (2019), Energy Demand Models for Policy Formulation. A Comparative Study of Energy Demand Models. Washington D.C: World Bank Policy Research Working Paper No. 4866.
Bisu, D., Kuhe, A., Iortyer, H. (2016), Urban household cooking energy choice: An example of Bauchi Metropolis, Nigeria. Energy, Sustainability and Society, 6(1), 15.
Brew-Hammond, A. (2016), Energy access in Africa: Challenges Ahead. Energy Policy, 38(5), 2291-2301.
Edenhofer, O., Pichs-Madruga, R., Sokona, Y., Seyboth, K.,Matschoss, P., Kadner, S. and Stechow, C. (2016). Renewable Energy Sources and Climate Change Mitigation. Cambridge : Cambridge University Press.http://dx.doi.org/10.1017/CBO9781139151153
Førsund, F. R. (2015). Hydropower economics (Vol. 217). New York: Springer.
IEA (2014). Energy and poverty. In: World Energy Outlook 2002. International Energy Agency, Paris.
IEA. (2017), Energy Access Outlook 2017: From Poverty to Prosperity. World Energy Outlook Special Report. Available from: http://www. iea.org/energyaccess.
Karimu, A. (2015), Cooking fuel preferences among Ghanaian households: An empirical analysis. Energy for Sustainable Development, 27, 10-17.
Manwell, J. F., McGowan, J. G., & Rogers, A. L. (2015). Wind energy explained: Theory, design and application. Wiley.
Mensah, J, T., Adu, G. (2016). An empirical analysis of household energy choice in Ghana. Working paper 06/2012 Swedish University of Agriculture Science, Department of Economics.
Mensah, J.T., Adu, G. (2015), An empirical analysis of household energy choice in Ghana. Renewable and Sustainable Energy Reviews, 51, 1402-1411.
Nlom, J.H., Karimov, A.A. (2015), Modeling fuel choice among households in Northern Cameroon. Sustainability, 7(8), 9989-9999.
OECD and IEA. 2010. CO2 Emissions from Fuel Combustion: Highlights. Paris, Organization for Economic Co- operation and Development & International Energy Agency, 2010:130.
Ogbanga, M. M. (2024). Communication Skills in Social Work. EduPedia Publications Pvt Ltd.
Ogbanga, M. M. (2024). Oil, Gender and Unemployment: Social Issues in the Niger. Eduindex.
Ogbanga, M. M., & Sharma, S. N. (2024). Climate Change and Mental Heat. EduPedia Publications Pvt Ltd.
Ogwumike, F.O., Ozughalu, U. (2016), Energy consumption, poverty and environmental linkages In Nigeria: A case of traditional and modern fuels for cooking. In: Adenikinju, A., Iwayemi, A., Iledare, W., editors. Green Energy and Energy Security: Options for Africa. Ibadan: Atlantis Books. pp.235-254.
Ogwumike, F.O., Ozughalu, U.M. (2016), Analysis of energy poverty and its implications for sustainable development in Nigeria. Environment and Development Economics, 21(3), 273-290.
Ogwumike, F.O., Ozughalu, U.M., Abiona, G.A. (2014), Household energy use and determinants : Evidence from Nigeria. International Journal of Energy Economics and Policy, 4(2), 248-262.
Olojede, I. (2018). Women’s Interest Organizations: Encounters With the State on Issues of Good Governance. Report. Civil Society and Governance Programmes, IDS, Department of Political Science, Lagos State University, Ojo Nigeria.
Organizations Changing the Lives of Nigerian Women and Girls. Available online at https://awpnetwork.com (Accessed October 13, 2015).
Oyekale, A.S. (2012), Assessment of households’ access to electricity and modern cooking fuels in rural and Urban Nigeria: Insights from DHS data. Life Science Journal, 9(4), 1564-1570.
Rahut, D.B., Mottaleb, K.A., Ali, A. (2017), Household energy consumption and its determinants in Timor-Leste. Asian Development Review, 34(1), 167-197.
Sa’ad, S., Bugaje, I.M. (2016), Biomass consumption in Nigeria: Trends and policy issues. Journal of Agriculture and Sustainability, 9(2), 127-157.
Smith, K., Mehta, S. and Maeusezahl-Feuz, M. (2014), “Indoor Air Pollution from Household Use of Solid Fuels”, in Ezzati, M., Rogers, A., Lopez, A., Murray C. (editors), Comparative Quantification of Health Risks, Volume 2, WHO, Geneva.
Urban, F., & Mitchell, T. (2011). Climate change, disasters and electricity generation.
WHO, 2011. Health in the Green Economy. Co-benefits of Climate Change Mitigation- Household Energy Sector in Developing Countries. Executive Summary. http://www.who.int/hia/hgebrief_henergy.pdf
The adoption of clean energy for household cooking has become a critical issue in reducing environmental degradation and improving public health. This study assesses the barriers to the adoption of clean energy in Okrika Local Government Area, Nigeria, where traditional cooking fuels, such as firewood and kerosene, remain prevalent. The research employs a mixed-methods approach, including household surveys and interviews, to identify key factors hindering the transition to cleaner energy sources such as liquefied petroleum gas (LPG) and electricity. The results reveal that socio-economic constraints, including the high cost of clean energy technologies, lack of infrastructure, cultural preferences for traditional fuels, and limited awareness about the benefits of clean energy, are significant barriers. Additionally, unreliable energy supply and inadequate government policies exacerbate the challenge. The study concludes by recommending targeted interventions, such as financial incentives, community education programs, and improved energy infrastructure, to promote the widespread adoption of clean cooking solutions in the region. Addressing these barriers is crucial to enhancing household energy security, improving health outcomes, and reducing environmental impacts in Okrika.
Poor access to clean and healthy energy sources for cooking has been a major problem confronting Okrika Local Government Area of Rivers State. In most families, women are either cooking with kerosene stove, charcoal or firewood. This practice has observably gone on for many years unabated. Studies have shown that the non-use of clean energy for cooking is responsible for a number of social and environmental health hazards currently plaguing the world. For instance, an annual premature death of 2.8 million people was recently reported due to smoky environments caused by burning solid biomass in inefficient stoves and or from combustion of kerosene or coal for cooking (IEA, 2017). Furthermore, overreliance on traditional energy sources like wood and agricultural residues has been identified as a leading cause of deforestation. More worrying is the fact that household energy consumption in developing countries has been identified as contributing more to climate change relative to developed countries, since high concentration of methane and black carbon resulting from incomplete combustion of biomass and other solid fuels is generated in developing countries due to predominant use of traditional stoves (WHO, 2011). Empirically, this study acknowledges the existence of several studies such as those conducted by Oyekale (2012), Mensah and Adu (2015), Karimu (2015) and Nlomand Karimu (2015) that have examined the phenomenon of household cooking fuel. However, while these studies only focused on explaining the factors influencing household cooking fuel choice at both local and national perspectives, none offers an explanation as to how women organisations would help to improve the use of clean fuel for cooking in households. It is against this backdrop that this study is designed to bridge the gap in literature by examining the role of women organizations in promoting the use of clean energy. This would be done with focus on Okrika Local Government Area of Rivers State.
Aim and objective of the study
To assess the barriers to the adoption of clean energy for household cooking.
Research question
What are the barriers to the adoption of clean energy for household cooking?
Significance of the study
Practical significance: this study would provide information on the effects of not using clean energy for cooking. This would encourage informed choices among women. The study would also provide information on the factors that influence a family’s energy choice for cooking. The government, international organisations and other stakeholders would find useful, such data for the formulation of relevant policies geared towards promoting the adoption of clean energy for cooking. Also, traditional heads and the society at large would be made to understand how the society could use socio-cultural associations such as women groups to improve healthy lifestyle in our local communities.
Scope of the study
The study examines the role of women organisations in promoting the use of clean energy for household cooking. The specific issues to be considered are: the factors that influence a family’s cooking energy; the barriers affecting the adoption of clean energy for household cooking; the potential of women organisations in promoting the use of clean energy for household cooking and the implications of heavy use of non-clean energy for household cooking. All these would follow a critical look at the commonly used forms of energy. The study locale is Okrika Local Government Area of Rives State.
Definition of terms
Women: these are members of the female gender
Organisations: a group of people with an explicit purpose and written rules.
Women organisations: these are cultural associations comprising women who unite on the bases of certain socio-cultural factors such as age, marital status and economic standing.
Energy: a substance that allows people to do work.
Clean energy: clean energy refers to any source of fuel that is efficient and poses less environmental health challenges.
Promotion: a practice is promoted when its use is supported ad encouraged
Household: a household is a family, comprising people who are related by blood or other some socially recognised process such as adoption and marriage.
Cooking: this refers to the activity or preparing food for personal or public consumption.
Barriers to the adoption of clean cooking energy
The factors that have hindered the adoption of clean cooking energy in Nigeria are discussed under the following sub-headings.
Gender of household head: There are literature indications that having a man as the head of the household increases the probability of a household using clean energy for cooking. In families run by women, the reserve is usually the case. As we know, female headed households are usually less financially strong compared to male headed ones which makes such households to settle for less expensive fuel for cooking, even if such fuel is dangerous to human health. Generally, female heads and consequently their households are economically vulnerable because of poor access to employment opportunities and resources which the men enjoy (Ogwumike, 2014; Rahut, 2017).
Age of household head: Studies have shown that the probability of using clean energy is also significantly linked with the age of the household head. For instance, it is shown in Baiyegunhi and Hassan (2014) that the probability of using gas as cooking fuel decreases as the age of household head increases when other variables are held constant, while it increases for firewood. This arises due to reduction in income of the head when he or she is no longer economically active coupled with the fact that such household head might not have any other source of income, either through remittances, pension or other income sources. The reality of low or no and unstable income (for pensioners) which is prevalent in Nigeria is seen to have lowered the standard of living of households with older heads. Other reasons could be due to the old habit of conservatism associated with older people. In this case, old folks may have become accustomed to the use of traditional fuel energy source(s) and thus are less willing to change towards modern reality of energy usage (Mensah and Adu, 2015).
Household size:Studies have proved that there will be a reduction in the probability of a household using clean energy for cooking as household size increases. This is majorly due to the amount of energy required for cooking for large number of persons and the consequent cost implication associated with it, which is higher for larger households. It is expected that larger households will prefer to use firewood, because it requires a large amount of fuel energy in aggregate to meet the family needs. In line with the submission of Pundo and Fraser (2016), it is comparatively affordable to use firewood for large family than LNG.
Education of household heads:There are indications that, increase in education attainment increases the chances of a household using clean energy as main cooking fuel while on the other hand, it reduces the likelihood of using kerosene, charcoal and wood as main coking fuels as expected, ceteris paribus. A positive and higher return to education can be deduced in this regard; that is, positive returns on employment opportunities, income and standard of living generally resulting in economic affordability of better and clean fuel energy options for cooking and other domestic uses (Bisu, 2016; Mensah and Adu, 2015).
Dwelling: Living in rural areas reduces households’ chances of using clean energy for cooking. It is suggested that rural life significantly increases the probability of using wood for cooking. This is mainly due to easy accessibility of firewood in the rural areas unlike urban areas where development in all forms has led to major deforestation; thus, various forms of improved cooking fuel energy are available to choose from. For this reason, the significant use of firewood is not unexpected (Ogwumike, 2014). This could also largely be a result of little supply of clean energy, the easy accessibility and availability of alternative fuel energy options in the rural areas.
Cost: The costs associated with acquisition of LPG gas ancillaries (i.e., cooker, gas cylinder, re-filling of the gas cylinder as needs demand) which is considered high considering the minimum wage in the country and the traditional perception of high cost and that usage of LPG gas is meant for the rich in the society is another factor affecting the use of clean energy (Sa’ad and Bugaje, 2016)
Research Methodology
Research Design
According to Cooper and Schindler (2016), a research design is like a plan by which a given research work is to be carried out. The descriptive survey research design is adopted for this study. The descriptive survey design is a method of collecting information by interviewing or administering a questionnaire to a sample of individuals (Kombo & Tromp, 2016). This type of design is also useful when collecting information about people’s attitudes, opinions, and habits (Kombo and Tromp, 2016). Since this falls within the focus of this study, the descriptive survey would be the most appropriate design to be used.
Population of the study
According to Mugenda and Mugenda (2019), the population of a study is that population to which a researcher wants to generalise the results of the study. The target population for this study are women in Okrika Local Government Area of Rivers State. According to the National Population Commission’s (2016) projection, the number of women in Okrika Local Government Area is 108,323.
Sample Size and Sampling Techniques
A sample is a smaller part of a statistical population where properties are studied to gain information about the whole (Kombo and Tromp, 2016). A sample size of 399 is adopted for the study. This is based on the application of the Taro Yamene statistical formula as represented below:
Where n is the subject of the formula
1 is constant
E2 = margin of error (0.05)
N is the study population of the study (108323).
Therefore,
n = 108323/1+ 108323 (0.0025).
n = 108323/1+270.8075
n = 108323/271.8075
n = 399
The selection of the sample elements will be based on the accidental sampling technique. The accidental sampling technique involves selecting available individuals who indicate readiness to participate in the study. The respondents do not have to meet any predetermined criteria. Ten out of the towns/villages that make up Okrika LGA are selected for the study. This is based on the simple random sampling technique which involves writing the names of all constituent towns in separate pieces of papers which are put in a hat; and picking ten pieces after the hat would have shaken to shuffle the pieces of papers. From each of the selected communities, at least 39 respondents would be chosen to ensure fair representation. (See table 1 below for details)
Table 1 showing selected communities and sample size.
Serial number
List of randomly selected towns
Sample size
1.
Abam–Ama
39
2
Okochiri
39
3
Opuado-Ama
39
4
Sara- Ama
39
5
Semembiri-Ama
39
6
Otobipi
39
7
Okujagu-Ama
39
8
Okumgba-Ama
39
9
Omoaobi
43
10
Ogoloma
44
Total
10
399
Sources of data
Two kinds of data are used for this work. First are primary data which are sourced first hand by the researcher from the field using questionnaires. The other are secondary data, sourced from secondary materials including books, magazines, journal articles, newspaper publications and encyclopedia.
Research setting
Okrika is one of the local Government areas of Rivers State. It has its headquarters located in Okrika town. The local government area is made up of several villages with four major districts. The 2006 census determined that the population of Okrika LGA was 222,026. The people of Okrika, like other Ijo sub-groups of the Niger Delta are organised into autonomous and co-equal canoe houses. Kinsmen leaving together in same area make up each War-canoe house. The languages spoken by the Okrika people are okrika and kalabari. Historically, the okrika people of old were polytheists, believing in several gods and deities. Others were animists who believed in many spirits including marine spirits and in the spirits of their ancestors. In modern Okrika, Christianity has emerged as the dominant religion. Traditional religion however still exists side by side with Christianity. Before the onset of oil and gas activities, the people of Okrika were predominantly farmers, fishers and traders.
Instrument of data collection
The research instruments used in this study are questionnaires. The questionnaires are designed using close-ended questions. The questionnaires have two sections. The items in the first section seek demographic information about the respondents such as age, experience and qualifications. The second part seek information on the research questions.
Validity and reliability of research instrument
Orodho (2015) defines validity as a prior qualitative procedure test of the research instrument in attempting to ascertain how they are accurate, correct, true, meaningful and right in enhancing the intended data for the study. Reliability on the other handis a measure of the degree to which the instrument yields consistent data after repeated trials (Mugenda and Mugenda 2013). After preparing the questionnaire, it would be submitted to the project supervisor for perusal. Her contributions would be incorporated to enhance content validity and reliability.
Method of data analysis
The analysis of the research questions would be done using simple percentage, pie-charts and histograms.
Data Presentation and Analysis, and Discussion of Findings
In this section, the data generated from the respondents during the field work are presented and analysed. This is followed by a discussion of the key findings of the study.
Table 2 Socio-Demographics of Respondents
Age: Less than 18 19-29 30-40 41-50 51 and above Total
Frequency 19 45 51 65 35 215
Percentage 8.9 20.9 23.7 29.3 16.2 100
Sex: Male Female Total
105 110 215
48.8 51,2 100
Table 2 contains the socio-demographic data of the study respondents. This includes age and sex. The number of respondents who are less than 18 years old is represented as 8.9%. Those who are between the groups of 19-29, 30-40, 41-50 and above 51 have percentage scores of 20.9, 23.7, 29.3 and 16.2 respectively. The fraction if men who participated in the study is represented as 48.8%, while that of women is 51.2%.
Figure 1 Barriers to the adoption of clean energy for household cooking.
Discussion of findings
The objective examined the barriers to the adoption of clean energy for household cooking activities. In this study, poverty is identified to be a leading cause of the problem. With rising inflationary trends, unemployment and decline in living standard, it is not unlikely that most families would resort to using non-clean energy such a firewood and charcoal since they are readily available and can be procured cheaply. Corroborating this finding, is Sa’ad and Bugaje’s (2016) study of gas use in Nigeria. According to the authors, the outrageous costs gas cooker, gas cylinder and re-filling of the gas cylinder, constitute a barrier to the use of clean energy. Ignorance of the dangers associated with the use of non-clean energy is another factor. This problem is usually associated with illiteracy which lowers people’s understanding of how their actions may affect their health or that of society. It is not unlikely that a person who lacks information of how the use of non-clean energy can affect his life would care less about what source of energy he/she uses. As Mensah and Adu (2015) and Bisu (2016) support, education of household heads is a correlate of clean energy use. According to the scholars, being educated the likelihood of using kerosene, charcoal and wood as main coking fuels. However, while these scholars argued in terms of positive returns on employment opportunities the current study considers the issue from the point of view of information. The study further shows that leaving in a rural community also increases the use of non-clean energy. This is not unexpected, considering that poverty rate is usually higher and that modern energy sources are, in most cases, lacking in rural setting. Large household size is also an identifiable factor affecting the use of clean energy. The rationale is that when a family is too large, cooking is usually done in large quantity. This would mean increased cost of procuring clean energy which is already very high in price. As a result, such families would settle for cheaper alternatives of non-clean energy. As Pundo and Fraser (2016) confirms, it is comparatively affordable to use firewood for large family than LNG. The culture of conservatism is also prominent in influencing the poor adoption of clean energy. It is a major problem for most Africans to resist modern practices, particularly those that contravene largely with what they are traditionally used to. In this case, old folks may have become accustomed to the use of traditional fuel energy source(s) and thus are less willing to change towards modern reality of energy usage (Mensah and Adu, 2015).
Recommendations
1. There should be intensive, monitored and sustainable development programme targeted at rural areas in Nigeria. These programmes should include massive deployment of infrastructures which will aid easy access to cleaner cooking fuel energy for households use.
2. The Nigerian government could partner with women organisationsin the distribution of low cost technology accessories and ancillary materials needed for the use of LPG for cooking in the country.
References
African Women Power Network Reviews (2015). Fourteen (14) Leading
Asumadu-Sarkodie S, &Owusu, P. A. (2016f). The relationship between carbon dioxide and agriculture in Ghana, a comparison of VECM and ARDL model. Environmental Science and Pollution Research. doi:10.1007/ s11356-016-6252-x
Asumadu-Sarkodie, S., &Owusu, P. A. (2016a). Feasibility of biomass heating system in Middle East Technical University, Northern Cyprus campus. Cogent Engineering,
Asumadu-Sarkodie, S., &Owusu, P. A. (2016b). A review of Ghana’s energy sector national energy statistics and policy framework. Cogent Engineering.
Asumadu-Sarkodie, S., &Owusu, P. A. (2016c). Multivariate co-integration analysis of the Kaya factors in Ghana.
Asumadu-Sarkodie, S., &Owusu, P. A. (2016d). The potential and economic viability of solar photovoltaic in Ghana. Energy Sources, Part A: Recovery, Utilization, and Environmental Effects. doi:10.1080/15567036.2015.112 2682
Asumadu-Sarkodie, S., &Owusu, P. A. (2016e). The potential and economic viability of wind farms in Ghana Energy Sources, Part A: Recovery, Utilization, and Environmental Effects. doi:10.1080/15567036.2015.1122680
Asumadu-Sarkodie, S., &Owusu, P. A. (2016g). Carbon dioxide emissions, GDP, energy use and population growth: A multivariate and causality analysis for Ghana, 1971–2013. Environmental Science and Pollution Research International. doi:10.1007/s11356-016-6511-x
Asumadu-Sarkodie, S., Owusu, P. A., &Jayaweera, H. M. (2015). Flood risk management in Ghana: A case study in Accra. Advances in Applied Science Research, 6, 196–201.
Asumadu-Sarkodie, S., Owusu, P. A., &Rufangura, P. (2015). Impact analysis of flood in Accra, Ghana. Advances in Applied Science Research, 6, 53–78.
Asumadu-Sarkodie, S., Rufangura, P., Jayaweera, H. M., &Owusu, P. A. (2015). Situational analysis of flood and drought in Rwanda. International Journal of Scientific and Engineering Research, 6, 960–970. doi:10.14299/ ijser.2015.08.013
Ayoub, M., & Abdullah, A. Z. (2016). Critical review on the current scenario and significance of crude glycerol resulting from biodiesel industry towards more sustainable renewable energy industry. Renewable and Sustainable Energy Reviews, 16, 2671–2686.
Baiyegunhi, L.J.S., Hassan, M.B. (2014), Rural household fuel energy transition: Evidence from Giwa LGA Kaduna State, Nigeria. Energy for Sustainable Development, 20(1), 30-35.
Barbier, E. (2016). Geothermal energy technology and current status: An overview. Renewable and Sustainable Energy Reviews, 6, 3–65. Demirbas, M. F., Balat, M., &Balat, H. (2019). Potential contribution of biomass to the sustainable energy development. Energy Conversion and Management, 50, 1746–1760. http://dx.doi.org/10.1016/S1364-0321(02)00002-3
Bhattacharyya, S.C., Timilsina, G.R. (2019), Energy Demand Models for Policy Formulation. A Comparative Study of Energy Demand Models. Washington D.C: World Bank Policy Research Working Paper No. 4866.
Bisu, D., Kuhe, A., Iortyer, H. (2016), Urban household cooking energy choice: An example of Bauchi Metropolis, Nigeria. Energy, Sustainability and Society, 6(1), 15.
Brew-Hammond, A. (2016), Energy access in Africa: Challenges Ahead. Energy Policy, 38(5), 2291-2301.
Dehalwar, K., & Sharma, S. N. (2023). Fundamentals of Research Writing and Uses of Research Methodologies. Edupedia Publications Pvt Ltd.
Edenhofer, O., Pichs-Madruga, R., Sokona, Y., Seyboth, K.,Matschoss, P., Kadner, S. and Stechow, C. (2016). Renewable Energy Sources and Climate Change Mitigation. Cambridge : Cambridge University Press.http://dx.doi.org/10.1017/CBO9781139151153
Førsund, F. R. (2015). Hydropower economics (Vol. 217). New York: Springer.
IEA (2014). Energy and poverty. In: World Energy Outlook 2002. International Energy Agency, Paris.
IEA. (2017), Energy Access Outlook 2017: From Poverty to Prosperity. World Energy Outlook Special Report. Available from: http://www. iea.org/energyaccess.
Karimu, A. (2015), Cooking fuel preferences among Ghanaian households: An empirical analysis. Energy for Sustainable Development, 27, 10-17.
Manwell, J. F., McGowan, J. G., & Rogers, A. L. (2015). Wind energy explained: Theory, design and application. Wiley.
Mensah, J, T., Adu, G. (2016). An empirical analysis of household energy choice in Ghana. Working paper 06/2012 Swedish University of Agriculture Science, Department of Economics.
Mensah, J.T., Adu, G. (2015), An empirical analysis of household energy choice in Ghana. Renewable and Sustainable Energy Reviews, 51, 1402-1411.
Nlom, J.H., Karimov, A.A. (2015), Modeling fuel choice among households in Northern Cameroon. Sustainability, 7(8), 9989-9999.
OECD and IEA. 2010. CO2 Emissions from Fuel Combustion: Highlights. Paris, Organization for Economic Co- operation and Development & International Energy Agency, 2010:130.
Ogbanga, M. M. (2024). Communication Skills in Social Work. EduPedia Publications Pvt Ltd.
Ogbanga, M. M. (2024). Oil, Gender and Unemployment: Social Issues in the Niger. Eduindex.
Ogbanga, M. M., & Sharma, S. N. (2024). Climate Change and Mental Heat. EduPedia Publications Pvt Ltd.
Ogwumike, F.O., Ozughalu, U. (2016), Energy consumption, poverty and environmental linkages In Nigeria: A case of traditional and modern fuels for cooking. In: Adenikinju, A., Iwayemi, A., Iledare, W., editors. Green Energy and Energy Security: Options for Africa. Ibadan: Atlantis Books. pp.235-254.
Ogwumike, F.O., Ozughalu, U.M. (2016), Analysis of energy poverty and its implications for sustainable development in Nigeria. Environment and Development Economics, 21(3), 273-290.
Ogwumike, F.O., Ozughalu, U.M., Abiona, G.A. (2014), Household energy use and determinants : Evidence from Nigeria. International Journal of Energy Economics and Policy, 4(2), 248-262.
Olojede, I. (2018). Women’s Interest Organizations: Encounters With the State on Issues of Good Governance. Report. Civil Society and Governance Programmes, IDS, Department of Political Science, Lagos State University, Ojo Nigeria.
Organizations Changing the Lives of Nigerian Women and Girls. Available online at https://awpnetwork.com (Accessed October 13, 2015).
Oyekale, A.S. (2012), Assessment of households’ access to electricity and modern cooking fuels in rural and Urban Nigeria: Insights from DHS data. Life Science Journal, 9(4), 1564-1570.
Rahut, D.B., Mottaleb, K.A., Ali, A. (2017), Household energy consumption and its determinants in Timor-Leste. Asian Development Review, 34(1), 167-197.
Sa’ad, S., Bugaje, I.M. (2016), Biomass consumption in Nigeria: Trends and policy issues. Journal of Agriculture and Sustainability, 9(2), 127-157.
Sharma, S. N. (Ed.). (2016). New perspectives in sociology and allied fields. EduPedia Publications (P) Ltd.
Smith, K., Mehta, S. and Maeusezahl-Feuz, M. (2014), “Indoor Air Pollution from Household Use of Solid Fuels”, in Ezzati, M., Rogers, A., Lopez, A., Murray C. (editors), Comparative Quantification of Health Risks, Volume 2, WHO, Geneva.
Urban, F., & Mitchell, T. (2011). Climate change, disasters and electricity generation.
WHO, 2011. Health in the Green Economy. Co-benefits of Climate Change Mitigation- Household Energy Sector in Developing Countries. Executive Summary. http://www.who.int/hia/hgebrief_henergy.pdf
The Graduate Aptitude Test in Engineering (GATE) 2025 is a national-level examination that primarily tests the comprehensive understanding of various undergraduate subjects in engineering, technology, architecture, and science. Conducted jointly by the Indian Institute of Science (IISc), Bangalore and seven Indian Institutes of Technology (IITs),
The Graduate Aptitude Test in Engineering (GATE) is a highly competitive examination conducted in India for assessing the knowledge and understanding of various undergraduate subjects in engineering, technology, and architecture. The GATE exam is primarily used for admissions into postgraduate programs (like M.Tech, M.E.) in various Indian institutes and also serves as a qualifying exam for various public sector jobs.
GATE 2025 Overview
1. Exam Structure
Subjects Covered: GATE covers various subjects across engineering, science, and architecture. The subjects are grouped into different papers, each with a unique code.
Question Types: The exam consists of multiple-choice questions (MCQs), numerical answer questions (NATs), and multiple select questions (MSQs).
Total Marks: Each paper is generally of 100 marks.
2. Eligibility Criteria
Educational Qualifications: Candidates must have completed or be in the final year of their degree in engineering/technology, or those pursuing a Master’s degree in any relevant science subject can also apply.
No Age Limit: There is no upper age limit to appear for the GATE exam.
3. Exam Pattern
Duration: The exam is typically conducted over a period of 3 hours.
Marking Scheme: Correct answers earn marks, while incorrect answers (in MCQ format) may incur a penalty (negative marking).
4. Application Process
Registration: Candidates need to register online on the GATE official website during the specified application period.
Fees: There is an application fee, which may vary based on the candidate’s category (General, OBC, SC/ST, etc.).
Documents Required: Candidates must upload necessary documents, including educational certificates, identity proof, and a passport-sized photograph.
5. Important Dates
Notification Release: Typically in July or August.
Application Form Availability: Usually opens in September.
Examination Dates: The exam is generally conducted in February.
6. Preparation Tips
Syllabus Familiarization: Candidates should thoroughly understand the GATE syllabus for their chosen paper.
Reference Books: Use standard textbooks and resources recommended for GATE preparation.
Mock Tests: Regularly practice with mock tests and previous year question papers to gain familiarity with the exam format.
Study Schedule: Create a study plan that allows sufficient time for each subject and includes breaks.
7. Post-Exam Process
Result Declaration: GATE results are usually announced within a month after the exam.
Score Validity: The GATE score is valid for three years for postgraduate admissions and for jobs in public sector undertakings (PSUs).
8. Career Opportunities
Higher Studies: Many candidates use their GATE scores for admission into prestigious institutions for M.Tech and Ph.D. programs.
Public Sector Jobs: Numerous PSUs recruit based on GATE scores, providing excellent job opportunities.
Conclusion
GATE 2025 is a crucial examination for aspiring engineers and technologists in India, offering pathways to higher education and rewarding careers in various sectors. With a structured preparation approach and thorough understanding of the exam’s requirements, candidates can enhance their chances of success.
Sentiment analysis (also known as opinion mining) refers to the use of natural language processing (NLP), machine learning (ML), and text analytics to identify and extract subjective information from textual data. The primary objective of sentiment analysis is to determine whether a given piece of text expresses a positive, negative, or neutral sentiment.
2. Applications in Research
Marketing and Business Research: Companies use sentiment analysis to gauge public opinion about their products, services, or brands. For example, analyzing customer reviews, feedback, or social media mentions helps businesses understand consumer satisfaction, brand reputation, and areas for improvement.
Political Science: Sentiment analysis is used to measure public opinion about political parties, candidates, or policies. Researchers can analyze social media posts, news articles, or public speeches to evaluate the general sentiment of voters and predict election outcomes or policy acceptance.
Social Science and Psychology: In these fields, sentiment analysis helps understand human emotions and behavior. Analyzing online discussions or blogs can reveal insights about mental health issues, social movements, or societal trends.
Healthcare: In healthcare research, sentiment analysis helps assess patient feedback, such as reviews of hospitals or doctor-patient interactions. It can also be used to analyze public opinion on health policies or medication.
3. Techniques in Sentiment Analysis
Lexicon-based Approaches: This method relies on predefined lists of words associated with positive or negative sentiments. The text is analyzed by counting the number of positive and negative words. However, this approach may struggle with handling sarcasm, negations, or complex sentence structures.
Machine Learning-based Approaches: Using algorithms like Support Vector Machines (SVM), Naïve Bayes, or neural networks, these models are trained on labeled datasets (where the sentiment is already known) to predict the sentiment of new data. These approaches are more flexible than lexicon-based methods as they learn to interpret context and complex relationships between words.
Deep Learning: Advanced techniques such as Convolutional Neural Networks (CNNs) and Recurrent Neural Networks (RNNs) further improve accuracy by learning from large datasets and handling nuances in language, including context, tone, and more complex sentence structures.
4. Challenges in Sentiment Analysis
Ambiguity and Context: Human language is often ambiguous, making it difficult for machines to correctly interpret context. For example, the sentence “The movie was surprisingly good for a boring director” contains mixed sentiment, which can be tricky for algorithms to decipher.
Sarcasm and Irony: Sentiment analysis algorithms often struggle with sarcasm or ironic statements. A sentence like “Oh great, another rainy day” might be interpreted as positive due to the word “great” when the true sentiment is negative.
Domain-Specific Language: Sentiment analysis models trained on general data may not perform well in specialized fields like finance, medicine, or law, where the meaning of certain terms could differ from common usage.
Emotion Detection: Beyond positive or negative sentiment, there are subtleties of human emotion like anger, sadness, joy, or fear. Detecting such granular emotions is a complex challenge that requires advanced models and labeled datasets.
5. Tools and Technologies
TextBlob: A Python library for text processing that provides simple sentiment analysis tools.
VADER (Valence Aware Dictionary and sEntiment Reasoner): VADER is a lexicon and rule-based sentiment analysis tool specifically designed for social media texts.
NLTK (Natural Language Toolkit): A powerful library that supports complex text analysis, including sentiment analysis.
Google Cloud Natural Language API and AWS Comprehend: Cloud-based services that offer NLP and sentiment analysis as a service.
Transformers (e.g., BERT): Transformer-based models have been revolutionary in NLP and are often fine-tuned for sentiment analysis tasks to capture the context better.
6. Data Sources for Sentiment Analysis in Research
Social Media: Platforms like Twitter, Facebook, and Reddit are rich sources of opinionated content. Twitter sentiment analysis is particularly popular due to the public nature of tweets and their limited character count.
Surveys and Reviews: Analyzing reviews from platforms like Amazon, Yelp, or TripAdvisor helps researchers understand customer satisfaction and perception.
News Articles and Blogs: These sources are useful in understanding public sentiment over longer texts, such as editorials or opinion pieces.
7. Impact on Decision-Making
Sentiment analysis aids in decision-making by providing quantifiable insights into public opinion, brand health, or societal trends. For instance:
Businesses can tweak marketing strategies based on customer feedback.
Politicians can tailor their campaign strategies after understanding voter sentiment.
Researchers can track the emotional well-being of society by monitoring discussions on mental health.
8. Future Directions
Emotion Detection and Analysis: Researchers are working to enhance sentiment analysis with more refined emotion detection capabilities.
Multilingual Sentiment Analysis: With the rise of global online communities, sentiment analysis tools need to handle multiple languages and regional dialects effectively.
Real-Time Sentiment Analysis: As data streams from social media or other sources become more real-time, sentiment analysis models that can provide real-time insights are increasingly in demand.
In summary, sentiment analysis has become an invaluable tool across various research domains, helping researchers and organizations measure public opinion and make informed decisions.
References
Cambria, E., Das, D., Bandyopadhyay, S., & Feraco, A. (Eds.). (2017). A practical guide to sentiment analysis (Vol. 5). Cham: Springer International Publishing.
Dehalwar, K., & Sharma, S. N. (2023). Fundamentals of Research Writing and Uses of Research Methodologies. Edupedia Publications Pvt Ltd.
Medhat, W., Hassan, A., & Korashy, H. (2014). Sentiment analysis algorithms and applications: A survey. Ain Shams engineering journal, 5(4), 1093-1113.
Prabowo, R., & Thelwall, M. (2009). Sentiment analysis: A combined approach. Journal of Informetrics, 3(2), 143-157.
Taboada, M. (2016). Sentiment analysis: An overview from linguistics. Annual Review of Linguistics, 2(1), 325-347.
Wankhade, M., Rao, A. C. S., & Kulkarni, C. (2022). A survey on sentiment analysis methods, applications, and challenges. Artificial Intelligence Review, 55(7), 5731-5780.
What’s the point of your essay? Is it clear to the reader from the very beginning? This is key since this is one of the main ways to improve the quality of the essay.
CREATIVITY
How you tell your story is just as important as which story you decide to tell. A creative introduction is a great way to catch your reader’s attention.
COMPELLING
Write so that the reader wants to keep reading. Aim for telling a good story, as if you are introducing yourself to someone through your favorite story about yourself. Use specific, descriptive language. Use active words rather than passive ones.
CONCISE
Use as few words as possible and make sure each word is the right one for the job. It should be concise in content but deep in meaning. Keeping meaningful and necessary sentences. Use conjunctions and compound sentences to make essay concise.
CANDOR
Make it your mission to be honest with your readers. Give readers something they can actually use in the real world: hard-won advice, useful facts that you’ve discovered, a careful description of problems, and actionable solutions to those problems. Level with your readers about important information that less courageous writers would rather not write about.
CONFIDENCE
Be both calm and firm about the rightness of your argument. Don’t demand that readers agree with you; ironically, such an approach shows lack of confidence. Invite readers to agree with you and congratulate them for choosing your firm side. Acknowledge opposing points of view, but refute them immediately and resolutely.
CONTROL
A strong argument has more impact when discussed matter-of-factly than when screamed or shouted. Don’t quote others excessively. Always retain the first word and last word of every paragraph for yourself. Balance the structure of your essay. Each section of the essay should have a specific role.
COMPREHENSION
Whatever your topic, proactively show readers that you understand it well. Be both a helpful guide through complex issues and an informed judge when choices must be made. Cover your territory fully and give readers information that they’re not likely to know. Generous sharing of useful, real-world knowledge is the fastest way to establish trust with your audience. Never forget the ultimate goal, which is to contribute your wisdom freely and help your readers sincerely.
CONSISTENT
Essay should be consistent with the norms and guidelines usually followed in academic writing. Don’t try to out of box and invent something new, this might not create impress rather it might lead to low score in essay writing answers.
References
Dehalwar, K., & Sharma, S. N. (2023). Fundamentals of Research Writing and Uses of Research Methodologies. Edupedia Publications Pvt Ltd.
Rosenwasser, D., Stephen, J., & Rosernwasser, D. (2009). Writing analytically. Thomson Wadsworth.
Raimes, A. (1998). Teaching writing. Annual review of applied linguistics, 18, 142-167.
Sharma, S. N. (2023). An Insight into the Book Titled Why Stories Work. Think India Journal, 26(4), 19-24.
Weigle, S. C. (2002). Assessing writing. Ernst Klett Sprachen.
The Rational Urban Planning Process is a systematic and methodical approach used to guide urban development and city management. It is based on logical reasoning, data-driven decision-making, and a structured series of steps that ensure urban plans are comprehensive, practical, and sustainable. This process is often used by urban planners, city managers, and policymakers to design cities or manage growth in a way that maximizes benefits for residents, businesses, and the environment while minimizing potential negative impacts.
Key Components of the Rational Urban Planning Process
Key Components of the Rational Urban Planning Process
Problem Identification and Definition The first step involves identifying and clearly defining the urban issues or problems that need to be addressed. This could range from housing shortages and traffic congestion to environmental degradation and infrastructure deficiencies. Clear problem definition allows the planning team to establish focused objectives for the planning process.
Data Collection and Analysis Planners gather comprehensive data about the city, which may include demographic statistics, land use patterns, environmental data, and economic conditions. Analyzing this data helps planners understand the current situation, identify trends, and forecast future changes. This phase often involves mapping, surveys, and field studies.
Goal Setting Based on the problem definition and data analysis, planners set specific, measurable goals for the urban plan. These goals may include reducing traffic, increasing green spaces, or improving public transport efficiency. It’s essential that these goals align with the broader vision of the city and the needs of its residents.
Generating Alternative Solutions In the rational planning model, a variety of alternative solutions or plans are developed to address the defined problems. These alternatives are based on the collected data and are designed to achieve the goals set in the previous step. Each alternative is typically distinct, offering different strategies or priorities, such as emphasizing public transportation over private car use or increasing high-density housing versus preserving more open spaces.
Evaluating Alternatives Once a range of alternatives has been developed, they are evaluated based on their potential impacts, costs, benefits, and feasibility. This evaluation uses quantitative and qualitative methods to assess how well each alternative aligns with the planning goals. Cost-benefit analysis, environmental impact assessments, and social equity assessments are some tools used in this step. Stakeholder feedback may also be integrated to refine the options.
Selecting the Best Alternative The rational planning process aims to identify the “optimal” solution from the evaluated alternatives. This is the option that best meets the identified goals, maximizes benefits, and minimizes costs or negative impacts. The selected plan may not be perfect but should represent the most balanced and feasible approach.
Implementation of the Plan Once the best alternative is selected, planners develop a detailed action plan that outlines how the urban plan will be implemented. This step involves creating policies, regulations, and strategies that ensure the plan is executed efficiently. It may also include designing timelines, allocating budgets, and identifying key agencies or stakeholders responsible for various aspects of the implementation.
Monitoring and Evaluation After implementation, the plan must be regularly monitored to ensure that it is achieving the desired outcomes. Evaluation involves comparing actual results against the goals and objectives set earlier in the process. If the plan is not performing as expected, adjustments can be made. This continuous monitoring ensures that the urban plan remains responsive to changing conditions and community needs.
Characteristics of the Rational Urban Planning Process
Systematic: The process is highly structured and follows a step-by-step methodology, ensuring no aspect of urban planning is overlooked.
Goal-Oriented: Each step is driven by clearly defined goals and objectives, which guide decision-making throughout the process.
Data-Driven: Decisions are based on empirical data, research, and analysis, which helps avoid subjective or politically driven choices.
Flexibility in Alternatives: Multiple solutions are considered, allowing for a range of options to be explored and evaluated before selecting the best one.
Predictive: The process involves forecasting future trends and conditions, enabling planners to anticipate challenges and opportunities.
Criticism of the Rational Planning Process
Despite its logical structure, the rational planning process has faced criticism, particularly in the context of urban planning:
Complexity of Urban Environments: Cities are dynamic and complex systems where social, economic, and environmental factors are interrelated. The rational approach can sometimes oversimplify this complexity, assuming that all variables can be measured and controlled.
Time-Consuming: The thoroughness of data collection, analysis, and evaluation can make the rational process lengthy, sometimes leading to delays in decision-making or action.
Limited Flexibility: The step-by-step nature of the process may not always allow for the flexibility needed to respond to unexpected changes, such as political shifts or economic crises.
Stakeholder Exclusion: Critics argue that the rational planning process can overlook the voices of marginalized groups if the focus is solely on data and technical analysis, without sufficient community input or consideration of social equity.
Over-Emphasis on Quantitative Data: While data-driven decision-making is a strength, the process sometimes places too much emphasis on quantitative analysis, neglecting qualitative factors like cultural significance or social well-being that are harder to measure.
Application in Modern Urban Planning
Today, the rational urban planning process is often blended with other planning models to address some of its limitations. For example:
Participatory Planning: Involves stakeholders, including local communities, in each step of the process, ensuring their voices are heard and their needs are reflected in the final plan.
Incremental Planning: Allows for smaller, more flexible decisions to be made, adjusting the plan as new information becomes available.
Sustainability Planning: Incorporates environmental considerations from the outset, aiming to create cities that are not only functional but also ecologically responsible.
Conclusion
The Rational Urban Planning Process is a valuable tool for systematically addressing the challenges of urban growth and development. Its emphasis on logical, data-driven decision-making helps create well-thought-out, practical solutions. However, in modern contexts, it is often used in combination with other models to address its limitations and ensure more inclusive, flexible, and adaptive urban planning outcomes.
References
Baum, H. S. (1996). Why the rational paradigm persists: Tales from the field. Journal of Planning Education and Research, 15(2), 127-135.
de Smit, J., & Rade, N. L. (1980). Rational and non-rational planning. Long Range Planning, 13(2), 87-101.
Gezelius, S. S., & Refsgaard, K. (2007). Barriers to rational decision-making in environmental planning. Land use policy, 24(2), 338-348.
Rothblatt, D. N. (1971). Rational planning reexamined. Journal of the American Institute of Planners, 37(1), 26-37.
Stuart, D. G. (1969). Rational urban planning: problems and prospects. Urban Affairs Quarterly, 5(2), 151-182.
Sherry Arnstein’s “Ladder of Citizen Participation” is a seminal framework in urban planning and public policy, which she introduced in a 1969 article in the Journal of the American Institute of Planners. The framework categorizes different levels of citizen involvement in decision-making processes, offering a critical perspective on the dynamics between power holders and citizens. Arnstein’s ladder remains influential in discussions of participatory democracy, power distribution, and community engagement.
Overview of the Ladder
The “Ladder of Citizen Participation” is depicted as an eight-rung ladder, with each rung representing a different level of citizen participation. The higher the rung, the greater the degree of citizen power and influence in the decision-making process. Arnstein’s model is divided into three broad categories:
Nonparticipation: The lowest rungs, where the primary goal is not genuine participation but rather to manipulate or placate the public.
Tokenism: The middle rungs, where citizens are allowed to have a voice but without any real power to influence the outcome.
Citizen Power: The highest rungs, where citizens obtain decision-making power and can directly influence policies and programs.
The Eight Rungs of the Ladder
Manipulation:
Definition: This is the lowest level of participation, where those in power (government officials, developers, etc.) “educate” or “inform” citizens in a way that subtly or overtly manipulates them into supporting predetermined plans.
Characteristics: Citizens are used as a public relations tool, with the illusion of participation rather than any real influence. Information is controlled and selectively released to shape opinions without genuinely addressing citizen concerns.
Therapy:
Definition: This rung is characterized by efforts to “cure” or “educate” citizens about their own problems, under the assumption that their attitudes or behaviors are the root cause of issues, rather than systemic problems.
Characteristics: Citizens are involved in activities meant to change their views or attitudes, but not in a way that grants them any control over decisions. The focus is on “adjusting” citizens to fit existing structures, rather than altering those structures.
Informing:
Definition: The first level of what Arnstein describes as “tokenism,” where citizens are merely informed of their rights, responsibilities, and options.
Characteristics: Information flows from the power holders to the citizens with no channel for feedback or dialogue. While informing is a necessary part of participation, at this stage, it is largely one-way communication, with little to no influence on decision-making.
Consultation:
Definition: This rung involves asking citizens for their opinions through surveys, meetings, or public hearings.
Characteristics: Although this represents an improvement over simply informing, consultation often fails to ensure that citizen feedback will be heeded. It gives the appearance of involving citizens, but without any guarantee of influence on the final decision.
Placation:
Definition: At this stage, citizens are allowed to advise or make recommendations, but the power holders retain the right to decide whether to accept or reject the advice.
Characteristics: Mechanisms like citizen advisory boards or committees are established, but these bodies typically lack the authority to make or enforce decisions.
Partnership: In this level, power is shared between citizens and authorities. Citizens actively participate in decision-making processes, forming a partnership with officials. Negotiations take place, and there is mutual decision-making power.
Delegated Power: Citizens gain more control as decision-making authority is largely handed over to them. They are given delegated responsibilities to govern specific areas, although ultimate control may still lie with higher authorities.
Citizen Control: At the highest level of participation, citizens have full authority over decision-making processes. They initiate and lead programs, having complete control over policies and governance without needing external approval.
The participation levels of partnership, delegated power, and citizen control refer to degrees of citizen involvement in decision-making processes, often depicted in Arnstein’s Ladder of Citizen Participation. These levels represent increasing degrees of citizen empowerment.
These levels reflect a progression toward greater citizen autonomy and control over public matters.
References
Arnstein, S. R. (1969). A ladder of citizen participation. Journal of the American Institute of planners, 35(4), 216-224.
Arnstein, S. R. (2019). A ladder of citizen participation. Journal of the American planning association, 85(1), 24-34.
Gaber, J. (2020). Building “a ladder of citizen participation”: Sherry Arnstein, citizen participation, and model cities. In Learning from Arnstein’s Ladder (pp. 13-34). Routledge.
Maier, K. (2001). Citizen participation in planning: Climbing a ladder?. European Planning Studies, 9(6), 707-719.
May, J. (2006). Ladders, stars and triangles: old and new theory for the practice of public participation. International journal of market research, 48(3), 305-319.
Urban planning is a multifaceted discipline that aims to create functional, sustainable, and livable cities. Over time, various theories have emerged to explain how urban planning should be conceptualized, executed, and structured. These theories can be classified into three major categories: Conceptual Theories, Procedural Theories, and Land-use-based Theories. Each of these approaches provides a unique lens to understand the dynamics of city planning and its relationship to the environment, society, and economy.
1. Conceptual Urban Planning Theories
Conceptual theories focus on the underlying ideas, visions, and philosophical assumptions that guide the practice of urban planning. These theories aim to shape how we think about the structure and purpose of urban spaces. They are often normative, meaning they propose an ideal form for cities.
a. Garden City Movement (Ebenezer Howard)
Core Idea: The Garden City concept was proposed by Ebenezer Howard in the late 19th century, aiming to combine the best aspects of the city and countryside.
Key Features: Howard envisioned self-contained communities surrounded by greenbelts, with a balance of residential, industrial, and agricultural areas. The goal was to reduce urban sprawl and overcrowding while promoting healthy living conditions.
Impact: This theory laid the groundwork for the development of suburban areas and influenced the planning of modern towns.
b. Radiant City (Le Corbusier)
Core Idea: Le Corbusier’s vision of the Radiant City was a high-density, vertically structured urban environment, which focused on order, symmetry, and modernism.
Key Features: His concept called for skyscrapers for work and living, surrounded by parks and open spaces. He believed that rational city planning should prioritize efficiency, through zoning for different activities, and heavily relied on technological advancements.
Impact: Though controversial, this theory influenced the development of modernist urban projects, especially in the mid-20th century, like Brasília and Chandigarh.
c. City Beautiful Movement
Core Idea: Originating in the United States in the late 19th and early 20th centuries, this movement emphasized the aesthetic quality of urban spaces, believing that beautiful cities promote a better quality of life.
Key Features: Advocates of the City Beautiful movement argued that wide boulevards, grand parks, and monumental public buildings would instill civic pride and moral upliftment among citizens.
Impact: The City Beautiful movement influenced the design of several major American cities, particularly Washington D.C., Chicago, and Cleveland.
d. New Urbanism
Core Idea: This is a late 20th-century movement that promotes walkable neighborhoods, mixed-use development, and sustainable urban design.
Key Features: New Urbanism advocates for the creation of pedestrian-friendly streets, human-scale development, and the integration of different types of housing and businesses.
Impact: It has influenced modern city developments, focusing on reducing automobile dependence and creating more livable, community-oriented environments.
2. Procedural Urban Planning Theories
Procedural theories focus on the methods, processes, and techniques used in planning. Rather than focusing on what the ideal city should look like, these theories concentrate on how planning should be conducted. They reflect the operational side of urban planning and involve decision-making, stakeholder engagement, and the use of various tools for implementation.
a. Rational Planning Model
Core Idea: The Rational Planning Model is rooted in a systematic approach to problem-solving, based on scientific methods.
Key Features: This model emphasizes clear objectives, data-driven analysis, forecasting future scenarios, and selecting the best course of action among alternatives.
Steps: The process typically involves defining the problem, setting goals, gathering data, analyzing alternatives, and making decisions.
Criticism: This model has been criticized for being too technocratic, ignoring social and political dimensions, and assuming that all variables can be predicted or controlled.
b. Incrementalism (Charles Lindblom)
Core Idea: Incrementalism, also known as “muddling through,” rejects the comprehensive nature of rational planning. Instead, it advocates for making small, manageable changes rather than large, sweeping reforms.
Key Features: In this model, planners deal with problems incrementally by making decisions based on a series of small steps. It recognizes the limitations of human capacity to foresee all outcomes and suggests that planning should be flexible and adaptive.
Criticism: Critics argue that incrementalism can be too conservative, potentially missing opportunities for larger-scale innovation or necessary transformation.
c. Communicative Planning
Core Idea: This theory views planning as a collaborative and communicative process, emphasizing the involvement of various stakeholders in decision-making.
Key Features: Communicative planning is built on the idea that planners should act as facilitators of dialogue among different interest groups. The goal is to reach consensus and develop plans that are inclusive and democratic.
Criticism: While participatory planning is praised for its inclusiveness, critics argue that it can be time-consuming and may not always lead to decisive action.
d. Advocacy Planning (Paul Davidoff)
Core Idea: Advocacy planning emerged in the 1960s in response to the technocratic nature of earlier models. It argues that planners should not be neutral but should actively advocate for marginalized communities and social justice.
Key Features: Planners are seen as representatives for particular interest groups, particularly those who are often left out of planning decisions. It emphasizes the need for planners to address social inequalities in cities.
Criticism: Advocacy planning may lead to conflicts between different interest groups, and critics argue it can politicize the planning process, potentially undermining the professional neutrality of planners.
e. Transactive Planning
Core Idea: Transactive planning, developed by John Friedmann, focuses on the interaction between planners and the people they serve. Planning is seen as a learning process where knowledge is exchanged between experts and community members.
Key Features: This theory emphasizes mutual learning, personal interactions, and the co-creation of solutions through shared experiences. The knowledge and values of the community are considered as important as the technical knowledge of the planners.
Criticism: The challenge with transactive planning lies in effectively balancing professional expertise with community input, and ensuring that the process remains equitable.
3. Land-Use-based Urban Planning Theories
Land-use-based urban planning refers to the strategic arrangement and regulation of the physical space within a city or urban area. It focuses on how land is allocated for different purposes—residential, commercial, industrial, recreational, agricultural, or environmental preservation—while considering social, economic, and environmental factors. Urban planning theories in this domain have evolved over time, reflecting shifts in urban development priorities, technological advancements, and social paradigms. Key theories include the following:
a. The Concentric Zone Theory (Burgess Model)
Developed by sociologist Ernest Burgess in the 1920s, this theory was among the earliest attempts to explain urban land-use patterns. The Concentric Zone Model suggests that cities grow outward in rings from a central core, known as the Central Business District (CBD). Burgess proposed five zones:
Zone 1 (CBD): The central business district, containing commercial activities.
Zone 2 (Transition Zone): A mix of industry and poorer residential housing.
Zone 3 (Working-Class Residential): Densely populated working-class housing.
Zone 4 (Middle-Class Residential): More spacious housing for the middle class.
Zone 5 (Commuter Zone): Suburban areas with higher-end housing.
This model highlights urban growth through a natural expansion process. However, it assumes a monocentric city structure, which has been critiqued for its simplicity and lack of applicability in modern, polycentric cities.
b. Sector Theory (Hoyt Model)
Homer Hoyt developed the Sector Model in 1939 as an alternative to the Burgess Model. He argued that cities grow not in concentric rings but in sectors or wedges radiating out from the CBD. Certain types of development, such as high-end housing or industrial zones, expand along transportation routes or environmental corridors. This model emphasizes transportation’s role in shaping land-use patterns.
Key insights from the Hoyt model include:
Wealthier residential areas tend to develop outward from the city center in certain sectors, typically along major roads.
Industrial and working-class housing develops in other sectors, often near railways or ports.
Though a step forward from Burgess’ model, the Sector Theory also falls short in explaining complex, modern urban dynamics, such as the rise of mixed-use neighborhoods.
c. Multiple Nuclei Model (Harris and Ullman)
In 1945, Chauncy Harris and Edward Ullman proposed the Multiple Nuclei Model, suggesting that cities develop around multiple centers (nuclei) rather than a single core. These centers may serve different functions—some focusing on retail, others on manufacturing or residential uses—and often emerge around key transport nodes, industrial hubs, or large institutions (universities, hospitals).
Key features of this model include:
Polycentric Structure: Modern cities have multiple business centers, not just one dominant CBD.
Functional Specialization: Each nucleus has a specialized function (e.g., industrial, educational, commercial).
Land-Use Interdependency: Nuclei can influence land uses around them, creating clusters of similar activities.
The Multiple Nuclei Model is seen as more realistic than earlier models for explaining large, modern cities that are often decentralized and feature multiple economic or cultural hubs.
d. The Urban Realms Model (Vance)
Developed by James E. Vance Jr. in the 1960s, the Urban Realms Model offers a further evolution of polycentric development. Vance argued that cities are composed of several semi-autonomous “realms,” each with its own central business district and functional identity. These realms operate independently but are interconnected through infrastructure like highways and public transportation.
Features of the Urban Realms Model:
Self-Sufficient Suburbs: Urban areas no longer rely solely on the central city for employment and services.
Decentralized Growth: The rise of suburban business districts reduces the dominance of the main CBD.
Metropolitan Integration: Even as suburban realms become more self-sufficient, they remain integrated into a broader metropolitan system.
This model reflects the growing importance of suburbanization and highlights how modern metropolitan areas consist of diverse, decentralized zones with complex interdependencies.
Tabular Analysis of Conceptual Theories, Procedural Theories, and Land-use-based Theories
Aspect
Conceptual Theories
Procedural Theories
Land-use-based Theories
Definition
Theories that focus on the ideas, values, and principles guiding urban development. They explore the social, cultural, economic, and environmental ideals that underpin planning.
Theories that focus on the processes, techniques, and steps used in planning. They explore how decisions are made, who is involved, and how planning outcomes are achieved.
Theories that focus on the spatial organization of land and how different areas are designated for various uses (e.g., residential, commercial, industrial).
Focus
Broad philosophical and conceptual understanding of urban development and its goals.
The decision-making process and planning methodologies used in urban planning practice.
The allocation, regulation, and organization of physical land uses within urban areas.
Key Questions
– What should a city be like? – What values guide urban development?
– How should planning decisions be made? – What steps should be followed?
– How should land be used? – How can spatial organization create efficient, sustainable cities?
Purpose
Establishes the ideological framework and vision for urban development, focusing on social justice, environmental sustainability, and economic growth.
Ensures that planning is conducted in a structured and systematic way, often focusing on transparency, participation, and efficiency.
Aims to create functional, efficient, and sustainable cities through the strategic allocation of land for different activities.
Examples of Theories
– Rational Planning: Focuses on logical, data-driven decisions for the public good. – Advocacy Planning: Emphasizes planners representing marginalized groups. – Sustainable Development: Focuses on balancing economic, environmental, and social needs.
– Synoptic Planning: Follows a linear process of goal setting, data analysis, and evaluation. – Incrementalism: Decisions are made in small steps to adjust to change. – Collaborative Planning: Emphasizes stakeholder engagement and consensus-building.
– Concentric Zone Model: Urban areas grow outward in rings from a central core. – Multiple Nuclei Model: Cities develop around several specialized centers. – Smart Growth: Encourages compact, sustainable development with mixed land uses.
Decision-Making
Guided by overarching values, such as equity, justice, and sustainability, often abstract and normative.
Involves structured steps for decision-making, often focusing on rationality, stakeholder participation, and iterative processes.
Guided by geographic and economic considerations for the spatial organization of urban areas. Decision-making focuses on efficient land allocation.
Major Criticisms
– Too abstract and idealistic, difficult to translate into practical planning. – May lack consideration for implementation challenges.
– Can be overly procedural or technocratic, losing sight of broader urban goals. – Sometimes criticized for being slow or overly bureaucratic.
– Often assumes static patterns of land use. – May not account for socio-political dynamics affecting land development.
Methodology
Theoretical, value-driven approach focusing on qualitative aspects, often informed by sociology, economics, and environmental science.
Structured, step-by-step processes with a focus on quantitative and qualitative analysis, stakeholder input, and iterative reviews.
Spatial analysis of land, typically using GIS, zoning regulations, and urban models to designate areas for different uses.
Influence on Planning Practice
Provides guiding principles and ideals that inform the vision and goals of urban development.
Establishes frameworks and methods for how planners make decisions, engage stakeholders, and implement plans.
Provides practical frameworks for zoning, land-use designations, and spatial planning, directly influencing city layouts and regulations.
Strengths
– Encourages innovative, holistic thinking. – Focuses on long-term sustainability and equity.
– Structured and systematic, making planning predictable and transparent. – Emphasizes collaboration and adaptability.
-Practical and easy to adopt -Encourages regulation of unplanned growth.
References
Agarwal, S., & Sharma, S. N. (2014). Universal Design to Ensure Equitable Society. International Journal of Engineering and Technical Research (IJETR), 1.
Alexander, E. R. (2016). There is no planning—only planning practices: Notes for spatial planning theories. Planning theory, 15(1), 91-103.
Davy, B., Levin-Keitel, M., & Sielker, F. (2023). Plural planning theories: cherishing the diversity of planning. European Planning Studies, 31(11), 2267-2276.
Dehalwar, K., & Sharma, S. N. (2023). Fundamentals of Area Appreciation and Space Perceptions.
Fainstein, S. S. (2000). New directions in planning theory. Urban affairs review, 35(4), 451-478.
Faludi, A. (Ed.). (2013). A reader in planning theory (Vol. 5). Elsevier.
Friedmann, J. (2017). Two centuries of planning theory: An overview. Explorations in planning theory, 10-29.
Friedmann, J., & Hudson, B. (1974). Knowledge and action: A guide to planning theory. Journal of the American Institute of Planners, 40(1), 2-16.
Lawrence, D. P. (2000). Planning theories and environmental impact assessment. Environmental impact assessment review, 20(6), 607-625.
Sharma, S. N. (2014). Participatory Planning in Plan Preparation. BookCountry.
Sharma, S. N. (2019). Review of most used urban growth models. International Journal of Advanced Research in Engineering and Technology (IJARET), 10(3), 397-405.
The Centre for Science and Environment (CSE) is one of India’s leading public interest research and advocacy organizations. Founded in 1980 by noted environmentalist Anil Agarwal, CSE aims to promote sustainable development and advocate for environmental issues through a combination of research, education, and advocacy. Based in New Delhi, it has become a major force in raising awareness and driving policy changes in areas related to environmental protection, resource conservation, and social equity.
Key Objectives and Mission
CSE works with the primary goal of ensuring equitable, sustainable, and democratic growth. Its mission is to promote policies and practices that result in environmentally sound and socially just development. The organization’s work is grounded in the belief that the environment cannot be separated from the issues of development, poverty, and social justice.
The organization operates with the following broad objectives:
Research and Advocacy: Conduct in-depth research into various environmental issues and use findings to lobby for appropriate policy interventions.
Capacity Building: CSE focuses on building the capacity of government officials, communities, and organizations through training programs and information dissemination.
Public Awareness: It works to raise public awareness of critical environmental and developmental challenges, encouraging citizen action and participation.
Environmental Education: CSE plays a key role in educating students, professionals, and the general public on environmental concerns through books, reports, workshops, and online resources.
Major Areas of Focus
CSE’s work spans a variety of crucial environmental sectors, which include:
Air Pollution and Public Health: CSE has been at the forefront of campaigns for cleaner air, particularly in urban centers. The organization’s work has helped push for stricter emission standards for vehicles, promotion of public transport, and policies to reduce industrial emissions. Its notable efforts include pushing for the introduction of Compressed Natural Gas (CNG) in public transportation in Delhi, which was a game-changer in reducing urban air pollution.
Climate Change: Climate change is one of the organization’s core areas. CSE advocates for global climate justice, arguing that developing nations like India should not bear the same responsibilities as developed countries in terms of emissions reductions. CSE also promotes renewable energy and energy-efficient practices at the national and local levels.
Water Management: Water conservation and sustainable management of water resources are critical areas of CSE’s work. The organization is a strong advocate of rainwater harvesting, decentralized wastewater treatment, and watershed management. CSE has created several successful models that promote sustainable water use in urban and rural areas.
Sustainable Urban Development: CSE has been deeply involved in research and policy advocacy regarding sustainable urban growth. This includes work on urban mobility, waste management, and urban planning that integrates green infrastructure, affordable housing, and low-carbon technologies.
Waste Management: Waste management, including solid waste and hazardous waste, is a significant issue that CSE tackles through research and advocacy. The organization works on policies to improve waste segregation, composting, and recycling while advocating for policies that reduce the environmental impact of landfills and waste incineration.
Food Safety and Sustainable Agriculture: CSE has conducted extensive research on pesticides and chemicals used in agriculture, pushing for stricter food safety regulations. Its campaigns also focus on promoting organic farming, sustainable agricultural practices, and the reduction of chemical inputs in food production.
Environmental Education and Media: CSE believes in empowering the public with knowledge and thus runs multiple educational and awareness programs. It also publishes the well-known magazine Down to Earth, which covers various environmental and development issues in India and around the world.
Energy Efficiency and Renewable Energy: The organization promotes energy conservation through the adoption of renewable energy technologies, particularly in rural areas. CSE also advocates for policies that encourage the use of solar power, wind energy, and other sustainable energy sources.
Key Programs and Initiatives
CSE’s various programs have earned national and international recognition. Some of its flagship initiatives include:
Green Rating Project (GRP): This project assesses the environmental performance of major industrial sectors in India. The GRP has been instrumental in encouraging industries to adopt cleaner technologies and sustainable practices.
The Right to Clean Air Campaign: One of CSE’s most successful initiatives, the Right to Clean Air Campaign, was pivotal in reducing vehicular pollution in Delhi by pushing for the transition to CNG-powered public transport.
Water Program: CSE’s water program promotes sustainable water management strategies such as rainwater harvesting and wastewater recycling. The Jal Swaraj campaign, which focuses on decentralized water management in rural India, is one of its hallmark programs.
Sustainable Buildings Program: This program works to promote green buildings and sustainable construction practices in India. CSE advocates for energy-efficient buildings and supports policies to incorporate sustainability into the real estate sector.
Community and Capacity Building: CSE offers training programs for government officials, NGOs, and local communities, focusing on various aspects of environmental governance, including waste management, climate change, water conservation, and air quality monitoring.
Global Influence and Recognition
CSE’s work has extended beyond India’s borders, with the organization influencing international environmental discourse, particularly in the areas of climate justice and sustainable development. It is a regular participant in global climate change negotiations and other environmental policy forums.
In 2005, CSE’s founder Anil Agarwal was posthumously awarded the Padma Bhushan, one of India’s highest civilian awards, for his contributions to environmental protection. CSE has also received several awards, including the prestigious Stockholm Water Prize for its work on water management.
Final words
The Centre for Science and Environment plays a critical role in shaping environmental policy and practice in India. Through its rigorous research, advocacy, and public outreach, it has helped to influence government policy, promote sustainable development, and raise awareness on critical environmental issues. The organization continues to evolve in response to new environmental challenges, staying committed to its goal of creating an equitable and sustainable future.
Understanding how we perceive and appreciate the area and space around us is fundamental to numerous fields, including architecture, urban planning, psychology, and even art. Our ability to navigate, interact with, and interpret spaces plays a critical role in daily life, influencing everything from how we move through environments to how we experience aesthetic and functional qualities of designed spaces. In this article, we will delve into two key concepts—area appreciation and space perception—to understand how these elements shape human experience and environmental design.
1. Defining Area Appreciation and Space Perception
Area Appreciation
Area appreciation refers to an individual’s or a community’s recognition and valuation of a specific geographical or physical area. This appreciation can arise from multiple factors, including cultural significance, aesthetic value, functional utility, and emotional attachment. In essence, it is how people cognitively and emotionally connect with a particular area, whether it is a neighborhood, city block, or natural landscape.
Key factors that influence area appreciation:
Aesthetic Appeal: The beauty or attractiveness of an area can significantly impact its appreciation. Green spaces, architectural designs, and cultural landmarks often enhance aesthetic value.
Functional Value: Practical aspects like accessibility, infrastructure, and amenities (e.g., shops, schools, hospitals) contribute to an area’s functionality, increasing its appreciation.
Cultural and Historical Significance: Areas with deep cultural or historical roots often enjoy greater appreciation, as they foster a sense of identity and continuity.
Emotional and Psychological Attachment: An area may hold sentimental value for individuals due to personal history or experiences, enhancing their attachment and appreciation for the place.
Space Perception
Space perception is the cognitive process by which individuals understand and interpret their spatial surroundings. It involves the use of sensory information—visual, auditory, tactile, and even olfactory cues—to determine the size, distance, depth, and orientation of objects in relation to one another. Space perception is integral to how we move through, interact with, and mentally map our environment.
Key dimensions of space perception:
Depth Perception: The ability to perceive the world in three dimensions (3D) and judge the distance between objects.
Size and Scale: Estimating the size of objects or areas based on visual cues and comparing them to familiar objects.
Proximity and Spatial Relationships: Understanding how objects relate to each other in terms of distance and spatial arrangement.
Orientation and Navigation: Using landmarks, visual cues, and environmental information to orient oneself within a space and navigate it.
Space perception relies on multiple sensory inputs (visual, auditory, and kinesthetic), as well as the brain’s ability to synthesize and interpret these inputs to form a coherent understanding of the environment.
2. The Science Behind Space Perception
Visual Cues and Depth Perception
Visual information is the most significant input for perceiving space. The brain processes various visual cues to construct a 3D image of the world around us. Some of the essential cues include:
Binocular Cues: These arise from the slight difference between the images seen by each eye, also known as binocular disparity. The brain uses this disparity to estimate the depth and distance of objects.
Monocular Cues: When one eye is used, the brain still picks up clues such as relative size, texture gradient, linear perspective, and occlusion (one object partially blocking another) to infer depth and spatial relationships.
Motion Parallax: As you move, objects closer to you appear to move faster than objects farther away. This provides valuable information about the distance of objects.
Shadows and Light: Shadows, shading, and the play of light on surfaces help the brain understand the contours and depth of objects.
Auditory Cues
While vision plays the dominant role in space perception, auditory cues also contribute to spatial awareness. For instance, the direction, volume, and echoes of sound help us gauge the location of objects or events without directly seeing them.
Echo-location: The way sound waves reflect off surfaces gives us information about the space and distance of objects.
Binaural Hearing: Differences in the time and intensity of sounds arriving at each ear help the brain determine the direction and distance of sound sources.
Proprioception and Kinesthetic Awareness
Proprioception, or the awareness of body position and movement, complements space perception by helping us understand how our body moves through space. This internal sense is crucial for tasks like walking, grasping objects, and maintaining balance.
3. Cultural and Psychological Dimensions of Space Perception
Cultural Influences on Space Perception
Culture heavily influences how individuals perceive and use space. Different cultures have distinct norms related to personal space, spatial organization, and how space is used in social interactions.
Proxemics: The study of personal space in different cultures reveals varying comfort zones. For example, in some cultures, people stand closer together when communicating, while others maintain a larger distance.
Architecture and Spatial Design: Cultural traditions influence how buildings and public spaces are designed. In some cultures, open spaces and courtyards are valued, while others prioritize compartmentalized or enclosed environments.
Psychological and Emotional Dimensions
Space perception is not only a sensory or cognitive process but also an emotional and psychological one. Individuals’ moods, personalities, and experiences can all affect how they perceive space.
Crowdedness and Comfort: High-density environments can lead to feelings of discomfort or stress, while spacious areas often evoke relaxation.
Familiarity and Attachment: People tend to feel more comfortable in familiar spaces, and emotional bonds with a place can enhance perceptions of safety, comfort, and pleasure.
Anxiety and Claustrophobia: Some individuals may experience anxiety in confined spaces (claustrophobia) or large, open spaces (agoraphobia), illustrating how psychological states affect space perception.
4. The Role of Area Appreciation in Urban Planning and Design
Enhancing Quality of Life
Area appreciation is a crucial consideration in urban planning and design, as it directly impacts quality of life. Planners and architects seek to create spaces that balance functionality, aesthetics, and cultural relevance to foster a strong sense of community and belonging.
Green Spaces and Public Areas: Incorporating parks, plazas, and communal spaces can increase area appreciation by offering aesthetic value and social interaction opportunities.
Walkability and Accessibility: Designing areas that are pedestrian-friendly and well-connected to public transport enhances functional value and increases appreciation of the space.
Sustainability and Innovation: Environmentally conscious designs that prioritize sustainability and resilience to climate change often lead to a deeper appreciation of the area, aligning with modern values.
Place-Making and Identity
“Place-making” is the process of creating spaces that foster a strong sense of identity and community. Urban planners use place-making strategies to enhance area appreciation by reflecting the cultural, historical, and social fabric of a community.
Cultural Landmarks: Establishing monuments, public art, or historically significant structures in urban spaces can imbue areas with cultural meaning, enhancing appreciation.
Community Engagement: Involving local communities in the design and development of spaces can increase the emotional connection and collective ownership of the area.
5. Artistic Interpretation of Space Perception
Space in Art and Architecture
Artists and architects have long explored the concept of space perception to influence how viewers experience their work. Understanding how individuals perceive space allows creators to manipulate it for aesthetic or functional purposes.
Perspective in Art: Techniques like linear perspective and shading are used in visual art to create the illusion of depth and space on a 2D surface.
Architectural Design: Architects use space perception principles to design buildings that evoke particular emotions or behaviors. For example, high ceilings may inspire awe, while narrow corridors can create feelings of intimacy or constraint.
Virtual and Augmented Reality
Modern technology, such as virtual reality (VR) and augmented reality (AR), offers new avenues to explore space perception. These technologies allow users to experience spaces that may not physically exist or are distant, offering an immersive experience of virtual environments.
Conclusion
Area appreciation and space perception are essential elements in how humans interact with and interpret their environments. While area appreciation speaks to our emotional, cultural, and practical connection to specific locations, space perception involves the cognitive and sensory processes by which we navigate and understand those spaces. Both concepts are integral to fields like architecture, urban planning, psychology, and art, shaping our daily experiences and contributing to the richness of our environments. By understanding the mechanics and influences behind these processes, we can design spaces that enhance quality of life, foster emotional attachment, and reflect cultural identity.
References
Dehalwar, K., & Sharma, S. N. (2023). Fundamentals of Research Writing and Uses of Research Methodologies. Edupedia Publications Pvt Ltd.
Dehalwar, K. (Ed.). (2024). Basics of Research Methodology-Writing and Publication. EduPedia Publications Pvt Ltd.
Dehalwar, K., & Sharma, S. N. (2023). Fundamentals of Area Appreciation and Space Perceptions.
Hamilton, W. G. (1977). Landscape appreciation: Utilizing sense of place themes in college geography. Journal of Geography, 76(5), 175-179.
Hofstede, H., Salemink, K., & Haartsen, T. (2022). The appreciation of rural areas and their contribution to young adults’ staying expectations. Journal of Rural Studies, 95, 148-159.
Jia, J., Zhang, X., Huang, C., & Luan, H. (2022). Multiscale analysis of human social sensing of urban appearance and its effects on house price appreciation in Wuhan, China. Sustainable Cities and Society, 81, 103844.
Kumar, G., Vyas, S., Sharma, S. N., & Dehalwar, K. (2023). Planning and Development of Housing in Urban Fringe Area: Case of Bhopal (MP). GIS Business, 18(1), 1-14.
Sharma, S. N., & Dehalwar, K. (2023). Fundamentals of Planning and Design of Housing.
SOUAYAH, H. (2022). The notion of appreciation in space design’s approach: from conception to reception and perception. International Design Journal, 12(2), 343-347.
Swensen, G., & Sæter, O. (2011). The mall method: Applied in a study of inhabitants’ appreciation of urban cultural heritage areas. International Journal of Qualitative Methods, 10(2), 125-139.
Traffic signal coordination is a critical aspect of urban traffic management, aimed at optimizing the flow of vehicles and reducing congestion at intersections. By synchronizing traffic signals, cities can improve the efficiency of road networks, enhance safety, and minimize delays for drivers and pedestrians. This article explores the principles of traffic signal coordination, its benefits, the technologies involved, and best practices for effective implementation.
Principles of Traffic Signal Coordination
Traffic signal coordination involves the strategic timing of traffic lights to ensure smooth vehicle flow and reduce stoppage time. The key principles include:
Green Wave: This concept involves synchronizing traffic signals along a corridor so that vehicles traveling at a certain speed experience a series of green lights, minimizing stops and starts. The goal is to create a “green wave” that allows vehicles to move smoothly through a series of intersections.
Cycle Time: Each traffic signal operates on a cycle that includes green, yellow, and red phases. Coordination involves optimizing the length of these cycles to balance the needs of different traffic movements and reduce overall delay.
Phase Timing: Coordinating the duration of green, yellow, and red phases to align with traffic demands. This involves adjusting signal phases to accommodate peak traffic periods and minimize delays.
Coordination Across Intersections: Effective coordination requires managing multiple intersections along a corridor to ensure that traffic flows smoothly without unnecessary stops. This involves considering the traffic patterns, volume, and intersection layout.
Benefits of Traffic Signal Coordination
Reduced Congestion: By synchronizing traffic signals, vehicles can travel more efficiently through intersections, reducing the likelihood of traffic jams and congestion. This can lead to smoother traffic flow along major corridors and decrease overall travel time.
Decreased Emissions: Reduced idling time at traffic signals lowers vehicle emissions, contributing to better air quality. Fewer stops and starts mean less fuel consumption and lower greenhouse gas emissions.
Improved Safety: Coordinated signals can reduce the number of accidents caused by sudden stops or conflicting traffic movements. Predictable traffic flow and fewer red-light violations contribute to enhanced safety at intersections.
Increased Efficiency: Efficient traffic signal coordination improves the overall efficiency of the road network. This benefits not only private vehicles but also public transportation systems, emergency vehicles, and freight movements.
Enhanced Pedestrian Experience: Coordination can also improve pedestrian safety by ensuring adequate crossing times and reducing the frequency of conflicts between pedestrians and vehicles.
Technologies for Traffic Signal Coordination
Adaptive Signal Control Systems (ASCS): These systems adjust traffic signal timing in real-time based on current traffic conditions. They use sensors, cameras, and data analytics to optimize signal phases and adapt to changing traffic volumes.
Traffic Management Centers (TMCs): TMCs centralize traffic data collection and control. They use advanced software to monitor traffic conditions, manage signal timings, and coordinate signals across multiple intersections.
Vehicle-to-Infrastructure (V2I) Communication: This technology allows vehicles to communicate with traffic signals, providing real-time information on signal status and optimizing traffic flow based on vehicle positions.
Signal Preemption and Priority Systems: These systems allow for priority signaling for emergency vehicles and public transportation, ensuring that they can navigate through intersections more efficiently without disrupting overall traffic flow.
Traffic Flow Modeling Software: Modeling software simulates traffic flow and evaluates the impact of different signal timings and coordination strategies. It helps planners and engineers design effective coordination schemes and predict their outcomes.
Best Practices for Traffic Signal Coordination
Data Collection and Analysis: Collecting accurate traffic data is crucial for effective signal coordination. This includes traffic volume, flow patterns, and peak hours. Analyzing this data helps in designing optimal signal timings and coordination strategies.
Public Involvement: Engaging with the public and stakeholders is important for understanding local traffic patterns and concerns. Public feedback can help in refining signal coordination strategies to better meet community needs.
Phased Implementation: Implementing traffic signal coordination in phases allows for testing and adjusting strategies before full-scale deployment. This approach helps in identifying issues and making necessary adjustments.
Continuous Monitoring and Adjustment: Traffic conditions are dynamic, so ongoing monitoring and adjustments are essential. Regularly reviewing signal performance and making data-driven adjustments ensures that coordination remains effective.
Integration with Other Traffic Management Strategies: Coordinated signals should be integrated with other traffic management strategies, such as congestion pricing, traffic flow optimization, and public transportation improvements. This holistic approach enhances overall traffic management.
Training and Capacity Building: Ensuring that traffic management personnel are trained in the latest technologies and best practices is crucial for effective signal coordination. Investing in professional development helps maintain high standards in traffic management.
Case Studies
Los Angeles, California: Los Angeles has implemented the Advanced Traffic Signal Control (ATSC) system to manage its extensive road network. The system uses real-time traffic data to adjust signal timings and reduce congestion along major corridors.
Singapore: Singapore’s Integrated Traffic Management System includes adaptive signal control and real-time traffic monitoring. The system adjusts signal timings based on traffic conditions and integrates with other traffic management measures, such as congestion pricing.
London, United Kingdom: London’s UTC (Urban Traffic Control) system coordinates traffic signals across the city, optimizing traffic flow and reducing delays. The system uses data from sensors and cameras to adjust signal timings and manage traffic congestion.
Challenges and Considerations
Complexity of Implementation: Coordinating signals across multiple intersections and corridors can be complex, requiring sophisticated technology and detailed planning.
Cost: Implementing and maintaining advanced signal control systems can be costly. Budget constraints may limit the scope of coordination efforts.
Technological Integration: Integrating new technologies with existing traffic management infrastructure can be challenging. Ensuring compatibility and seamless operation is essential for success.
Public Acceptance: Changes to traffic signal timings can impact drivers and pedestrians. Clear communication and public outreach are important for gaining acceptance and understanding of the benefits.
Conclusion
Traffic signal coordination is a powerful tool for improving traffic flow, reducing congestion, and enhancing overall road network efficiency. By employing advanced technologies, following best practices, and addressing challenges, cities can create more effective and sustainable traffic management systems. The benefits of well-coordinated traffic signals extend beyond reducing travel time and emissions; they contribute to safer, more livable urban environments. As urban areas continue to grow, investing in and optimizing traffic signal coordination will play a crucial role in managing the complexities of modern transportation systems.
References
Bazzan, A. L. (2005). A distributed approach for coordination of traffic signal agents. Autonomous Agents and Multi-Agent Systems, 10, 131-164.
Dehalwar, K., & Sharma, S. N. (2023). Fundamentals of Area Appreciation and Space Perceptions.
He, Q., Head, K. L., & Ding, J. (2014). Multi-modal traffic signal control with priority, signal actuation and coordination. Transportation research part C: emerging technologies, 46, 65-82.
Kang, W., Xiong, G., Lv, Y., Dong, X., Zhu, F., & Kong, Q. (2014, October). Traffic signal coordination for emergency vehicles. In 17th international IEEE conference on intelligent transportation systems (itsc) (pp. 157-161). IEEE.
Kushwah, N., Natariy, R., & Jaiswal, A. (2015). Traffic signal coordination for effective flow of traffic: a review. Int J Sci Res Dev, 3, 1803-1806.
Lodhi, A. S., Jaiswal, A., & Sharma, S. N. (2023). An Investigation into the Recent Developments in Intelligent Transport System. In Proceedings of the Eastern Asia Society for Transportation Studies (Vol. 14).
Xiang, J., & Chen, Z. (2016). An adaptive traffic signal coordination optimization method based on vehicle-to-infrastructure communication. Cluster Computing, 19(3), 1503-1514.
Sharma, S. N., & Abhishek, K. (2015). Planning Issue in Roorkee Town. Journal for Studies in Planning and Management.
Urban congestion is a pressing issue in many cities around the globe, contributing to environmental degradation, diminished quality of life, and economic inefficiencies. As cities continue to grow, the challenge of managing traffic congestion becomes increasingly complex. One promising approach to mitigating these issues is Sustainable Transit-Oriented Development (TOD). TOD focuses on creating vibrant, walkable communities centered around efficient transit systems, offering a multifaceted solution to congestion. This article explores the principles of TOD, its benefits, and how it can address urban congestion effectively.
Understanding Transit-Oriented Development
Transit-Oriented Development is a planning and design strategy that emphasizes high-density, mixed-use development around public transit stations. The goal is to create environments where people can live, work, and play without relying heavily on personal vehicles. TOD integrates several key elements:
High-Density Development: TOD promotes denser, more compact development near transit hubs. By concentrating people and activities in these areas, TOD reduces the distance people need to travel, thereby decreasing reliance on cars.
Mixed-Use Zoning: TOD encourages the development of residential, commercial, and recreational spaces in close proximity. This mix of uses supports a vibrant, active community where residents have easy access to amenities and services.
Pedestrian-Friendly Design: TOD emphasizes walkability, with well-designed streetscapes, pedestrian pathways, and safe crossings. This design reduces the need for short car trips, which are often inefficient and contribute to congestion.
Efficient Transit Systems: At the core of TOD is a robust transit network that provides frequent, reliable service. This might include trains, buses, trams, or ferries that connect people to key destinations efficiently.
Sustainable Practices: TOD incorporates green building practices, energy-efficient infrastructure, and environmental conservation. Sustainable development reduces the carbon footprint of urban areas and enhances overall livability.
Benefits of Transit-Oriented Development
Reduction in Traffic Congestion: By providing viable alternatives to car travel and reducing the need for long commutes, TOD can significantly decrease the volume of vehicles on the road. This leads to less congestion and smoother traffic flow.
Environmental Impact: TOD reduces greenhouse gas emissions by promoting the use of public transit and encouraging walking and cycling. Additionally, compact development lowers the urban sprawl, preserving natural landscapes and reducing habitat destruction.
Economic Advantages: High-density development increases property values and generates greater revenue for municipalities through property taxes. Businesses benefit from higher foot traffic, and investments in transit infrastructure can lead to long-term economic growth.
Enhanced Quality of Life: TOD fosters vibrant communities with easy access to amenities, cultural attractions, and recreational opportunities. This increases overall quality of life by reducing travel time, lowering stress, and enhancing social interactions.
Health Benefits: Encouraging walking and cycling promotes physical activity, which can improve public health outcomes. Reduced vehicle emissions also contribute to better air quality, further benefiting health.
Implementing Successful TOD
Planning and Zoning: Effective TOD requires careful planning and zoning regulations that support high-density and mixed-use development. Planners need to balance growth with infrastructure capacity and ensure that land use policies align with TOD principles.
Community Engagement: Engaging with the community is crucial for the success of TOD projects. Public input helps address concerns, tailor developments to local needs, and build support for transit initiatives.
Investment in Infrastructure: Successful TOD relies on well-developed transit infrastructure. Governments and private stakeholders must invest in transit systems, including stations, routes, and amenities, to ensure they meet the demands of growing populations.
Integration with Existing Systems: TOD should complement and enhance existing transportation networks. Integrating new developments with current transit systems can maximize the benefits and ensure a seamless experience for users.
Policy Support: Strong policy frameworks and incentives are essential for promoting TOD. Governments can support TOD through grants, tax incentives, and supportive legislation that encourages sustainable development practices.
Case Studies
Portland, Oregon: Portland is renowned for its successful TOD initiatives. The city has integrated light rail lines with mixed-use developments, creating vibrant neighborhoods around transit stations. The Portland Streetcar and MAX Light Rail are pivotal in reducing congestion and supporting local businesses.
Hong Kong: Hong Kong’s TOD model is characterized by its extensive and efficient transit system, which is intricately linked with high-density development. The city’s integration of transit with residential and commercial spaces has helped manage congestion effectively and promote sustainable urban living.
Copenhagen, Denmark: Copenhagen is a leader in sustainable transit planning, with its focus on cycling infrastructure and public transit. The city’s TOD strategies include bike-friendly streets and efficient transit options that reduce reliance on cars and alleviate congestion.
Challenges and Considerations
Despite its benefits, TOD faces challenges that need to be addressed:
Funding and Investment: Securing funding for transit infrastructure and development can be challenging. Public-private partnerships and innovative financing mechanisms can help overcome this hurdle.
Gentrification: High-density development can lead to increased property values, which may result in the displacement of lower-income residents. Ensuring affordable housing options and inclusive planning can mitigate this issue.
Integration with Existing Urban Fabric: Implementing TOD in established urban areas requires careful planning to integrate new developments with existing infrastructure and communities.
Long-Term Sustainability: TOD projects need to be designed with long-term sustainability in mind, considering future growth, changing transportation needs, and evolving environmental conditions.
Conclusion
Sustainable Transit-Oriented Development offers a compelling solution to urban congestion by promoting high-density, mixed-use communities centered around efficient transit systems. By reducing reliance on personal vehicles, enhancing walkability, and investing in sustainable practices, TOD can alleviate congestion, improve environmental outcomes, and enhance quality of life. As cities continue to grow, adopting TOD principles can help create more livable, sustainable urban environments and address one of the most pressing challenges of modern urban life.
References
Cervero, R., & Sullivan, C. (2011). Green TODs: marrying transit-oriented development and green urbanism. International journal of sustainable development & world ecology, 18(3), 210-218.
Dehalwar, K., & Sharma, S. N. (2023). Fundamentals of Area Appreciation and Space Perceptions.
Ibraeva, A., de Almeida Correia, G. H., Silva, C., & Antunes, A. P. (2020). Transit-oriented development: A review of research achievements and challenges. Transportation Research Part A: Policy and Practice, 132, 110-130.
Jaiswal, A., Rathore, K., & Jain, D. (2012). Sustainable transit oriented development: solving congestion problem at Delhi. OIDA International Journal of Sustainable Development, 3(8), 59-68.
Liang, Y., Du, M., Wang, X., & Xu, X. (2020). Planning for urban life: A new approach of sustainable land use plan based on transit-oriented development. Evaluation and program planning, 80, 101811.
Loo, B. P., & du Verle, F. (2017). Transit-oriented development in future cities: towards a two-level sustainable mobility strategy. International Journal of Urban Sciences, 21(sup1), 54-67.
Ma, X., Chen, X., Li, X., Ding, C., & Wang, Y. (2018). Sustainable station-level planning: An integrated transport and land use design model for transit-oriented development. Journal of Cleaner Production, 170, 1052-1063.
Sharma, S. N. (2019). Review of most used urban growth models. International Journal of Advanced Research in Engineering and Technology (IJARET), 10(3), 397-405.
Sharma, S. N., & Dehalwar, K. (2023). Fundamentals of Planning and Design of Housing.
Sharma, S. N., Kumar, A., & Dehalwar, K. (2024). The Precursors of Transit-oriented Development. EPW Economic & Political Weekly, 59(16), 14.
Textual analysis is a research method used to interpret and analyze the content of written, spoken, or visual communication. It aims to explore how meaning is constructed and conveyed through texts. The method is widely employed in fields such as literature, media studies, communication, linguistics, and social sciences. By examining the underlying structure, themes, and patterns of a text, textual analysis helps researchers understand the relationships between language, meaning, and culture.
Definition and Purpose of Textual Analysis
Textual analysis involves a systematic examination of a text’s content, context, and form. A text, in this sense, can be anything that communicates meaning—whether it is a written document, a speech, an image, or a media production. The purpose of textual analysis is to uncover how these forms of communication convey particular meanings, ideologies, and cultural values to an audience. Researchers conducting textual analysis examine not only what the text says, but also how it says it and the potential interpretations that readers or viewers might have.
Textual analysis is a research method used to interpret and understand the meaning, themes, and structure of a text. This method is commonly used in disciplines such as literature, media studies, communication, cultural studies, and social sciences to analyze written, visual, or audio texts. Textual analysis allows researchers to critically examine how texts communicate messages, represent ideas, and influence society.
Definition and Purpose
Textual analysis is the process of closely reading a text to uncover its underlying meanings, ideologies, and assumptions. The text in question can be anything that communicates information, including written documents (e.g., books, articles, speeches), visual materials (e.g., advertisements, films, photographs), or oral communication (e.g., interviews, broadcasts).
The purpose of textual analysis is to dissect how a text conveys its message, paying attention to elements such as language, tone, symbolism, structure, and context. Through this method, researchers can reveal the deeper meaning behind a text, how it reflects or shapes culture, and the power relations embedded within it.
Types of Textual Analysis
There are various approaches to textual analysis, each with its unique focus and methodology. Some of the most prominent methods include:
Content Analysis: Content analysis focuses on the quantitative aspect of text. It involves counting the frequency of certain words, phrases, themes, or images to identify patterns within the text. This method is often used in media studies to analyze how often particular themes (e.g., gender roles, political ideologies) are present in news articles, films, or advertisements.
Discourse Analysis: Discourse analysis examines how language is used in a text to create meaning and convey power dynamics. It explores the social and political context of language use, examining how certain groups or ideologies are represented, constructed, or marginalized in the text. This method is often used in analyzing political speeches, news media, or institutional communication.
Narrative Analysis: Narrative analysis focuses on the structure and storytelling elements of a text. It studies how a text is organized, the progression of its plot, and how characters, events, and themes are developed. This method is particularly useful for analyzing novels, films, and other forms of storytelling to understand the impact of narrative choices on the audience.
Semiotic Analysis: Semiotics is the study of signs and symbols within a text and how they create meaning. Semiotic analysis focuses on how visual and linguistic signs (e.g., colors, logos, images, language) in a text are used to communicate messages. It is often used in analyzing advertisements, films, and other media that rely on symbolic communication.
Steps in Conducting Textual Analysis
Conducting textual analysis involves several key steps:
Identifying the Text: The first step is selecting the text to be analyzed. The text should be relevant to the research question and provide sufficient content for analysis. Depending on the research field, the text could be a book, film, advertisement, speech, or news article.
Defining Research Questions: Researchers must establish specific research questions or objectives that guide the analysis. These questions might focus on understanding how a particular theme is represented, uncovering ideological assumptions, or analyzing the role of language in shaping perceptions.
Close Reading of the Text: Textual analysis requires a close reading of the text to examine its structure, language, and other relevant features. Researchers should pay attention to recurring themes, metaphors, tone, and narrative techniques. The goal is to identify patterns or anomalies that reveal how the text constructs meaning.
Contextualizing the Text: Understanding the context in which the text was produced and consumed is crucial for textual analysis. Researchers must consider historical, social, cultural, and political factors that influence the text’s production and reception. This helps to uncover the underlying ideologies and messages within the text.
Interpreting and Analyzing: Once the text has been closely examined and contextualized, researchers interpret the findings, drawing connections between the text’s elements and its broader meaning. They explore how the text aligns with or challenges social norms, conveys particular ideologies, or engages with specific audiences.
Conclusion and Presentation: Finally, researchers draw conclusions about their analysis, linking the text’s internal features to its broader cultural or social significance. The results of the analysis are then presented in a coherent and structured format, whether as an academic paper, report, or presentation.
Advantages of Textual Analysis
Insight into Cultural Representation: Textual analysis helps reveal how texts shape or reflect cultural norms, values, and ideologies. It provides insights into how power, gender, race, and other social categories are constructed and portrayed in texts.
Flexibility Across Disciplines: Textual analysis is a versatile method used across various disciplines, from literature and media studies to sociology and political science. It can be applied to a wide range of texts, making it a valuable tool for interdisciplinary research.
Revealing Ideological Assumptions: Textual analysis uncovers the ideological assumptions embedded in texts, which may not be immediately apparent. It helps to deconstruct dominant narratives and power relations, providing a deeper understanding of social and political dynamics.
Limitations of Textual Analysis
Subjectivity: One of the key limitations of textual analysis is its inherent subjectivity. Since the analysis is interpretive, different researchers might draw different conclusions from the same text. This makes it important for analysts to provide clear justifications for their interpretations.
Limited Generalizability: Textual analysis often focuses on a single text or a small sample of texts, which can limit its generalizability. The findings from analyzing one text may not necessarily apply to others, especially when dealing with texts from different cultural or historical contexts.
Conclusion
The textual analysis method is a powerful tool for understanding how texts communicate meaning, shape ideologies, and influence society. It enables researchers to delve into the layers of language, symbols, and narratives, uncovering hidden meanings and broader social implications. Despite its challenges, textual analysis remains an essential method in various academic disciplines, providing valuable insights into the complex interplay between text and context.
References
Burrows, J. (2004). Textual analysis. A companion to digital humanities, 323-347.
Belsey, C. (2013). Textual analysis as a research method. Research methods for English studies, 2, 160-178.
Carley, K. (1994). Extracting culture through textual analysis. Poetics, 22(4), 291-312.
Chung, C. K., & Pennebaker, J. W. (2018). Textual analysis. In Measurement in social psychology (pp. 153-173). Routledge.
Dehalwar, K., & Sharma, S. N. (2023). Fundamentals of Research Writing and Uses of Research Methodologies. Edupedia Publications Pvt Ltd.
Dehalwar, K., & Sharma, S. N. (2024). Politics in the Name of Women’s Reservation. Contemporary Voice of Dalit, 2455328X241262562.
Van Dormolen, J. (1986). Textual analysis. In Perspectives on mathematics education: Papers submitted by members of the Bacomet group (pp. 141-171). Dordrecht: Springer Netherlands.
Sharma, S. N. (2023). Understanding Citations: A Crucial Element of Academic Writing.
Sharma, S. N. Techniques of Meta-Analysis for Unlocking Knowledge.
Every year, we come together on September 5th to celebrate Teachers’ Day, a day dedicated to recognizing and honoring the contributions of educators. It’s a time when students and communities express their gratitude to the individuals who play a crucial role in shaping young minds and building the future. In India, this day holds special significance as it marks the birth anniversary of Dr. Sarvepalli Radhakrishnan, an eminent philosopher and the second President of India, who believed in the power of education and the importance of teachers in society.
Why Teachers’ Day is Important
Teachers’ Day serves as a reminder of the profound impact that teachers have on both individuals and society. Teachers are more than just instructors; they are mentors, guides, and role models who nurture students’ intellectual, emotional, and social development. They inspire curiosity, foster creativity, and ignite the spark of learning. The lessons they impart often extend beyond textbooks, shaping how students view the world and their role in it.
The importance of teachers goes beyond the classroom walls. They lay the foundation for a productive, informed, and ethical society by helping students develop critical thinking skills, empathy, and resilience. Teachers provide the tools students need to succeed in life, preparing them for a world that is constantly evolving.
Dr. Sarvepalli Radhakrishnan: The Man Behind the Day
Teachers’ Day in India holds a special meaning because of Dr. Sarvepalli Radhakrishnan’s legacy. When his students expressed a desire to celebrate his birthday, he requested that the day be dedicated to honoring all teachers instead. This humble gesture by one of India’s most respected educators set the tone for what the day represents — a tribute to all those who dedicate their lives to teaching.
Dr. Radhakrishnan, known for his wisdom and advocacy of education, believed that teachers are the true architects of society. He viewed education as the key to national development, and teachers as the driving force behind shaping a nation’s character and future.
The Role of Teachers in a Changing World
The role of teachers has evolved significantly in recent years. In today’s fast-paced, technology-driven world, teachers are tasked with much more than imparting knowledge. They must also equip students with the skills to navigate an increasingly complex and interconnected global landscape. From digital literacy to critical thinking and emotional intelligence, today’s educators are preparing students for challenges that are still unfolding.
At the same time, teachers must balance the traditional role of fostering personal growth and values. They help students develop into compassionate, responsible individuals who contribute positively to society. Teachers often serve as role models, exemplifying integrity, perseverance, and the importance of lifelong learning.
Challenges Faced by Educators
Despite the vital role they play, teachers face numerous challenges. In many parts of the world, especially in rural or underfunded regions, teachers struggle with a lack of resources. Classrooms may be overcrowded, teaching materials limited, and infrastructure inadequate. These conditions make it difficult for educators to provide the quality education that every student deserves.
Moreover, teachers often face societal pressure and expectations that go beyond the scope of their profession. They are expected to play multiple roles—educator, counselor, disciplinarian, and sometimes even caregiver—while often receiving limited recognition or support. This imbalance can lead to burnout and demotivation, making it crucial for societies to provide better working conditions and support for their educators.
The COVID-19 pandemic further underscored these challenges. With the sudden shift to online learning, teachers had to quickly adapt to new methods of instruction while ensuring that students remained engaged and motivated. Despite these unprecedented challenges, teachers around the world rose to the occasion, demonstrating their resilience and commitment to education.
Teachers’ Day Celebrations
On Teachers’ Day, students across India participate in a variety of activities to show appreciation for their teachers. Schools and colleges often organize cultural events, speeches, and performances. It’s common for students to take on the role of teachers for the day, conducting classes and gaining firsthand experience of the challenges and rewards of the teaching profession. This tradition helps students develop a deeper respect for the hard work their teachers do every day.
For teachers, this day is a special opportunity to reflect on their journey, celebrate their achievements, and feel the appreciation from their students. Many schools also use this day to recognize exceptional educators with awards and honors, highlighting their contributions to the field of education.
Teachers’ Day Around the World
While the date and traditions of Teachers’ Day vary across countries, the sentiment remains universal. The recognition of teachers as key figures in shaping the future is acknowledged worldwide. For instance, World Teachers’ Day is celebrated on October 5th globally, under the banner of UNESCO. This international celebration emphasizes the need for better working conditions, training, and recognition for teachers everywhere.
In countries like China, the United States, and Brazil, Teachers’ Day is marked with ceremonies, tributes, and public acknowledgments of the importance of educators. These celebrations highlight the global appreciation for the vital work teachers do, despite the different challenges and educational systems around the world.
Conclusion
Teachers’ Day is not just about celebrating one day out of the year. It is about recognizing the ongoing, invaluable contributions that teachers make every day. Their work has a ripple effect, influencing not only the lives of individual students but also shaping the future of entire communities and nations.
As we celebrate Teachers’ Day, let us remember the challenges teachers face and the support they need to continue doing their essential work. Teachers deserve our respect, appreciation, and above all, the resources to provide every student with the best possible education. They are, without a doubt, the pillars of society, and their influence extends far beyond the walls of the classroom.
References
Ford, C. E. (1984). The influence of speech variety on teachers’ evaluation of students with comparable academic ability. TESOL quarterly, 18(1), 25-40.
Giridhar, S. (2019). Ordinary people, extraordinary teachers: The heroes of real India. Westland.
Hunter, E. J., Bottalico, P., Graetzer, S., Leishman, T. W., Berardi, M. L., Eyring, N. G., … & Whiting, J. K. (2015). Teachers and teaching: speech production accommodations due to changes in the acoustic environment. Energy procedia, 78, 3102-3107.
Jónsdottir, V., Rantala, L., Laukkanen, A. M., & Vilkman, E. (2001). Effects of sound amplification on teachers’ speech while teaching. Logopedics Phoniatrics Vocology, 26(3), 118-123.
Kingdon, G. G., & Sipahimalani-Rao, V. (2010). Para-teachers in India: Status and impact. Economic and Political weekly, 59-67.
🌍 Unlock the Foundations of Urban and Regional Planning!
Dive into the essential theories that shape our cities and communities with our comprehensive Planning Theory Lectures. Whether you’re a student, a professional, or just curious about the intricacies of planning, these lectures are your gateway to understanding the principles that guide urban development.
📚 What You’ll Get:
In-Depth PowerPoints: Visually rich slides that break down complex concepts into digestible insights.
Detailed PDFs: Comprehensive documents that provide a deeper exploration of planning theories, perfect for study and reference.
🛠️ Key Topics Covered:
Evolution of Planning Theories
Rational Planning Model
Advocacy and Equity Planning
Sustainable Development and Planning
Critical Urban Theory
👨🏫 Learn from the Best: Our expertly curated content is designed to enhance your knowledge, inspire critical thinking, and equip you with the tools to apply theory to practice.
Don’t miss out on this opportunity to elevate your understanding of urban and regional planning. Download your lectures today and start planning for a better tomorrow!
Reading research papers effectively is crucial for writing a comprehensive and insightful review paper. Here’s a step-by-step guide to help you navigate through research papers and synthesize the information for your review:
1. Understand the Purpose of a Review Paper
A review paper synthesizes existing research on a specific topic, identifies trends, gaps, and inconsistencies, and often suggests future research directions.
Your goal is to provide a comprehensive summary and critical analysis of the literature, not just a list of findings.
2. Identify the Core Literature
Search for Relevant Papers: Use academic databases like PubMed, Google Scholar, Scopus, and Web of Science to find relevant papers. Keywords and citations from seminal papers can guide you.
Select Core Papers: Focus on highly cited papers, recent studies, and seminal works that are central to your topic. These will form the backbone of your review.
3. Skim the Papers for Relevance
Read the Abstract: Start with the abstract to get an overview of the paper’s objectives, methods, results, and conclusions. This helps determine if the paper is relevant to your review.
Check the Introduction and Conclusion: The introduction provides context and background, while the conclusion summarizes the key findings. These sections help you quickly assess the paper’s significance.
4. Read the Paper in Detail
Introduction: Understand the research question, objectives, and hypothesis. This will help you frame your review within the existing literature.
Methods: Review the methodology to understand how the research was conducted. This is crucial for assessing the validity of the results.
Results: Focus on the data presented, tables, and figures. Take notes on key findings, but be cautious about drawing conclusions based solely on this section.
Discussion/Conclusion: This section provides the authors’ interpretation of the results, their significance, and how they fit into the broader context of the field.
References: Scan the references for additional papers that might be relevant to your review.
5. Take Structured Notes
Summarize Key Points: For each paper, note down the research question, methods, key findings, strengths, weaknesses, and how it contributes to the field.
Identify Themes: Look for recurring themes, theories, methods, or findings across multiple papers. These will help you structure your review.
Highlight Gaps: Identify areas where research is lacking or where findings are contradictory. These gaps often suggest opportunities for future research.
6. Organize Your Notes and Synthesize Information
Create a Thematic Outline: Organize your notes into themes or subtopics. This will form the structure of your review paper.
Synthesize, Don’t Summarize: Instead of simply summarizing each paper, synthesize the information by discussing how different studies relate to each other. Compare and contrast their findings, methods, and implications.
Develop a Critical Perspective: Assess the strengths and weaknesses of the studies you’ve reviewed. Consider the robustness of the methodologies, the significance of the findings, and the reliability of the conclusions.
7. Write the Review Paper
Introduction: Introduce the topic, explain its significance, and outline the scope of your review. Mention the key themes or issues you’ll address.
Main Body: Organize this section according to themes, methodologies, or chronological order. For each theme, discuss the relevant literature, highlight key findings, and provide critical analysis.
Conclusion: Summarize the main insights from the review, highlight the gaps in the literature, and suggest directions for future research.
References: Include a comprehensive list of all the papers you’ve cited in your review.
8. Revise and Proofread
Check for Coherence: Ensure that your review flows logically from one section to the next and that your analysis is cohesive.
Edit for Clarity and Conciseness: Ensure that your writing is clear, concise, and free of jargon.
Verify References: Double-check that all citations are accurate and that your reference list is complete.
9. Seek Feedback
Peer Review: Share your draft with colleagues or mentors for feedback. They can provide valuable insights on the clarity, coherence, and comprehensiveness of your review.
Revise Based on Feedback: Incorporate the feedback and refine your paper before final submission.
Conclusion
Reading research papers for writing a review requires a systematic approach to identifying, analyzing, and synthesizing information. By carefully selecting relevant literature, taking structured notes, and critically engaging with the content, you can produce a review paper that provides valuable insights into the current state of research on your chosen topic.
References
Adler, M. J., & Van Doren, C. (1972). How to read a book. Simon and Schuster.
Dehaene, S. (2010). Reading in the brain: The new science of how we read. Penguin.
Dehalwar, K., & Sharma, S. N. (2023). Fundamentals of Research Writing and Uses of Research Methodologies. Edupedia Publications Pvt Ltd.
Eagleton, T. (2011). How to read a poem. John Wiley & Sons.
Ellet, W. (2007). The case study handbook: How to read, discuss, and write persuasively about cases. Harvard Business Press.
Rolston, D. L. (Ed.). (1990). How to read the Chinese novel. Princeton University Press.
Sharma, S. N. Techniques of Meta-Analysis for Unlocking Knowledge.
Sharma, S. N. How to Write a Grant Proposal in an Effective Manner to get Projects.
The Altmetric Attention Score, or Altmetric, is a weighted count of how much attention an article has received from non-traditional sources. It’s calculated using an automated algorithm that considers three main factors:
Volume: The more people mention the article, the higher the score.
Sources: Each type of mention contributes a different amount to the score. For example, a news article is worth more than a tweet.
Author: The author of a post is important, too. For example, a post from a doctor that’s followed by other doctors will contribute more than an automated post from a journal.
Altmetrics can be an early indicator of an article’s potential impact. They can also help get work noticed, which may lead to citations.
Altmetrics tracks engagement with research as it’s shared, mentioned, reviewed, and read online. The Altmetric Details Page can show a demographics map of the locations of users who have mentioned or saved the research on Twitter or Mendeley.
The Altmetric Attention Score is a metric designed to measure the attention that a research output, such as a journal article, receives online. Unlike traditional citation metrics, which focus on academic citations, the Altmetric Attention Score considers a wider range of indicators, including social media mentions, news articles, policy documents, blogs, and other platforms where research can be discussed and disseminated. Here’s a detailed overview of how it works and what it represents:
1. Purpose of the Altmetric Attention Score
Broad Reach Measurement: The score aims to provide a more comprehensive picture of the influence and reach of research beyond academia.
Immediate Impact: It helps track the immediate impact and public interest in research soon after publication, unlike citations that accumulate over longer periods.
2. Components of the Score
The score is based on various sources that mention or link to a research output. These sources include:
Social Media: Platforms like Twitter (now X), Facebook, LinkedIn, and others.
News Outlets: Online news articles that mention the research.
Policy Documents: Citations or references in official documents from government agencies or policy makers.
Blogs and Websites: Mentions in academic and non-academic blogs.
Wikipedia: References in Wikipedia entries.
Mendeley and other Reference Managers: Mentions in library catalogs or bookmarks in reference management systems.
3. Calculation of the Score
Weighted Sources: Each type of mention is assigned a different weight based on its source and perceived importance. For example, a news article may have a higher weight than a tweet.
Volume and Sources: The score increases with the number of mentions and the variety of sources. Diverse sources contribute more significantly than repeated mentions from a single platform.
Attention and Engagement: It considers not just mentions, but also the level of engagement, such as likes, shares, and comments.
4. Score Representation
Score Badge: The score is often visualized with a colorful badge. The colors on the badge represent different sources of attention: blue for Twitter, red for news, yellow for blogs, etc.
Numeric Score: The number itself ranges widely depending on the level of attention. Higher scores indicate broader and more varied attention.
5. Interpretation of the Score
Contextual Understanding: A high score indicates widespread attention, but not necessarily positive or academic validation. It reflects the reach and engagement but not the quality or scientific rigor.
Comparison Across Fields: Altmetric scores are field-agnostic, so comparisons across different disciplines should be approached with caution. A high score in a niche field might not be directly comparable to a high score in a more popular or public-interest field.
6. Limitations
Potential for Misinterpretation: High attention does not equate to high-quality research; it simply measures visibility and interest.
Vulnerability to Manipulation: As with any metric based on online activity, there is potential for manipulation through coordinated promotions or excessive self-promotion.
7. Applications
Researcher Impact: Helps researchers and institutions understand the broader impact of their work beyond academic circles.
Funding and Policymaking: Can influence decisions by showing how research resonates with the public and policymakers.
Academic Institutions: Universities and research bodies use the score to demonstrate the societal impact of their research.
8. Criticism and Challenges
Quality vs. Popularity: Some criticize the metric for conflating popularity with impact, as a high score can result from controversial or sensational topics.
Short-Term Focus: It emphasizes immediate reactions and may not capture long-term academic influence.
Overall, the Altmetric Attention Score serves as a valuable tool for assessing the broader societal impact of research, offering insights into how research outputs are discussed and disseminated beyond traditional academic channels. However, it should be used alongside other metrics and qualitative evaluations to provide a balanced understanding of research impact.
References
Barakat, A. F., Nimri, N., Shokr, M., Mahtta, D., Mansoor, H., Masri, A., & Elgendy, I. Y. (2019). Correlation of altmetric attention score and citations for high-impact general medicine journals: a cross-sectional study. Journal of general internal medicine, 34, 825-827.
Elmore, S. A. (2018). The altmetric attention score: what does it mean and why should I care?. Toxicologic pathology, 46(3), 252-255.
Huang, W., Wang, P., & Wu, Q. (2018). A correlation comparison between Altmetric Attention Scores and citations for six PLOS journals. PloS one, 13(4), e0194962.
Iglesias‐Puzas, Á., Conde‐Taboada, A., Aranegui‐Arteaga, B., & López‐Bran, E. (2021). Factors associated with high Altmetric Attention Score in dermatology research. Australasian Journal of Dermatology, 62(3), e380-e385.
Kolahi, J., Khazaei, S., Iranmanesh, P., Kim, J., Bang, H., & Khademi, A. (2021). Meta‐analysis of correlations between altmetric attention score and citations in health sciences. BioMed research international, 2021(1), 6680764.
🌱 Emerging Techniques of Solid Waste Management for a Sustainable and Safe Living Environment 🌍
In our pursuit of a sustainable future, managing solid waste efficiently is more crucial than ever. With rapid urbanization and population growth, the strain on our waste management systems is increasing, making innovation in this field essential for a healthier and safer living environment.
Here are some emerging techniques shaping the future of waste management, along with real-world examples:
1️⃣ Waste-to-Energy Conversion: Technologies like pyrolysis, gasification, and anaerobic digestion convert waste into renewable energy. For example, Sweden’s Waste-to-Energy plants use incineration to convert household waste into heat and electricity, powering over a million homes while significantly reducing landfill dependency.
2️⃣ Smart Waste Bins: Smart bins equipped with sensors and IoT technology are revolutionizing waste collection. In cities like San Francisco, smart bins signal waste collectors when they are full, optimizing collection routes, reducing fuel consumption, and lowering CO2 emissions. This approach not only saves costs but also enhances the efficiency of urban waste management.
3️⃣ Circular Economy Practices: Embracing circular economy principles is about rethinking our approach to production and consumption. Companies like IKEA are taking the lead with initiatives like furniture buy-back and resale programs, extending product life cycles and minimizing waste. This shift not only diverts waste from landfills but also supports sustainable consumption habits.
4️⃣ Advanced Recycling Technologies: Innovations like chemical recycling allow the breakdown of complex plastics into their original monomers, making them reusable in the production of new plastics. A prime example is the company Brightmark, which utilizes chemical recycling to turn plastic waste into valuable products like fuels, waxes, and new plastics, providing a solution for materials previously considered non-recyclable.
5️⃣ Community-Based Waste Management: Community-driven initiatives are making a big impact on waste management at the grassroots level. For instance, in Bangalore, India, the Daily Dump organization promotes home composting kits, encouraging households to turn organic waste into valuable compost. This not only reduces the burden on local waste management systems but also fosters a culture of sustainability within communities.
6️⃣ AI and Machine Learning: AI-powered systems are enhancing the efficiency of waste sorting at recycling facilities. ZenRobotics, a Finnish company, uses AI-driven robots to identify and sort different types of waste materials with high precision, improving the quality of recyclable outputs and reducing contamination rates.
By embracing these innovative techniques and learning from successful examples around the globe, we can build a more sustainable and resilient environment for future generations. Let’s all do our part in promoting these practices in our communities, businesses, and daily lives.
Iqbal, A., Liu, X., & Chen, G. H. (2020). Municipal solid waste: Review of best practices in application of life cycle assessment and sustainable management techniques. Science of The Total Environment, 729, 138622.
Kumar, G., Vyas, S., Sharma, S.N., Dehalwar, K. (2024). Challenges of Environmental Health in Waste Management for Peri-urban Areas. In: Nasr, M., Negm, A. (eds) Solid Waste Management. Sustainable Development Goals Series. Springer, Cham. https://doi.org/10.1007/978-3-031-60684-7_9
Sharma, S. N., Dehalwar, K., & Singh, J. (2024). Emerging Techniques of Solid Waste Management for Sustainable and Safe Living Environment. In Solid Waste Management: Advances and Trends to Tackle the SDGs (pp. 29-51). Cham: Springer Nature Switzerland.
Shrivastava, P., Mishra, S., & Katiyar, S. K. (2015, December). A review of solid waste management techniques using GIS and other technologies. In 2015 International conference on computational intelligence and communication networks (CICN) (pp. 1456-1459). IEEE.
Sharma, S.N., Dehalwar, K., Singh, J. (2024). Emerging Techniques of Solid Waste Management for Sustainable and Safe Living Environment. In: Nasr, M., Negm, A. (eds) Solid Waste Management. Sustainable Development Goals Series. Springer, Cham. https://doi.org/10.1007/978-3-031-60684-7_3
Vaccari, M., Torretta, V., & Collivignarelli, C. (2012). Effect of improving environmental sustainability in developing countries by upgrading solid waste management techniques: A case study. Sustainability, 4(11), 2852-2861.
Neighborhood planning is a type of urban planning that aims to shape and guide new and existing neighborhoods. It’s a positive process that involves communities and professional urban planners working together to plan for new development that meets local needs. Neighborhood planning can involve creating a physical plan, or it can be an ongoing process.
Neighborhood planning is a grassroots, community-led process that allows residents and local stakeholders to actively participate in shaping the development and future of their local areas. This approach is built on the principle that local people are best placed to understand and plan for the needs of their community, ensuring that growth and change align with local values, needs, and preferences.
Community Involvement: Neighborhood planning encourages wide participation from residents, businesses, and other local stakeholders. This includes workshops, public meetings, surveys, and other forms of consultation to gather diverse opinions and ideas.
Vision and Goals: The process typically begins with the community defining a clear vision for the future of their neighborhood. This vision guides the creation of specific goals related to housing, transportation, green spaces, economic development, and other local priorities.
Policy Development: Based on the community’s vision, a set of policies and guidelines are developed to direct future development. These policies cover areas such as land use, building design, infrastructure, and environmental protection.
Land Use Planning: A significant component of neighborhood planning is determining how land within the area should be used. This includes zoning decisions, the location of new homes, shops, or offices, and the protection of green spaces.
Design Standards: Neighborhood plans often include design guidelines that ensure new developments are in harmony with the existing character of the area. This can include specifications for building height, materials, and architectural style.
Implementation and Monitoring: Once a plan is adopted, it guides local government decisions on planning applications and development projects. The community also monitors progress and can make adjustments to the plan as needed.
Legal Status: In many regions, neighborhood plans can become legally binding documents once they are approved through a community referendum and adopted by the local authority. This gives the plan significant influence over future development in the area.
Benefits of Neighborhood Planning:
Empowerment: Residents have a direct say in the development of their community.
Local Knowledge: Plans are more likely to reflect the unique needs and characteristics of the neighborhood.
Sustainable Development: Local input can help ensure that growth is sustainable and enhances the quality of life.
Conflict Reduction: Early community involvement can reduce conflicts over development decisions by addressing concerns upfront.
Challenges:
Resource Intensive: The process can be time-consuming and require significant effort from volunteers.
Complexity: Navigating planning regulations and technical details can be challenging for community groups.
Representation: Ensuring that the plan reflects the views of the entire community, including marginalized groups, can be difficult.
Overall, neighborhood planning is a powerful tool for local communities to shape their environment, fostering a sense of ownership and ensuring that development aligns with local needs and values.
References
Dehalwar, K. Bridging the Gap: Community-Based and Workshop-Based Approaches to Address Rural and Urban Planning Issues.
Dehalwar, K. (Ed.). (2024). Basics of Research Methodology-Writing and Publication. EduPedia Publications Pvt Ltd.
Lowndes, V., & Sullivan, H. (2008). How low can you go? Rationales and challenges for neighbourhood governance. Public administration, 86(1), 53-74.
Subhashini, M., & Wickramaarachchi, N. (2022). Applicability of Perry’s neighbourhood concept in neighbourhood planning in Sri Lanka. International Planning Studies, 27(4), 370-393.
Dehalwar, K., & Sharma, S. N. (2023). Fundamentals of Area Appreciation and Space Perceptions A Textbook for Students of Architecture and Planning. Notion Press. https://doi.org/10.5281/zenodo.13325383
Sharma, S. N., & Dehalwar, K. (2024). Fundamentals of Planning and Design of Housing A textbook for Undergraduate Students of Architecture and Planning. Notion Press. https://doi.org/10.5281/zenodo.13325661
Transit-Oriented Development (TOD) is an urban planning and design strategy that aims to create sustainable, livable, and efficient communities by integrating land use with transportation. The concept of TOD centers around the idea of building mixed-use, high-density neighborhoods that are well-connected by public transit, encouraging people to live, work, and play within walking distance of transit services. This approach reduces reliance on automobiles, lowers carbon emissions, and fosters more vibrant, equitable communities. Here’s a detailed explanation of the basic concepts of Transit-Oriented Development:
1. Proximity to Transit
Core Principle: TOD is typically centered around a major transit hub such as a train station, metro stop, or bus interchange. The area within a 5-10 minute walking radius (approximately 400-800 meters) from the transit hub is considered the TOD zone.
Pedestrian Accessibility: The design emphasizes pedestrian-friendly streetscapes that provide safe, convenient, and comfortable access to transit stations. Sidewalks, crosswalks, and public spaces are designed to prioritize walking over driving.
2. Mixed-Use Development
Diverse Land Use: TOD promotes a mix of residential, commercial, office, and recreational spaces within the same neighborhood. This reduces the need for long commutes and supports a more dynamic, 24-hour community.
Vertical Integration: Mixed-use buildings often combine residential units above and retail or office spaces below, maximizing land efficiency and creating a vibrant street-level experience.
3. High Density
Increased Density: TOD encourages higher population and employment densities in areas close to transit stations. This supports the viability of public transportation by ensuring a steady demand for services.
Zoning Regulations: Zoning laws and building codes are often adjusted in TOD areas to allow for higher density development, which can include taller buildings and smaller setbacks from the street.
4. Sustainable Urban Design
Environmentally Friendly: TOD aims to reduce urban sprawl by concentrating growth within already developed areas, preserving green spaces, and minimizing the environmental impact of development.
Energy Efficiency: Buildings in TOD areas are often designed with energy efficiency in mind, incorporating green building standards, sustainable materials, and renewable energy sources.
5. Public and Private Spaces
Vibrant Public Spaces: TOD projects typically include parks, plazas, and other public spaces that enhance the quality of life for residents and visitors. These spaces encourage social interaction and community building.
Private Amenities: In addition to public spaces, TOD developments often feature amenities like gyms, community centers, and retail options that cater to the daily needs of residents.
6. Reduced Dependence on Cars
Car Alternatives: TOD emphasizes reducing car dependency by providing robust public transportation options, along with bike-sharing programs, pedestrian paths, and carpool services.
Parking Management: Parking is strategically managed to discourage excessive car use, often through reduced parking minimums, shared parking structures, or even car-free zones.
7. Economic Benefits
Economic Development: TOD can spur economic growth by attracting investment in transit-adjacent areas, increasing property values, and creating jobs in construction, retail, and services.
Affordable Housing: To ensure equitable development, TOD strategies often include provisions for affordable housing, making it possible for people of different income levels to live near transit.
8. Social Equity
Inclusive Development: TOD aims to provide affordable and accessible transportation options to all residents, including low-income and marginalized communities, reducing transportation costs and improving access to jobs and services.
Community Engagement: Successful TOD projects involve the local community in the planning process, ensuring that development meets the needs and desires of current and future residents.
9. Integrated Transportation Planning
Multi-Modal Connectivity: TOD integrates various forms of transportation—such as buses, trains, bicycles, and walking—into a seamless network, allowing for easy and efficient movement within and between neighborhoods.
First and Last Mile Connectivity: Attention is given to the “first and last mile” of a person’s journey, ensuring that there are convenient ways to get to and from transit stations, such as bike lanes, pedestrian paths, and shuttle services.
10. Long-Term Vision and Planning
Strategic Planning: TOD requires a long-term vision, with careful planning and coordination among various stakeholders, including government agencies, private developers, and the community.
Phased Development: TOD projects are often implemented in phases, allowing for gradual growth and adaptation over time as the community evolves and as demand for transit increases.
Conclusion
Transit-Oriented Development is a holistic approach to urban planning that fosters sustainable growth by integrating transportation and land use. It promotes high-density, mixed-use neighborhoods with easy access to public transit, reducing car dependency, and enhancing quality of life. TOD is not just about transportation; it’s about creating vibrant, inclusive communities where people can live, work, and thrive with minimal environmental impact.
References
Dittmar, H., & Ohland, G. (Eds.). (2012). The new transit town: Best practices in transit-oriented development. Island Press.
Ibraeva, A., de Almeida Correia, G. H., Silva, C., & Antunes, A. P. (2020). Transit-oriented development: A review of research achievements and challenges. Transportation Research Part A: Policy and Practice, 132, 110-130.
Sharma, S. N., Kumar, A., & Dehalwar, K. (2024). The Precursors of Transit-oriented Development. EPW Economic & Political Weekly, 59(16), 14.
Thomas, R., Pojani, D., Lenferink, S., Bertolini, L., Stead, D., & Van der Krabben, E. (2018). Is transit-oriented development (TOD) an internationally transferable policy concept?. Regional Studies, 52(9), 1201-1213.
Bid-Rent Theory is a key concept in urban economics and geography that explains how the price and demand for real estate change as the distance from the Central Business District (CBD) or city center increases. The theory was first proposed by William Alonso in 1960, building on earlier works by Johann Heinrich von Thünen. It helps to understand the spatial organization of cities and how different land uses (residential, commercial, industrial) are distributed across urban areas based on their proximity to the CBD.
Core Concepts of Bid-Rent Theory
Land Value Gradient: Bid-Rent Theory is based on the idea that land value decreases as one moves away from the city center. The CBD is the most accessible part of a city, often serving as the hub for business, commerce, and transportation. Because of this accessibility, land near the CBD is highly desirable, leading to higher demand and, consequently, higher land prices. As distance from the CBD increases, accessibility decreases, and so does the value of the land.
Bid-Rent Curve: The bid-rent curve represents the maximum rent or price that different land users (e.g., commercial, residential, and industrial) are willing to pay at various distances from the CBD. Each type of land use has its own bid-rent curve, reflecting the different needs and constraints of each group. Typically, the curve for commercial activities is the steepest, as businesses are willing to pay a premium to be close to the CBD, while residential and industrial bid-rent curves are flatter.
Competition for Land: In urban areas, different land users compete for the most desirable locations. Commercial enterprises, particularly retail businesses, often outbid other land users for prime locations near the CBD because they benefit the most from high foot traffic and accessibility. Residential users are willing to pay less for land as they prioritize living space and can tolerate longer commutes. Industrial users, needing large amounts of space and less direct access to consumers, tend to locate further from the city center where land is cheaper.
Impact of Accessibility on Land Use: Accessibility is the key factor influencing the bid-rent curve. For businesses, especially those that rely on customer traffic, being close to the CBD reduces transportation costs and maximizes visibility and customer access. For residents, accessibility to work, schools, and amenities influences where they choose to live. As a result, wealthier residents may choose locations with good access to both the CBD and desirable suburban amenities, while lower-income residents may reside in areas with longer commutes.
Application of Bid-Rent Theory
Urban Land Use Patterns: Bid-Rent Theory explains the classic concentric zone model of urban land use, where the CBD is surrounded by zones of commercial, industrial, and residential use. The theory helps planners understand why certain areas of a city develop in specific ways, with commercial activities concentrated in the center and residential areas spreading outwards.
Real Estate and Housing Markets: Real estate developers and investors use bid-rent principles to evaluate the potential profitability of land in different urban locations. Understanding the demand for land at various distances from the CBD allows them to make informed decisions about where to build and invest.
Transportation Planning: Bid-Rent Theory is also used in transportation planning to assess how infrastructure developments, such as new roads or public transit, will impact land values and urban growth. By improving accessibility, transportation projects can shift the bid-rent curve, leading to changes in land use and development patterns.
Gentrification: The theory also provides insights into gentrification, where wealthier individuals or businesses move into previously lower-cost areas near the city center, driving up land prices and displacing lower-income residents. As accessibility improves or the desirability of an area increases, the bid-rent curve for that area shifts, leading to redevelopment and rising property values.
Strengths of Bid-Rent Theory
Predictive Power: Bid-Rent Theory provides a clear framework for predicting how land use will change in response to economic factors, transportation developments, and population growth. It offers a way to model the dynamic relationship between land value and location.
Flexibility: The theory can be applied to various urban contexts, from large metropolitan areas to smaller cities, and it can accommodate changes in transportation technology, such as the rise of automobiles or public transit systems.
Integration with Other Theories: Bid-Rent Theory complements other urban models, such as the Concentric Zone Model, Sector Model, and Multiple Nuclei Model, by explaining the economic forces behind urban land use patterns.
Limitations of Bid-Rent Theory
Price of land closer to CBD is higher. Different land uses will compete for desirable pieces of property in order to maximize profits. Accessibility increases the potential for more customers. Trade-off between accessibility and cost of land. Where have we seen a similar idea before? How does this relate to Concentric Zone Model?
Simplification of Urban Dynamics: Bid-Rent Theory assumes a monocentric city structure with a single CBD, which oversimplifies the complex dynamics of modern cities that often have multiple centers of activity. The emergence of polycentric cities with multiple business districts challenges the theory’s traditional assumptions.
Static Assumptions: The theory assumes that land use patterns remain stable over time, but in reality, cities are constantly evolving due to economic shifts, policy changes, and social dynamics. Bid-Rent Theory does not fully account for these dynamic processes.
Neglect of Social and Cultural Factors: While Bid-Rent Theory focuses on economic factors, it does not consider social, cultural, and political influences on land use decisions. For example, historical factors, zoning regulations, and community preferences can significantly impact urban development in ways not captured by the theory.
Conclusion
Bid-Rent Theory is a fundamental concept in urban economics and geography that provides valuable insights into how land use is organized in cities. By explaining the relationship between land value, accessibility, and distance from the CBD, the theory helps urban planners, real estate developers, and policymakers understand the spatial distribution of different land uses. Despite its limitations, Bid-Rent Theory remains a powerful tool for analyzing urban growth and land use patterns, especially when integrated with other urban models and theories.
Core-Periphery Planning Theory is a spatial-economic model that describes the relationship between economically developed regions (core) and less developed regions (periphery). This theory is often used in the context of regional development, urban planning, and economic geography. The core-periphery model explains how economic, social, and political power is concentrated in the core areas, leading to uneven development between the core and periphery. Below is a detailed discussion of the core-periphery planning theory:
1. Origins and Theoretical Foundation
Dependency Theory: Core-periphery theory is rooted in the broader dependency theory, which explains the global economic system as one where the core (developed countries) exploits the periphery (developing countries). This relationship is marked by unequal exchange and a flow of resources from the periphery to the core.
World Systems Theory: Immanuel Wallerstein’s World Systems Theory further elaborates on core-periphery dynamics, emphasizing the hierarchical structure of the global economy, where core countries dominate in production, finance, and technology, while peripheral countries are dependent on primary commodities and low-value-added industries.
2. Core-Periphery Model in Regional Development
Core Regions: These are economically advanced regions with high levels of industrialization, infrastructure, and urbanization. Core regions often serve as hubs for economic activities, political power, and cultural influence. Examples include major cities or industrialized regions within a country.
Periphery Regions: These regions are less developed, often characterized by lower income levels, inadequate infrastructure, and a dependence on primary sectors like agriculture or mining. Peripheral regions may struggle with issues such as outmigration, unemployment, and poor access to services.
Semi-Periphery: Some models introduce a semi-periphery category, which represents regions that are in transition between core and periphery. These areas might have emerging industries and infrastructure but still face challenges in fully integrating into the core.
3. Spatial Patterns and Processes
Polarization: The core-periphery model suggests that economic growth and development tend to be polarized, concentrating in core regions and leaving peripheral areas lagging. This can lead to increased inequalities between regions.
Circular Causation: Gunnar Myrdal’s concept of circular causation explains how initial advantages in core regions (e.g., better infrastructure, skilled labor) attract more investment, leading to further growth. Conversely, peripheral regions may experience a downward spiral due to a lack of investment.
Backwash Effects: This refers to the negative impacts on peripheral regions as resources, labor, and capital migrate to core regions. Peripheral areas may suffer from depopulation, deindustrialization, and a decline in economic opportunities.
Spread Effects: In contrast to backwash effects, spread effects describe the positive impacts that core regions can have on the periphery, such as through technology transfer, investment, and increased demand for peripheral products. However, these effects are often weaker than backwash effects.
4. Implications for Planning and Policy
Balanced Regional Development: One of the main objectives of planning in the context of core-periphery theory is to reduce regional disparities. Policies might include decentralizing industries, improving infrastructure in peripheral regions, and promoting regional development initiatives.
Growth Poles: A common strategy is to develop “growth poles” in peripheral regions—specific areas where investment and development are concentrated in the hope that growth will radiate outwards to surrounding areas.
Incentives and Subsidies: Governments may offer incentives, such as tax breaks or subsidies, to encourage businesses to invest in peripheral regions.
Infrastructure Development: Improving transportation, communication, and energy infrastructure in peripheral areas can help integrate them into the national and global economy, reducing the dominance of core regions.
5. Criticisms and Challenges
Overemphasis on Economic Factors: Critics argue that the core-periphery model overly focuses on economic factors and may neglect social, cultural, and environmental dimensions of development.
Inequality Perpetuation: Some scholars contend that policies inspired by core-periphery theory may inadvertently reinforce existing inequalities by focusing too much on core areas or by failing to address the root causes of peripheral underdevelopment.
Globalization: The increasing interconnectedness of the world economy challenges traditional core-periphery dynamics. Some peripheral regions may bypass national cores and engage directly with global markets, leading to new patterns of development.
Applications in Urban and Regional Planning
Urban-Rural Divide: The core-periphery model is often applied to understand the urban-rural divide, where cities (core) dominate economically and socially over rural areas (periphery).
References
Borgatti, S. P., & Everett, M. G. (2000). Models of core/periphery structures. Social networks, 21(4), 375-395.
Baldwin, R. E. (2001). Core-periphery model with forward-looking expectations. Regional science and urban economics, 31(1), 21-49.
Currie, M., & Kubin, I. (2006). Chaos in the core-periphery model. Journal of Economic Behavior & Organization, 60(2), 252-275.
Sharma, S. N., Dehalwar, K., Kumar, G., & Vyas, S. (2023). Redefining Peri-urban Urban Areas. Thematics Journal of Geography, 12(3), 7-13.
Sharma, S. N., & Dehalwar, K. (2024). Fundamentals of Planning and Design of Housing A textbook for Undergraduate Students of Architecture and Planning. Notion Press. https://doi.org/10.5281/zenodo.13325661


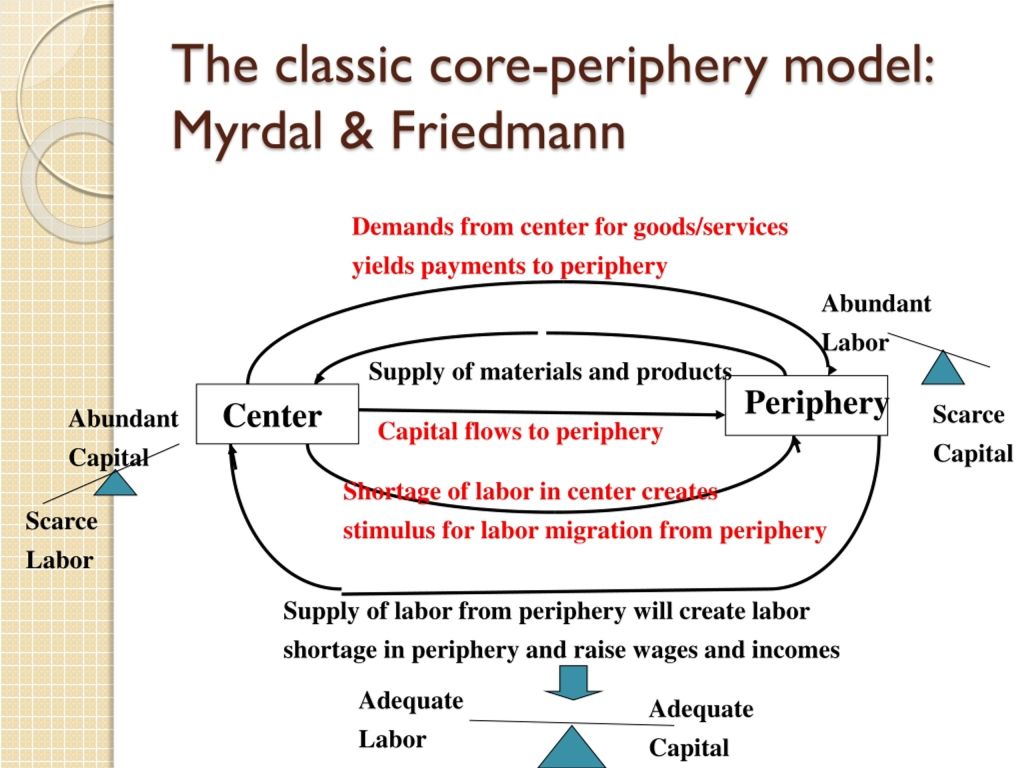


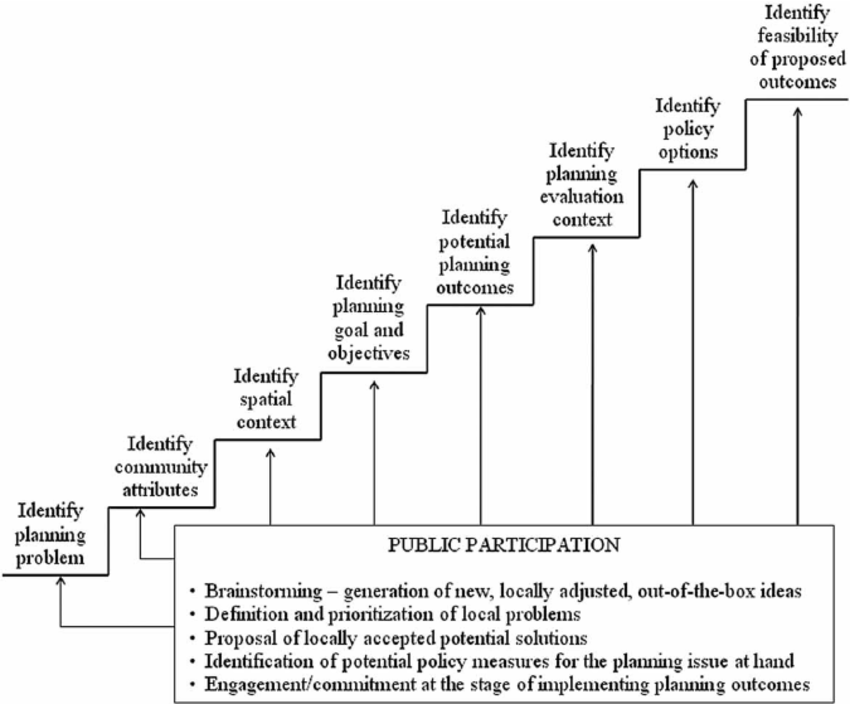


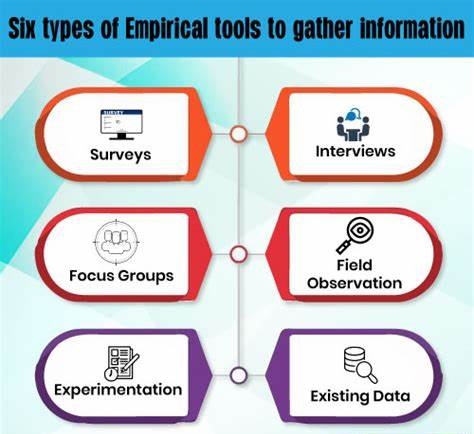


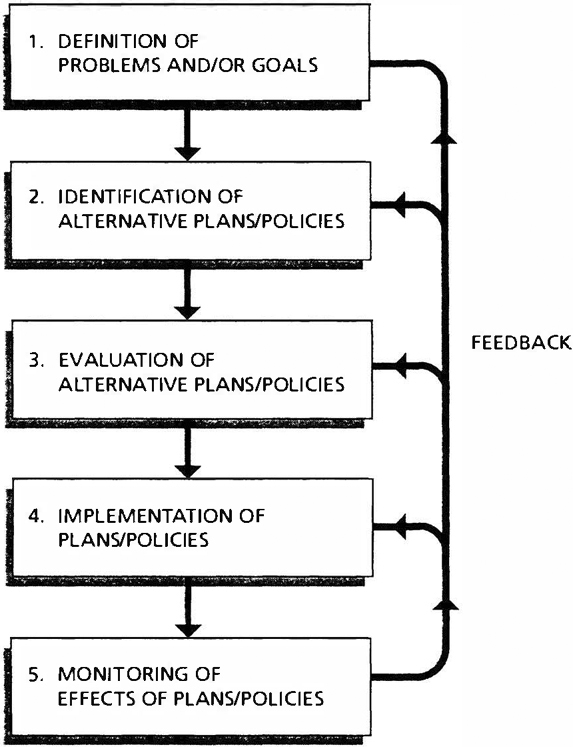


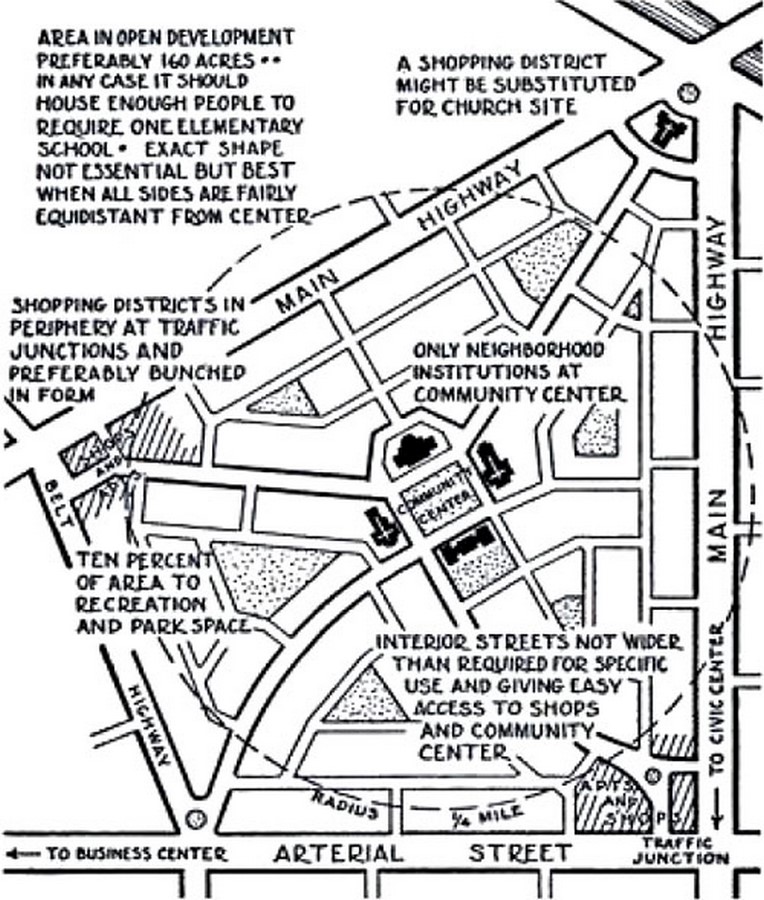
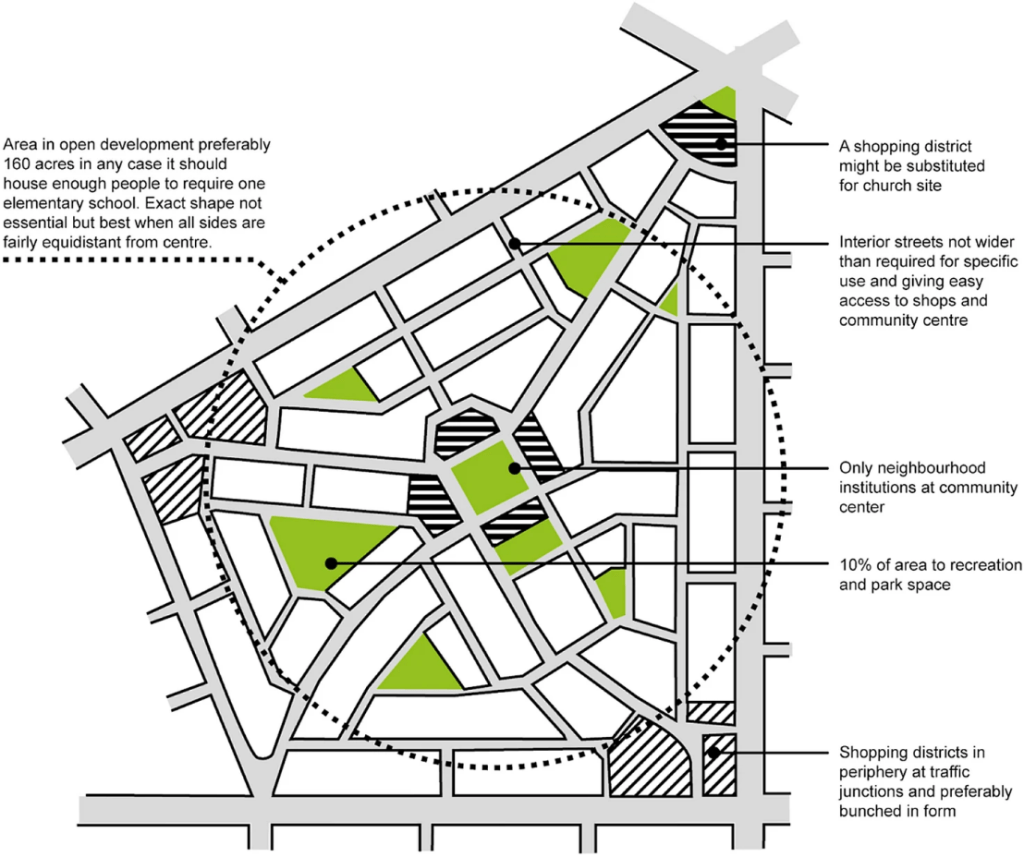


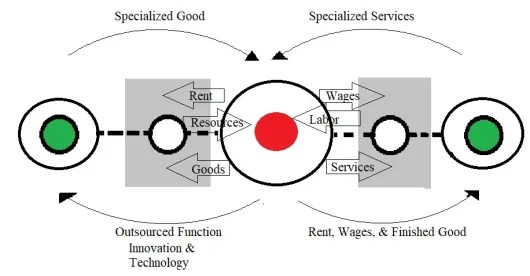


You must be logged in to post a comment.