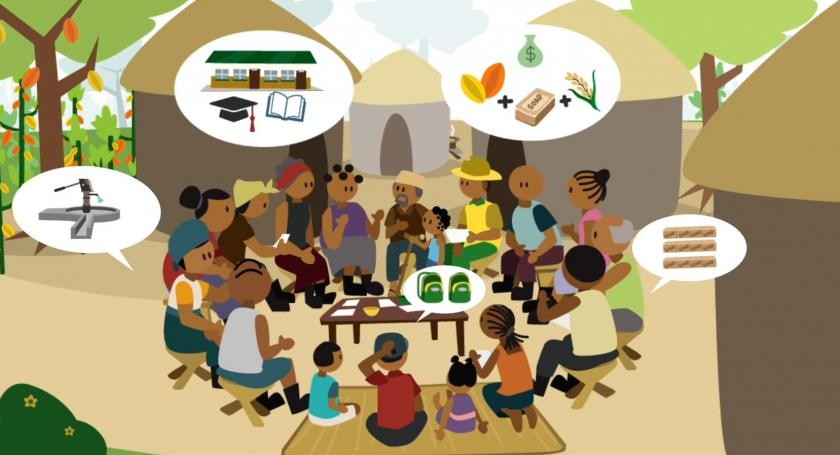
Top Tourist Destinations for Summer Vacation in India

Daily writing prompt
What is your favorite season of year? Why?

By Kavita Dehalwar

India, a land of diverse landscapes and rich cultural heritage, offers a plethora of options for summer vacations. From the snow-capped mountains of the Himalayas to the serene beaches of the south, and from the lush green valleys of the northeast to the royal palaces of Rajasthan, every traveler can find something to their liking. Here are some of the top tourist destinations for a summer vacation in India.

1. Manali, Himachal Pradesh

Why Visit?

Nestled in the Kullu Valley, Manali is a haven for nature lovers and adventure enthusiasts. The cool climate, picturesque landscapes, and vibrant culture make it an ideal summer getaway.

Top Attractions

  • Rohtang Pass: A high mountain pass offering breathtaking views and snow activities.
  • Solang Valley: Famous for adventure sports like paragliding, zorbing, and skiing.
  • Hadimba Temple: An ancient temple surrounded by cedar forests.

2. Ladakh, Jammu and Kashmir

Why Visit?

Known as the “Land of High Passes,” Ladakh is renowned for its stunning landscapes, clear skies, and unique Buddhist culture. It’s a paradise for trekkers and nature enthusiasts.

Top Attractions

  • Pangong Lake: A mesmerizing lake that changes colors from blue to green to red.
  • Nubra Valley: Famous for its sand dunes and double-humped Bactrian camels.
  • Leh Palace: A historic palace offering panoramic views of the Leh town.

3. Darjeeling, West Bengal

Why Visit?

Often referred to as the “Queen of the Hills,” Darjeeling is famous for its tea gardens, scenic beauty, and pleasant weather. The colonial charm and vibrant Tibetan culture add to its allure.

Top Attractions

  • Tiger Hill: Offers a spectacular view of the sunrise over the Kanchenjunga range.
  • Darjeeling Himalayan Railway: A UNESCO World Heritage site, offering a nostalgic toy train ride.
  • Batasia Loop: A scenic spot with a panoramic view of the surrounding mountains.

4. Ooty, Tamil Nadu

Why Visit?

Situated in the Nilgiri Hills, Ooty is a popular hill station known for its tea plantations, lakes, and colonial architecture. The cool climate and lush greenery make it a perfect summer retreat.

Top Attractions

  • Ooty Lake: Ideal for boating and picnics.
  • Botanical Gardens: Home to a variety of exotic plants and a 20-million-year-old fossilized tree.
  • Nilgiri Mountain Railway: A charming toy train ride offering scenic views.

5. Munnar, Kerala

Why Visit?

Munnar, located in the Western Ghats, is famous for its tea gardens, misty hills, and exotic wildlife. The cool climate and serene atmosphere make it a popular destination for honeymooners and nature lovers.

Top Attractions

  • Eravikulam National Park: Home to the endangered Nilgiri Tahr and offering breathtaking views of the tea gardens.
  • Mattupetty Dam: A perfect spot for picnicking and boating.
  • Tea Museum: Showcases the history and process of tea production in Munnar.

6. Rishikesh, Uttarakhand

Why Visit?

Rishikesh, located on the banks of the Ganges River, is known as the “Yoga Capital of the World.” It offers a unique blend of spirituality and adventure, attracting both pilgrims and thrill-seekers.

Top Attractions

  • Laxman Jhula: A famous suspension bridge with a mythological significance.
  • Triveni Ghat: Known for the evening Ganga Aarti.
  • River Rafting: An exhilarating experience on the rapids of the Ganges.

7. Coorg, Karnataka

Why Visit?

Coorg, also known as Kodagu, is a charming hill station known for its coffee plantations, scenic landscapes, and pleasant climate. It’s a perfect destination for a peaceful and rejuvenating vacation.

Top Attractions

  • Abbey Falls: A picturesque waterfall surrounded by coffee plantations.
  • Raja’s Seat: Offers stunning sunset views and a panoramic view of the valley.
  • Dubare Elephant Camp: An opportunity to interact with elephants and enjoy a wildlife safari.

8. Pachmarhi, Madhya Pradesh

Why Visit?

Pachmarhi, often referred to as the “Queen of Satpura,” is the only hill station in Madhya Pradesh. It is known for its lush greenery, waterfalls, ancient caves, and colonial-era architecture. The cool and pleasant climate makes it an ideal summer retreat.

Top Attractions

  • Bee Falls: One of the most popular waterfalls in Pachmarhi, Bee Falls offers a refreshing escape with its cascading waters and scenic surroundings.
  • Jata Shankar Caves: A sacred cave believed to be the place where Lord Shiva concealed himself from the demon Bhasmasur. The cave’s natural rock formations resemble the matted hair of Lord Shiva.
  • Dhupgarh: The highest point in the Satpura range, Dhupgarh offers panoramic views of the surrounding hills and valleys. It is a perfect spot to witness breathtaking sunsets.
  • Pandav Caves: These ancient rock-cut caves are believed to have been the abode of the Pandavas during their exile. The caves are an important archaeological site and attract history enthusiasts.
  • Apsara Vihar: A beautiful natural pool with a small waterfall, ideal for a refreshing dip and a picnic spot.

Activities

  • Trekking and Hiking: Pachmarhi offers numerous trekking trails that take you through dense forests, waterfalls, and viewpoints.
  • Wildlife Spotting: The Satpura National Park, located nearby, is home to a variety of wildlife including leopards, bison, and numerous bird species.
  • Boating: Enjoy a peaceful boat ride on the serene waters of Pachmarhi Lake.

Cultural Experiences

  • Colonial Architecture: Explore the remnants of British-era buildings and churches, which add to the charm of this hill station.
  • Local Cuisine: Savor the flavors of Madhya Pradesh with local delicacies like poha, jalebi, and bhutte ka kees.

Best Time to Visit

The best time to visit Pachmarhi is from October to June when the weather is pleasant and suitable for sightseeing and outdoor activities.

How to Get There

  • By Air: The nearest airport is Raja Bhoj Airport in Bhopal, approximately 195 km away.
  • By Train: Pipariya railway station, located about 47 km from Pachmarhi, is the closest railhead.
  • By Road: Pachmarhi is well-connected by road, with regular bus and taxi services from major cities in Madhya Pradesh.

Pachmarhi, with its natural beauty and serene environment, offers a perfect escape from the hustle and bustle of city life. Whether you’re a nature lover, an adventure enthusiast, or a history buff, Pachmarhi has something to offer. Add this gem of Madhya Pradesh to your summer travel itinerary for a memorable and rejuvenating vacation.

Conclusion

India offers an incredible array of destinations for a memorable summer vacation. Whether you seek adventure in the mountains, relaxation on the beaches, or cultural experiences in historical cities, there’s something for everyone. So, pack your bags and get ready to explore the diverse and captivating landscapes of India this summer!

Jumping ₹3.28 lakh crore, TCS, HUL, and RIL are at the top of the list of companies.

Jumping ₹3.28 lakh crore, TCS, HUL, and RIL are at the top of the list of companies.


According to a PTI report, eight of the 10 most valuable corporations in India had a combined increase in market worth of ₹3.28 lakh billion last week. The top three performers were Hindustan Unilever (HUL), Reliance Industries (RIL), and Tata Consultancy Services (TCS).
RIL continued to be the most valuable corporation overall, with TCS, HDFC Bank, Bharti Airtel, and ICICI Bank completing the top five. In the ranks that followed were the State Bank of India (SBI), Infosys, Life Insurance Corporation of India (LIC), HUL, and ITC.
op Gainers.

Top Gainers

RIL, TCS, HDFC Bank, Bharti Airtel, ICICI Bank, Infosys, HUL, and ITC were the top gainers. These companies saw their market valuations increase by a total of ₹3,28,116.58 crore, as per PTI.

  • The biggest individual gainer was TCS, which saw its market valuation soar by ₹80,828.08 crore to ₹14,08,485.29 crore.
  • HUL was next, adding ₹58,258.11 crore, and taking its market capitalization to ₹6,05,407.43 crore.
  • RIL was third last week, increasing by ₹54,024.35 crore to ₹19,88,741.47 crore.
  • Infosys gained ₹52,770.59 crore, reaching ₹6,36,630.87 crore
  • HDFC Bank’s market valuation rose by ₹32,241.67 crore to ₹11,96,325.52 crore.
  • Bharti Airtel climbed ₹32,080.61 crore to ₹8,10,416.01 crore.
  • ITC’s valuation surged by ₹16,167.71crore to ₹5,48,204.12 crore.
  • ICICI Bank increased by ₹1,745.46 crore to ₹7,88,975.17 crore.

The Laggards

LIC and SBI were the only two laggards in the top 10 list of corporations.

The market value of LIC decreased to ₹6,28,451.77 crore, a decrease of ₹12,080.75 crore.
Of ₹7,40,653.54 crore, SBI’s mcap fell by ₹178.5 crore.
The BSE benchmark increased by 2,732.05 points, or 3.69 percent, last week in the market. On Friday, June 7, the 30-share BSE Sensex increased by 1,720.8 points, or 2.29 percent, to record an intraday high of 76,795.31. At the close, the benchmark was up 1,618.85 points, or 2.16 percent, to a record high of 76,693.36.

Australia vs England at T20 World Cup: Head-to-head, form, team news, pitch

The two limited-overs world champions meet to renew their century-old cricket rivalry at the T20 World Cup 2024.

Following Tuesday’s washout of their match at the same site, England and Scotland shared a point apiece. In an attempt to be the first team to win the trophy again, Jos Buttler’s team didn’t appear to be at their best, letting the Scots reach 90-0 in just 10 overs.

Australia is in second place in Group B with two points after defeating Oman in their opening match, while England is in fourth place with one point. Scotland leads the group with three points from two games, followed by Namibia in third place with two points from two games and Oman at the bottom following two losses.

England’s Super Eight qualification could be in risk if they lose against Australia, the ODI world champions, on Saturday, but batsman Jonny Bairstow is not concerned about the possibilities.

Bairstow said to reporters on Friday, “It doesn’t derail us either way.” “We understand that winning more games than losing is a necessary component of playing tournament cricket.

“Winning gives you a point in the group, but ultimately, you need to win the remaining two games [against Oman and Nambia].

“Beating Australia will be good for momentum and confidence,” he continued.

Australia is “pumped” for the England match.
After a difficult start, Australia defeated Oman by 39 runs thanks to an all-around performance by Marcus Stoinis with the bat and ball.

Although their team was a little anxious throughout the match, captain Mitchell Marsh said they were pleased with the victory and eager for their matchup with old rivals England on Saturday.

For the match in Barbados, Marsh predicts that there will be a larger number of England supporters than Australians, joking that the mood will be similar to that of Headingly in Leeds.

How to Celebrate World Environment Day

Daily writing prompt
Do you or your family make any special dishes for the holidays?

by Shashikant Nishant Sharma

World Environment Day is celebrated on June 5 every year, and it is a day designated by the United Nations to encourage global awareness and action to protect the environment. The theme for World Environment Day changes every year, and it serves as a platform for individuals, governments, and organizations to come together and take action towards a sustainable future. While celebrating World Environment Day is crucial, it is equally essential to ensure that the celebrations are meaningful and impactful. In this critical note, we will discuss how to celebrate World Environment Day effectively.

Spread Awareness: One of the primary purposes of World Environment Day is to raise awareness about environmental issues. Therefore, it is essential to create awareness about the importance of protecting the environment and the impact of human activities on it. We can organize events and campaigns such as rallies, poster competitions, and educational seminars to spread awareness. We can also use social media platforms to spread awareness and educate people about environmental issues.

Plant Trees: Planting trees is an effective way to celebrate World Environment Day as it helps to combat air pollution and climate change. We can organize tree planting drives in parks, schools, and other public spaces. We can also encourage people to plant trees in their homes and communities. It is essential to ensure that the trees planted are native species and are planted in areas where they can grow and thrive.

Reduce Waste: The world is currently grappling with a waste management crisis, and reducing waste is an effective way to combat this problem. On World Environment Day, we can organize waste management campaigns such as plastic clean-up drives and awareness campaigns about reducing plastic waste. We can also encourage people to reduce waste by practicing sustainable habits such as recycling and composting.

Clean-Up Campaigns: Clean-up campaigns are an effective way to celebrate World Environment Day as they help to clean up polluted areas and promote cleanliness. We can organize clean-up campaigns in beaches, parks, and other public spaces. These campaigns can involve volunteers who can help to pick up litter and debris.

Support Local Conservation Efforts: World Environment Day is an opportunity to support local conservation efforts. We can partner with local organizations and groups working towards environmental conservation and support their efforts. This can involve volunteering, donating funds, or participating in events organized by these organizations.

Sustainable Living: Sustainable living is the key to a greener and cleaner future, and World Environment Day is an opportunity to encourage people to adopt sustainable living practices. We can organize campaigns and events that promote sustainable practices such as reducing energy consumption, using public transport, and reducing water usage. These events can also encourage people to adopt eco-friendly products and practices.

Encourage Policy Changes: Policy changes are crucial to combat environmental issues, and World Environment Day is an opportunity to urge policymakers to take action towards a sustainable future. We can organize petitions, letters, and other campaigns that encourage policymakers to implement policies that promote sustainability.

In conclusion, World Environment Day is an opportunity to celebrate and take action towards a sustainable future. While celebrating the day, it is essential to ensure that the celebrations are meaningful and impactful. We can spread awareness, plant trees, reduce waste, organize clean-up campaigns, support local conservation efforts, promote sustainable living, and encourage policy changes to make World Environment Day celebrations effective. Together, we can make a difference and work towards a sustainable future.

—————————————————————-

Construction Management at Site: Ensuring Success from Groundbreaking to Completion

Daily writing prompt
Describe your dream chocolate bar.

By Kavita Dehalwar

Construction management at the site is a critical aspect of the construction industry, focusing on the meticulous planning, coordination, and supervision of a project from inception to completion. Effective site management ensures that projects are delivered on time, within budget, and to the required quality standards. Here, we delve into the key components and practices that make construction management at the site successful.

Photo by PhotoMIX Company on Pexels.com

1. Pre-Construction Planning

Pre-construction planning sets the foundation for successful site management. It involves:

  • Project Scope Definition: Clearly defining the project’s objectives, deliverables, and deadlines.
  • Budgeting: Establishing a realistic budget considering all potential costs.
  • Scheduling: Creating a detailed project schedule outlining all phases and milestones.
  • Risk Assessment: Identifying potential risks and developing mitigation strategies.

2. Site Preparation

Proper site preparation ensures that the project starts on a solid footing. This includes:

  • Site Surveys and Investigations: Conducting thorough surveys to understand site conditions.
  • Clearing and Excavation: Preparing the site by clearing vegetation, debris, and excavating as needed.
  • Setting Up Temporary Facilities: Establishing site offices, storage areas, and worker accommodations.

3. Resource Management

Efficient management of resources—human, material, and equipment—is vital. Key aspects include:

  • Labor Management: Recruiting skilled labor and ensuring proper workforce allocation.
  • Material Procurement: Timely procurement of quality materials to avoid delays.
  • Equipment Management: Ensuring availability and proper maintenance of construction equipment.

4. Quality Control

Maintaining high-quality standards throughout the construction process is essential. This involves:

  • Inspections and Testing: Regular inspections and testing of materials and workmanship.
  • Compliance: Ensuring compliance with building codes, standards, and specifications.
  • Documentation: Keeping detailed records of quality checks and corrective actions taken.

5. Safety Management

Safety is paramount in construction. Effective safety management includes:

  • Safety Plans: Developing comprehensive safety plans and protocols.
  • Training: Providing safety training for all site personnel.
  • Monitoring: Continuous monitoring and enforcement of safety practices.

6. Communication and Coordination

Seamless communication and coordination among stakeholders are crucial. This can be achieved through:

  • Regular Meetings: Conducting regular progress meetings with project teams and stakeholders.
  • Reporting: Providing timely updates through detailed progress reports.
  • Collaboration Tools: Utilizing modern collaboration tools and software for real-time communication.

7. Change Management

Construction projects often encounter changes due to various factors. Effective change management involves:

  • Change Requests: Formalizing the process for requesting changes.
  • Impact Analysis: Assessing the impact of changes on schedule, budget, and quality.
  • Approval Process: Establishing a clear approval process for changes.

8. Progress Monitoring and Reporting

Continuous monitoring and reporting of project progress ensure that the project stays on track. Key practices include:

  • Progress Tracking: Using project management software to track progress against the schedule.
  • Performance Metrics: Monitoring key performance indicators (KPIs) to measure efficiency and productivity.
  • Adjustments: Making necessary adjustments based on progress reports and feedback.

9. Completion and Handover

Successful completion and handover involve:

  • Final Inspections: Conducting thorough inspections to ensure all work meets the required standards.
  • Punch List: Creating a punch list of any outstanding items and ensuring their completion.
  • Handover Documentation: Preparing and handing over all necessary documentation, including warranties, manuals, and as-built drawings.

10. Post-Construction Evaluation

Post-construction evaluation provides valuable insights for future projects. It involves:

  • Lessons Learned: Conducting a review to capture lessons learned.
  • Performance Review: Evaluating the performance of the project team and subcontractors.
  • Client Feedback: Gathering feedback from the client to assess satisfaction and areas for improvement.

Conclusion

Effective construction management at the site is a multifaceted process that requires meticulous planning, resourcefulness, and a proactive approach to problem-solving. By adhering to best practices in site management, construction managers can ensure that projects are completed efficiently, safely, and to the highest quality standards, ultimately leading to successful project delivery and client satisfaction.

References

Introduction to Multi-Criteria Decision Making (MCDM)

By Shashikant Nishant Sharma

In the modern decision-making landscape, where complexity and the need for nuanced choices abound, Multi-Criteria Decision Making (MCDM) emerges as a pivotal research technique. MCDM encompasses a range of methodologies and tools designed to evaluate, prioritize, and select options based on multiple conflicting criteria. This approach is invaluable across various domains, including business, engineering, environmental management, and public policy, where decisions are rarely black and white.

Photo by Expect Best on Pexels.com

Core Concepts of MCDM

1. Criteria and Alternatives: At the heart of MCDM are two fundamental components: criteria and alternatives. Criteria represent the dimensions or attributes against which decisions are evaluated, while alternatives are the different options or courses of action available. For instance, in selecting a location for a new manufacturing plant, criteria might include cost, proximity to suppliers, environmental impact, and local labor availability.

2. Decision Matrix: A decision matrix is a common tool in MCDM, where alternatives are listed against criteria in a tabular format. Each cell in the matrix contains a value representing the performance of a particular alternative against a specific criterion. This matrix serves as the foundation for further analysis.

3. Weighting of Criteria: Different criteria often hold varying levels of importance in the decision-making process. Weighting involves assigning a relative importance to each criterion, typically through techniques like pairwise comparisons, direct rating, or the Analytic Hierarchy Process (AHP). These weights ensure that more critical criteria have a greater influence on the final decision.

Prominent MCDM Techniques

1. Analytic Hierarchy Process (AHP): Developed by Thomas L. Saaty in the 1970s, AHP is one of the most widely used MCDM techniques. It involves decomposing a decision problem into a hierarchy of sub-problems, comparing elements pairwise, and calculating weighted scores to rank alternatives. AHP is particularly useful for complex decisions requiring both qualitative and quantitative assessments.

2. Technique for Order Preference by Similarity to Ideal Solution (TOPSIS): TOPSIS is based on the concept that the chosen alternative should have the shortest geometric distance from the ideal solution and the farthest distance from the negative-ideal solution. It involves normalizing the decision matrix, calculating the Euclidean distance for each alternative, and ranking them accordingly.

3. Preference Ranking Organization Method for Enrichment Evaluation (PROMETHEE): PROMETHEE is a family of outranking methods that evaluate alternatives based on preference functions. It helps decision-makers visualize the strengths and weaknesses of each alternative through graphical representations like the PROMETHEE I partial ranking and PROMETHEE II complete ranking.

4. Simple Additive Weighting (SAW): SAW, also known as the weighted sum method, is a straightforward technique where each alternative’s performance scores are multiplied by the respective criterion weights and summed up. The alternative with the highest total score is considered the best choice.

Applications of MCDM

1. Business and Management: MCDM techniques are extensively used in strategic planning, resource allocation, project selection, and performance evaluation. For instance, companies can employ AHP to prioritize projects based on criteria like cost, return on investment, and strategic alignment.

2. Engineering and Technology: In engineering, MCDM aids in material selection, design optimization, and risk assessment. Techniques like TOPSIS can help engineers select the best materials for a specific application by evaluating properties such as strength, weight, and cost.

3. Environmental Management: MCDM is crucial in environmental decision-making, where trade-offs between economic development and environmental sustainability must be carefully balanced. PROMETHEE and AHP are often used to assess the impacts of various policies and select the most sustainable options.

4. Public Policy: Governments and policy-makers use MCDM to address complex societal issues, such as urban planning, healthcare, and education. MCDM techniques facilitate transparent and rational decision-making by considering diverse stakeholder perspectives and conflicting objectives.

Challenges and Future Directions

Despite its widespread applicability, MCDM is not without challenges. Key issues include the subjectivity in criteria weighting, the complexity of certain methods, and the need for accurate and comprehensive data. Future research is likely to focus on integrating MCDM with artificial intelligence and machine learning to enhance decision support systems, improve robustness, and handle large datasets more efficiently.

Conclusion

Multi-Criteria Decision Making stands as a vital tool in the arsenal of modern decision-makers. By systematically evaluating alternatives against a set of diverse and often conflicting criteria, MCDM facilitates more informed, transparent, and rational choices. As complexity in decision-making continues to grow, the evolution and adoption of MCDM techniques will remain crucial in navigating the multifaceted challenges of the contemporary world.

References

Dehalwar, K., & Sharma, S. N. (2023). Fundamentals of Research Writing and Uses of Research Methodologies. Edupedia Publications Pvt Ltd.

Kumar, A., Sah, B., Singh, A. R., Deng, Y., He, X., Kumar, P., & Bansal, R. C. (2017). A review of multi criteria decision making (MCDM) towards sustainable renewable energy development. Renewable and sustainable energy reviews69, 596-609.

Massam, B. H. (1988). Multi-criteria decision making (MCDM) techniques in planning. Progress in planning30, 1-84.

Sharma, S. N., Dehalwar, K., & Singh, J. (2023). Cellular Automata Model for Smart Urban Growth Management.

Taherdoost, H., & Madanchian, M. (2023). Multi-criteria decision making (MCDM) methods and concepts. Encyclopedia3(1), 77-87.

Thematic Study Research Technique: An In-Depth Exploration

Daily writing prompt
Describe one simple thing you do that brings joy to your life.

By Shashikant Nishant Sharma

Thematic study is a qualitative research technique employed to identify, analyze, and report patterns (themes) within data. This method is highly valuable in various fields, including social sciences, psychology, and market research, as it provides insights into the underlying themes that characterize a particular phenomenon.

What is Thematic Analysis?

Thematic analysis is a method for systematically identifying, organizing, and offering insight into patterns of meaning (themes) across a dataset. It allows researchers to interpret and make sense of collective or shared meanings and experiences. This method is flexible and can be applied across a range of theoretical and epistemological approaches.

Steps in Thematic Analysis

The thematic analysis process generally involves six key phases:

  1. Familiarization with the Data:
    • This initial phase involves immersing oneself in the data to get a thorough understanding of its content. Researchers transcribe verbal data, read through the text multiple times, and begin noting initial observations and potential codes.
  2. Generating Initial Codes:
    • Coding involves organizing the data into meaningful groups. This is done by identifying features of the data that appear interesting and systematically tagging them with codes. Codes are the building blocks of themes, and they capture the essence of the data segments.
  3. Searching for Themes:
    • In this phase, researchers examine the codes to identify significant broader patterns of meaning. Themes are constructed by grouping related codes and data extracts. This phase often involves the creation of thematic maps to visualize relationships between codes and themes.
  4. Reviewing Themes:
    • Themes are then reviewed and refined to ensure they accurately represent the data. This involves checking if the themes work in relation to the coded extracts and the entire dataset. Themes may be split, combined, or discarded during this phase.
  5. Defining and Naming Themes:
    • Each theme is then clearly defined and named, which involves formulating a concise description that captures the essence of the theme. Researchers develop a detailed analysis for each theme, describing its scope and the specific data it encompasses.
  6. Producing the Report:
    • The final phase involves weaving together the themes into a coherent narrative. This report includes compelling data extracts that provide evidence for the themes and illustrates the story the data tells.

Applications of Thematic Analysis

Thematic analysis can be applied in various contexts and for multiple purposes:

  1. Understanding Experiences:
    • It helps in understanding the experiences and perspectives of individuals or groups by identifying common themes in their narratives. For instance, it can be used to explore patient experiences in healthcare settings.
  2. Developing Interventions:
    • Themes identified through thematic analysis can inform the development of interventions. For example, themes related to barriers and facilitators in smoking cessation can guide the creation of targeted public health interventions.
  3. Policy Development:
    • By identifying recurring themes in public opinion or stakeholder feedback, thematic analysis can inform policy development and decision-making.
  4. Market Research:
    • In market research, thematic analysis can help understand consumer preferences and behaviors, thereby guiding product development and marketing strategies.

Advantages of Thematic Analysis

  • Flexibility: It is a highly adaptable method that can be used across various research questions and types of data.
  • Richness of Data: It provides a detailed and nuanced understanding of the data, allowing for in-depth analysis.
  • Accessibility: The approach is relatively easy to learn and apply, making it accessible to novice researchers.

Challenges and Limitations

  • Subjectivity: The analysis can be influenced by the researcher’s biases and perspectives, which might affect the interpretation of the data.
  • Complexity: Handling large datasets can be overwhelming, and ensuring the reliability and validity of the themes requires meticulous work.
  • Time-Consuming: The process is often time-intensive, requiring a significant amount of effort to thoroughly analyze the data.

Enhancing Rigor in Thematic Analysis

To enhance the rigor of thematic analysis, researchers can adopt the following strategies:

  • Triangulation: Using multiple data sources or analytical perspectives to cross-verify the findings.
  • Peer Review: Engaging other researchers to review and critique the themes and interpretations.
  • Member Checking: Returning to the participants to validate the findings and ensure the accuracy of the themes.

Conclusion

Thematic analysis is a powerful qualitative research technique that allows researchers to uncover the underlying themes within data. Through a systematic process, it provides deep insights into various phenomena, making it an invaluable tool in multiple research fields. Despite its challenges, the benefits of thematic analysis in providing rich, detailed, and nuanced understanding make it a widely adopted and respected method in qualitative research.

References

Agarwal, S., & Sharma, S. N. (2014). Universal Design to Ensure Equitable Society. International Journal of Engineering and Technical Research (IJETR)1.

Dana, R. H. (1968). Thematic techniques and clinical practice. Journal of Projective Techniques and Personality Assessment32(3), 204-214.

Dehalwar, K. Mastering Qualitative Data Analysis and Report Writing: A Guide for Researchers.

Dehalwar, K., & Sharma, S. N. (2024). Exploring the Distinctions between Quantitative and Qualitative Research Methods. Think India Journal27(1), 7-15.

Dehalwar, K., & Sharma, S. N. (2023). Fundamentals of Research Writing and Uses of Research Methodologies. Edupedia Publications Pvt Ltd.

Palmer, C. L. (2004). Thematic research collections. A companion to digital humanities, 348-365.

Smith, D. A. (2016). Online interactive thematic mapping: Applications and techniques for socio-economic research. Computers, Environment and Urban Systems57, 106-117.

Thomas, J., & Harden, A. (2008). Methods for the thematic synthesis of qualitative research in systematic reviews. BMC medical research methodology8, 1-10.

Experts Working for Success of TOD

Daily writing prompt
What quality do you value most in a friend?

by Kavita Dehalwar

Photo by Life Of Pix on Pexels.com

Harnessing Expertise for Effective Transit-Oriented Development

Transit-Oriented Development (TOD) represents a comprehensive approach to urban planning that seeks to boost public transport use, reduce automobile dependency, and promote sustainable urban growth. This multidisciplinary endeavor requires the expertise of various professionals, each contributing uniquely to create efficient, vibrant, and sustainable communities centered around transit systems.

Urban Planners

Urban planners are at the forefront of TOD, designing city plans that integrate land use with transportation. Their work ensures that residential and commercial areas are developed in a way that maximizes access to public transit, facilitating a seamless blend of mobility and livability.

Transportation Engineers

Transportation engineers are vital in designing and implementing efficient transit systems that serve as the backbone of TOD. They focus on the connectivity of transit networks that link different urban areas smoothly and efficiently, encouraging the use of public transport over private vehicles.

Architects

Architects contribute by designing buildings and spaces that align with the principles of TOD. They focus on creating accessible, user-friendly, and aesthetically pleasing environments that encourage walking, cycling, and the use of public transport, thus enhancing the overall usability of urban spaces.

Civil Engineers

The role of civil engineers in TOD is crucial. They are responsible for the physical infrastructure that supports transit systems, including roads, bridges, and transit stops. Their work ensures that these structures are safely integrated into the urban fabric, supporting the overall functionality of the transportation network.

Real Estate Developers

Real estate developers analyze market trends to develop properties that maximize the economic benefits of proximity to transit hubs. Their developments help to increase property values and attract businesses and residents who are drawn to the convenience of transit-oriented living.

Environmental Planners

Environmental planners assess and mitigate the ecological impacts of TOD projects. Their expertise ensures that developments are sustainable, incorporating green spaces and environmentally friendly practices that contribute to the health of urban environments.

Geographers

Geographers use spatial analysis to determine the optimal locations for TOD. They provide insights into how these developments can best serve the community and integrate with existing geographic and demographic patterns.

Economists

Economists evaluate the financial implications of TOD, analyzing potential costs and benefits. Their assessments help to justify TOD projects by highlighting their economic viability and the long-term savings associated with reduced traffic congestion and improved public health.

Public Policy Analysts

Public policy analysts craft and advocate for policies that support TOD. They work to align local, state, and federal regulations to foster environments where TOD can thrive, ensuring that legal and administrative frameworks are conducive to integrated urban development.

Sustainability Consultants

Sustainability consultants focus on making TOD projects environmentally sustainable. They advise on incorporating renewable energy sources, efficient waste management systems, and sustainable building materials into development projects.

Traffic Consultants

Traffic consultants play a critical role in ensuring that TODs effectively reduce traffic congestion. They analyze traffic patterns and propose solutions that optimize pedestrian, cyclist, and vehicle flows, enhancing the efficiency of the transit system.

Land Use Attorneys

Land use attorneys navigate the complex legal landscapes of zoning and land use. Their expertise ensures that TOD projects comply with all relevant laws and regulations, facilitating smoother project approvals and implementations.

Social Scientists

Social scientists examine the social dynamics of TOD, including community responses and demographic shifts. Their research helps to ensure that developments are socially equitable and meet the needs of diverse populations.

Landscape Architects

Finally, landscape architects design the green spaces and public areas around transit hubs, making them attractive and functional. Their designs help to ensure that these spaces are not only transit-accessible but also enjoyable places to live, work, and play.

References

Lyu, G., Bertolini, L., & Pfeffer, K. (2016). Developing a TOD typology for Beijing metro station areas. Journal of Transport Geography55, 40-50.

Singh, Y. J., Lukman, A., Flacke, J., Zuidgeest, M., & Van Maarseveen, M. F. A. M. (2017). Measuring TOD around transit nodes-Towards TOD policy. Transport policy56, 96-111.

Sharma, S. N., Kumar, A., & Dehalwar, K. (2024). The Precursors of Transit-oriented Development. Economic and Political Weekly59(14), 16-20.

Thomas, R., Pojani, D., Lenferink, S., Bertolini, L., Stead, D., & Van der Krabben, E. (2018). Is transit-oriented development (TOD) an internationally transferable policy concept?. Regional Studies52(9), 1201-1213.

Effective Strategies for TOD Implementation

Daily writing prompt
How do you know when it’s time to unplug? What do you do to make it happen?

By Shashikant Nishant Sharma

Transit-Oriented Development (TOD) seeks to integrate residential, business, and leisure spaces into compact, walkable communities centered around high-quality public transportation. This urban development model leverages transit to help reduce congestion and pollution, enhance accessibility, and boost local economies. Implementing TOD effectively involves a combination of strategic planning, policy support, and community engagement. Below, we explore several successful strategies for TOD implementation, illustrated with case studies where these strategies have been effectively applied.

Photo by Elena Saharova on Pexels.com

1. Comprehensive Planning and Zoning Adjustments

One of the foundational strategies for effective TOD is the adaptation of zoning laws and planning guidelines to support higher density and mixed-use developments near transit hubs. This often involves changing zoning to allow for greater height and density, reducing parking requirements, and permitting a wider array of commercial and residential building types.

Case Study: Arlington, Virginia, USA

Arlington’s Rosslyn-Ballston Metro Corridor is a prime example of how strategic zoning changes can drive TOD. Early on, Arlington County leaders adopted a “Bull’s-Eye” concept of zoning, where densities were highest near the metro stations and tapered off with distance. This approach supported vibrant, walkable communities around transit stations, significantly increasing public transit usage and reducing dependence on cars.

2. Stakeholder Collaboration and Public Participation

Successful TOD projects often result from collaborative efforts involving multiple stakeholders, including government authorities, developers, residents, and businesses. Engaging the community early and often in the planning process helps align the development with local needs and gain public support.

Case Study: Fruitvale Transit Village, Oakland, California, USA

The Fruitvale Transit Village project was initiated by the Unity Council in collaboration with the local transit authority and city officials. Extensive community engagement led to a design that preserved the neighborhood’s cultural fabric while adding housing, retail spaces, and community services around a major transit station. This development has not only increased transit ridership but also improved economic conditions in the area.

3. Leveraging Private Investment

Public-private partnerships (PPPs) can be critical in financing TOD projects. By sharing the costs, risks, and rewards of development, these partnerships can attract private investment that might not otherwise consider transit-proximate locations.

Case Study: Denver Union Station, Denver, Colorado, USA

The redevelopment of Denver Union Station into a multi-modal transit hub was funded through a mix of public funds and private investment. This PPP arrangement enabled the extensive renovation of the station and surrounding area, incorporating new public spaces, commercial developments, and improved connectivity between different transport modes.

4. Prioritizing Pedestrian and Cyclist Infrastructure

Creating pedestrian-friendly environments is essential in TOD. This involves designing safe, attractive, and comfortable street environments with amenities such as wide sidewalks, bike lanes, benches, shade, and lighting.

Case Study: Strijp-S, Eindhoven, Netherlands

In Strijp-S, an old industrial area was transformed into a dynamic TOD neighborhood, emphasizing pedestrian and cyclist infrastructure. The area features extensive bike paths, pedestrian zones, and public transport links, making it highly accessible without a car.

5. Sustainable Design and Green Building

Integrating sustainable building practices and green infrastructure can enhance the environmental benefits of TOD. This can include energy-efficient building designs, green roofs, and sustainable water management systems.

Case Study: Hammarby Sjöstad, Stockholm, Sweden

Hammarby Sjöstad is internationally recognized for its sustainable approach to TOD. The district uses eco-friendly waste management, energy recovery systems, and water conservation techniques, setting a high standard for sustainable urban development.

Conclusion

Effective TOD implementation requires a multifaceted approach that includes strategic planning, community involvement, private sector engagement, infrastructure development, and sustainability. These case studies demonstrate that when implemented thoughtfully, TOD can significantly enhance urban livability, reduce environmental impacts, and create cohesive communities centered around efficient transit systems.

References

Cervero, R. (2004). Transit-oriented development in the United States: Experiences, challenges, and prospects.

Dehalwar, K. Defining Neighbourhood, Clusters, and Society: Analyzing Neighborhood Development Patterns.

Huang, R., Grigolon, A., Madureira, M., & Brussel, M. (2018). Measuring transit-oriented development (TOD) network complementarity based on TOD node typology. Journal of transport and land use11(1), 305-324.

Ibraeva, A., de Almeida Correia, G. H., Silva, C., & Antunes, A. P. (2020). Transit-oriented development: A review of research achievements and challenges. Transportation Research Part A: Policy and Practice132, 110-130.

Lyu, G., Bertolini, L., & Pfeffer, K. (2016). Developing a TOD typology for Beijing metro station areas. Journal of Transport Geography55, 40-50.

Sharma, S. N., Kumar, A., & Dehalwar, K. (2024). The Precursors of Transit-oriented Development. Economic and Political Weekly59(14), 16-20.

Xu, W., Guthrie, A., Fan, Y., & Li, Y. (2017). Transit-oriented development in China: Literature review and evaluation of TOD potential across 50 Chinese cities. Journal of Transport and Land Use10(1), 743-762.

Widyahari, N. L. A., & Indradjati, P. N. (2015). The potential of transit-oriented development (TOD) and its opportunity in Bandung Metropolitan Area. Procedia Environmental Sciences28, 474-482.

Grounded Theory Research: Unveiling the Underlying Structures of Human Experience

Daily writing prompt
What quality do you value most in a friend?

By Shashikant Nishant Sharma

Grounded theory research is a qualitative methodology that aims to generate or discover a theory through the collection and analysis of data. Unlike traditional research methods that begin with a hypothesis, grounded theory starts with data collection and uses it to develop theories grounded in real-world observations. This approach is particularly valuable in social sciences, where understanding complex human behaviors and interactions is essential.

Origins and Evolution

Grounded theory was developed in the 1960s by sociologists Barney Glaser and Anselm Strauss. Their seminal work, The Discovery of Grounded Theory (1967), introduced a new approach to qualitative research that emphasized the generation of theory from data. This was a departure from the traditional positivist approach, which often tested existing theories through quantitative methods.

Over the decades, grounded theory has evolved, with Glaser and Strauss eventually diverging in their approaches. Glaser’s approach remains more aligned with the original inductive methodology, while Strauss, along with Juliet Corbin, introduced a more structured and systematic method of coding and analyzing data, as detailed in their book Basics of Qualitative Research.

Core Principles

Grounded theory is built on several core principles:

  1. Theoretical Sensitivity: Researchers must be open to understanding the subtleties and nuances in the data, allowing theories to emerge naturally without preconceived notions.
  2. Simultaneous Data Collection and Analysis: Data collection and analysis occur concurrently, allowing for constant comparison and theory refinement throughout the research process.
  3. Coding: This involves breaking down data into discrete parts, closely examining and comparing these parts, and grouping them into categories. Strauss and Corbin’s approach includes three types of coding: open, axial, and selective.
  4. Memo-Writing: Researchers write memos throughout the research process to document their thoughts, hypotheses, and theoretical ideas, aiding in the development and refinement of the emerging theory.
  5. Theoretical Sampling: Data collection is guided by the emerging theory, with researchers seeking out new data to fill gaps and refine categories until theoretical saturation is achieved.
  6. Constant Comparison: Each piece of data is compared with others to identify patterns and variations, ensuring the theory is deeply rooted in the data.

Conducting Grounded Theory Research

  1. Initial Data Collection: Researchers begin by collecting data through various qualitative methods, such as interviews, observations, and document analysis. The goal is to gather rich, detailed information about the phenomenon under study.
  2. Open Coding: During this initial phase, researchers break down the data into smaller parts, labeling and categorizing each segment. This process helps identify initial patterns and themes.
  3. Axial Coding: Here, researchers focus on reassembling the data by identifying relationships between categories. This involves linking subcategories to main categories, often through a process of identifying causal conditions, contexts, strategies, and consequences.
  4. Selective Coding: Researchers integrate and refine the categories to develop a coherent theory. This final phase involves selecting the core category around which the other categories are organized, refining relationships, and validating the theory against the data.
  5. Theoretical Saturation: Researchers continue collecting and analyzing data until no new information or categories emerge. This indicates that the theory is well-developed and grounded in the data.

Applications and Impact

Grounded theory has been widely used across various fields, including sociology, psychology, education, nursing, and business. Its flexibility and inductive nature make it particularly useful for exploring new or complex phenomena where existing theories may not adequately explain the data.

For example, in healthcare, grounded theory has been used to understand patient experiences, the dynamics of healthcare teams, and the development of health policies. In education, it has helped uncover the processes of learning and teaching, student motivation, and curriculum development.

Challenges and Criticisms

Despite its strengths, grounded theory is not without its challenges and criticisms. Some researchers argue that the method can be too subjective, as the researcher’s interpretations play a significant role in data analysis. Others point out that the iterative nature of data collection and analysis can be time-consuming and labor-intensive.

Additionally, the divergence in methodologies between Glaser and Strauss has led to debates about the “correct” way to conduct grounded theory research. Researchers must navigate these differing approaches and determine which best fits their study’s goals and context.

Conclusion

Grounded theory research offers a robust framework for generating theories that are deeply rooted in empirical data. Its emphasis on inductive reasoning and iterative analysis allows researchers to uncover the underlying structures of human experience and behavior. While it presents certain challenges, its flexibility and depth make it an invaluable tool in the qualitative research arsenal. By remaining grounded in the data, researchers can develop theories that offer meaningful insights and contribute to a deeper understanding of complex social phenomena.

References

Breckenridge, J., & Jones, D. (2009). Demystifying theoretical sampling in grounded theory research. Grounded Theory Review8(2).

Dehalwar, K., & Sharma, S. N. (2023). Fundamentals of Research Writing and Uses of Research Methodologies. Edupedia Publications Pvt Ltd.

Dougherty, D. (2017). Grounded theory research methods. The Blackwell companion to organizations, 849-866.

Dunne, C. (2011). The place of the literature review in grounded theory research. International journal of social research methodology14(2), 111-124.

Holton, J. A. (2008). Grounded theory as a general research methodology. The grounded theory review7(2), 67-93.

McGhee, G., Marland, G. R., & Atkinson, J. (2007). Grounded theory research: literature reviewing and reflexivity. Journal of advanced nursing60(3), 334-342.

Oktay, J. S. (2012). Grounded theory. Oxford University Press.

Sharma, S. N., & Adeoye, M. A. (2024). New Perspectives on Transformative Leadership in Education. EduPedia Publications Pvt Ltd.

Water Management for Sponge Cities: A Sustainable Urban Future

Daily writing prompt
What jobs have you had?

By Kavita Dehalwar

Photo by Tom Fisk on Pexels.com

Introduction

As urbanization continues to surge, cities worldwide face significant challenges related to water management. Traditional infrastructure often struggles to cope with heavy rainfall, leading to flooding, water pollution, and depletion of groundwater resources. The concept of the “sponge city” offers an innovative solution, aiming to enhance urban resilience by mimicking natural water cycles. This article explores the principles of sponge cities, their benefits, and effective strategies for their implementation.

What is a Sponge City?

A sponge city is an urban area designed to absorb, store, and purify rainwater, allowing it to be reused or to recharge groundwater. This approach contrasts with conventional urban design, which typically focuses on rapid drainage of stormwater through sewers and channels. By integrating green infrastructure and sustainable water management practices, sponge cities aim to mitigate flooding, improve water quality, and ensure a sustainable water supply.

Key Principles of Sponge Cities

  1. Infiltration
    • Green Spaces and Permeable Surfaces: Utilizing parks, green roofs, and permeable pavements to allow rainwater to infiltrate the ground, reducing surface runoff and promoting groundwater recharge.
    • Bioretention Systems: Implementing rain gardens and bioswales to capture and filter stormwater.
  2. Storage
    • Retention Ponds and Wetlands: Creating ponds and artificial wetlands to store excess rainwater, which can later be used for irrigation or released gradually to prevent flooding.
    • Underground Tanks and Cisterns: Installing tanks beneath buildings and streets to capture and store rainwater for non-potable uses like flushing toilets and watering plants.
  3. Purification
    • Natural Treatment Systems: Utilizing plants and soil in wetlands and green spaces to naturally filter pollutants from stormwater.
    • Constructed Wetlands: Designing engineered wetlands that mimic natural processes to treat and purify water.
  4. Reuse
    • Rainwater Harvesting: Collecting and storing rainwater from rooftops and other surfaces for domestic and industrial use.
    • Greywater Recycling: Treating and reusing water from sinks, showers, and laundry for landscaping and irrigation.

Benefits of Sponge Cities

  1. Flood Mitigation By enhancing the capacity of urban areas to absorb and store rainwater, sponge cities significantly reduce the risk of flooding during heavy rainfall events.
  2. Water Quality Improvement Natural filtration systems remove pollutants from stormwater, leading to cleaner rivers, lakes, and coastal waters.
  3. Groundwater Recharge Increased infiltration helps replenish groundwater reserves, which is crucial for maintaining water supplies during dry periods.
  4. Climate Resilience Sponge cities are better equipped to cope with the impacts of climate change, such as more frequent and intense rainfall and prolonged droughts.
  5. Enhanced Urban Greenery Integrating green spaces into urban design not only supports water management but also enhances biodiversity, reduces urban heat islands, and improves residents’ quality of life.

Implementation Strategies

  1. Policy and Planning
    • Integrated Water Management Plans: Developing comprehensive plans that incorporate sponge city principles into urban development projects.
    • Regulations and Incentives: Enforcing regulations that mandate the inclusion of green infrastructure in new developments and providing incentives for retrofitting existing buildings.
  2. Community Involvement
    • Public Awareness Campaigns: Educating residents about the benefits of sponge cities and encouraging practices like rainwater harvesting.
    • Participatory Planning: Involving local communities in the design and implementation of green infrastructure projects.
  3. Technical Solutions
    • Green Roofs and Walls: Installing vegetation on rooftops and building facades to absorb rainwater and provide insulation.
    • Permeable Pavements: Using materials that allow water to pass through, reducing runoff and promoting infiltration.
  4. Monitoring and Maintenance
    • Regular Inspections: Ensuring that green infrastructure components are functioning correctly and efficiently.
    • Adaptive Management: Adjusting strategies based on performance data and evolving climate conditions.

Conclusion

Sponge cities represent a forward-thinking approach to urban water management, offering sustainable solutions to the challenges posed by rapid urbanization and climate change. By incorporating principles of infiltration, storage, purification, and reuse, cities can transform themselves into resilient, water-sensitive environments. The successful implementation of sponge city strategies requires a collaborative effort involving policymakers, urban planners, engineers, and the community. As more cities adopt this innovative model, the vision of sustainable and livable urban spaces can become a reality.

References

Cosgrove, W. J., & Loucks, D. P. (2015). Water management: Current and future challenges and research directions. Water Resources Research51(6), 4823-4839.

Guan, X., Wang, J., & Xiao, F. (2021). Sponge city strategy and application of pavement materials in sponge city. Journal of Cleaner Production303, 127022.

Haasnoot, M., Middelkoop, H., Van Beek, E., & Van Deursen, W. P. A. (2011). A method to develop sustainable water management strategies for an uncertain future. Sustainable Development19(6), 369-381.

Pahl-Wostl, C. (2008). Requirements for adaptive water management. In Adaptive and integrated water management: Coping with complexity and uncertainty (pp. 1-22). Berlin, Heidelberg: Springer Berlin Heidelberg.

Rogers, P. P., & Fiering, M. B. (1986). Use of systems analysis in water management. Water resources research22(9S), 146S-158S.

The Role of a Road Safety Expert: Ensuring Safer Journeys

Daily writing prompt
What jobs have you had?

By Shashikant Nishant Sharma

Introduction

In an age where mobility and transportation are pivotal to societal progress, the role of a Road Safety Expert has never been more critical. These professionals are dedicated to minimizing traffic accidents and enhancing the safety of all road users, including drivers, pedestrians, cyclists, and motorcyclists. This article explores the multifaceted job of a Road Safety Expert, highlighting their responsibilities, required skills, and the impact they make on our daily lives.

Photo by Kelly on Pexels.com

Key Responsibilities

1. Data Collection and Analysis

One of the primary tasks of a Road Safety Expert is collecting and analyzing data related to road accidents and traffic flow. This data includes accident reports, traffic volume statistics, and observational studies. By scrutinizing this information, experts identify patterns and underlying causes of road incidents, which is crucial for developing effective safety strategies.

2. Designing Safety Programs

Based on their data analysis, Road Safety Experts design and implement comprehensive road safety programs. These programs can range from public awareness campaigns to engineering solutions like improved road signage, better lighting, and safer pedestrian crossings. The goal is to reduce accident rates and enhance overall road safety.

3. Policy Development and Advocacy

Road Safety Experts often work closely with government bodies and policymakers to develop and advocate for regulations that enhance road safety. They provide expert opinions on traffic laws, vehicle standards, and road design guidelines, ensuring that these regulations are grounded in empirical evidence and best practices.

4. Conducting Safety Audits

A significant aspect of their job involves conducting road safety audits. These audits are thorough examinations of existing road conditions and traffic systems. The experts identify potential hazards and recommend modifications to improve safety. This might involve redesigning dangerous intersections, implementing traffic calming measures, or improving road maintenance.

5. Training and Education

Educating the public and professionals about road safety is another critical role. Road Safety Experts develop training programs for drivers, school children, and even road maintenance workers. They might also conduct workshops and seminars to raise awareness about the importance of road safety and safe driving practices.

Essential Skills and Qualifications

1. Technical Knowledge

A strong foundation in civil engineering, traffic engineering, or transportation planning is essential. Knowledge of road design principles, traffic flow theories, and accident analysis techniques forms the bedrock of their expertise.

2. Analytical Skills

The ability to analyze complex data sets and derive meaningful insights is crucial. Road Safety Experts must be proficient in using statistical software and geographic information systems (GIS) to interpret data and visualize safety trends.

3. Communication Skills

Effective communication is vital for advocating safety measures and educating the public. Road Safety Experts must be able to convey technical information in a clear and persuasive manner to various stakeholders, including government officials, engineers, and the general public.

4. Attention to Detail

Given the potential consequences of their work, a meticulous approach is necessary. Road Safety Experts must thoroughly evaluate road conditions and traffic patterns, identifying even the smallest risk factors that could lead to accidents.

Impact on Society

The work of Road Safety Experts has a profound impact on society. By reducing the frequency and severity of road accidents, they help save lives and prevent injuries. Their efforts contribute to smoother traffic flow, less congestion, and a more efficient transportation system. Moreover, enhancing road safety fosters a sense of security among all road users, encouraging more people to use non-motorized forms of transport, such as cycling and walking, which also benefits public health and the environment.

Conclusion

The role of a Road Safety Expert is indispensable in creating a safer and more sustainable transportation system. Their expertise in data analysis, safety program design, policy development, and education significantly contributes to reducing road accidents and saving lives. As urbanization continues and traffic volumes increase, the demand for skilled Road Safety Experts will undoubtedly grow, underscoring the importance of their role in ensuring that our journeys are not only efficient but also safe.

References

Agarwal, S., & Sharma, S. N. (2014). Universal Design to Ensure Equitable Society. International Journal of Engineering and Technical Research (IJETR)1.

Huvarinen, Y., Svatkova, E., Oleshchenko, E., & Pushchina, S. (2017). Road safety audit. Transportation Research Procedia20, 236-241.

Korchagin, V., Pogodaev, A., Kliavin, V., & Sitnikov, V. (2017). Scientific basis of the expert system of road safety. Transportation Research Procedia20, 321-325.

Proctor, S., Belcher, M., & Cook, P. (2001). Practical road safety auditing. Thomas Telford.

Sayed, T. A. (1995). A highway safety expert system: A new approach to safety programs (Doctoral dissertation, University of British Columbia).

Sharma, S. N. Enhancing Safety Analysis with Surrogate Methods: A Focus on Uncontrolled Traffic Intersections.

Sharma, S. N., & Adeoye, M. A. (2024). New Perspectives on Transformative Leadership in Education. EduPedia Publications Pvt Ltd.

Sharma, S. N., & Singh, D. (2023). Understanding mid-block traffic analysis: A crucial tool for road safety. Think India Journal26(3), 5-9.

Singh, D., Das, P., & Ghosh, I. (2024). Bridging conventional and proactive approaches for road safety analytic modeling and future perspectives. Innovative Infrastructure Solutions9(5), 1-21.

Toroyan, T. (2009). Global status report on road safety. Injury prevention15(4), 286-286.

Artificial Intelligence Applications in Public Transport

Daily writing prompt
List your top 5 favorite fruits.

By Shashikant Nishant Sharma

Artificial Intelligence (AI) is revolutionizing various sectors, and public transport is no exception. With the ability to process vast amounts of data and make real-time decisions, AI is enhancing the efficiency, safety, and convenience of public transportation systems worldwide. Here are some of the key applications of AI in public transport:

1. Predictive Maintenance

AI-driven predictive maintenance systems use data from sensors placed on vehicles and infrastructure to predict when a part is likely to fail. This proactive approach allows for maintenance to be performed before breakdowns occur, reducing downtime and improving reliability. By analyzing patterns and trends, AI can forecast potential issues, ensuring that vehicles are always in optimal condition.

2. Traffic Management

AI algorithms are being used to manage traffic flow in real-time. By analyzing data from traffic cameras, sensors, and GPS devices, AI can adjust traffic light timings, reroute buses, and provide real-time updates to commuters. This helps to reduce congestion, minimize delays, and enhance the overall efficiency of the public transport network.

3. Autonomous Vehicles

Self-driving buses and trains are one of the most exciting applications of AI in public transport. Autonomous vehicles can operate with precision, adhere to schedules, and reduce human error. Pilot programs for autonomous buses are already underway in several cities, promising a future where public transport is not only more efficient but also safer and more reliable.

4. Smart Ticketing and Payment Systems

AI-powered ticketing systems are simplifying the payment process for passengers. Using machine learning algorithms, these systems can provide dynamic pricing based on demand, offer personalized travel recommendations, and streamline fare collection. Contactless payment options and mobile ticketing apps enhance the convenience for users, reducing the need for physical tickets and cash transactions.

5. Route Optimization

AI can analyze vast amounts of data to determine the most efficient routes for public transport vehicles. This includes considering factors such as traffic conditions, passenger demand, and historical data. By optimizing routes, AI helps in reducing travel time, lowering fuel consumption, and improving the overall service quality for passengers.

6. Passenger Information Systems

AI enhances passenger information systems by providing real-time updates on schedules, delays, and disruptions. Chatbots and virtual assistants powered by AI can answer passenger queries, provide travel recommendations, and assist with trip planning. These systems improve the passenger experience by ensuring that they have access to accurate and timely information.

7. Safety and Security

AI is playing a crucial role in improving safety and security in public transport. Surveillance systems equipped with AI can detect unusual behavior, monitor crowd density, and identify potential threats. Facial recognition technology can be used to enhance security measures, ensuring that public transport systems remain safe for all users.

8. Energy Efficiency

AI can optimize the energy consumption of public transport vehicles. By analyzing data on fuel usage, driving patterns, and environmental conditions, AI systems can suggest ways to reduce energy consumption and emissions. This not only lowers operational costs but also contributes to a more sustainable and environmentally friendly public transport system.

9. Accessibility

AI applications are making public transport more accessible to individuals with disabilities. AI-powered apps can provide real-time information on accessible routes, help with navigation, and even assist with boarding and alighting from vehicles. This ensures that public transport is inclusive and caters to the needs of all passengers.

Conclusion

The integration of AI into public transport systems is transforming the way we travel. From improving operational efficiency and safety to enhancing the passenger experience, AI is paving the way for smarter, more reliable, and more sustainable public transport. As AI technology continues to advance, we can expect even more innovative applications that will further revolutionize the public transport industry.

References

Costa, V., Fontes, T., Costa, P. M., & Dias, T. G. (2015). Prediction of journey destination in urban public transport. In Progress in Artificial Intelligence: 17th Portuguese Conference on Artificial Intelligence, EPIA 2015, Coimbra, Portugal, September 8-11, 2015. Proceedings 17 (pp. 169-180). Springer International Publishing.

Jevinger, Å., Zhao, C., Persson, J. A., & Davidsson, P. (2024). Artificial intelligence for improving public transport: a mapping study. Public Transport16(1), 99-158.

Kouziokas, G. N. (2017). The application of artificial intelligence in public administration for forecasting high crime risk transportation areas in urban environment. Transportation research procedia24, 467-473.

Lodhia, A. S., Jaiswalb, A., & Sharmac, S. N. (2023). An Investigation into the Recent Developments in Intelligent Transport System. In Proceedings of the Eastern Asia Society for Transportation Studies (Vol. 14).

Okrepilov, V. V., Kovalenko, B. B., Getmanova, G. V., & Turovskaj, M. S. (2022). Modern trends in artificial intelligence in the transport system. Transportation Research Procedia61, 229-233.

Sharma, S. N., Dehalwar, K., & Singh, J. (2023). Cellular Automata Model for Smart Urban Growth Management.

Ushakov, D., Dudukalov, E., Shmatko, L., & Shatila, K. (2022). Artificial Intelligence as a factor of public transportations system development. Transportation Research Procedia63, 2401-2408.

How to Collect Data for Binary Logit Model

Daily writing prompt
Share a story about someone who had a positive impact on your life.

By Kavita Dehalwar

Collecting data for a binary logit model involves several key steps, each crucial to ensuring the accuracy and reliability of your analysis. Here’s a detailed guide on how to gather and prepare your data:

1. Define the Objective

Before collecting data, clearly define what you aim to analyze or predict. This definition will guide your decisions on what kind of data to collect and the variables to include. For a binary logit model, you need a binary outcome variable (e.g., pass/fail, yes/no, buy/not buy) and several predictor variables that you hypothesize might influence the outcome.

2. Identify Your Variables

  • Dependent Variable: This should be a binary variable representing two mutually exclusive outcomes.
  • Independent Variables: Choose factors that you believe might predict or influence the dependent variable. These could include demographic information, behavioral data, economic factors, etc.

3. Data Collection Methods

There are several methods you can use to collect data:

  • Surveys and Questionnaires: Useful for gathering qualitative and quantitative data directly from subjects.
  • Experiments: Design an experiment to manipulate predictor variables under controlled conditions and observe the outcomes.
  • Existing Databases: Use data from existing databases or datasets relevant to your research question.
  • Observational Studies: Collect data from observing subjects in natural settings without interference.
  • Administrative Records: Government or organizational records can be a rich source of data.

4. Sampling

Ensure that your sample is representative of the population you intend to study. This can involve:

  • Random Sampling: Every member of the population has an equal chance of being included.
  • Stratified Sampling: The population is divided into subgroups (strata), and random samples are drawn from each stratum.
  • Cluster Sampling: Randomly selecting entire clusters of individuals, where a cluster forms naturally, like geographic areas or institutions.

5. Data Cleaning

Once collected, data often needs to be cleaned and prepared for analysis:

  • Handling Missing Data: Decide how you’ll handle missing values (e.g., imputation, removal).
  • Outlier Detection: Identify and treat outliers as they can skew analysis results.
  • Variable Transformation: You may need to transform variables (e.g., log transformation, categorization) to fit the model requirements or to better capture the nonlinear relationships.
  • Dummy Coding: Convert categorical independent variables into numerical form through dummy coding, especially if they are nominal without an inherent ordering.

6. Data Splitting

If you are also interested in validating the predictive power of your model, you should split your dataset:

  • Training Set: Used to train the model.
  • Test Set: Used to test the model, unseen during the training phase, to evaluate its performance and generalizability.

7. Ethical Considerations

Ensure ethical guidelines are followed, particularly with respect to participant privacy, informed consent, and data security, especially when handling sensitive information.

8. Data Integration

If data is collected from different sources or at different times, integrate it into a consistent format in a single database or spreadsheet. This unified format will simplify the analysis.

9. Preliminary Analysis

Before running the binary logit model, conduct a preliminary analysis to understand the data’s characteristics, including distributions, correlations among variables, and a preliminary check for potential multicollinearity, which might necessitate adjustments in the model.

By following these steps, you can collect robust data that will form a solid foundation for your binary logit model analysis, providing insights into the factors influencing your outcome of interest.

References

Cramer, J. S. (1999). Predictive performance of the binary logit model in unbalanced samples. Journal of the Royal Statistical Society: Series D (The Statistician)48(1), 85-94.

Dehalwar, K., & Sharma, S. N. (2023). Fundamentals of Research Writing and Uses of Research Methodologies. Edupedia Publications Pvt Ltd.

Horowitz, J. L., & Savin, N. E. (2001). Binary response models: Logits, probits and semiparametrics. Journal of economic perspectives15(4), 43-56.

Singh, D., Das, P., & Ghosh, I. (2024). Driver behavior modeling at uncontrolled intersections under Indian traffic conditions. Innovative Infrastructure Solutions9(4), 1-11.

Tranmer, M., & Elliot, M. (2008). Binary logistic regression. Cathie Marsh for census and survey research, paper20.

Wilson, J. R., Lorenz, K. A., Wilson, J. R., & Lorenz, K. A. (2015). Standard binary logistic regression model. Modeling binary correlated responses using SAS, SPSS and R, 25-54.

Young, R. K., & Liesman, J. (2007). Estimating the relationship between measured wind speed and overturning truck crashes using a binary logit model. Accident Analysis & Prevention39(3), 574-580.

Unlocking Insights: The Binary Logit Model Explained

Daily writing prompt
Share a story about someone who had a positive impact on your life.

By Shashikant Nishant Sharma

The binary logit model is a statistical technique widely used in various fields such as economics, marketing, medicine, and political science to analyze decisions where the outcome is binary—having two possible states, typically “yes” or “no.” Understanding the model provides valuable insights into factors influencing decision-making processes.

Key Elements of the Binary Logit Model:

  1. Outcome Variable:
    • This is the dependent variable and is binary. For instance, it can represent whether an individual purchases a product (1) or not (0), whether a patient recovers from an illness (1) or does not (0), or whether a customer renews their subscription (1) or cancels it (0).
  2. Predictor Variables:
    • The independent variables, or predictors, are those factors that might influence the outcome. Examples include age, income, education level, or marketing exposure.
  3. Logit Function:
    • The model uses a logistic (sigmoid) function to transform the predictors’ linear combination into probabilities that lie between 0 and 1. The logit equation typically looks like this:
    𝑝=11+𝑒−(𝛽0+𝛽1𝑋1+𝛽2𝑋2+…+𝛽𝑛𝑋𝑛)p=1+e−(β0​+β1​X1​+β2​X2​+…+βnXn​)1​Here, 𝑝p is the probability of the outcome occurring, and 𝛽𝑖βi​ are the coefficients associated with each predictor variable 𝑋𝑖Xi​.

How It Works:

The graph above illustrates the binary logit model, showing the relationship between the predictor value (horizontal axis) and the predicted probability (vertical axis). This logistic curve, often referred to as an “S-curve,” demonstrates how the logit function transforms a linear combination of predictor variables into probabilities ranging between 0 and 1.

  • The red dashed line represents a probability threshold of 0.5, which is often used to classify the two outcomes: above this threshold, an event is predicted to occur (1), and below it, it’s predicted not to occur (0).
  • The steepest portion of the curve indicates where changes in the predictor value have the most significant impact on the probability.
  • Coefficient Estimation:
    • The coefficients (𝛽β) are estimated using the method of maximum likelihood. The process finds the values that maximize the likelihood of observing the given outcomes in the dataset.
  • Odds and Odds Ratios:
    • The odds represent the ratio of the probability of an event happening to it not happening. The model outputs an odds ratio for each predictor, indicating how a one-unit change in the predictor affects the odds of the outcome.
  • Interpreting Results:
    • Coefficients indicate the direction of the relationship between predictors and outcomes. Positive coefficients suggest that increases in the predictor increase the likelihood of the outcome. Odds ratios greater than one imply higher odds of the event with higher predictor values.

Applications:

  1. Marketing Analysis: Understanding customer responses to a new product or marketing campaign.
  2. Healthcare: Identifying factors influencing recovery or disease progression.
  3. Political Science: Predicting voter behavior or election outcomes.
  4. Economics: Studying consumer behavior in terms of buying decisions or investment choices.

Limitations:

  • Assumptions: The model assumes a linear relationship between the log-odds and predictor variables, which may not always hold.
  • Data Requirements: Requires a sufficient amount of data for meaningful statistical analysis.
  • Model Fit: Goodness-of-fit assessments, such as the Hosmer-Lemeshow test or ROC curves, are crucial for evaluating model accuracy.

Conclusion:

The binary logit model provides a robust framework for analyzing decisions and predicting binary outcomes. By understanding the relationships between predictor variables and outcomes, businesses, researchers, and policymakers can unlock valuable insights to inform strategies and interventions.

References

Cramer, J. S. (1999). Predictive performance of the binary logit model in unbalanced samples. Journal of the Royal Statistical Society: Series D (The Statistician)48(1), 85-94.

Dehalwar, K., & Sharma, S. N. (2023). Fundamentals of Research Writing and Uses of Research Methodologies. Edupedia Publications Pvt Ltd.

Singh, D., Das, P., & Ghosh, I. (2024). Driver behavior modeling at uncontrolled intersections under Indian traffic conditions. Innovative Infrastructure Solutions9(4), 1-11.

Tranmer, M., & Elliot, M. (2008). Binary logistic regression. Cathie Marsh for census and survey research, paper20.

Wilson, J. R., Lorenz, K. A., Wilson, J. R., & Lorenz, K. A. (2015). Standard binary logistic regression model. Modeling binary correlated responses using SAS, SPSS and R, 25-54.

Young, R. K., & Liesman, J. (2007). Estimating the relationship between measured wind speed and overturning truck crashes using a binary logit model. Accident Analysis & Prevention39(3), 574-580.

Kush a New Dangerous Drug: A Few Facts

A new drug called Kush is presently in the news as it has been creating a dangerous health situation in West Africa, particularly in Sierra Leone, where it is estimated to kill around a dozen people each week, and thousands are being hospitalized. I wish to mention a few facts about Sierra Leone. Sierra Leone, officially known as the Republic of Sierra Leone, is a country located in West Africa. It is spread over a land area of 71,740 square kilometers. Sierra Leone has a tropical climate and a variety of environments ranging from savannas to rainforests. According to the 2015 census, Sierra Leone had a population of 7,092,113, with Freetown as the capital and largest city. Around 79 percent of its people follow Islam as a religion (Wikipedia). Anyway, the drug is taken mostly by male people between the ages of 18 and 25. It causes people to fall asleep while walking, fall over, bang their heads against hard surfaces, and walk into moving traffic. It may be mentioned here that Kush should not be confused with the drug of the same name found in the US, which is a mixture of ‘an ever-changing’ host of chemicals sprayed on plant matter and smoked. Kush in Sierra Leone is quite different; it is a mixture of cannabis, fentanyl, tramadol, formaldehyde, and – according to some – ground-down human bones.
It may be mentioned here that cannabis is widely grown in Sierra Leone; the fentanyl is thought to originate in clandestine laboratories in China, where the drug is manufactured illegally and shipped to West Africa. Tramadol has a similar source, namely illegal laboratories across Asia. Formaldehyde, which can cause hallucinations, is also reported in this mixture. The drug is reported in both Guinea and Liberia, which share porous land borders with Sierra Leone, making drug trafficking easy.
Kush costs around five Leones (20 UK pence) per joint, which may be used by two or three people, with up to 40 joints being consumed in a day. This represents a massive spend on drugs and illustrates the addictive nature of the mixture in a country where the annual income per capita is around 500 British pounds sterling. Anyway, it is noteworthy to mention that as for ground human bones, there is no definitive answer about whether or not they occur in the drug, where such bones would come from, or why they might be incorporated into the drug. Some people say that grave robbers provide the bones, but no direct evidence exists. The effects of the drug vary and depend on the user and the drug content. Cannabis causes a wide variety of effects, which include euphoria, relaxation, and an altered state of consciousness. Fentanyl, an extremely potent opioid, produces euphoria and confusion and causes sleepiness, among a wide range of other side effects. Similarly, tramadol, which is also an opioid but less potent than fentanyl (100 mg tramadol has the same effect as 10 mg morphine), results in users becoming sleepy and “spaced out” – disconnected from things happening around them. The danger of the drug is twofold: the risk of self-injury to the drug taker and the highly addictive nature of the drug itself. A further problem is the need to finance the next dose, often achieved through prostitution or criminal activity.
Before concluding, it may be mentioned that controlling or eradicating such bad habits is sine qua non. The legislation alone cannot address the issue. Many of those who attended the very limited rehabilitation centers returned to drug use. Perhaps what is required is an integrated forensic health care system where legislative control is backed up by properly resourced rehabilitation centers supported with a public health and employment program. Also, awareness programmes should be taken up in a massive way to inform people about the harmful effects of the drug.

Prof Shankar Chatterjee, Hyderabad

References:
1) https://theconversation.com/kush-what-is-this-dangerous-new-west-african-drug-that-supposedly-contains-human-bones-220608
2) https://medicalxpress.com/news/2024-01-kush-dangerous-west-african-drug.html#goog

Flag of Sierra Leone

Prefabricated Building Construction: Revolutionizing the Construction Industry

Daily writing prompt
What public figure do you disagree with the most?

By Kavita Dehalwar

In recent years, the construction industry has witnessed a significant transformation with the rise of prefabricated building construction. This method involves assembling components of a structure in a manufacturing site and transporting complete assemblies or sub-assemblies to the construction site where the structure is to be located. This innovative approach not only accelerates building timelines but also offers improvements in cost, quality, and sustainability.

What is Prefabricated Building Construction?

Prefabricated building construction, also known as modular construction, involves the off-site manufacturing of building sections, known as modules. These modules are constructed in a controlled factory setting, where environmental factors can be managed to avoid delays. Once completed, these modules are transported to the building site and assembled to form a fully functional structure.

The technology used in prefabricated construction has evolved significantly, allowing for greater complexities in design and larger scales of construction. This method is used for a wide range of buildings, from single residential units to large-scale commercial projects.

Benefits of Prefabricated Building Construction

1. Efficiency and Speed: Construction speed is one of the most significant advantages of prefabrication. Buildings can be completed 30% to 50% quicker than those using traditional construction methods. This is largely due to the simultaneous progress in site preparation and building manufacturing, which drastically cuts down overall project time.

2. Cost-Effectiveness: Although the initial costs might be similar or slightly higher than traditional construction, prefabricated building construction saves money in the long run. This saving is due to reduced construction times, decreased labor costs, and less waste.

3. Quality Control: Since the components are manufactured in a controlled environment, the quality is often superior to that of traditional construction, where environmental factors and varying skill levels can affect the build.

4. Sustainability: Prefabricated construction is often more sustainable than traditional construction methods. The controlled factory environment leads to more accurate assemblies, better air filtration, and tighter joints, which make the buildings more energy-efficient. Moreover, the factory setting allows for recycling materials, controlling inventory, and optimizing material usage which reduces waste.

5. Safety: Enhanced safety is another crucial benefit of prefabricated construction. Factory settings are less hazardous compared to construction sites, and workers are not exposed to environmental hazards and risks associated with traditional construction sites, such as extreme weather and heights.

Challenges and Considerations

While prefabricated building construction offers numerous benefits, there are also challenges that need to be addressed:

1. Transportation: The larger the modules, the more complex and costly it becomes to transport them to the site. Logistics require careful planning and sometimes special transportation permits.

2. Design Limitations: Although technology has advanced, there are still some design limitations compared to traditional methods. Complex, non-repetitive structures can be more challenging to achieve with prefabrication.

3. Upfront Planning: Prefabrication requires detailed planning and coordination at the early stages of a project. Changes to the design after the production process begins can be costly and difficult to implement.

4. Market Perception: There is a perception issue where some clients believe prefabricated buildings are inferior or less durable than traditional structures, though this is changing as more high-quality projects are completed.

Conclusion

Prefabricated building construction is poised to be a game-changer in the construction industry. With the ongoing advancements in technology and increasing focus on sustainable development, it offers an efficient, economical, and environmentally friendly alternative to traditional construction methods. As the industry overcomes the existing challenges and more successes are documented, prefabricated construction is likely to become more prevalent globally, shaping the future of how buildings are created.

References

Baghchesaraei, A., Kaptan, M. V., & Baghchesaraei, O. R. (2015). Using prefabrication systems in building construction. International journal of applied engineering research10(24), 44258-44262.

Fard, M. M., Terouhid, S. A., Kibert, C. J., & Hakim, H. (2017). Safety concerns related to modular/prefabricated building construction. International journal of injury control and safety promotion24(1), 10-23.

Jaillon, L., & Poon, C. S. (2010). Design issues of using prefabrication in Hong Kong building construction. Construction Management and Economics28(10), 1025-1042.

Navaratnam, S., Ngo, T., Gunawardena, T., & Henderson, D. (2019). Performance review of prefabricated building systems and future research in Australia. Buildings9(2), 38.

Shashikant Nishant Sharma , Dr. Kavita Dehalwar , Arjun Singh Lodhi , Gopal Kumar,”PREFABRICATED BUILDING CONSTRUCTION: A THEMATIC ANALYSIS APPROACH “, Futuristic Trends in Construction Materials & Civil Engineering Volume 3 Book 1,IIP Series, Volume 3, May, 2024, Page no.91-114, e-ISBN: 978-93-5747-479-5

Site Suitability Analysis: An Essential Tool for Sustainable Development

Daily writing prompt
What is your career plan?

By Shashikant Nishant Sharma

In the modern era of urbanization and environmental awareness, site suitability analysis plays a pivotal role in guiding sustainable development. It is a comprehensive process that evaluates the suitability of a particular location for specific uses, balancing socio-economic benefits with environmental sustainability. By identifying the optimal locations for development, site suitability analysis minimizes environmental impacts and maximizes resource efficiency, ensuring projects align with local regulations and community needs.

Understanding the Process

Site suitability analysis involves a multidisciplinary approach that integrates geographic, environmental, economic, and social data. It typically includes several steps:

Define Objectives:

Establish the purpose of the analysis, such as residential zoning, industrial development, or conservation efforts. Clear objectives guide data collection and evaluation criteria.

    Data Collection:

    Gather relevant information about the site, including topography, soil quality, hydrology, climate, land use patterns, infrastructure, and socio-economic data.

      Assessment Criteria:

      Develop a framework of criteria based on objectives. For instance, residential development may prioritize proximity to schools and healthcare facilities, while agricultural suitability might focus on soil quality and water availability.

        Developing a framework of criteria for site suitability analysis begins by clearly defining the objectives for each type of development or use. The criteria selected should directly support these objectives, ensuring that the analysis accurately reflects the needs and priorities of the project.

        For residential development, the framework might include criteria such as:

        • Proximity to essential services: Evaluate the distance to schools, healthcare facilities, shopping centers, and public transportation. Closer proximity enhances the quality of life for residents and can increase property values.
        • Safety: Consider crime rates and public safety measures in potential areas to ensure resident security.
        • Environmental quality: Include measures of air and noise pollution to ensure a healthy living environment.
        • Infrastructure: Assess the availability and quality of essential utilities like water, electricity, and internet service.

        For agricultural development, the criteria would be quite different, focusing on aspects such as:

        • Soil quality: Analyze soil composition, pH levels, and fertility to determine the suitability for various types of crops.
        • Water availability: Assess local water resources to ensure sufficient irrigation capabilities, considering both surface and groundwater sources.
        • Climate: Evaluate local climate conditions, including average temperatures and precipitation patterns, which directly affect agricultural productivity.
        • Accessibility: Include the ease of access to markets and processing facilities to reduce transportation costs and spoilage of agricultural products.

        In both cases, these criteria are quantified and, where necessary, weighted to reflect their importance relative to the overall goals of the project. This structured approach ensures that the site suitability analysis is both comprehensive and aligned with the strategic objectives, leading to more informed and effective decision-making.

        Data Analysis:

        Utilize Geographic Information System (GIS) tools and statistical models to analyze spatial data against criteria. This step often involves weighting factors to reflect their relative importance.

        During the data analysis phase of site suitability analysis, Geographic Information System (GIS) tools and statistical models are employed to evaluate spatial data against established criteria. This sophisticated analysis involves layering various data sets—such as environmental characteristics, infrastructural details, and socio-economic information—within a GIS framework to assess each location’s compatibility with the desired outcomes.

        A critical component of this phase is the application of weighting factors to different criteria based on their relative importance. These weights are determined by the objectives of the project and the priorities of the stakeholders, ensuring that more crucial factors have a greater influence on the final analysis. For example, in a project prioritizing environmental conservation, factors like biodiversity and water quality might be assigned higher weights compared to access to road networks.

        GIS tools enable the visualization of complex datasets as interactive maps, making it easier to identify patterns and relationships that are not readily apparent in raw data. Statistical models further assist in quantifying these relationships, providing a robust basis for scoring and ranking the suitability of different areas. This rigorous analysis helps ensure that decisions are data-driven and align with strategic planning objectives, enhancing the efficiency and sustainability of development projects.

          Mapping and Scoring:

            In the mapping and scoring phase of site suitability analysis, the collected and analyzed data are transformed into visual representations—maps that highlight the suitability of different areas for specific uses. These maps are created using Geographic Information System (GIS) technology, which allows for the layering of various datasets including environmental attributes, infrastructural factors, and socio-economic indicators. Each area is scored based on its alignment with the predetermined criteria; these scores are then color-coded or symbolized to indicate varying levels of suitability. The resulting maps serve as practical tools for decision-makers, enabling them to visually identify and compare the most suitable locations for development, conservation, or other purposes. This process not only simplifies complex data into an understandable format but also ensures that decisions are grounded in a comprehensive and systematic evaluation, leading to more informed, efficient, and sustainable outcomes.

            Decision-Making:

            Interpret the results to inform planning decisions. This may involve consultation with stakeholders to ensure decisions reflect broader community goals.

            In the decision-making phase of site suitability analysis, the results obtained from mapping and scoring are interpreted to guide planning and development decisions. This step involves a detailed examination of the visualized data to identify the most optimal locations for specific projects or uses based on their suitability scores. Planners and decision-makers may consider various factors, such as economic viability, environmental impact, and social acceptability.

            Consultation with stakeholders is crucial at this stage. Engaging local communities, business owners, government officials, and other relevant parties ensures that the decisions made reflect the broader goals and needs of the community. This collaborative approach helps to balance different interests and priorities, which is essential for the successful implementation of sustainable development projects.

            By integrating stakeholder feedback and aligning it with the analytical data from the site suitability analysis, decision-makers can develop plans that are not only technically sound but also socially and environmentally responsible. This holistic approach fosters greater community support and enhances the effectiveness of the development initiatives, leading to more sustainable and inclusive outcomes.

              Applications and Benefits

              Site suitability analysis offers benefits across various sectors. In urban planning, it identifies optimal locations for new infrastructure, helping to reduce traffic congestion and improve quality of life. For agricultural expansion, the process ensures that only areas with the highest crop yield potential are utilized, preserving less suitable lands. Conservation projects also benefit by pinpointing critical habitats that need protection.

              Furthermore, this analysis supports disaster resilience planning by identifying safe zones for development, away from flood-prone or seismic areas.

              Challenges and Considerations

              Despite its benefits, site suitability analysis faces challenges such as data availability and accuracy. Remote areas may lack comprehensive data, and changing environmental conditions could quickly render findings obsolete. Moreover, socio-political dynamics and economic interests may affect decision-making, requiring a balance between development objectives and community needs.

              Conclusion

              Site suitability analysis is an indispensable tool for sustainable development. It provides a data-driven foundation for making informed, forward-looking decisions that can help balance growth with environmental conservation. By incorporating this analysis into planning processes, decision-makers can shape resilient, inclusive, and environmentally responsible communities for the future.

              References

              Banai-Kashani, R. (1989). A new method for site suitability analysis: The analytic hierarchy process. Environmental management13, 685-693.

              Baseer, M. A., Rehman, S., Meyer, J. P., & Alam, M. M. (2017). GIS-based site suitability analysis for wind farm development in Saudi Arabia. Energy141, 1166-1176.

              Charabi, Y., & Gastli, A. (2011). PV site suitability analysis using GIS-based spatial fuzzy multi-criteria evaluation. Renewable Energy36(9), 2554-2561.

              Dehalwar, K., & Sharma, S. N. (2023). Fundamentals of Research Writing and Uses of Research Methodologies. Edupedia Publications Pvt Ltd.

              Dehalwar, K. Mastering Qualitative Data Analysis and Report Writing: A Guide for Researchers.

              Misra, S. K., & Sharma, S. (2015). Site suitability analysis for urban development: a review. Int J Recent Innov Trends Comput Commun3(6), 3647-3651.

              Patel, R. S., Taneja, S., Singh, J., & Sharma, S. N. (2024). Modelling of Surface Runoff using SWMM and GIS for Efficient Storm Water Management. CURRENT SCIENCE126(4), 463.

              Pramanik, M. K. (2016). Site suitability analysis for agricultural land use of Darjeeling district using AHP and GIS techniques. Modeling Earth Systems and Environment2, 1-22.

              Sharma, S. N., & Abhishek, K. (2015). Planning Issue in Roorkee Town. Planning.

              Research Onion: Understanding the Layers of Research Methodology

              Daily writing prompt
              What do you do to be involved in the community?

              By Shashikant Nishant Sharma

              Research is a fundamental aspect of academia and industry, serving as a cornerstone for innovation, knowledge development, and problem-solving. To conduct effective research, researchers often employ a structured approach known as the Research Onion. The Research Onion metaphorically represents the layers of research methodology, each layer building upon the previous one to uncover deeper insights and understanding. Let’s delve into the layers of the Research Onion to understand its significance and application in the research process.

              The research onion, developed by Saunders et al. in 2007, is a widely used model that illustrates the stages involved in designing a research methodology. This model is particularly useful for students and researchers who need to create an organized methodology for their dissertation or research project. The onion’s layers represent different stages of the research process, each building upon the previous one to ensure a comprehensive approach to data collection and analysis.

              1. Philosophical Assumptions: At the core of the Research Onion lay philosophical assumptions that guide the researcher’s worldview and approach to the study. These assumptions may be positivist, interpretivist, or critical in nature, shaping the researcher’s choice of research methods and data collection techniques.
              2. Research Approach: Building upon philosophical assumptions, the research approach determines the overall strategy for conducting the study. It could be deductive, inductive, or abductive, outlining how the researcher moves from theory to data and vice versa.
              3. Strategies: The next layer involves the selection of research strategies, such as experiments, surveys, case studies, or interviews. These strategies dictate how data will be collected, analyzed, and interpreted to answer the research questions effectively.
              4. Choices: Within the strategies layer, researchers make specific choices regarding sampling, data collection, and data analysis methods. These choices are crucial in ensuring the research is rigorous, valid, and reliable.
              5. Time Horizon: Time horizon refers to the temporal scope of the study, whether it is cross-sectional or longitudinal. This layer addresses the duration of the research project and the implications of time on data collection and analysis.
              6. Data Collection: The outermost layer of the Research Onion deals with the practical aspects of collecting data through surveys, interviews, observations, or experiments. This layer brings the research process full circle, from conceptualization to empirical evidence.

              By understanding and applying the layers of the Research Onion, researchers can navigate the complexities of the research process systematically. Each layer contributes to the overall quality and credibility of the study, ensuring that research findings are robust and actionable.

              The research onion is a visual representation of the steps involved in developing a research strategy. It consists of six main layers that are interconnected and influence each other. Each layer represents a specific stage in the research process, from the broadest philosophical considerations to the most detailed practical decisions about data collection and analysis.

              Layers of the Research Onion

              1. Research Philosophy: This layer defines the set of principles that guide the research. It encompasses the researcher’s worldview or stance and is often categorized into positivism and interpretivism. Positivism assumes that knowledge is independent of the subject being studied, while interpretivism claims that individual observers have their own perception and understanding of reality.
              2. Approach: This layer involves choosing an appropriate research approach. The two main approaches are deductive and inductive. Deductive research starts with a specific hypothesis based on the literature review and aims to test it in various contexts. Inductive research begins with observations and uses them to develop a new theory.
              3. Strategy: The research strategy is the plan for how the research will be conducted. This can include action research, experimental research, interviews, surveys, case study research, or a systematic literature review. The strategy is chosen based on the data required for the research and the purpose of the study.
              4. Choices of Methods: This layer involves selecting the methods to be used in the research. The options include mono-method, mixed method, and multi-method. Mono-method involves using only one method, while mixed method combines two or more methods, often including both qualitative and quantitative approaches. Multi-method involves using a wide range of methods.
              5. Time Horizons: This layer refers to the time frame of the research. It can be either cross-sectional or longitudinal. Cross-sectional data is collected at a single point in time, while longitudinal data is collected over a period of time.
              6. Data Collection and Analysis: This is the final layer of the research onion, where the researcher decides on the techniques and procedures for collecting and analyzing data. This includes choosing between primary and secondary data, qualitative and quantitative data, and selecting specific data collection methods and analysis techniques.

              The Benefits of the Research Onion

              The research onion provides several benefits to researchers. It helps create a systematic approach to designing a research methodology, ensuring that all aspects of the research are considered. It also promotes a holistic understanding of the research process, encouraging researchers to think critically about their methodology and how it relates to the broader research goals. Additionally, the research onion is adaptable to various research contexts and can be applied to different types of research projects.

              Conclusion

              The research onion is a valuable tool for researchers, providing a structured approach to designing a research methodology. By understanding the different layers of the onion, researchers can ensure that their methodology is comprehensive, well-planned, and effective in achieving their research goals.

              In conclusion, the Research Onion serves as a comprehensive framework for designing, executing, and interpreting research in a structured and methodical manner. By peeling back each layer of the Research Onion, researchers can uncover valuable insights, contribute to knowledge advancement, and make informed decisions based on empirical evidence.

              References

              Alturki, R. (2021). Research onion for smart IoT-enabled mobile applications. Scientific programming2021, 1-9.

              Dehalwar, K., & Sharma, S. N. (2023). Fundamentals of Research Writing and Uses of Research Methodologies. Edupedia Publications Pvt Ltd.

              Dehalwar, K., & Sharma, S. N. (2024). Exploring the Distinctions between Quantitative and Qualitative Research Methods. Think India Journal27(1), 7-15.

              Lanzotti, V. (2006). The analysis of onion and garlic. Journal of chromatography A1112(1-2), 3-22.

              Mardiana, S. (2020). Modifying research onion for information systems research. Solid State Technology63(4), 5304-5313.

              Melnikovas, A. (2018). Towards an Explicit Research Methodology: Adapting Research Onion Model for Futures Studies. Journal of futures Studies23(2).

              Sharma, S. N., Dehalwar, K., Kumar, G., & Vyas, S. (2023). Redefining Peri-urban Urban Areas. Thematics Journal of Geography12(3), 7-13.

              Sharma, S. N. (2020). A Review of Swarna Jayanti Shahari Rozgar Yojana. Think India Journal23(1), 26-32.

              10 Days ICSSR Sponsored Research Methodology Course

              Daily writing prompt
              What was the last live performance you saw?

              📢 Exciting Opportunity for Scholars and Researchers!


              We are thrilled to announce the ICSSR Sponsored 10 Days Research Methodology Workshop, scheduled for 13-22 July 2024. This comprehensive workshop is designed to enhance your skills in research methodology, academic writing, and publication.
              * No Registration Fee
              * 10 Days free Accommodation and Food during the course
              * Free Study materials
              * Compulsory to bring your own laptop
              * Limited Seats Available

              🔗 Register Now:
              Registration Form https://lnkd.in/duA4szjt
              Key Highlights:
              Engage with expert researchers and academics.
              Hands-on sessions on qualitative, quantitative, and mixed research methods.
              Insights into effective writing and publication strategies.
              Don’t miss this chance to advance your research capabilities and network with peers from various disciplines.
              📄 For more details, download our brochure:
              Workshop Brochure https://lnkd.in/dymRVYPb
              📍 Location:
              Maulana Azad National Institute of Technology (MANIT), Bhopal
              📅 Dates:
              13-22 July 2024
              Spread the word and bring your research journey to the next level! Let’s make a significant impact together. Looking forward to seeing you there!
              hashtag#ResearchMethodology hashtag#AcademicWriting hashtag#ScholarlyPublication hashtag#ICSSR hashtag#Workshop hashtag#Education hashtag#Networking hashtag#MANITBhopal For more details, visit us at https://lnkd.in/gmiRQPiX

              Engaging Community in an Effective Manner

              Daily writing prompt
              What do you do to be involved in the community?

              By Kavita Dehalwar

              Getting involved in your community can be a rewarding and enriching experience that not only contributes to the well-being of your local area but also fosters personal growth, networking opportunities, and a sense of belonging. Whether you live in a bustling city or a quiet rural town, there are numerous ways to engage with your community. Here are some effective methods to get involved and make a positive impact:

              1. Volunteer Your Time

              One of the most impactful ways to be involved in your community is through volunteering. Nonprofits, charities, schools, hospitals, and local events are always in need of volunteers. Offering your time can help support various causes, from feeding the homeless at a local shelter to tutoring students. Volunteering also provides an opportunity to develop new skills and meet people with similar interests.

              2. Attend Community Meetings

              Staying informed and involved in local governance is another way to engage with your community. Attend town hall meetings, school board gatherings, or neighborhood association events to understand the issues your community is facing. These meetings offer a platform to voice your opinions, suggest improvements, and understand the roles of local leaders.

              3. Participate in Local Events

              Communities often host a variety of events like festivals, markets, parades, and charity runs. Participating in these activities can enhance community spirit and allow you to connect with fellow residents. It’s also a fun way to celebrate local traditions and cultures.

              4. Support Local Businesses

              Choosing to shop at local businesses instead of large chains is a simple yet effective way to support your community’s economy. Local artisans, farmers’ markets, and independent shops contribute to the unique character of your area and often depend on local patronage to thrive.

              5. Join or Start a Club or Group

              Whether it’s a book club, gardening group, sports team, or an arts and crafts circle, joining or starting a group centered around your interests can deepen your connection with others who share your passions. This is a great way to socialize, share skills, and engage in meaningful activities together.

              6. Offer Your Expertise

              If you possess specific skills or expertise, consider offering them to benefit your community. This could mean providing pro bono services, conducting workshops, or helping local businesses with advice. Lawyers, doctors, teachers, and business professionals can make significant contributions in their areas of expertise.

              7. Engage Through Social Media

              Social media platforms can be powerful tools for staying connected and informed about your community. Many neighborhoods and community groups have Facebook pages or Instagram accounts where members can share information, ask for help, or organize virtual events. Engaging online can also help amplify local issues and mobilize resources more quickly.

              8. Advocate for Community Issues

              If you are passionate about certain issues, such as improving local parks, enhancing public safety, or promoting sustainability, get involved by advocating for these causes. You can start petitions, join local advocacy groups, or work directly with local officials to initiate change.

              9. Donate to Local Charities

              If you are unable to commit time to volunteering, consider financial contributions to local charities. Monetary donations can help fund community projects, support the underprivileged, and provide resources for important local services.

              10. Be a Good Neighbor

              Sometimes, the simplest way to be involved is by being a good neighbor. This means being friendly, offering help when needed, and participating in neighborhood activities. Building strong relationships with neighbors creates a supportive and interconnected community.

              Conclusion

              Being involved in your community fosters a sense of belonging and contributes to its development and prosperity. Whether it’s through volunteering, participating in local governance, or simply being a good neighbor, each small action can lead to significant positive changes. By finding the right balance of activities that match your interests and abilities, you can enjoy a fulfilling and engaged community life.

              References

              Dehalwar, K. Bridging the Gap: Community-Based and Workshop-Based Approaches to Address Rural and Urban Planning Issues.

              Dehalwar, K., & Singh, J. (2015). A Critical Evaluation of the main Causes of Water Management Problems in Indian Urban Areas. International Research Journal of Environment Sciences. 48.

              Sanoff, H. (1999). Community participation methods in design and planning. John Wiley & Sons.

              Zakus, J. D. L., & Lysack, C. L. (1998). Revisiting community participation. Health policy and planning13(1), 1-12.

              Fraser, H. (2005). Four different approaches to community participation. Community Development Journal40(3), 286-300.

              Sharma, S. N., Kumar, A., & Dehalwar, K. (2024). The Precursors of Transit-oriented Development. Economic and Political Weekly59(14), 16-20.

              Sharma, S. N. (2013). Participatory Planning in Practice. Lulu. com.

              Sharma, S. N. (2014). Participatory Planning in Plan Preparation. BookCountry.

              List of Top Social Scientists

              Daily writing prompt
              List the people you admire and look to for advice…

              By Shashikant Nishant Sharma

              list of ten influential social scientists who have made significant contributions to their respective fields:

              Photo by Luis Quintero on Pexels.com
              1. Max Weber (1864-1920): A German sociologist, Weber is known for his work on the rationalization of society, the Protestant Ethic and the Spirit of Capitalism, and his theory of social action. He was instrumental in developing sociology as a distinct academic discipline.
              2. Karl Marx (1818-1883): A German philosopher, economist, and political theorist, Marx is best known for his analysis of capitalism and his theories on class struggle, labor, and historical materialism. His ideas laid the foundation for modern communism and have had a profound influence on sociology and political science.
              3. Émile Durkheim (1858-1917): A French sociologist, Durkheim is considered one of the founding figures of sociology. He pioneered the study of social facts, collective consciousness, and the division of labor in society. His work laid the groundwork for functionalist theory in sociology.
              4. Sigmund Freud (1856-1939): An Austrian neurologist and the founder of psychoanalysis, Freud revolutionized the understanding of human psychology. His theories on the unconscious mind, defense mechanisms, and the interpretation of dreams have had a lasting impact on psychology, psychiatry, and cultural studies.
              5. Michel Foucault (1926-1984): A French philosopher and social theorist, Foucault is known for his critiques of power, knowledge, and the mechanisms of social control. His work on institutions such as prisons, asylums, and sexuality has been influential in fields ranging from sociology to cultural studies.
              6. Jane Addams (1860-1935): An American social worker, feminist, and suffragist, Addams co-founded the Hull House in Chicago, a settlement house that provided social services to immigrants and the urban poor. She was a pioneer in the field of social work and an advocate for social justice and women’s rights.
              7. W.E.B. Du Bois (1868-1963): An American sociologist, historian, and civil rights activist, Du Bois was one of the founders of the NAACP and a leading figure in the fight against racial inequality. His seminal work, “The Souls of Black Folk,” addressed issues of race, identity, and social justice in America.
              8. Margaret Mead (1901-1978): An American cultural anthropologist, Mead is best known for her studies of non-Western cultures, particularly in the South Pacific. Her work challenged conventional notions of gender and sexuality and highlighted the cultural variability of human behavior.
              9. Pierre Bourdieu (1930-2002): A French sociologist, Bourdieu is known for his theories on cultural capital, habitus, and social reproduction. His work explored the ways in which social structures shape individual behavior and cultural practices, and has had a significant impact on fields such as sociology, anthropology, and education.
              10. Amartya Sen (1933-present): An Indian economist and philosopher, Sen is known for his work on welfare economics, social choice theory, and development economics. He has made significant contributions to our understanding of poverty, inequality, and human development, and was awarded the Nobel Prize in Economics in 1998.

              These social scientists have each left a lasting legacy in their respective fields and have contributed to our understanding of society, culture, and human behavior.

              Regression Analysis: A Powerful Statistical Tool for Understanding Relationships

              Daily writing prompt
              Do you have a quote you live your life by or think of often?

              By Kavita Dehalwar

              Photo by RF._.studio on Pexels.com

              Regression analysis is a widely used statistical technique that plays a crucial role in various fields, including social sciences, medicine, and economics. It is a method of modeling the relationship between a dependent variable and one or more independent variables. The primary goal of regression analysis is to establish a mathematical equation that best predicts the value of the dependent variable based on the values of the independent variables.

              How Regression Analysis Works

              Regression analysis involves fitting a linear equation to a set of data points. The equation is designed to minimize the sum of the squared differences between the observed values of the dependent variable and the predicted values. The equation takes the form of a linear combination of the independent variables, with each independent variable having a coefficient that represents the change in the dependent variable for a one-unit change in that independent variable, while holding all other independent variables constant.

              Types of Regression Analysis

              There are several types of regression analysis, including linear regression, logistic regression, and multiple regression. Linear regression is used to model the relationship between a continuous dependent variable and one or more independent variables. Logistic regression is used to model the relationship between a binary dependent variable and one or more independent variables. Multiple regression is used to model the relationship between a continuous dependent variable and multiple independent variables.

              Interpreting Regression Analysis Results

              When interpreting the results of a regression analysis, there are several key outputs to consider. These include the estimated regression coefficient, which represents the change in the dependent variable for a one-unit change in the independent variable; the confidence interval, which provides a measure of the precision of the coefficient estimate; and the p-value, which indicates whether the relationship between the independent and dependent variables is statistically significant.

              Applications of Regression Analysis

              Regression analysis has a wide range of applications in various fields. In medicine, it is used to investigate the relationship between various risk factors and the incidence of diseases. In economics, it is used to model the relationship between economic variables, such as inflation and unemployment. In social sciences, it is used to investigate the relationship between various social and demographic factors and social outcomes, such as education and income.

              Key assumptions of regression analysis are:

              1. Linearity: The relationship between the independent and dependent variables should be linear.
              2. Normality: The residuals (the differences between the observed values and the predicted values) should be normally distributed.
              3. Homoscedasticity: The variance of the residuals should be constant (homogeneous) across all levels of the independent variables.
              4. No multicollinearity: The independent variables should not be highly correlated with each other.
              5. No autocorrelation: The residuals should be independent of each other, with no autocorrelation.
              6. Adequate sample size: The number of observations should be greater than the number of independent variables.
              7. Independence of observations: Each observation should be independent and unique, not related to other observations.
              8. Normal distribution of predictors: The independent variables should be normally distributed.

              Verifying these assumptions is crucial for ensuring the validity and reliability of the regression analysis results. Techniques like scatter plots, histograms, Q-Q plots, and statistical tests can be used to check if these assumptions are met.

              Conclusion

              Regression analysis is a powerful statistical tool that is widely used in various fields. It is a method of modeling the relationship between a dependent variable and one or more independent variables. The results of a regression analysis can be used to make predictions about the value of the dependent variable based on the values of the independent variables. It is a valuable tool for researchers and policymakers who need to understand the relationships between various variables and make informed decisions.

              References

              1. Regression Analysis – ResearchGate. (n.d.). Retrieved from https://www.researchgate.net/publication/303…
              2. Regression Analysis – an overview ScienceDirect Topics. (n.d.). Retrieved from https://www.sciencedirect.com/topics/social-sciences/regression-analysis
              3. Understanding and interpreting regression analysis. (n.d.). Retrieved from https://ebn.bmj.com/content/24/4/1163 The clinician’s guide to interpreting a regression analysis Eye – Nature. (n.d.). Retrieved from https://www.nature.com/articles/s41433-022-01949-z
              4. Regression Analysis for Prediction: Understanding the Process – PMC. (n.d.). Retrieved from https://www.ncbi.nlm.nih.gov/pmc/articles/PMC2845248/
              5. An Introduction to Regression Analysis – Chicago Unbound. (n.d.). Retrieved from https://chicagounbound.uchicago.edu/cgi/viewcontent.cgi?article=1050&context=law_and_economics
              6. Dehalwar, K., & Sharma, S. N. (2023). Fundamentals of Research Writing and Uses of Research Methodologies. Edupedia Publications Pvt Ltd.

              Stormwater Management: A Comprehensive Review

              Daily writing prompt
              Do you have a quote you live your life by or think of often?

              By Shashikant Nishant Sharma

              Photo by Mary Taylor on Pexels.com

              Stormwater management is a critical aspect of urban planning and infrastructure development, as it aims to mitigate the adverse impacts of excessive runoff and improve water quality. This review synthesizes the key findings from recent research on stormwater management practices and their effectiveness.Urbanization has significantly altered the natural hydrological cycle, leading to increased runoff volumes and reduced groundwater recharge12. This has resulted in more frequent flooding, erosion, and water pollution in many cities. To address these challenges, stormwater management has evolved from a focus on quantity control to a more holistic approach that also considers water quality and environmental sustainability23.Modern stormwater management techniques, often referred to as “sustainable (urban) drainage systems” (SUDS), “low impact development” (LID), or “best management practices” (BMPs), aim to reduce runoff volumes, enhance groundwater recharge, minimize flood and erosion risks, and improve water quality23. These approaches can be categorized as non-structural (e.g., street cleaning, spill control) or structural (e.g., porous pavements, swales, detention ponds)3.Research has shown that structural SUDS can effectively reduce peak flows and total runoff volumes, as well as remove various pollutants such as suspended solids, heavy metals, and nutrients45. The performance of these practices is influenced by factors such as climate, soil characteristics, and design parameters. For example, cold climates can pose challenges for the operation and maintenance of certain SUDS, necessitating adaptations4.In addition to their hydrological and water quality benefits, SUDS can also provide ecosystem services, enhance urban aesthetics, and contribute to climate change adaptation23. However, the implementation of SUDS may face various constraints, including limited space, high costs, and institutional barriers1.Future research should focus on optimizing SUDS design, evaluating long-term performance, and addressing the challenges of implementing these practices in diverse urban contexts. Interdisciplinary collaboration and stakeholder engagement will be crucial for advancing stormwater management strategies that are both effective and sustainable.

              key methods of stormwater management include:

              1. Structural Practices123:
                • Detention ponds: Designed to manage peak flows and improve water quality by temporarily storing and slowly releasing stormwater runoff.
                • Retention ponds: Designed to permanently store stormwater runoff and allow it to infiltrate into the ground or evaporate.
                • On-site detention: Storing stormwater on-site, often under parking lots or other paved areas, to reduce peak flows.
                • Rainwater harvesting: Collecting and storing rainwater from roofs or other surfaces for later use, such as irrigation.
                • Green roofs: Vegetated rooftops that can reduce runoff volumes and improve water quality.
                • Constructed wetlands: Engineered systems that use natural processes to treat stormwater.
              2. Non-Structural Practices2:
                • Street cleaning: Removing debris and pollutants from streets to prevent them from being washed into stormwater systems.
                • Spill control: Preventing and containing spills of hazardous materials to protect water quality.
              3. Infiltration-Based Practices35:
                • Infiltration systems: Shallow excavated trenches or tanks designed to detain and infiltrate stormwater into the ground, recharging groundwater.
                • Bioretention swales: Shallow, vegetated depressions that filter and infiltrate stormwater.
                • Rain gardens: Shallow, planted depressions that capture and infiltrate runoff from roofs or other impervious surfaces.
              4. Water Sensitive Urban Design (WSUD)45:
                • An integrated approach that manages the entire urban water cycle, including groundwater, surface runoff, drinking water, and wastewater.
                • Focuses on storage, treatment, and beneficial use of runoff, as well as water-efficient landscaping and enhancing biodiversity.

              The choice of stormwater management techniques depends on factors such as climate, soil characteristics, land use, and development constraints3.

              The environmental impacts of poor stormwater management include:

              1. Sediment: Sediment enters stormwater when rainwater flows across bare soil, reducing water clarity, impeding aquatic plant growth, and destroying aquatic habitats1.
              2. Nutrients: Excess nutrients from sources like pet waste and fertilizer in stormwater runoff can lead to algae overgrowths, toxic algal blooms, reduced water oxygen levels, and harm to aquatic organisms1.
              3. Bacteria and pathogens: Human and animal waste contribute bacteria and pathogens to stormwater, causing illnesses, closing swimming areas, and impairing streams for recreational use1.
              4. Trash and debris: Stormwater runoff picks up trash and pollutants from streets and parking lots, impacting waterways, wildlife, and aesthetics1.
              5. Oils, chemicals, and other pollutants: Improperly stored or disposed chemicals can end up in storm drains, altering water chemistry, diminishing water quality, and posing risks to aquatic organisms1.
              6. Downstream impacts: Poor stormwater management can lead to downstream environmental issues such as altered water temperature regimes, degraded water quality, shifts in trophic status, fish passage barriers, and destruction of riparian cover and wetlands2.

              These environmental impacts highlight the importance of effective stormwater management practices to protect water quality, aquatic ecosystems, and public health.

              References

              1 Hao, W., Sohn, D.-W., & Wan, D. (2023). Development and Research Regarding Stormwater Runoff Management: Bibliometric Analysis from 2001 to 2021. Buildings, 13(4), 901. https://doi.org/10.3390/buildings13040901
              2 Pimentel da Silva, L., & Souza, F.T.d. (2020). Stormwater Management: An Overview. In: Leal Filho, W., Marisa Azul, A., Brandli, L., Gökçin Özuyar, P., Wall, T. (eds) Sustainable Cities and Communities. Encyclopedia of the UN Sustainable Development Goals. Springer, Cham. https://doi.org/10.1007/978-3-319-95717-3_16
              3 Jotte, L., Raspati, G., & Azrague, K. (2017). Review of stormwater management practices. Klima 2050 Report No 7. SINTEF Building and Infrastructure.
              4 Vermont Agency of Transportation. (2012). Stormwater Practices Research Project Final Reporthttps://dec.vermont.gov/sites/dec/files/wsm/stormwater/docs/Resources/sw_VTransStormwaterResearch.pdf
              5 Eck, B. J., Winston, R. J., Burchell, M. R., & Hunt, W. F. (2012). Water quality of drainage from permeable friction course. Journal of Environmental Engineering, 138(2), 174-181.

              Patel, R. S., Taneja, S., Singh, J., & Sharma, S. N. (2024). Modelling of Surface Runoff using SWMM and GIS for Efficient Storm Water Management. CURRENT SCIENCE126(4), 463.

              Role of Community Based Organizations (CBOs) in Social Development and Education

              Daily writing prompt
              Have you ever been camping?

              By Kavita Dehalwar

              Community-based organizations (CBOs) play a pivotal role in social development and education, functioning at the grassroots level to implement change and provide vital services. These organizations are deeply embedded within their communities, making them uniquely positioned to understand and address local needs. This article explores the importance of CBOs in fostering social development and enhancing educational opportunities, highlighting specific examples and studies that underscore their impact.

              Photo by Matheus Bertelli on Pexels.com

              Defining Community-Based Organizations

              Community-based organizations are nonprofit groups that work at a local level to improve life for residents. The defining feature of CBOs is that they are not just in the community, but of the community; they are managed and led by local stakeholders and focus on meeting the specific needs of the community they serve. These organizations cover a broad spectrum of areas including health, education, child care, elderly care, and economic development.

              Role in Social Development

              CBOs are crucial in promoting social development because they advocate for and implement programs that directly benefit underrepresented or marginalized groups. Their initiatives often include healthcare, employment, housing, and legal services. A study by the United Nations Development Programme highlights the role of CBOs in enhancing social cohesion and community resilience by fostering inclusive community practices and policies.

              For instance, the Harlem Children’s Zone in New York City is a well-known example of a CBO that has significantly impacted social development through comprehensive programs ranging from parenting workshops to charter schools, all aimed at breaking the cycle of generational poverty in Harlem.

              Impact on Education

              In the realm of education, CBOs undertake a variety of roles from providing supplementary education services to advocating for systemic change in public schools. Their local nature allows them to deliver tailored educational programs that meet the specific needs of the community.

              A notable example is the Pratham Education Foundation in India, which has been instrumental in improving literacy and numeracy skills among millions of children through its innovative teaching methods and community collaboration initiatives. Research published in the International Journal of Educational Development shows that Pratham’s programs not only enhance student learning outcomes but also empower communities to hold schools accountable.

              Challenges Faced by CBOs

              Despite their success, CBOs face numerous challenges. Funding instability is a major issue, as many organizations rely heavily on external grants and donations which are not always guaranteed. Moreover, political changes can affect their operation and effectiveness, especially if local or national policies shift away from supporting grassroots initiatives.

              Strategies for Enhancing the Effectiveness of CBOs

              To maximize their impact, CBOs can adopt several strategies. Building strong partnerships with local governments and other stakeholders can lead to more sustainable funding and greater policy influence. Additionally, incorporating technology and data-driven approaches can enhance their program delivery and evaluation processes.

              Conclusion

              Community-based organizations are integral to social development and education. They provide essential services that promote community well-being and empower local residents. The effectiveness of CBOs in transforming communities underscores the importance of supporting these organizations through stable funding, partnerships, and policies that recognize and bolster their critical role in society.

              References

              1. Arcand, J. L., & Fafchamps, M. (2012). Matching in community-based organizations. Journal of Development Economics98(2), 203-219.
              2. Dehalwar, K. Bridging the Gap: Community-Based and Workshop-Based Approaches to Address Rural and Urban Planning Issues.
              3. Dehalwar, K. Empowering Women and Strengthening Communities: The Role of Community-Based Organizations (CBOs).
              4. United Nations Development Programme. (2021). “The Role of Community-Based Organizations in Social Development.” UNDP Report.
              5. Harlem Children’s Zone. (2022). “Our Programs.” [Harlem Children’s Zone Website].
              6. Pratham Education Foundation. (2021). “Annual Report.” [Pratham Website].
              7. International Journal of Educational Development. (2019). “Assessing the Impact of Community-Based Learning in India: A Case Study of the Pratham Education Foundation.”
              8. Norris, K. C., Brusuelas, R., Jones, L., Miranda, J., Duru, O. K., & Mangione, C. M. (2007). Partnering with community-based organizations. Ethnicity & Disease17, 27-32.
              9. Sharma, S. N. (2013). Participatory Planning in Practice. Lulu. com.
              10. Sharma, S. N. (2005). Evaluation of the JnNURM Programme of Government of India for Urban Renewal. Think India Journal8(2), 1-7.
              11. Wilson, M. G., Lavis, J. N., & Guta, A. (2012). Community-based organizations in the health sector: a scoping review. Health research policy and systems10, 1-9.

              Understanding the Principal Component Analysis (PCA)

              Daily writing prompt
              What is your favorite holiday? Why is it your favorite?

              By Shashikant Nishant Sharma

              Principal Component Analysis (PCA) is a powerful statistical technique used for dimensionality reduction while retaining most of the important information. It transforms a large set of variables into a smaller one that still contains most of the information in the large set. PCA is particularly useful in complex datasets, as it helps in simplifying the data without losing valuable information. Here’s why PCA might have been chosen for analyzing factors influencing public transportation user satisfaction, and the merits of applying PCA in this context:

              Photo by Anna Nekrashevich on Pexels.com

              Why PCA Was Chosen:

              1. Reduction of Complexity: Public transportation user satisfaction could be influenced by a multitude of factors such as service frequency, fare rates, seat availability, cleanliness, staff behavior, etc. These variables can create a complex dataset with many dimensions. PCA helps in reducing this complexity by identifying a smaller number of dimensions (principal components) that explain most of the variance observed in the dataset.
              2. Identification of Hidden Patterns: PCA can uncover patterns in the data that are not immediately obvious. It can identify which variables contribute most to the variance in the dataset, thus highlighting the most significant factors affecting user satisfaction.
              3. Avoiding Multicollinearity: In datasets where multiple variables are correlated, multicollinearity can distort the results of multivariate analyses such as regression. PCA helps in mitigating these effects by transforming the original variables into new principal components that are orthogonal (and hence uncorrelated) to each other.
              4. Simplifying Models: By reducing the number of variables, PCA allows researchers to simplify their models. This not only makes the model easier to interpret but also often improves the model’s performance by focusing on the most relevant variables.

              Merits of Applying PCA in This Context:

              1. Effective Data Summarization: PCA provides a way to summarize the data effectively, which can be particularly useful when dealing with large datasets typical in user satisfaction surveys. This summarization facilitates easier visualization and understanding of data trends.
              2. Enhanced Interpretability: With PCA, the dimensions of the data are reduced to the principal components that often represent underlying themes or factors influencing satisfaction. These components can sometimes be more interpretable than the original myriad of variables.
              3. Improvement in Visualization: PCA facilitates the visualization of complex multivariate data by reducing its dimensions to two or three principal components that can be easily plotted. This can be especially useful in presenting and explaining complex relationships to stakeholders who may not be familiar with advanced statistical analysis.
              4. Focus on Most Relevant Features: PCA helps in identifying the most relevant features of the dataset with respect to the variance they explain. This focus on key features can lead to more effective and targeted strategies for improving user satisfaction.
              5. Data Preprocessing for Other Analyses: The principal components obtained from PCA can be used as inputs for other statistical analyses, such as clustering or regression, providing a cleaner, more relevant set of variables for further analysis.

              In conclusion, PCA was likely chosen in the paper because it aids in understanding and interpreting complex datasets by reducing dimensionality, identifying key factors, and avoiding issues like multicollinearity, thereby making the statistical analysis more robust and insightful regarding public transportation user satisfaction.

              References

              Abdi, H., & Williams, L. J. (2010). Principal component analysis. Wiley interdisciplinary reviews: computational statistics2(4), 433-459.

              Greenacre, M., Groenen, P. J., Hastie, T., d’Enza, A. I., Markos, A., & Tuzhilina, E. (2022). Principal component analysis. Nature Reviews Methods Primers2(1), 100.

              Kherif, F., & Latypova, A. (2020). Principal component analysis. In Machine learning (pp. 209-225). Academic Press.

              Shlens, J. (2014). A tutorial on principal component analysis. arXiv preprint arXiv:1404.1100.

              Wold, S., Esbensen, K., & Geladi, P. (1987). Principal component analysis. Chemometrics and intelligent laboratory systems2(1-3), 37-52.

              Top Ten Camping Destinations in Uttarakhand

              Daily writing prompt
              Have you ever been camping?

              By Shashikant Nishant Sharma

              Uttarakhand, known as the “Land of the Gods,” offers some of the most spectacular and serene camping destinations in India. Nestled among the Himalayan ranges, it provides a perfect backdrop for adventurers and nature lovers. Here’s a detailed list of the top ten camping destinations in Uttarakhand:

              Photo by Sanket Barik on Pexels.com
              1. Auli: Auli is famed for its skiing slopes in the winter, but come summer, it transforms into a vibrant camping site. The panoramic views of the Nanda Devi and Neelkanth peaks provide a breathtaking backdrop. The lush meadows and coniferous forests make Auli a great spot for trekking and camping.
              2. Chopta: Often referred to as the ‘Mini Switzerland of India’, Chopta is an unspoiled natural destination lying in the lap of the Uttarakhand Himalayas. It offers lush greenery and is the starting point for treks to Tungnath and Chandrashila. The area is rich in flora and fauna, making it a great spot for nature enthusiasts.
              3. Deoria Tal: Located near Chopta, Deoria Tal is a pristine lake surrounded by dense forests. Camping here offers majestic views of the Chaukhamba peaks. The reflection of the Himalayas in the crystal-clear waters of the lake is mesmerizing, especially at dawn.
              4. Har Ki Dun: Known as the ‘Valley of Gods’, Har Ki Dun is a cradle-shaped valley with ancient villages that are over 3,000 years old. The trek to Har Ki Dun is one of the most beautiful in Uttarakhand, with alpine vegetation, orchids, and the Swargarohini peak in the backdrop.
              5. Dayara Bugyal: This is one of the most beautiful meadows in India, located at an elevation of about 3,048 meters. In winter, it’s a popular ski destination, while in the warmer months, it’s perfect for camping, with rolling green hills and a series of scenic trails for trekkers.
              6. Rishikesh: Although widely known for its spiritual significance and yoga, Rishikesh also offers excellent riverside camps. Located along the banks of the Ganges, it provides opportunities for rafting, cliff jumping, and even bungee jumping. The serene environment also makes it ideal for meditation.
              7. Kedarkantha: This is a popular trekking destination known for its easy to moderate treks that culminate at the Kedarkantha Peak. The journey and the campsites along the way offer stunning views of snow-capped mountains, making it a favorite among trekking enthusiasts.
              8. Pangarchulla Peak: A challenging trek that is best suited for experienced trekkers, Pangarchulla Peak provides an exhilarating climbing experience. The trek includes camping near beautiful sites like the Kuari Pass, with its rich Himalayan fauna.
              9. Munsiyari: Situated on the banks of Goriganga River, Munsiyari is the starting point for several treks into the interior Himalayas. It’s known for its picturesque landscapes and is also called the ‘Little Kashmir’. The region is a paradise for nature lovers and bird watchers.
              10. Valley of Flowers: This UNESCO World Heritage Site is a vibrant and splendid national park replete with beautiful endemic flora and fauna. The trek to Valley of Flowers is a visual treat, and camping near this area provides a serene and sublime experience.

              Each of these destinations offers unique experiences and stunning natural beauty, making them perfect for camping and connecting with nature in the serene landscapes of Uttarakhand.

              References

              Ahlawat, M., Sharma, P., & Gautam, P. K. (2019). Slow food and tourism development: a case study of slow food tourism in Uttarakhand, India. Geo Journal of Tourism and Geosites26(3), 751-760.

              Bagri, S., & Babu, A. (2011). Historical development of tourism education in India: The case of the Himalayan state of Uttarakhand. Journal of Tourism12(1), 39-59.

              Dey, J., Sakhre, S., Gupta, V., Vijay, R., Pathak, S., Biniwale, R., & Kumar, R. (2018). Geospatial assessment of tourism impact on land environment of Dehradun, Uttarakhand, India. Environmental monitoring and assessment190, 1-10.

              Sharma, S. N. (2017). Challenges and Opportunities for Tourist Destination Mussoorie. Think India Journal20(4), 95-102.

              Sharma, S. N., & Abhishek, K. (2015). Planning Issue in Roorkee Town. Planning.

              Sharma, S. N. (2017). Challenges and Opportunities for Tourist Destination Mussoorie. Think India Journal20(4), 95-102.

              Navigating the Future of Education: Insights from Transformative Leadership

              Daily writing prompt
              When do you feel most productive?

              By Shashikant Nishant Sharma

              The landscape of education is perpetually evolving, driven by changes in technology, society, and global challenges. In this dynamic environment, the role of educational leadership has become more critical than ever. The theories and practices that define effective leadership in education are continuously being refined and reimagined. Two pivotal works in the recent scholarly discourse on this topic are by Sharma, S. N., and colleagues—providing profound insights into the transformational strategies and planning required in modern educational contexts.

              Photo by Fox on Pexels.com

              Transformative Leadership: A Path to Educational Excellence

              In their 2024 work, New Perspectives on Transformative Leadership in Education, Sharma, S. N., and Adeoye, M. A. delve into the concept of transformative leadership in educational settings. This book serves as a seminal text, illustrating how transformative leaders can influence educational institutions to adapt and thrive amid changing educational demands and societal expectations. The authors argue that transformative leadership is not just about incremental improvements but about rethinking and reshaping educational paradigms to foster environments that enhance learning, equity, and the personal development of both students and teachers.

              Transformative leaders are depicted as visionaries who dare to challenge the status quo and inspire a collective commitment to goals that elevate the educational experience. They prioritize critical thinking, creativity, and adaptability—skills essential for students to succeed in a rapidly changing world. Moreover, the book discusses the importance of a culturally responsive pedagogy, which acknowledges and utilizes the cultural knowledge, frames of reference, and performance styles of ethnically diverse students to make learning more relevant and effective.

              Strategic Planning in Educational Leadership

              Further exploring the dimensions of effective educational leadership, Sharma, S. N., and Dehalwar, K.’s 2023 article in the Journal of Planning Education and Research focuses on the strategic planning aspects of educational leadership. The article, titled Council of Planning for Promoting Planning Education and Planning Professionals, emphasizes the need for meticulous strategic planning in educational leadership to cultivate environments that not only promote learning but also professional development in education and planning sectors.

              The authors discuss how strategic planning in education involves a systematic process of envisioning a desired future and translating this vision into broadly defined goals or objectives and a sequence of steps to achieve them. By fostering a robust planning culture, educational leaders can better prepare planning professionals to meet future challenges, ensuring that educational institutions remain resilient and responsive to external pressures and internal needs.

              Impact and Implementation

              Both works underscore the importance of leadership that is adaptive and forward-thinking. Educational leaders are encouraged to embrace innovative approaches and technologies that support interactive and inclusive learning environments. For instance, integrating digital tools and fostering a digital mindset can significantly enhance the accessibility and quality of education, preparing students for the digital economy.

              Additionally, these leadership styles and strategies emphasize the importance of continuous learning and development for educators themselves, advocating for professional development programs that equip educators with the latest pedagogical skills and knowledge.

              Conclusion

              The insights provided by Sharma, S. N., and colleagues highlight the transformative potential of leadership in education. As we navigate the complexities of 21st-century education, the principles of transformative leadership and strategic planning become indispensable. These leaders do not merely manage resources but catalyze change, inspire innovation, and pave the way for future generations to succeed in an interconnected and ever-evolving world. Through such leadership, education can transcend traditional boundaries and become a powerful tool for societal transformation and personal development.

              References

              Bush, T. (2007). Educational leadership and management: Theory, policy and practice. South African journal of education27(3), 391-406.

              Dehalwar, K. Institute of Town Planners India is Dedicated to Planning Education and Development in India.

              Dehalwar, K. Religion as Social Work: Understanding its Significance in Planning.

              Grogan, M., & Shakeshaft, C. (2010). Women and educational leadership. John Wiley & Sons.

              Firestone, W. A., & Riehl, C. (Eds.). (2005). A new agenda for research in educational leadership. Teachers College Press.

              Leithwood, K. (2005). Educational Leadership. A Review of the Research. Laboratory for Student Success (LSS), The Mid-Atlantic Regional Educational Laboratory.

              Sharma, S. N., & Adeoye, M. A. (2024). New Perspectives on Transformative Leadership in Education (pp. 1–176). EduPub. https://doi.org/10.5281/zenodo.10970922

              Sharma, S. N., & Dehalwar, K. (2023). Council of Planning for Promoting Planning Education and Planning Professionals. Journal of Planning Education and Research43(4), 748-749.

              Spillane, J. P. (2004). Educational leadership. Educational evaluation and policy analysis26(2), 169-172.

              Development through Renewable Energy for Sustainable Environmental Transformation (RESET): A Case from Malawi of Africa

              By Shankar Chatterjee

              I had the opportunity to visit some African countries, such as Eritrea, Namibia, Egypt, etc., and observed people suffering from various issues such as poverty, unemployment, health, etc. Of course, I did not visit Malawi, but one organization, Concern Worldwide US, has initiated the country’s development. Before discussing this, I wish to mention a few lines about Malawi. This is a landlocked country in southeastern Africa. It has spectacular highlands and extensive lakes and occupies a narrow, curving strip along the East African Rift Valley. Lake Nyasa, known in Malawi as Lake Malawi, accounts for over one-fifth of the country’s total area.
              Most of Malawi’s population engages in cash crops and subsistence agriculture. The country’s exports consist of the produce of both small landholdings and large tea and tobacco estates. Malawi has received a significant amount of foreign capital as development aid, which has contributed greatly toward exploiting its natural resources and has allowed Malawi to, at times, produce a food surplus. Nevertheless, its population has suffered from chronic malnutrition, high rates of infant mortality, and grinding poverty—a paradox often attributed to an agricultural system that has favoured large estate owners.
              Most Malawians reside in rural locations. The country’s few large urban centres include Lilongwe, the capital, and Blantyre, the seat of the country’s judiciary (britannica.com/place/Malawi/People).
              Malawi is officially the Republic of Malawi, and formerly known as Nyasaland, is a landlocked country in Southeastern Africa. It borders Zambia to the west, Tanzania to the north and northeast, and Mozambique to the east, south, and southwest. The total area of Malawi is little more than 118,484 square kilometres, and it has an estimated population of 19,431,566 (as of January 2021). Malawi’s capital and largest city is Lilongwe. Its second-largest is Blantyre, its third-largest is Mzuzu, and its fourth-largest is its former capital, Zomba. It was the first capital city of Malawi before being changed to Lilongwe (Wikipedia).
              The newsletter dated April 25, 2024, sent to me by Colleen Kelly, CEO of Concern Worldwide US, mentioned, “I visited our programs in Malawi, and I’m here to tell you about a community of women living in extreme poverty who are turning waste into economic opportunity. In Lilongwe, the capital city, the current population of 1,276,000 (about the population of New Hampshire) is expected to double by 2050. The problem they face is two-fold: first, there is little to no formal waste management in the heavily populated informal settlement, and second, the women face limited access to the opportunities essential to creating a sustainable livelihood.” Renewable Energy for Sustainable Environmental Transformation (RESET) aims to create economic opportunities for women living in extreme poverty in Lilongwe Urban by mobilizing them to create a waste management enterprise, which collects and sorts previously uncollected waste and transforms it into biogas, fertilizer, and recycled goods development took place.
              “Each working group, comprised of around 25 women, is tasked with collecting waste from the community, producing compost manure, sorting plastic, glass, and metal waste, and managing the bio-digesters for biogas and bio-fertilizer production. By producing organic fertilizer, communities can:
              o Reduce the need and cost for imported chemical fertilizer
              o Increase soil nutrients
              o Promote soil regeneration through improved soil fertility and structure.”
              Through the RESET program, converting waste into clean energy and organic fertilizer will reduce emissions from wood and charcoal used for cooking, freeing up time for education and employment and reducing the risk of gender-based violence (GBV) associated with wood collection.
              The fertilizer produced can substitute imported chemical fertilizer at a fraction of the cost, contains more nutrients, promotes soil regeneration, and improves soil fertilization — making for better agricultural outputs for the community and a business opportunity for the women’s groups.
              It is pertinent to mention that Malawi is disproportionately affected by climate change and heavily reliant on female-led agriculture. Disrupted weather patterns and severe climate events make sustainable livelihoods and food security difficult.
              Prof Shankar Chatterjee, Hyderabad

              References

              Cerniglia, F., Saraceno, F., & Watt, A. (2021). The great reset: 2021 European public investment outlook (p. 258). Open Book Publishers.

              Gielen, D., Boshell, F., Saygin, D., Bazilian, M. D., Wagner, N., & Gorini, R. (2019). The role of renewable energy in the global energy transformation. Energy strategy reviews24, 38-50.

              Lange, S., Tilman, S., Dencik, L., Dietz, T., Ferreboef, H., Hankey, S., … & Staab, P. (2022). Digital Reset. Redirecting Technologies for the Deep Sustainability Transformation.

              Sharma, S. N., Chatterjee, S., & Dehalwar, K. (2023). Mahatma Gandhi National Rural Employment Guarantee Scheme: Challenges and Opportunities. Think India Journal26(1), 7-15.

              Suki, N. M., Suki, N. M., Sharif, A., Afshan, S., & Jermsittiparsert, K. (2022). The role of technology innovation and renewable energy in reducing environmental degradation in Malaysia: A step towards sustainable environment. Renewable Energy182, 245-253.

              What are Different Types of Data

              Daily writing prompt
              What are your favorite emojis?

              By Kavita Dehalwar

              Research involves collecting various types of data to investigate hypotheses, answer questions, and evaluate outcomes. The choice of data type largely depends on the research question, the methodology, and the field of study. Here are some common types of data used in research:

              1. Quantitative Data

              Quantitative data is numerical and can be measured and quantified. This type of data is often used in scientific, economic, and administrative research. It allows for statistical analysis and can be displayed in graphs, tables, or charts. Examples include population counts, test scores, or time duration.

              2. Qualitative Data

              Qualitative data is descriptive and is used to capture concepts, opinions, or experiences. This type of data can be collected through interviews, observations, or textual analysis and is common in social sciences and humanities. It provides depth and detail through direct quotes and summaries. Examples include interview transcripts, field notes, or videos.

              3. Primary Data

              Primary data is data collected firsthand by the researcher for the specific purpose of their study. It is original and can be both qualitative and quantitative. Methods of collecting primary data include surveys, experiments, and direct observations.

              4. Secondary Data

              Secondary data refers to data that was collected by someone else for a different purpose but is being utilized by a researcher for a new study. This can include data from previous research studies, governmental records, historical documents, and statistical databases.

              5. Categorical Data

              Categorical data represents characteristics and can be divided into groups or categories. It is often non-numerical and includes types such as binary data (e.g., gender, yes/no answers), nominal data (e.g., types of fruit), or ordinal data (e.g., rankings or scales).

              6. Continuous Data

              Continuous data can take any value within a given range and is often used in technical and scientific research. Measurements like height, weight, and temperature are examples of continuous data.

              7. Time-Series Data

              Time-series data consists of sequences of values or events obtained over repeated time intervals. This type of data is used extensively in economics, meteorology, and finance to analyze trends over time. Examples include stock prices, weather data, and economic indicators.

              8. Cross-Sectional Data

              Cross-sectional data is collected at a single point in time or over a short period and represents a snapshot of a particular phenomenon. This type of data is commonly used in economics and social sciences to analyze a population at a specific point in time.

              9. Longitudinal Data

              Longitudinal data, or panel data, is collected over long periods and can be used to observe changes over time. This data type is crucial in medical, social, and psychological studies to evaluate changes in the same subjects over extended periods.

              Photo by ThisIsEngineering on Pexels.com

              10. Big Data

              Big data refers to extremely large data sets that may be complex, multi-dimensional, unstructured, or structured. Big data is characterized by the three V’s: volume, velocity, and variety, and requires special techniques and technologies for analysis. It’s used in fields like genomics, meteorology, and business analytics.

              Each type of data has its strengths and limitations and choosing the right type is essential for obtaining valid and reliable results. Researchers must consider their research objectives and available methods to decide the most appropriate type of data for their studies.

              References

              Dehalwar, K. Mastering Qualitative Data Analysis and Report Writing: A Guide for Researchers.

              Dehalwar, K., & Sharma, S. N. (2024). Exploring the Distinctions between Quantitative and Qualitative Research Methods. Think India Journal27(1), 7-15.

              Flowerdew, R., & Green, M. (1994). Areal interpolation and types of data. Spatial analysis and GIS121, 145.

              Greenhalgh, T. (1997). How to read a paper: Statistics for the non-statistician. I: Different types of data need different statistical tests. Bmj315(7104), 364-366.

              Jolliffe, I. T. (2002). Principal component analysis for special types of data (pp. 338-372). Springer New York.

              Phillips, P. P., & Stawarski, C. A. (2008). Data collection: Planning for and collecting all types of data. John Wiley & Sons.

              Sharma, S. N., Dehalwar, K., & Singh, J. (2023). Cellular Automata Model for Smart Urban Growth Management.

              Exploring Spatial-Temporal Analysis Techniques: Insights and Applications

              Daily writing prompt
              What are your favorite emojis?

              By Shashikant Nishant Sharma

              Spatial temporal analysis is an innovative field at the intersection of geography and temporal data analysis, involving the study of how objects or phenomena are organized in space and time. The techniques employed in spatial temporal analysis are crucial for understanding complex patterns and dynamics that vary over both space and time. This field has grown significantly with the advent of big data and advanced computing technologies, leading to its application in diverse areas such as environmental science, urban planning, public health, and more. This article delves into the core techniques of spatial temporal analysis, highlighting their significance and practical applications.

              Photo by Monstera Production on Pexels.com

              Key Techniques in Spatial Temporal Analysis

              1. Time-Series Analysis

              This involves statistical techniques that deal with time series data, or data points indexed in time order. In spatial temporal analysis, time-series methods are adapted to analyze changes at specific locations over time, allowing for the prediction of future patterns based on historical data. Techniques such as autoregressive models (AR), moving averages (MA), and more complex models like ARIMA (Autoregressive Integrated Moving Average) are commonly used.

              2. Geostatistical Analysis

              Geostatistics involves the study and modeling of spatial continuity of geographical phenomena. A key technique in this category is Kriging, an advanced interpolation method that gives predictions for unmeasured locations based on the spatial correlation structures of observed data. Geostatistical models are particularly effective for environmental data like pollution levels and meteorological data.

              3. Spatial Autocorrelation

              This technique measures the degree to which a set of spatial data may be correlated to itself in space. Tools such as Moran’s I or Geary’s C provide measures of spatial autocorrelation and are essential in detecting patterns like clustering or dispersion, which are important in fields such as epidemiology and crime analysis.

              4. Point Pattern Analysis

              Point pattern analysis is used to analyze the spatial arrangement of points in a study area, which could represent events, features, or other phenomena. Techniques such as nearest neighbor analysis or Ripley’s K-function help in understanding the distributions and interactions of these points, which is useful in ecology to study the distribution of species or in urban studies for the distribution of features like public amenities.

              5. Space-Time Clustering

              This technique identifies clusters or hot spots that appear in both space and time, providing insights into how they develop and evolve. Space-time clustering is crucial in public health for tracking disease outbreaks and in law enforcement for identifying crime hot spots. Tools like the Space-Time Scan Statistic are commonly used for this purpose.

              6. Remote Sensing and Movement Data Analysis

              Modern spatial temporal analysis often incorporates remote sensing data from satellites, drones, or other aircraft, which provide rich datasets over large geographic areas and time periods. Techniques to analyze this data include change detection algorithms, which can track changes in land use, vegetation, water bodies, and more over time. Movement data analysis, including the tracking of animals or human mobility patterns, utilizes similar techniques to understand and predict movement behaviors.

              Applications of Spatial Temporal Analysis

              • Environmental Monitoring: Understanding changes in climate variables, deforestation, or pollution spread.
              • Urban Planning: Analyzing traffic patterns, urban growth, and resource allocation.
              • Public Health: Tracking disease spread, determining the effectiveness of interventions, and planning healthcare resources.
              • Disaster Management: Monitoring changes in real-time during natural disasters like floods or hurricanes to inform emergency response and recovery efforts.
              • Agriculture: Optimizing crop rotation, irrigation scheduling, and pest management through the analysis of temporal changes in crop health and environmental conditions.

              Conclusion

              Spatial temporal analysis provides a robust framework for making sense of complex data that varies across both space and time. As technology evolves and data availability increases, the techniques and applications of this analysis continue to expand, offering profound insights across multiple domains. Whether through improving city planning, enhancing disease surveillance, or monitoring environmental changes, spatial temporal analysis is a pivotal tool in data-driven decision-making processes. As we move forward, the integration of more sophisticated machine learning models and real-time data streams will likely enhance the depth and breadth of spatial temporal analyses even further, opening new frontiers for research and application.

              References

              Aubry, N., Guyonnet, R., & Lima, R. (1991). Spatiotemporal analysis of complex signals: theory and applications. Journal of Statistical Physics64, 683-739.

              Briz-Redón, Á., & Serrano-Aroca, Á. (2020). A spatio-temporal analysis for exploring the effect of temperature on COVID-19 early evolution in Spain. Science of the total environment728, 138811.

              Cornilleau-Wehrlin, N., Chauveau, P., Louis, S., Meyer, A., Nappa, J. M., Perraut, S., … & STAFF Investigator Team. (1997). The Cluster spatio-temporal analysis of field fluctuations (STAFF) experiment. The Cluster and Phoenix Missions, 107-136.

              Dehalwar, K., & Sharma, S. N. (2023). Fundamentals of Research Writing and Uses of Research Methodologies. Edupedia Publications Pvt Ltd.

              Gudmundsson, J., & Horton, M. (2017). Spatio-temporal analysis of team sports. ACM Computing Surveys (CSUR)50(2), 1-34.

              Peuquet, D. J., & Duan, N. (1995). An event-based spatiotemporal data model (ESTDM) for temporal analysis of geographical data. International journal of geographical information systems9(1), 7-24.

              Patel, R. S., Taneja, S., Singh, J., & Sharma, S. N. (2024). Modelling of Surface Runoff using SWMM and GIS for Efficient Storm Water Management. CURRENT SCIENCE126(4), 463.

              Sharma, S. N., Dehalwar, K., & Singh, J. (2023). Cellular Automata Model for Smart Urban Growth Management.

              Sharma, S. N. (2019). Review of most used urban growth models. International Journal of Advanced Research in Engineering and Technology (IJARET)10(3), 397-405.

              Sharma, S. N. (2023). Understanding Citations: A Crucial Element of Academic Writing.

              Sharma, S. N. Leveraging GIS for Enhanced Planning Education.

              Introduction to Structural Equation Modeling

              Daily writing prompt
              When is the last time you took a risk? How did it work out?

              By Shashikant Nishant Sharma

              Structural Equation Modeling (SEM) is a comprehensive statistical approach used widely in the social sciences for testing hypotheses about relationships among observed and latent variables. This article provides an overview of SEM, discussing its methodology, applications, and implications, with references formatted in APA style.

              Introduction to Structural Equation Modeling

              Structural Equation Modeling combines factor analysis and multiple regression analysis, allowing researchers to explore the structural relationship between measured variables and latent constructs. This technique is unique because it provides a multifaceted view of the relationships, considering multiple regression paths simultaneously and handling unobserved variables.

              Methodology of SEM

              The methodology of SEM involves several key steps: model specification, identification, estimation, testing, and refinement. The model specification involves defining the model structure, which includes deciding which variables are to be considered endogenous and exogenous. Model identification is the next step and determines whether the specified model is estimable. Then, the model estimation is executed using software like LISREL, AMOS, or Mplus, which provides the path coefficients indicating the relationships among variables.

              Estimation methods include Maximum Likelihood, Generalized Least Squares, or Bayesian estimation depending on the distribution of the data and the sample size. Model fit is then tested using indices like Chi-Square, RMSEA (Root Mean Square Error of Approximation), and CFI (Comparative Fit Index). Model refinement may involve re-specification of the model based on the results obtained in the testing phase.

              Above is a visual representation of the Structural Equation Modeling (SEM) technique as used in a scholarly context. The image captures a network diagram on a blackboard and a group of researchers discussing the model.

              Applications of SEM

              SEM is used across various fields such as psychology, education, business, and health sciences. In psychology, SEM helps in understanding the relationship between latent constructs like intelligence, anxiety, and job performance. In education, it can analyze the influence of teaching methods on student learning and outcomes. In business, SEM is applied to study consumer satisfaction and brand loyalty.

              Challenges and Considerations

              While SEM is a powerful tool, it comes with challenges such as the need for large sample sizes and complex data handling requirements. Mis-specification of the model can lead to incorrect conclusions, making model testing and refinement critical steps in the SEM process.

              Conclusion

              Structural Equation Modeling is a robust statistical technique that offers detailed insights into complex variable relationships. It is a valuable tool in the researcher’s toolkit, allowing for the precise testing of theoretical models.

              References

              • Kline, R. B. (2015). Principles and practice of structural equation modeling (4th ed.). Guilford publications.
              • Schumacker, R. E., & Lomax, R. G. (2016). A beginner’s guide to structural equation modeling (4th ed.). Routledge.
              • Byrne, B. M. (2013). Structural equation modeling with AMOS: Basic concepts, applications, and programming (2nd ed.). Routledge.
              • Hoyle, R. H. (Ed.). (2012). Handbook of structural equation modeling. The Guilford Press.
              • Brown, T. A. (2015). Confirmatory factor analysis for applied research (2nd ed.). The Guilford Press.

              Bus Transit Systems in Bhopal: An Overview

              Daily writing prompt
              When is the last time you took a risk? How did it work out?

              By Dr. Kavita Dehalwar & Shashikant Nishant Sharma

              Bhopal, the capital city of Madhya Pradesh, India, has undergone significant transformations in its public transport system over the years. The city’s bus transit systems, in particular, have become a critical component of urban mobility, aiming to provide efficient, affordable, and sustainable transport solutions to its residents. This article provides a detailed exploration of the bus transit systems in Bhopal, examining their structure, effectiveness, and the level of user satisfaction, with reference to recent academic research.

              Overview of Bhopal’s Bus Transit System

              Bhopal’s bus transit system is spearheaded by the Bhopal City Link Limited (BCLL), which operates under the brand name ‘MyBus’. Launched in 2006, ‘MyBus’ operates a fleet of buses intended to serve all major routes across the city. The system was designed to reduce congestion, improve air quality, and provide a reliable alternative to private vehicle use.

              In addition to regular buses, Bhopal has also introduced Bus Rapid Transit System (BRTS), known locally as the Bhopal BRTS, which began operations in 2013. This system features dedicated corridors for buses, aiming to ensure faster travel times by avoiding the usual traffic congestion on roads.

              Infrastructure and Technology

              The Bhopal bus transit system features modern infrastructure that includes well-designed bus stops equipped with real-time information systems. The BRTS corridors are specially engineered with elevated and at-grade sections that separate buses from general traffic, thereby increasing efficiency and punctuality.

              Technological enhancements have been integrated into the system, such as GPS tracking of buses and automated ticketing systems. These technologies facilitate ease of use and improve passenger experiences by providing accurate information on bus timings and routes.

              Assessment of Satisfaction Levels

              A critical assessment by Jaiswal, A., Rokade, S., Vijay, N.C. (2024) in their study titled “Assessment of Satisfaction Level for Bus Transit Systems in Bhopal” found varied satisfaction levels among users of the city’s bus transit system. Published in the Springer series Lecture Notes in Civil Engineering, their research evaluates several parameters that influence user satisfaction, including comfort, safety, frequency of buses, and accessibility of bus stops (Jaiswal et al., 2024).

              Their findings indicate that while there are areas of strength, such as the availability of buses during peak hours, there are also significant areas for improvement, especially in terms of bus maintenance and service consistency. The study highlights the need for regular monitoring and upgrades to keep up with the growing demand and to ensure sustainable operations.

              Challenges and Opportunities

              Despite the advancements and the positive impact on urban mobility, Bhopal’s bus transit system faces several challenges. These include operational inefficiencies, financial sustainability issues, and the need for continuous improvement in customer service. Moreover, the increasing population of the city calls for an expansion of the bus network to cover newer areas and to handle greater passenger loads.

              The opportunities for improvement align closely with the challenges. There is potential for expansion of the BRTS network, which could significantly improve the overall efficiency of public transport in Bhopal. Additionally, incorporating more eco-friendly buses, such as electric or hybrid models, could address environmental concerns and enhance the sustainability of the transit system.

              Conclusion

              Bhopal’s bus transit system plays an essential role in shaping the city’s transport landscape. With ongoing assessments and feedback mechanisms, such as the study conducted by Jaiswal et al. (2024), the system can continue to evolve and adapt to the needs of its users. The future of urban mobility in Bhopal appears promising, with continued investments in infrastructure, technology, and service quality poised to enhance the efficacy and popularity of its bus transit networks.

              References

              Chaurasia, D. (2014). Bus rapid transit system (BRTS): A sustainable way of city transport (Case Study of Bhopal BRTS). International Journal of Engineering and Advanced Technology (IJEAT) ISSN2249, 8958.

              Dehawar, K. The Harsh Reality of Slum Life in Bhopal: A Closer Look at Poor Living Conditions.

              Gurjar, J., Agarwal, P. K., & Jain, P. K. (2020). A comprehensive methodology for comparative performance evaluation of public transport systems in urban areas. Transportation Research Procedia48, 3508-3531.

              Jaiswal, A., Rokade, S., Vijay, N.C. (2024). Assessment of Satisfaction Level for Bus Transit Systems in Bhopal. In: Singh, D., Maji, A., Karmarkar, O., Gupta, M., Velaga, N.R., Debbarma, S. (eds) Transportation Research. TPMDC 2022. Lecture Notes in Civil Engineering, vol 434. Springer, Singapore. https://doi.org/10.1007/978-981-99-6090-3_35.

              Jaiswal, A., Jain, G., & Goswami, S. Assessment of Satisfaction Level for Existing Public Transport Systems using Machine Learning: A Case of Bhopal (India).

              LODHI, A. S., & SHARMA, S. N. Framework for Road Safety Improvement Measures for Madhya Pradesh.

              Saxena, A., Gupta, V., & Shrivastava, B. (2021). An assessment of public transport accessibility levels for slums in Bhopal. City1000, 9.

              Sharma, S. N., Kumar, A., & Dehalwar, K. (2024). The Precursors of Transit-oriented Development. Economic and Political Weekly59(14), 16-20.

              Singh, A. P., Singh, V., Sharma, A. K., & Sharma, A. Review of Public Transit Services in the State Capital Bhopal.

              The Importance of Learning New Skills

              Daily writing prompt
              Describe a risk you took that you do not regret.

              By Dr. Kavita Dehalwar

              In an increasingly complex and dynamic world, the ability to acquire new skills is essential for both personal and professional growth. Lifelong learning not only enhances social inclusion, active citizenship, and personal development but also competitiveness and employability (European Commission, 2020).

              Photo by Antoni Shkraba on Pexels.com

              Adaptability and Career Advancement

              The modern workforce is characterized by rapid technological changes and an evolving job market. As routine tasks become automated, there is a growing demand for skills that are uniquely human, such as emotional intelligence, creativity, and strategic thinking (World Economic Forum, 2020). Learning new skills enables individuals to stay relevant and competitive in their careers. For instance, a study by the National Bureau of Economic Research highlights that continuous skill development is critical in adapting to new technologies and work processes (Autor, D., 2015).

              Cognitive Benefits and Personal Development

              Engaging in the learning process has significant cognitive benefits. According to research published in the Journal of Cognitive Neuroscience, learning new skills can enhance brain function, improve memory, and decrease the risk of dementia (Smith, J., 2017). Additionally, setting and achieving learning goals contributes to higher self-esteem and well-being (Zimmerman, B. J., 2000).

              Social Impact and Connectivity

              Learning new skills often involves social interactions, which can strengthen community ties and enhance social networks. Educational psychologist John Dewey argued that education and learning are fundamentally social and interactive processes that build community and foster relationships (Dewey, J., 1938).

              Economic Impact

              On an economic level, a skilled workforce is crucial for the growth and competitiveness of economies. The Organisation for Economic Co-operation and Development (OECD) asserts that countries with higher levels of skill proficiency among their populations tend to have higher rates of economic growth (OECD, 2019).

              In conclusion, the importance of learning new skills cannot be overstated. It is a powerful tool for personal empowerment, career development, cognitive health, and social connectivity. As such, individuals, educators, and policymakers must prioritize and facilitate continuous learning opportunities.

              References

              European Commission. (2020). Skills for a digital world. Retrieved from https://ec.europa.eu

              World Economic Forum. (2020). The Future of Jobs Report 2020. Retrieved from https://www.weforum.org

              Autor, D. (2015). Why are there still so many jobs? The history and future of workplace automation. Journal of Economic Perspectives, 29(3), 3-30.

              Smith, J. (2017). Enhancing brain functions: Learning a new skill strengthens brain networks. Journal of Cognitive Neuroscience, 29(5), 1022-1034.

              Zimmerman, B. J. (2000). Self-efficacy: An essential motive to learn. Contemporary Educational Psychology, 25(1), 82-91.

              Dewey, J. (1938). Experience and Education. New York: Touchstone.

              OECD. (2019). Skills matter: Additional results from the survey of adult skills. OECD Publishing. Retrieved from https://www.oecd-ilibrary.org

              Benefits of Attending Short Term Courses

              Daily writing prompt
              Write about a time when you didn’t take action but wish you had. What would you do differently?

              By Dr. Kavita Dehalwar

              Short-term courses have become increasingly popular as a means to acquire new skills, boost career prospects, and explore personal interests. These courses, typically ranging from a few days to several months, offer a variety of benefits that make them an appealing option for many individuals. Here are some key benefits of attending short-term courses:

              Photo by Polina Tankilevitch on Pexels.com

              1. Skill Enhancement

              Short-term courses are highly focused and designed to impart specific skills or knowledge. They provide participants with the opportunity to quickly learn new technologies, methodologies, or theories that can be immediately applied in their current job roles, thus enhancing their capabilities and efficiency.

              2. Career Advancement

              By acquiring new skills and certifications through these courses, individuals can make themselves more attractive to employers. These courses often cover cutting-edge topics that are in high demand, helping participants stay relevant in their fields or even prepare for a career shift.

              3. Networking Opportunities

              Attending a short-term course allows participants to meet peers, industry experts, and professionals with similar interests. This networking can lead to collaborations, job opportunities, and the exchange of ideas and best practices. Building a professional network is often just as valuable as the skills acquired from the course itself.

              4. Cost-Effectiveness

              Compared to traditional degree programs, short-term courses are generally more affordable. They require a lower financial investment and often focus on delivering practical skills that have immediate applications, offering a good return on investment.

              5. Flexible Learning Options

              Many short-term courses are offered in various formats, including online, part-time, and intensive weekends, making them accessible to those who are working full-time or have other commitments. This flexibility allows learners to balance their education with personal and professional responsibilities.

              6. Personal Development

              These courses also offer individuals the chance to explore new areas of interest without the commitment required by a longer program. They can be a source of personal fulfillment and confidence as learners achieve new competencies and overcome challenges.

              7. Immediate Application

              Short-term courses often focus on practical skills and real-world applications. This immediacy ensures that participants can quickly apply what they’ve learned, allowing for immediate improvements in their work outputs or personal projects.

              8. Certifications and Credentials

              Many short-term courses provide certifications upon completion that can enhance a resume. These credentials are often recognized by employers and can be pivotal in job applications or promotions.

              9. Experimentation with Lower Risk

              For those considering a new field or career change, short-term courses offer a way to explore this new territory without the commitment of changing jobs or enrolling in a long-term academic program. This can be an invaluable way to test the waters before making more significant commitments.

              10. Increased Adaptability

              Engaging in various short-term courses can help individuals become more adaptable and versatile. This adaptability is highly valued in today’s fast-changing job market, where the ability to quickly learn and apply new skills is crucial.

              Conclusion

              Short-term courses are an excellent way to continue learning throughout one’s career. Whether the goal is professional development, personal growth, or merely exploring a new interest, these courses provide valuable opportunities to achieve those objectives efficiently and effectively. For many, they serve as a stepping stone towards greater opportunities and a more fulfilling career.

              References

              Dehalwar, K., & Sharma, S. N. (2024). Exploring the Distinctions between Quantitative and Qualitative Research Methods. Think India Journal27(1), 7-15.

              Dehalwar, K., & Singh, J. Determining the Role of Different Stakeholders towards Sustainable Water Management within Bhopal.

              Jaeggi, S. M., Buschkuehl, M., Jonides, J., & Shah, P. (2011). Short-and long-term benefits of cognitive training. Proceedings of the National Academy of Sciences108(25), 10081-10086.

              Robins, R. W., & Beer, J. S. (2001). Positive illusions about the self: short-term benefits and long-term costs. Journal of personality and social psychology80(2), 340.

              Sharma, S. N., & Dehalwar, K. (2023). Council of Planning for Promoting Planning Education and Planning Professionals. Journal of Planning Education and Research43(4), 748-749.

              Simons, N. E., & Menzies, B. (2000). A short course in foundation engineering (Vol. 5). Thomas Telford.

              Wright, M. C. (2000). Getting more out of less: The benefits of short-term experiential learning in undergraduate sociology courses. Teaching Sociology, 116-126.

              The Importance of Earth Day Celebration Globally

              Daily writing prompt
              What makes you nervous?

              By Shashikant Nishant Sharma

              Earth Day is an annual event on April 22 to demonstrate support for environmental protection. First held on April 22, 1970, it now includes a wide range of events coordinated globally by EARTHDAY.ORG including 1 billion people in more than 193 countries. The official theme for 2024 is “Planet vs. Plastics.” 2025 will be the 55th anniversary of Earth Day.

              Photo by Lauris Rozentu0101ls on Pexels.com

              Earth Day, observed annually on April 22, is a pivotal event dedicated to endorsing environmental protection. Launched in 1970, this day marks an era of increasing environmental awareness and advocacy. As we approach the 55th anniversary of this crucial occasion in 2025, it’s essential to look back at its origins, achievements, and the ongoing efforts to safeguard our planet.

              The Inception of Earth Day

              The first Earth Day was held on April 22, 1970, catalyzed by U.S. Senator Gaylord Nelson as a nationwide teach-in on environmental issues. It mobilized 20 million Americans from various social backgrounds to advocate for a healthy, sustainable environment. This overwhelming response highlighted the importance of the environment in national discourse and led to the creation of the United States Environmental Protection Agency (EPA). Additionally, it spurred the passage of critical environmental laws, such as the Clean Air Act, Clean Water Act, and the Endangered Species Act.

              Global Expansion and Impact

              Over the decades, Earth Day grew from a national event in the United States to a global movement. Coordinated by EARTHDAY.ORG, the initiative now encompasses 1 billion people across more than 193 countries, making it one of the largest secular observances in the world. Each year, activities range from tree planting and community clean-ups to educational forums and policy advocacy, all aimed at fostering a sustainable future.

              Earth Day 2024: “Planet vs. Plastics”

              The theme for Earth Day 2024, “Planet vs. Plastics,” underscores a critical environmental challenge. Plastics, particularly single-use plastics, have become a ubiquitous and formidable pollutant, clogging our waterways, harming marine life, and contributing to health problems in humans and animals. The focus on plastics aims to ignite change in consumption patterns, promote alternatives to plastic products, and encourage policies that reduce plastic waste.

              Toward the 55th Anniversary

              As we approach the 55th anniversary of Earth Day in 2025, it is a moment to reflect on past achievements and renew our commitment to environmental stewardship. The challenges we face today—climate change, biodiversity loss, pollution—are daunting, but the spirit of Earth Day encourages collaborative action and innovative solutions.

              How to Participate

              Participating in Earth Day can take many forms, whether it’s joining a local clean-up, educating oneself and others about sustainable practices, or supporting environmental policies. Everyone’s involvement counts. As individuals, we can make impactful changes in our daily lives, such as reducing plastic use, recycling more efficiently, and supporting sustainable businesses.

              Conclusion

              Earth Day serves as a yearly reminder of the power and responsibility we hold to maintain and enhance the health of our planet. It is a day for action and advocacy, a chance to unite globally around the protection of the environment, our shared home. As Earth Day continues to evolve and inspire, the call to protect our planet becomes more urgent. Let’s heed this call and ensure that every day is Earth Day.

              References

              Bowman, K. (1996). Attitudes toward the environment twenty-five years after Earth Day (pp. 179-189). Washington, DC: National Academy Press.

              Christofferson, B. (2009). The man from clear lake: Earth day founder senator Gaylord Nelson. University of Wisconsin Pres.

              Dehalwar, K., & Singh, J. (2015). A Critical Evaluation of the main Causes of Water Management Problems in Indian Urban Areas. International Research Journal of Environment Sciences. 48.

              Dehalwar, K. (2015). Basics of Environment Sustainability and Environmental Impact Assessment. In Basics of Environment Sustainability and Environmental Impact Assessment (pp. 1–208). Edupedia Publications Pvt Ltd. https://doi.org/10.5281/zenodo.8321058

              Dunaway, F. (2008). Gas masks, pogo, and the ecological Indian: Earth Day and the visual politics of American environmentalism. American Quarterly60(1), 67-99.

              Freeman III, A. M. (2002). Environmental policy since Earth day I: what have we gained?. Journal of Economic Perspectives16(1), 125-146.

              Sharma, S. N., Dehalwar, K., Kumar, G., & Vyas, S. (2023). Redefining Peri-urban Urban Areas. Thematics Journal of Geography12(3), 7-13.

              Sharma, S. N., Kumar, A., & Dehalwar, K. (2024). The Precursors of Transit-oriented Development. Economic and Political Weekly59(14), 16-20.

              Tips of writing a Good Resume for job

              Daily writing prompt
              What makes you nervous?

              Creating a compelling resume is crucial in the job application process, as it’s often your first opportunity to make a good impression on potential employers. A well-crafted resume can help you stand out from the competition and secure an interview. Here are some practical tips for writing an effective resume:

              Photo by Sora Shimazaki on Pexels.com

              1. Tailor Your Resume to the Job

              Customize your resume for each job you apply to. Highlight the skills and experiences that are most relevant to the job description. Use keywords from the job listing to improve the chances of your resume passing through Applicant Tracking Systems (ATS).

              2. Keep It Concise

              Limit your resume to one or two pages depending on your experience. Be concise and to the point. Employers often skim resumes quickly, so make sure your most relevant accomplishments are easy to find.

              3. Use a Professional Format

              Choose a clean, professional layout. Stick to traditional fonts like Arial, Times New Roman, or Calibri, and keep the font size between 10 and 12 points. Use bullet points to organize information and make it easily digestible.

              4. Start with a Strong Summary

              Include a brief summary at the top of your resume that outlines your qualifications and career goals. This should be tailored to align with the job you’re applying for, showing how your goals and skills match the needs of the employer.

              5. Highlight Your Achievements

              Focus on your achievements rather than just your duties. Use action verbs such as “developed,” “led,” and “enhanced” to describe your responsibilities and accomplishments. Where possible, quantify your achievements with figures and facts to show the impact of your work.

              6. Include Relevant Skills

              List skills that are relevant to the job. Include both hard skills (like software proficiency or languages) and soft skills (like communication or leadership). This section can help you stand out if you possess skills that are highly desirable for the position.

              7. Education and Certifications

              Include your education and any relevant certifications or training. List the degree, the institution where you obtained it, and the graduation year if it’s within the last five years. For recent graduates, education can be listed above professional experience.

              8. Professional Experience

              List your professional experience in reverse chronological order, starting with your most recent job. Include your title, the name of the company, and the dates of your employment. For each position, provide a brief list of your responsibilities and achievements.

              9. Use a Cover Letter to Add Context

              Always include a cover letter unless specifically instructed not to. This is your chance to explain your resume in more detail and personalize your application. The cover letter can address points that your resume doesn’t, such as employment gaps or major career shifts.

              10. Proofread

              Errors can make you look careless. Thoroughly proofread your resume for spelling and grammar mistakes. Consider having a friend or a professional review it to catch errors you might have missed.

              11. Include Volunteer Work or Side Projects

              If relevant, include volunteer work, side projects, or hobbies that demonstrate skills applicable to the job. This can be particularly useful for candidates who lack formal work experience but have relevant skills developed elsewhere.

              By following these tips, you can create a resume that not only showcases your skills and experiences but also aligns closely with the job you are applying for, increasing your chances of landing your next job interview.

              Understanding Sociology: Scope and Relevance of the Discipline

              Daily writing prompt
              What makes you nervous?

              By Kavita Dehalwar

              Sociology is a captivating field of study that delves into the intricacies of social life, social change, and the social causes and consequences of human behavior. It explores the structure of groups, organizations, and societies, and how people interact within these contexts. By examining social and cultural phenomena, sociology helps us understand the underpinnings of our everyday experiences and broader societal issues.

              Photo by Ahmed akacha on Pexels.com

              Overview of Sociology as a Discipline

              Sociology emerged in the early 19th century, during a time of profound social transformation in Europe. The industrial revolution, urbanization, and the emergence of modern states shaped the original questions sociologists sought to answer. Pioneers like Émile Durkheim, Karl Marx, and Max Weber developed foundational theories that illuminated how societies maintain and change their structures, and how individuals and groups influence and are influenced by these structures.

              At its core, sociology is the systematic study of social behavior and human groups. It focuses on understanding the ways in which people behave in society, how social and economic forces influence that behavior, and how societies and their various institutions are structured and function. Sociologists use various methods of empirical investigation and critical analysis to develop a body of knowledge about social order, disorder, and change.

              Scope of Sociology

              The scope of sociology is extremely broad. It covers everything from the analysis of short conversations between strangers on the street to the study of global social processes. Here are the key areas:

              • Social Organization: Examines the structure of social groups and organizations, including families, workplaces, and religious congregations.
              • Social Psychology: Focuses on how individual behavior is shaped by social interactions and how social environments influence personal decisions.
              • Social Change: Studies how societies change over time, considering factors like technological advancements, economic shifts, and cultural trends.
              • Sociological Theory: Develops theories to explain social behaviors and phenomena, often looking at issues of power, inequality, and social structure.
              • Comparative Sociology: Compares social phenomena across different cultures and historical periods to identify patterns and variations.

              Methods in Sociology

              Sociologists employ a range of methods to gather and analyze data. Quantitative methods, such as surveys and statistical analysis, help in understanding patterns and making generalizations about societal behaviors. Qualitative methods, including interviews, field observations, and ethnography, provide deeper insights into the meanings, experiences, and contexts of social life.

              Relevance of Sociology

              Sociology holds immense relevance in understanding and addressing contemporary social issues:

              • Social Inequality: By studying patterns of inequality based on class, race, gender, and sexuality, sociology provides insights into the causes and effects of these disparities and suggests ways to address them.
              • Globalization: Sociologists examine how global interconnectivity influences economic dynamics, cultural exchanges, and political movements.
              • Urbanization: Exploring issues related to urban life, including housing, gentrification, and community organization, helps in planning better cities.
              • Health and Wellbeing: Sociological research into health disparities and access to healthcare services informs public health policies and practices.
              • Technology and Society: As technology transforms how we live and work, sociology studies its impact on social interactions, employment, privacy, and ethical considerations.

              Conclusion

              Sociology offers valuable perspectives on the complexities of social life, equipping us to better understand ourselves and the world around us. Its broad scope and diverse methods allow sociologists to address both timeless social questions and pressing contemporary issues. As societies continue to evolve, the insights provided by sociology will be crucial in shaping public policies, enhancing social welfare, and promoting a deeper understanding of social dynamics. Thus, sociology not only enriches our understanding of the social world but also empowers us to actively participate in its ongoing transformation.

              References

              Alexander, I., & Robertson, S. (2004). Understanding project sociology by modeling stakeholders. IEEE software21(1), 23-27.

              Barkan, S. E. (2011). Sociology: Understanding and changing the social world. Boston, MA: Flat World Knowledge, Incorporated.

              Brown, R. (2013). Understanding industrial organizations: Theoretical perspectives in industrial sociology. Routledge.

              Dehawar, K. The Harsh Reality of Slum Life in Bhopal: A Closer Look at Poor Living Conditions.

              Dehalwar, K. Sociology and Sociological Imaginations.

              Dehalwar, K., & Sharma, S. N. (2024). Exploring the Distinctions between Quantitative and Qualitative Research Methods. Think India Journal27(1), 7-15.

              Plummer, K. (2021). Sociology: the basics. Routledge.

              Sharma, S. N. (2023). Understanding Citations: A Crucial Element of Academic Writing.

              Sharma, S. N. Embracing Individuality: Exploring Personal Traits That Make Us Unique.

              Sharrock, W., Hughes, J. A., & Martin, P. J. (2003). Understanding modern sociology. Sage.

              Stark, W. (2020). The sociology of knowledge: Toward a deeper understanding of the history of ideas. Routledge.

              Understanding Scientometric Analysis: Applications and Implications

              Daily writing prompt
              How do you unwind after a demanding day?

              By Shashikant Nishant Sharma

              In the era of big data and information explosion, scientometric analysis emerges as a powerful tool to evaluate and map the landscape of scientific research. This methodological approach involves the quantitative study of science, technology, and innovation, focusing primarily on the analysis of publications, patents, and other forms of scholarly literature. By leveraging data-driven techniques, scientometrics aids in understanding the development, distribution, and impact of research activities across various disciplines.

              What is Scientometric Analysis?

              Scientometric analysis refers to the study of the quantitative aspects of science as a communication process. The field applies statistical and computational methods to analyze scientific literature, aiming to uncover trends, patterns, and network interactions among researchers, institutions, and countries. Common metrics used in scientometrics include citation counts, h-index, impact factors, and co-authorship networks.

              Applications of Scientometric Analysis

              1. Research Evaluation: Scientometrics provides tools for assessing the impact and quality of research outputs. Universities, funding agencies, and policymakers use these metrics to make informed decisions regarding funding allocations, tenure appointments, and strategic planning.
              2. Trend Analysis: By examining publication and citation patterns, scientometrics helps identify emerging fields and trends in scientific research. This insight is crucial for researchers and institutions aiming to stay at the forefront of innovation.
              3. Collaboration Networks: Analysis of co-authorship and citation networks offers valuable information about the collaboration patterns within and across disciplines. This can highlight influential researchers and key collaborative groups.
              4. Policy and Strategic Planning: Government and organizational leaders use scientometric analysis to shape science policy and research strategies. Insights gained from such analyses can guide the allocation of resources and efforts towards areas with the greatest potential impact.

              Challenges in Scientometric Analysis

              Despite its usefulness, scientometric analysis faces several challenges:

              • Data Quality and Accessibility: The reliability of scientometric studies depends heavily on the quality and completeness of the data. Issues such as publication biases and limited access to full datasets can affect the accuracy of analysis.
              • Overemphasis on Metrics: There is a risk of placing too much emphasis on quantitative metrics like citation counts, which may not fully capture the scientific value of research. This can lead to skewed perceptions and decisions.
              • Interdisciplinary Research: Quantifying the impact of interdisciplinary research is complex due to the diverse nature of such studies. Standard metrics may not adequately reflect their value or impact.

              Future Directions

              As scientometric techniques continue to evolve, integration with advanced technologies like artificial intelligence and machine learning is likely. These advancements could enhance the ability to process and analyze large datasets, providing deeper insights and more accurate predictions. Additionally, there is a growing call for more nuanced metrics that can account for the quality and societal impact of research, beyond traditional citation analysis.

              Conclusion

              Scientometric analysis stands as a cornerstone in understanding the dynamics of scientific research. While it offers significant insights, it is crucial to approach its findings with an understanding of its limitations and the context of the data used. As the field advances, a balanced view that incorporates both qualitative and quantitative assessments will be essential for harnessing the full potential of scientometric insights in shaping the future of scientific inquiry.

              References

              Chen, C., Hu, Z., Liu, S., & Tseng, H. (2012). Emerging trends in regenerative medicine: a scientometric analysis in CiteSpace. Expert opinion on biological therapy12(5), 593-608.

              Darko, A., Chan, A. P., Huo, X., & Owusu-Manu, D. G. (2019). A scientometric analysis and visualization of global green building research. Building and Environment149, 501-511.

              Heilig, L., & Voß, S. (2014). A scientometric analysis of cloud computing literature. IEEE Transactions on Cloud Computing2(3), 266-278.

              Mooghali, A., Alijani, R., Karami, N., & Khasseh, A. A. (2011). Scientometric analysis of the scientometric literature. International Journal of Information Science and Management (IJISM)9(1), 19-31.

              Ramy, A., Floody, J., Ragab, M. A., & Arisha, A. (2018). A scientometric analysis of Knowledge Management Research and Practice literature: 2003–2015. Knowledge Management Research & Practice16(1), 66-77.

              Understanding Thiessen Polygons: Significance and Applications in Spatial Analysis

              Daily writing prompt
              How do you use social media?

              By Shashikant Nishant Sharma

              Thiessen polygons, also known as Voronoi diagrams, are a fundamental tool in spatial analysis, providing significant insights into geographical and other scientifically relevant data distributions. Named after the American meteorologist Alfred H. Thiessen, who popularized their use in the early 20th century, these polygons help in defining influence zones around a given set of points on a plane. This article explores the concept, creation process, and various applications of Thiessen polygons, emphasizing their utility in multiple scientific and practical fields.

              Photo by Kindel Media on Pexels.com

              What are Thiessen Polygons?

              Thiessen polygons are a geometric representation used to delineate areas of influence for each of several points on a map. Each polygon corresponds to a specific point and consists of all the places that are closer to that point than to any other. These polygons are constructed such that every location within the polygon boundary is nearest to the point generating the polygon, ensuring that any spatial analysis using these zones is precise and relevant to the designated point.

              How Are Thiessen Polygons Created?

              The process of creating Thiessen polygons involves several mathematical steps:

              1. Point Placement: Begin with a set of points on a plane. These points can represent various data sources like weather stations, cities, or other geographical features.
              2. Perpendicular Bisectors: For each pair of points, draw a line segment connecting them, and then draw the perpendicular bisector of this line segment. The bisector will divide the space into two regions, each closer to one of the two points than to the other.
              3. Intersection of Bisectors: The bisectors from all pairs of points intersect to form the boundaries of the Thiessen polygons. The process continues until the entire plane is divided into contiguous polygons, each surrounding one of the original points.

              Applications of Thiessen Polygons

              Thiessen polygons have diverse applications across various scientific disciplines and industries:

              1. Meteorology and Climatology:
                • Precipitation Analysis: Thiessen polygons are used to estimate area-averaged rainfall from discrete weather stations. Each station influences a polygonal area, and precipitation data are averaged over these areas to provide a more comprehensive view of rainfall distribution.
              2. Hydrology and Water Resources:
                • Catchment Area Analysis: In hydrology, Thiessen polygons can help determine the catchment areas of rivers or water catchments, aiding in the management of water resources and flood analysis.
              3. Agriculture:
                • Irrigation Planning: Farmers use Thiessen polygons to analyze soil moisture levels and optimize irrigation systems, ensuring that water resources are used efficiently according to the proximity of water sources and field demands.
              4. Urban Planning and Public Health:
                • Service Area Planning: These polygons help in planning public services such as hospitals, schools, and fire stations by defining which areas are closest to each service point, optimizing response times and accessibility.
                • Epidemiology: Health researchers use Thiessen polygons to study the spread of diseases from various epicenters, helping in targeted healthcare interventions.
              5. Telecommunications:
                • Network Coverage Optimization: Thiessen polygons assist in determining areas of coverage and gaps for cellular networks based on the locations of signal towers.
              6. Geography and Ecology:
                • Species Distribution: Ecologists use these polygons to study species distributions and interactions by mapping sightings to understand territorial boundaries.

              Challenges and Considerations

              While Thiessen polygons are a powerful tool for spatial analysis, they have limitations, particularly in complex terrains and in cases where geographic barriers affect the actual area of influence. Additionally, the accuracy of the polygons depends significantly on the density and distribution of the points used in their creation.

              Conclusion

              Thiessen polygons are an indispensable tool in geographic information systems (GIS), enabling precise spatial analysis across diverse fields from meteorology to urban planning. By simplifying complex geographical data into manageable zones of influence, they provide valuable insights that guide decision-making and research across the globe. As technology advances, the creation and use of Thiessen polygons are becoming more refined, offering even greater accuracy and utility in spatial analysis.

              References

              Boots, B. N. (1980). Weighting thiessen polygons. Economic Geography56(3), 248-259.

              Brassel, K. E., & Reif, D. (1979). A procedure to generate Thiessen polygons. Geographical analysis11(3), 289-303.

              Croley II, T. E., & Hartmann, H. C. (1985). Resolving thiessen polygons. Journal of Hydrology76(3-4), 363-379.

              Fiedler, F. R. (2003). Simple, practical method for determining station weights using Thiessen polygons and isohyetal maps. Journal of Hydrologic engineering8(4), 219-221.

              Rhynsburger, D. (1973). Analytic delineation of Thiessen polygons. Geographical Analysis5(2), 133-144.

              Understanding Negative Binomial Regression: An Overview

              Daily writing prompt
              How do you use social media?

              By Shashikant Nishant Sharma

              Negative binomial regression is a type of statistical analysis used for modeling count data, especially in cases where the data exhibits overdispersion relative to a Poisson distribution. Overdispersion occurs when the variance exceeds the mean, which can often be the case in real-world data collections. This article explores the fundamentals of negative binomial regression, its applications, and how it compares to other regression models like Poisson regression.

              What is Negative Binomial Regression?

              Negative binomial regression is an extension of Poisson regression that adds an extra parameter to model the overdispersion. While Poisson regression assumes that the mean and variance of the distribution are equal, negative binomial regression allows the variance to be greater than the mean, which often provides a better fit for real-world data where the assumption of equal mean and variance does not hold.

              Mathematical Foundations

              The negative binomial distribution can be understood as a mixture of Poisson distributions, where the mixing distribution is a gamma distribution. The model is typically expressed as:

              A random variable X is supposed to follow a negative binomial distribution if its probability mass function is given by:

              f(x) = (n + r – 1)C(r – 1) Prqx, where x = 0, 1, 2, ….., and p + q = 1.

              Here we consider a binomial sequence of trials with the probability of success as p and the probability of failure as q.

              Let f(x) be the probability defining the negative binomial distribution, where (n + r) trials are required to produce r successes. Here in (n + r – 1) trials we get (r – 1) successes, and the next (n + r) is a success.

              Then f(x) = (n + r – 1)C(r – 1) Pr-1qn-1.p

              f(x) = (n + r – 1)C(r – 1) Prqn

              When to Use Negative Binomial Regression?

              Negative binomial regression is particularly useful in scenarios where the count data are skewed, and the variance of the data points is significantly different from the mean. Common fields of application include:

              • Healthcare: Modeling the number of hospital visits or disease counts, which can vary significantly among different populations.
              • Insurance: Estimating the number of claims or accidents, where the variance is typically higher than the mean.
              • Public Policy: Analyzing crime rates or accident counts in different regions, which often show greater variability.

              Comparing Poisson and Negative Binomial Regression

              While both Poisson and negative binomial regression are used for count data, the choice between the two often depends on the nature of the data’s variance:

              • Poisson Regression: Best suited for data where the mean and variance are approximately equal.
              • Negative Binomial Regression: More appropriate when the data exhibits overdispersion.

              If a Poisson model is fitted to data that is overdispersed, it may underestimate the variance leading to overly optimistic confidence intervals and p-values. Conversely, a negative binomial model can provide more reliable estimates and inference in such cases.

              Implementation and Challenges

              Implementing negative binomial regression typically involves statistical software such as R, SAS, or Python, all of which have packages or modules designed to fit these models to data efficiently. One challenge in fitting negative binomial models is the estimation of the dispersion parameter, which can sometimes be sensitive to outliers and extreme values.

              Conclusion

              Negative binomial regression is a robust method for analyzing count data, especially when that data is overdispersed. By providing a framework that accounts for variability beyond what is expected under a Poisson model, it allows researchers and analysts to make more accurate inferences about their data. As with any statistical method, the key to effective application lies in understanding the underlying assumptions and ensuring that the model appropriately reflects the characteristics of the data.

              References

              Chang, L. Y. (2005). Analysis of freeway accident frequencies: negative binomial regression versus artificial neural network. Safety science43(8), 541-557.

              Hilbe, J. M. (2011). Negative binomial regression. Cambridge University Press.

              Ver Hoef, J. M., & Boveng, P. L. (2007). Quasi‐Poisson vs. negative binomial regression: how should we model overdispersed count data?. Ecology88(11), 2766-2772.

              Liu, H., Davidson, R. A., Rosowsky, D. V., & Stedinger, J. R. (2005). Negative binomial regression of electric power outages in hurricanes. Journal of infrastructure systems11(4), 258-267.

              Yang, S., & Berdine, G. (2015). The negative binomial regression. The Southwest respiratory and critical care chronicles3(10), 50-54.

              Understanding Meta-Analysis: A Comprehensive Research Technique

              Daily writing prompt
              Jot down the first thing that comes to your mind.

              By Kavita Dehalwar

              Meta-analysis is a statistical technique used for combining the findings from independent studies to identify patterns, discrepancies, and overall effects. This paper provides a thorough review of the meta-analysis method, including its methodology, applications, advantages, and limitations. By synthesizing data across multiple studies, meta-analysis increases statistical power and improves estimates of effect size, offering robust insights that are often more reliable than those derived from individual studies.

              Introduction

              Meta-analysis has become a pivotal research tool in various fields including medicine, psychology, education, and social sciences. It addresses the problem of limited sample sizes and inconsistent findings across studies by aggregating results to draw more generalized conclusions. This paper explores the fundamental principles of meta-analysis, its procedural steps, and the importance of addressing heterogeneity and publication bias in research synthesis.

              Methodology of Meta-Analysis

              1. Literature Search and Study Selection:
                • Detailed description of systematic search strategies to identify relevant studies.
                • Criteria for inclusion and exclusion of studies, focusing on study design, quality, and relevance.
              2. Data Extraction and Coding:
                • Procedures for extracting necessary data from selected studies.
                • Coding strategies for categorical and continuous variables.
              3. Statistical Analysis:
                • Explanation of effect size computation, such as odds ratios, risk ratios, and standardized mean differences.
                • Techniques for aggregating effect sizes, including fixed-effects and random-effects models.
                • Assessment of heterogeneity using statistics like I² and Q-test.
                • Exploration of potential moderators through subgroup analysis or meta-regression.
              4. Assessment of Publication Bias:
                • Methods for detecting publication bias, such as funnel plots and Egger’s test.

              Applications of Meta-Analysis

              • Medical Sciences: Enhancing evidence-based medicine by combining results from clinical trials.
              • Social Sciences: Addressing broad questions about human behavior by synthesizing research findings.
              • Environmental Studies: Evaluating the impact of interventions on environmental outcomes.

              Advantages of Meta-Analysis

              • Increased Power and Precision: Ability to detect effects that individual studies may not.
              • Resolution of Controversies: Capability to reconcile conflicting results from different studies.
              • Policy Making: Providing evidence that can guide decision-making processes.

              Limitations and Challenges

              • Variability in Study Quality: Impact of including studies of varying quality on the overall analysis.
              • Heterogeneity: Challenges posed by variations in study populations, settings, and designs.
              • Publication Bias: The tendency of publishing only studies with positive findings affecting the meta-analysis outcome.

              Case Study

              A detailed case study on a meta-analysis conducted in the field of cardiovascular research, illustrating the process and impact of this technique in advancing understanding of drug efficacy.

              Conclusion

              Meta-analysis serves as a powerful tool that can enhance understanding and inform practice across various disciplines. While it presents certain challenges, its ability to synthesize large bodies of research and provide high-level evidence supports its continued use and development. Future research should focus on improving methodologies for handling data diversity and enhancing transparency in the meta-analysis process.

              References

              Borenstein, M., Hedges, L. V., Higgins, J. P., & Rothstein, H. R. (2021). Introduction to meta-analysis. John Wiley & Sons.

              Crits-Christoph, P. (1992). A Meta-analysis. American journal of Psychiatry149, 151-158.

              Dehalwar, K., & Sharma, S. N. (2024). Exploring the Distinctions between Quantitative and Qualitative Research Methods. Think India Journal27(1), 7-15.

              Field, A. P., & Gillett, R. (2010). How to do a meta‐analysis. British Journal of Mathematical and Statistical Psychology63(3), 665-694.

              Guzzo, R. A., Jackson, S. E., & Katzell, R. A. (1987). Meta-analysis analysis. Research in organizational behavior9(1), 407-442.

              Hedges, L. V., & Tipton, E. (2010). Meta-analysis. Handbook of Behavioral Medicine: Methods and Applications, 909-921.

              Hunter, J. E., & Schmidt, F. L. (1982). Meta-analysis. In Advances in educational and psychological testing: Theory and applications (pp. 157-183). Dordrecht: Springer Netherlands.

              Sharma, S. N. Techniques of Meta-Analysis for Unlocking Knowledge.

              Introduction to Delphi Research Technique

              By Shashikant Nishant Sharma

              Delphi research is a methodical and structured communication technique, originally developed as a systematic, interactive forecasting method which relies on a panel of experts. The Delphi method is widely used in various research fields including health, education, and social sciences, aiming to achieve convergence of opinion on a specific real-world issue. The essence of the method lies in a series of rounds of questionnaires sent to a panel of selected experts. Responses are collected and aggregated after each round, and anonymized results are shared with the panel until consensus is reached, or the returns diminish marginally.

              Step-by-Step Guide to Conducting Delphi Research

              Step 1: Define the Problem and Research Questions

              The first step in Delphi research is to clearly define the problem and establish specific research questions that need answering. This involves identifying the key issues at hand and formulating questions that are specific, measurable, and suitable for expert interrogation. It is crucial that the problem is framed in a way that harnesses the experts’ knowledge effectively.

              Step 2: Choose a Facilitator

              A neutral facilitator, often a researcher, is responsible for designing the study, choosing participants, distributing questionnaires, and synthesizing the responses. The facilitator must possess good communication skills and be capable of summarizing information in an unbiased manner.

              Step 3: Select the Panel of Experts

              The quality of the Delphi study heavily depends on the panel selected. Experts should be chosen based on their knowledge, experience, and expertise related to the topic. The panel size can vary but typically ranges from 10 to 50 members. Diversity in panel composition can enrich the results, bringing in multiple perspectives.

              Step 4: Develop and Send the First Round Questionnaire

              The initial questionnaire should gather basic information on the issue and understand the perspectives of the experts. Open-ended questions are useful at this stage to capture a wide range of ideas and insights. The questionnaire should be clear and concise to avoid misinterpretation.

              Step 5: Analyze Responses

              After the first round, responses are collected and analyzed. The facilitator plays a key role in summarizing these responses, identifying areas of agreement and divergence. This summary is crucial as it forms the basis for subsequent rounds.

              Step 6: Iterative Rounds

              Based on the summary of the first round, subsequent questionnaires are crafted to delve deeper into the topic, focusing on areas where consensus was not achieved. These rounds are more structured and often use scaled questions to measure the level of agreement or the ranking of priorities. The process is repeated, with each round refining and narrowing down the scope of inquiry based on the latest set of responses.

              Step 7: Reach Consensus

              The Delphi process continues until a consensus is reached or when additional rounds no longer provide significant changes in responses. It’s important to define what constitutes a “consensus” in the context of the study, which can be a certain percentage agreement among the experts.

              Step 8: Report the Findings

              The final step involves compiling the findings into a comprehensive report that outlines the consensus achieved, differences in opinions, the methodology used, and the implications of the findings. The report should be clear and detailed to allow for further academic scrutiny or practical application.

              Tips for Effective Delphi Research

              • Preparation is Key: Spend adequate time designing the study and formulating the questionnaire.
              • Maintain Anonymity: Anonymity helps prevent the dominance of certain opinions and reduces the bandwagon effect.
              • Feedback: Regular and clear feedback between rounds helps inform the experts of the group’s progress and encourages thoughtful responses.
              • Patience and Persistence: Delphi studies can be time-consuming, and maintaining engagement from all participants throughout the rounds can be challenging but is crucial for the richness of the data.

              Conclusion

              Delphi research is a powerful tool for harnessing expert opinion and fostering a deep understanding of complex issues. By following a structured and systematic process, researchers can effectively manage the complexities of group communications and make informed predictions or decisions in their fields of study.

              References

              Balasubramanian, R., & Agarwal, D. (2012). Delphi technique–a review. International Journal of Public Health Dentistry3(2), 16-26.

              Dehalwar, K., & Sharma, S. N. (2023). Fundamentals of Research Writing and Uses of Research Methodologies. Edupedia Publications Pvt Ltd.

              Green, R. A. (2014). The Delphi technique in educational research. Sage Open4(2), 2158244014529773.

              Hasson, F., Keeney, S., & McKenna, H. (2000). Research guidelines for the Delphi survey technique. Journal of advanced nursing32(4), 1008-1015.

              Hasson, F., & Keeney, S. (2011). Enhancing rigour in the Delphi technique research. Technological forecasting and social change78(9), 1695-1704.

              Jain, Sarika, Kavita Dehalwar, and Shashikant Nishant Sharma. “Explanation of Delphi research method and expert opinion surveys.” Think India 27, no. 4 (2024): 37-48.

              Keeney, S., Hasson, F., & McKenna, H. P. (2001). A critical review of the Delphi technique as a research methodology for nursing. International journal of nursing studies38(2), 195-200.

              Ogbeifun, E., Agwa-Ejon, J., Mbohwa, C., & Pretorius, J. H. (2016). The Delphi technique: A credible research methodology.

              Williams, P. L., & Webb, C. (1994). The Delphi technique: a methodological discussion. Journal of advanced nursing19(1), 180-186.

              Wheeling Through Time: The Journey of Dr. Arvind Kumar’s Bicycle

              By Shashikant Nishant Sharma

              Once upon a time, there was a sleek silver bicycle, its frame polished to a shine from years of adventure and companionship. From the bustling streets of Jaipur to the serene lanes of Roorkee, it had faithfully carried its rider, Dr. Arvind Kumar, through the chapters of his life.

              In 2012, when Arvind embarked on his journey as an undergraduate student of architecture at NIT Jaipur, the bicycle became his trusted companion. With its sturdy wheels spinning tirelessly, it carried him to classes, studio sessions, and late-night brainstorming sessions with his peers. Together, they explored the nooks and crannies of Jaipur, discovering hidden gems and weaving through the chaotic charm of the Pink City.

              As Arvind’s academic pursuits led him to pursue a Ph.D. at IIT Roorkee, the bicycle dutifully made the journey alongside him. Through the winding roads of Roorkee, where the air was thick with the scent of academia and the promise of discovery, they forged a deeper bond. The bicycle became more than just a means of transportation; it became a symbol of resilience, perseverance, and the joy of the open road.

              Throughout his doctoral research, the bicycle offered solace and inspiration. It was during one of their rides through the quaint streets of Roorkee that Arvind stumbled upon the idea that would shape his thesis. As he pedaled furiously, the wind whipping through his hair, thoughts swirled in his mind like leaves caught in a whirlwind. And amidst the chaos, clarity emerged.

              Years passed, and as Arvind graduated with his Ph.D., the bicycle remained a constant in his life. When he joined the esteemed faculty at NIT Trichy as an Assistant Professor, it was only natural that the bicycle accompanied him once again, this time to the vibrant campus nestled amidst the lush greenery of Tiruchirappalli.

              At NIT Trichy, the bicycle became a familiar sight, weaving through the avenues lined with towering trees and echoing with the laughter of students. It became a symbol of Arvind’s dedication to sustainable living and his commitment to reducing his carbon footprint. Students and colleagues alike admired the silver steed, its frame bearing the marks of countless journeys and shared memories.

              But as the years rolled by, the bicycle began to show signs of wear and tear. Its once shiny frame dulled with age, and its wheels creaked with each revolution. Yet, despite its outward appearance, the spirit of the bicycle remained unbroken. It continued to carry Arvind to and from campus, its wheels spinning with the same determination that had fueled their adventures for over a decade.

              And so, as the sun set on another day at NIT Trichy, Dr. Arvind Kumar pedaled homeward on his trusty bicycle, the wind whispering secrets of journeys yet to come. For though the bicycle may have weathered the passage of time, its spirit remained as indomitable as ever, ready to embark on new adventures alongside its faithful rider.

              Understanding the Language of the Road: A Guide to Road Signs and Symbols

              Daily writing prompt
              Describe a random encounter with a stranger that stuck out positively to you.

              By Shashikant Nishant Sharma

              Road signs and symbols are the silent communicators of our highways and byways, speaking a universal language understood by drivers around the world. From the simple yet essential stop sign to the intricate markings guiding us through complex intersections, these visual cues play a crucial role in ensuring safety and order on our roads. Let’s delve into the world of road signs and symbols to better understand their significance and the messages they convey.

              Photo by Athena on Pexels.com

              The Purpose of Road Signs and Symbols

              At their core, road signs and symbols serve as a means of communication between road users and traffic authorities. They provide vital information, warnings, and regulatory instructions to drivers, pedestrians, and cyclists, helping them navigate the road network safely and efficiently. Without these visual aids, the chaos and confusion on our roads would be palpable, leading to increased accidents and congestion.

              Types of Road Signs

              Road signs can be categorized into several types based on their purpose and function:

              1. Regulatory Signs: These signs enforce traffic laws and regulations. Examples include stop signs, speed limit signs, and no-entry signs.
              2. Warning Signs: Warning signs alert drivers to potential hazards or changes in road conditions ahead. They include signs for sharp curves, slippery roads, pedestrian crossings, and animal crossings.
              3. Guide Signs: Guide signs provide information about directions, destinations, distances, and services available along the route. They include signs for exits, highway interchanges, rest areas, and tourist attractions.
              4. Informational Signs: Informational signs convey non-regulatory information, such as parking regulations, historical markers, and points of interest.
              5. Construction and Maintenance Signs: These signs inform drivers of ongoing roadwork, detours, and temporary changes to traffic patterns.

              Understanding Road Symbols

              In addition to signs with written messages, road users encounter various symbols that convey important information at a glance. Some common road symbols include:

              1. Arrow Markings: Arrows indicate the direction of travel, lane usage, and traffic flow. They are essential for guiding drivers through intersections, ramps, and lane merges.
              2. Pedestrian Symbols: Pedestrian symbols depict crosswalks, pedestrian zones, and pedestrian crossing points, reminding drivers to yield to pedestrians and exercise caution.
              3. Bicycle Symbols: Bicycle symbols mark dedicated bike lanes, shared roadways, and bike crossings, promoting safe interaction between cyclists and motorists.
              4. Lane Markings: Lane markings, such as solid lines, dashed lines, and chevrons, delineate lanes, indicate permissible maneuvers, and regulate traffic flow on multi-lane roads.
              5. Railroad Crossing Symbols: These symbols warn drivers of upcoming railroad crossings, prompting them to stop, look, and listen for approaching trains.

              The Importance of Road Sign Recognition

              Recognizing and understanding road signs and symbols is a fundamental aspect of safe driving. By obeying these visual cues, drivers can anticipate road conditions, adjust their speed and behavior accordingly, and avoid potential accidents. Additionally, familiarity with road signs is essential for passing driving exams and obtaining driver’s licenses in many jurisdictions.

              Conclusion

              Road signs and symbols are the unsung heroes of our transportation infrastructure, guiding us through the complexities of the modern road network. From directing traffic to promoting safety and efficiency, these visual aids play a vital role in shaping our driving experiences. By understanding the language of the road, drivers can navigate with confidence, knowing that each sign and symbol is a beacon of information guiding them toward their destination safely.

              References

              Agarwal, S., & Sharma, S. N. (2014). Universal Design to Ensure Equitable Society. International Journal of Engineering and Technical Research (IJETR)1.

              Dehalwar, K. Institute of Town Planners India is Dedicated to Planning Education and Development in India.

              Dewar, R., & Pronin, M. (2023). Designing road sign symbols. Transportation research part F: traffic psychology and behaviour94, 466-491.

              Greenhalgh, J., & Mirmehdi, M. (2012). Real-time detection and recognition of road traffic signs. IEEE transactions on intelligent transportation systems13(4), 1498-1506.

              Krampen, M. (1965). Signs and symbols in graphic communication. Design Quarterly, (62), 1-31.

              Merriman, P., & Jones, R. (2009). ‘Symbols of Justice’: the Welsh Language Society’s campaign for bilingual road signs in Wales, 1967–1980. Journal of Historical Geography35(2), 350-375.

              Sharma, S. N. Leveraging GIS for Enhanced Planning Education.

              Zwahlen, H. T., & Schnell, T. (1999). Legibility of traffic sign text and symbols. Transportation research record1692(1), 142-151.

              Unraveling the Tapestry: Delving Deeper into Family and Social Structures

              Daily writing prompt
              Describe a positive thing a family member has done for you.

              By Shashikant Nishant Sharma

              Within the intricate tapestry of human society lies the fundamental framework of family and social structures. These interconnected webs of relationships not only define our sense of belonging but also shape our identities, behaviors, and overall well-being. By exploring the nuances of family dynamics and broader social networks, we gain invaluable insights into the fabric of society and the mechanisms that underpin human interaction and development.

              The Vital Role of Family: At the heart of society, families serve as the nucleus around which our lives revolve. Whether through the traditional nuclear family or the expansive networks of extended kin, familial bonds provide a sanctuary where values are instilled, traditions are passed down, and emotional support is freely given. Within this intimate sphere, individuals learn to navigate the complexities of human relationships, laying the groundwork for their journey through life.

              Moreover, families serve as the primary agents of socialization, molding individuals into active participants within their respective communities. From the earliest stages of development, children absorb cultural norms, ethical principles, and behavioral patterns through interactions with their families. These formative experiences not only shape their worldview but also equip them with the skills and resilience needed to navigate the wider social landscape.

              Yet, the concept of family is as diverse as the societies in which it exists. Cultural variations, economic realities, and shifting social norms all contribute to the kaleidoscope of family structures observed worldwide. From multigenerational households to single-parent families, each configuration reflects unique values and priorities, underscoring the adaptability of the familial unit in response to changing circumstances.

              Navigating Change and Adversity: In the midst of societal transformations, families grapple with an array of challenges ranging from economic hardship to shifting gender roles. Urbanization, globalization, and technological advances have reshaped the fabric of family life, ushering in an era of unprecedented complexity and diversity. While these changes may strain traditional notions of family, they also present opportunities for growth, adaptation, and redefinition.

              For instance, the rise of blended families and co-parenting arrangements underscores the resilience of familial bonds in the face of divorce and remarriage. Similarly, same-sex partnerships challenge conventional definitions of family, highlighting the fluidity and inclusivity inherent in modern family structures. By embracing diversity and fostering open dialogue, families can harness the strength of their collective experiences to navigate change and adversity.

              Beyond the Family Unit: Exploring Social Networks However, the influence of social structures extends far beyond the confines of the family unit. Communities, comprising diverse networks of relationships and affiliations, serve as vital extensions of familial support. Within these communal spaces, individuals forge connections, share resources, and collaborate on shared goals, fostering a sense of belonging and solidarity.

              From neighborhood associations to religious congregations, social structures provide avenues for social interaction, mutual support, and collective action. By participating in community life, individuals not only strengthen their social ties but also contribute to the broader fabric of society. Moreover, communities play a crucial role in addressing systemic challenges such as poverty, inequality, and social injustice, amplifying the voices of marginalized groups and fostering social change.

              Conclusion: In essence, family and social structures form the cornerstone of human society, weaving a tapestry of interconnected relationships and shared experiences. From the intimate bonds of the family unit to the expansive networks of community and society, these structures provide the foundation for individual growth, collective well-being, and societal resilience. As we navigate the complexities of the modern world, understanding and nurturing these bonds are essential for building inclusive, thriving communities where all individuals can flourish.

              References

              Alesina, A., & Giuliano, P. (2010). The power of the family. Journal of Economic growth15, 93-125.

              Becker, G. S., & Murphy, K. M. (1988). The family and the state. The Journal of Law and Economics31(1), 1-18.

              Bernardes, J. (1997). Family studies: An introduction. Psychology Press.

              Hardwig, J. (1990). What about the family?. Hastings Center Report20(2), 5-10.

              Launching Your Culinary Dream: Starting a Restaurant as a Startup Venture

              Daily writing prompt
              What is your favorite restaurant?

              By Shashikant Nishant Sharma

              In the entrepreneurial realm, few endeavors are as enticing and challenging as launching a restaurant. Beyond simply serving food, a restaurant embodies a fusion of creativity, hospitality, and business acumen. While the journey may be demanding, the rewards—both personal and professional—can be immensely gratifying. For those with a passion for food and a vision for culinary innovation, starting a restaurant as a startup venture offers a thrilling opportunity to turn dreams into reality.

              Photo by Igor Starkov on Pexels.com

              Who Can Start a Restaurant?

              The beauty of the restaurant industry lies in its inclusivity. Anyone with a passion for food, a keen eye for detail, and a willingness to learn can embark on the journey of restaurant ownership. Whether you’re a seasoned chef looking to showcase your culinary skills, a hospitality enthusiast eager to create memorable dining experiences, or an entrepreneur with a vision for a unique dining concept, the restaurant industry welcomes diversity and creativity.

              When to Start?

              While there’s no one-size-fits-all answer to the question of when to start a restaurant, several key factors can influence the timing of your venture:

              1. Market Opportunity: Conduct thorough market research to identify gaps and opportunities in the local culinary landscape. Are there unmet consumer needs or emerging food trends that you can capitalize on? Timing your restaurant launch to coincide with market demand can increase your chances of success.
              2. Financial Preparedness: Starting a restaurant requires significant financial investment, from leasing a space and purchasing equipment to hiring staff and marketing your concept. Ensure that you have a solid financial plan in place, including startup capital and contingency funds to weather any unforeseen challenges.
              3. Experience and Expertise: While prior experience in the food and hospitality industry is beneficial, it’s not necessarily a prerequisite for starting a restaurant. However, having a foundational understanding of culinary techniques, food safety regulations, and business management principles can position you for success.
              4. Location and Timing: The location of your restaurant and the timing of its launch can significantly impact its success. Consider factors such as foot traffic, demographic trends, and local competition when selecting a location and determining the optimal time to open your doors to the public.

              Key Considerations for Startup Success

              Launching a restaurant as a startup venture requires careful planning, meticulous attention to detail, and a willingness to adapt to changing circumstances. Here are some key considerations to keep in mind:

              1. Crafting a Unique Concept: Differentiation is key in a competitive market. Develop a distinct culinary concept or theme that sets your restaurant apart and resonates with your target audience.
              2. Building a Strong Team: Surround yourself with a dedicated team of professionals who share your passion for hospitality and commitment to excellence. From chefs and kitchen staff to front-of-house personnel and managerial roles, hiring the right talent is essential for success.
              3. Strategic Marketing and Branding: Establishing a strong brand identity and effectively marketing your restaurant is crucial for attracting customers and building a loyal following. Leverage social media, local advertising, and word-of-mouth referrals to create buzz and generate excitement around your concept.
              4. Delivering Exceptional Quality: Consistently delivering high-quality food, impeccable service, and memorable dining experiences is paramount. Focus on sourcing fresh, seasonal ingredients, maintaining cleanliness and food safety standards, and exceeding customer expectations at every touchpoint.

              Conclusion

              Starting a restaurant as a startup venture is a bold and rewarding undertaking that requires passion, perseverance, and a willingness to embrace uncertainty. By carefully assessing market opportunities, planning strategically, and prioritizing excellence in every aspect of your operation, you can transform your culinary dream into a thriving reality. Whether you’re a seasoned chef, a first-time entrepreneur, or an aspiring restaurateur with a vision for innovation, the journey of restaurant ownership offers endless possibilities for creativity, growth, and fulfillment.

              References

              Gheribi, E. (2017). Innovation strategies in restaurant business. Econ. Organ. Enterp11, 125-135.

              Gupta, M. (2019). A Study on Impact of Online Food delivery app on Restaurant Business special reference to zomato and swiggy. International Journal of Research and Analytical Reviews6(1), 889-893.

              Hwang, J., & Zhao, J. (2010). Factors influencing customer satisfaction or dissatisfaction in the restaurant business using AnswerTree methodology. Journal of Quality Assurance in Hospitality & Tourism11(2), 93-110.

              Lundberg, D. E. (1989). The hotel and restaurant business(No. Ed. 5, p. 364pp).

              April 2024: Indians celebrate festivals like Ugadi, Eid-ul-Fitr, Dr. Ambedkar’s birthday, New Year in many other States, and Sri Ram Navami

              India is a country of pluralism. A country can prosper if there is peace and harmony among the people. In India, in addition to all religious communities, many languages and different types of culture can be found, which is absent in any other country. China is dominated by the Han community (more than 90%), and many Chinese people praised Indians when I was in China. I have traveled to many countries worldwide, and many foreigners told me about India.
              On April 9, 2024, the new year was celebrated in many parts of India under the banner of Ugadi and Gudi Padwa. On April 11, Eid-ul-Fitr was celebrated, a great and auspicious celebration for Muslims, which also marks the end of Ramadan, fasting. On April 13 and 14, different parts of India New Year will be celebrated. Baishakhi in Punjab, Rongali Bihu in Assam, Naba-barsho in West Bengal (also in Bangladesh), Vishu in Kerala, and Puthandu in Tamil. On April 14, the great son of India, Dr BR Ambedkar Sahab’s birthday will be celebrated. Also, on April 17, the Ram Navami celebration will take place, i.e., the birthday celebration of Bhagwan Sri Ram. So, in one month only, the beauty of India can be observed through different celebrations and festivals.
              It is pertinent to mention that Dr. Bhimrao Ramji Ambedkar (Dr. B.R. Ambedkar), popularly known as Babasaheb/Ambedkar-Saheb. Dr. Babasaheb was born on April 14, 1891, at Mhow in Madhya Pradesh. Now, Mhow, officially Dr. Ambedkar Nagar, is a cantonment. I had the opportunity to visit his birthplace for academic purposes. Dr. B.R. Ambedkar was one such person who had to fight in his life because of social stigma (caste issue). With his knowledge, wisdom, and humanitarian feelings, he proved that by caste, one cannot be great and only be great by deeds.
              Sri Ram Navami is one of the greatest Hindu festivals. Chaitra Navratri 2024 starts on April 9 and concludes with Sri Ram Navami on April 17.
              Regarding the Eid festivals, it is pertinent to mention that two main Eids are celebrated: Eid-ul-Fitr and Eid-ul-Adha. After the end of Ramadan, the holy ninth month of the Islamic year, Eid-ul-Fitr is celebrated with community prayers. Eid-ul-Adha, which in Arabic means ‘festival of sacrifice,’ is celebrated around 70 days after Eid-ul-Fitr.
              In addition to the above, Mahavir Jayanti will be celebrated on April 21 and Hanuman Jayanti on April 23.
              Despite so many festivals and celebrations in April 2024, the worst and highly deplorable incident that took place on April 13, 1919, was the Jallianwala Bagh massacre. In the Jallianwala Bagh (also known as the Amritsar Massacre), thousands of innocent people, including children and women, were killed and injured by the British Raj on April 13, 1919. The Jallianwala Bagh Massacre was one of the saddest events that will never fade away from our memory.
              Prof Shankar Chatterjee, Hyderabad

              Unveiling the Benefits of Turnitin Software in Academic Writing

              Daily writing prompt
              Where do you see yourself in 10 years?

              By Shashikant Nishant Sharma

              In the contemporary landscape of academia, where originality and authenticity reign supreme, Turnitin emerges as a beacon of integrity and excellence. This innovative software has revolutionized the way educators and students approach writing assignments, offering a plethora of benefits that extend far beyond mere plagiarism detection. From enhancing academic integrity to fostering critical thinking skills, Turnitin stands as a formidable ally in the pursuit of scholarly excellence.

              Photo by Yan Krukau on Pexels.com

              1. Plagiarism Detection and Prevention:

              At its core, Turnitin is renowned for its robust plagiarism detection capabilities. By comparing students’ submissions against an extensive database of academic sources, journals, and previously submitted work, Turnitin effectively identifies instances of plagiarism, whether intentional or unintentional. This feature not only promotes academic integrity but also educates students about the importance of citing sources and respecting intellectual property rights.

              2. Feedback and Improvement:

              Turnitin’s feedback mechanism empowers educators to provide comprehensive and constructive feedback to students. Through its intuitive interface, instructors can highlight areas of concern, offer suggestions for improvement, and commend originality. This personalized feedback loop fosters a culture of continuous improvement, encouraging students to refine their writing skills and refine their understanding of academic conventions.

              3. Enhanced Writing Skills:

              By encouraging students to submit drafts through Turnitin prior to final submission, educators facilitate the development of essential writing skills. Through the process of revising and refining their work based on Turnitin’s feedback, students hone their ability to articulate ideas clearly, structure arguments logically, and cite sources accurately. This iterative approach to writing cultivates critical thinking skills and equips students with the tools necessary for success in academia and beyond.

              4. Deterrent Against Academic Dishonesty:

              The mere presence of Turnitin serves as a powerful deterrent against academic dishonesty. Knowing that their work will undergo rigorous scrutiny by Turnitin’s algorithm, students are less inclined to engage in unethical practices such as plagiarism or contract cheating. This proactive approach to academic integrity not only upholds the reputation of educational institutions but also instills a sense of ethical responsibility in students, preparing them for the ethical challenges they may encounter in their professional careers.

              5. Data-Driven Insights:

              Turnitin generates comprehensive reports that provide educators with valuable insights into students’ writing habits, trends, and areas of weakness. By analyzing these reports, instructors can tailor their teaching strategies to address specific needs, implement targeted interventions, and track students’ progress over time. This data-driven approach to instruction promotes personalized learning and empowers educators to make informed decisions that maximize student success.

              6. Streamlined Grading Process:

              Incorporating Turnitin into the grading process streamlines workflow for educators, allowing them to efficiently evaluate student submissions, provide feedback, and assign grades within a centralized platform. This seamless integration of assessment and feedback not only saves time but also ensures consistency and fairness in grading practices.

              7. Global Reach and Accessibility:

              Turnitin transcends geographical boundaries, making it accessible to educators and students worldwide. Whether in traditional classrooms or virtual learning environments, Turnitin’s cloud-based platform facilitates seamless collaboration and communication, enabling educators to engage with students regardless of their location. This global reach fosters a diverse and inclusive academic community, where ideas can be shared, challenged, and refined on a global scale.

              In conclusion, Turnitin software has emerged as an indispensable tool in the realm of academic writing, offering a myriad of benefits that extend far beyond plagiarism detection. From promoting academic integrity to fostering critical thinking skills, Turnitin empowers educators and students alike to strive for excellence in scholarly pursuits. By leveraging the innovative features of Turnitin, educational institutions can cultivate a culture of integrity, innovation, and lifelong learning that prepares students for success in the ever-evolving landscape of academia and beyond.

              References

              Batane, T. (2010). Turning to Turnitin to fight plagiarism among university students. Journal of Educational Technology & Society13(2), 1-12.

              Dahl, S. (2007). Turnitin®: The student perspective on using plagiarism detection software. Active Learning in Higher Education8(2), 173-191.

              Heckler, N. C., Rice, M., & Hobson Bryan, C. (2013). Turnitin systems: A deterrent to plagiarism in college classrooms. Journal of Research on Technology in Education45(3), 229-248.

              Mphahlele, A., & McKenna, S. (2019). The use of turnitin in the higher education sector: Decoding the myth. Assessment & Evaluation in Higher Education44(7), 1079-1089.

              Rolfe, V. (2011). Can Turnitin be used to provide instant formative feedback?. British Journal of Educational Technology42(4), 701-710.

              Streamlining Payroll Processes: A Review of the Top Payroll Management Software

              Daily writing prompt
              What are 5 everyday things that bring you happiness?

              By Shashikant Nishant Sharma

              In today’s fast-paced business landscape, managing payroll efficiently is paramount for businesses of all sizes. Payroll management software has emerged as a crucial tool to streamline payroll processes, minimize errors, and ensure compliance with tax regulations. Here, we delve into the top payroll management software solutions that have garnered acclaim for their features, usability, and effectiveness.

              Photo by Tima Miroshnichenko on Pexels.com
              1. ADP Workforce Now: ADP Workforce Now is a comprehensive payroll solution suitable for businesses of all sizes. It offers robust features including payroll processing, tax compliance, time tracking, benefits administration, and HR management. Its user-friendly interface, customizable reporting tools, and mobile accessibility make it a favorite among HR professionals.
              2. Gusto: Gusto is a cloud-based payroll software designed for small to mid-sized businesses. Known for its simplicity and intuitive interface, Gusto automates payroll processing, tax filing, and employee benefits administration. It also offers employee self-service tools, such as online pay stubs and direct deposit setup, enhancing employee satisfaction.
              3. Paychex Flex: Paychex Flex is a scalable payroll and HR solution suitable for businesses of all sizes. It offers features such as payroll processing, tax administration, time and attendance tracking, and employee benefits management. Paychex Flex’s robust reporting capabilities and dedicated support make it a reliable choice for businesses seeking comprehensive payroll solutions.
              4. QuickBooks Payroll: QuickBooks Payroll is an integrated payroll solution offered by Intuit, tailored for small businesses. It seamlessly integrates with QuickBooks accounting software, simplifying payroll processing and ensuring accuracy in financial reporting. With features like automatic tax calculations, employee self-service portal, and mobile accessibility, QuickBooks Payroll streamlines payroll management for small business owners.
              5. Workday HCM: Workday HCM is a cloud-based human capital management solution that includes payroll functionality. It offers a unified platform for payroll processing, HR management, talent acquisition, and workforce planning. Workday’s intuitive interface, advanced analytics, and scalability make it a preferred choice for large enterprises looking to streamline their payroll and HR operations.

              Each of these payroll management software solutions comes with its own set of features, pricing plans, and target audiences. While ADP Workforce Now and Paychex Flex cater to businesses of all sizes, Gusto and QuickBooks Payroll are tailored for small to mid-sized businesses. Workday HCM, on the other hand, targets large enterprises with complex payroll and HR needs.

              In conclusion, selecting the right payroll management software depends on the specific needs and size of your business. Whether you prioritize ease of use, scalability, or comprehensive HR functionality, the top payroll management software solutions reviewed here offer reliable options to streamline your payroll processes and ensure compliance with regulatory requirements.

              References

              Arora, M., & Chakrabarti, D. (2013, August). Application of business intelligence: A case on payroll management. In 2013 International Symposium on Computational and Business Intelligence (pp. 73-76). IEEE.

              Mahajan, K., Shukla, S., & Soni, N. (2015). A Review of Computerized Payroll System. International journal of advanced research in computer and communication engineering4(1), 67-70.

              Shukla, V. K., & Bhandari, N. (2019, February). Conceptual framework for enhancing payroll management and attendance monitoring system through RFID and biometric. In 2019 Amity International Conference on Artificial Intelligence (AICAI) (pp. 188-192). IEEE.

              Zhao, M., & Rabiei, K. (2022). Feasibility of implementing the human resource payroll management system based on cloud computing. Kybernetes52(4), 1245-1268.

              Top Management Skills for Young Professionals

              Daily writing prompt
              Describe something you learned in high school.

              In today’s dynamic and competitive work environment, young professionals face unique challenges as they navigate their careers and strive for success. Beyond technical expertise, the ability to effectively manage oneself and others is crucial for advancement in the corporate world. Here, we explore the top management skills essential for young professionals to thrive in their roles and emerge as effective leaders.

              Photo by Jonathan Borba on Pexels.com

              1. Communication Skills

              Effective communication lies at the heart of successful leadership. Young professionals must master the art of conveying ideas clearly, both verbally and in writing. This includes active listening, articulating thoughts persuasively, and fostering open dialogue within teams. By honing their communication skills, young leaders can build trust, resolve conflicts, and inspire others to action.

              2. Emotional Intelligence

              Emotional intelligence (EQ) is the ability to understand and manage emotions, both in oneself and others. Young professionals with high EQ can empathize with colleagues, adapt to diverse personalities, and navigate interpersonal relationships with finesse. By cultivating self-awareness, self-regulation, and empathy, they can foster a positive work environment and lead by example.

              3. Adaptability

              In today’s rapidly evolving business landscape, adaptability is a prized trait. Young professionals must embrace change, stay flexible in their approach, and continuously learn and grow. Whether faced with new technologies, market trends, or organizational restructuring, adaptable leaders remain resilient and resourceful, turning challenges into opportunities for innovation and growth.

              4. Decision-Making

              Effective decision-making is a hallmark of strong leadership. Young professionals must develop the ability to analyze complex situations, weigh options thoughtfully, and make timely and informed decisions. By leveraging data, seeking input from stakeholders, and considering long-term consequences, they can mitigate risks and drive strategic outcomes that align with organizational goals.

              5. Problem-Solving

              Problem-solving is an essential skill for overcoming obstacles and driving progress. Young professionals should approach challenges with a proactive mindset, breaking down problems into manageable components and exploring creative solutions. By fostering a culture of innovation and collaboration, they can harness the collective intelligence of their teams to address complex issues and drive sustainable change.

              6. Team Leadership

              Effective team leadership requires the ability to inspire, motivate, and empower others to achieve common objectives. Young professionals must cultivate a collaborative spirit, build cohesive teams, and leverage individual strengths to maximize collective performance. By setting clear goals, providing constructive feedback, and fostering a culture of accountability, they can unlock the full potential of their teams and drive results.

              Conclusion

              In conclusion, mastering top management skills is essential for young professionals seeking to excel in their careers and emerge as effective leaders. By prioritizing communication, emotional intelligence, adaptability, decision-making, problem-solving, and team leadership, they can navigate the complexities of the modern workplace with confidence and drive meaningful impact. As they continue to refine these skills and lead by example, they will not only achieve personal success but also inspire others to reach their full potential in the pursuit of organizational excellence.

              Benefits that Long Last after Transit Oriented Development

              Daily writing prompt
              Describe one positive change you have made in your life.

              By Shashikant Nishant Sharma

              One positive change that can profoundly inspire the life of an urban planner is the successful implementation of a transformative Transit-Oriented Development (TOD) project within their city or region. TOD represents a holistic approach to urban planning that centers around creating vibrant, sustainable, and inclusive communities around public transit hubs. Here’s how the successful execution of a TOD project can inspire urban planners:

              Photo by Maria Orlova on Pexels.com
              1. Impact on Urban Mobility: A well-executed TOD project can significantly improve urban mobility by promoting the use of public transportation, walking, and cycling over private car ownership. This shift towards sustainable transportation modes reduces traffic congestion, air pollution, and carbon emissions, leading to cleaner and healthier urban environments.
              2. Enhanced Quality of Life: TODs prioritize mixed-use development, walkable neighborhoods, and access to amenities such as parks, schools, healthcare facilities, and retail establishments. By fostering vibrant, pedestrian-friendly environments, TODs enhance the overall quality of life for residents, making cities more livable and enjoyable places to reside.
              3. Promotion of Social Equity: TODs have the potential to address social equity concerns by providing affordable housing options, improving access to jobs and educational opportunities, and fostering inclusive communities. Successful TOD projects can help reduce disparities in access to transportation and amenities, thereby promoting social cohesion and economic opportunity for all residents.
              4. Economic Development: TODs can stimulate economic development by attracting investment, creating jobs, and revitalizing underutilized or blighted areas around transit stations. The increased density and activity generated by TODs can support local businesses, spur entrepreneurship, and contribute to the overall economic vitality of urban areas.
              5. Environmental Sustainability: TODs promote sustainable land use and transportation practices, which are essential for mitigating climate change and protecting natural resources. By encouraging compact development, reducing car dependence, and preserving green spaces, TODs contribute to the conservation of biodiversity and the preservation of ecosystems within urban areas.
              6. Community Engagement and Empowerment: Successful TOD projects often involve extensive community engagement and participatory planning processes, empowering residents to shape the future of their neighborhoods. By involving stakeholders in decision-making and fostering collaboration between government agencies, developers, and community organizations, TODs can build trust, foster social capital, and promote civic engagement.
              7. Demonstration of Best Practices: A successful TOD project serves as a tangible demonstration of best practices in urban planning, design, and development. It can inspire other cities and regions to replicate similar initiatives, leading to a broader adoption of TOD principles and strategies across different contexts. This ripple effect can catalyze positive change on a larger scale and contribute to the advancement of sustainable urban development worldwide.

              In conclusion, the successful implementation of a transformative Transit-Oriented Development project can inspire urban planners by demonstrating the potential for creating more sustainable, equitable, and livable cities. By prioritizing public transportation, mixed land uses, social inclusion, and environmental stewardship, TODs exemplify a holistic approach to urban planning that balances the needs of people, the economy, and the environment. As such, they serve as powerful catalysts for positive change and exemplars of urban innovation and progress.

              References

              Carlton, I. (2009). Histories of transit-oriented development: Perspectives on the development of the TOD concept.

              Cervero, R. (2004). Transit-oriented development in the United States: Experiences, challenges, and prospects.

              Ibraeva, A., de Almeida Correia, G. H., Silva, C., & Antunes, A. P. (2020). Transit-oriented development: A review of research achievements and challenges. Transportation Research Part A: Policy and Practice132, 110-130.

              Nasri, A., & Zhang, L. (2014). The analysis of transit-oriented development (TOD) in Washington, DC and Baltimore metropolitan areas. Transport policy32, 172-179.

              Sharma, S. N., Kumar, A., & Dehalwar, K. (2024). The Precursors of Transit-oriented Development. Economic and Political Weekly, 59(14), 16–20. https://doi.org/10.5281/zenodo.10939448

              Xu, W., Guthrie, A., Fan, Y., & Li, Y. (2017). Transit-oriented development in China: Literature review and evaluation of TOD potential across 50 Chinese cities. Journal of Transport and Land Use10(1), 743-762.

              Gender and Its Implications for Spatial Planning: Understanding the Impact

              Daily writing prompt
              What’s the most fun way to exercise?

              By Kavita Dehalwar

              Spatial planning plays a critical role in shaping the physical environment of communities, influencing how people interact with their surroundings and access resources and opportunities. However, the planning process is often influenced by various social factors, including gender. Gender refers to the social, cultural, and economic attributes and roles associated with being male or female, which can significantly influence how individuals experience and navigate spaces. Understanding the implications of gender on spatial planning is essential for creating inclusive and equitable environments that meet the diverse needs of all community members.

              Photo by Andrea Piacquadio on Pexels.com

              Gendered Spaces and Access

              One of the primary ways gender influences spatial planning is through the creation of gendered spaces. Gendered spaces are areas that are designed, perceived, and used differently by men and women due to societal norms, cultural practices, and individual preferences. For example, public transportation systems, parks, and recreational facilities may be designed with specific gender biases, impacting accessibility and usability for different genders. Women, for instance, may perceive certain spaces as unsafe due to inadequate lighting or lack of surveillance, limiting their mobility and access to public amenities.

              Furthermore, the division of labor based on gender roles can influence spatial patterns. For instance, women often bear the primary responsibility for caregiving and household chores, which can affect their travel patterns and access to essential services such as healthcare and education. Spatial planning must consider these gendered dynamics to ensure that infrastructure and services are distributed equitably and efficiently, addressing the needs of all members of the community.

              Safety and Security

              Gender also plays a significant role in perceptions of safety and security within the built environment. Women, in particular, may experience harassment, violence, or fear of crime in public spaces, which can restrict their freedom of movement and limit their participation in social and economic activities. Spatial planning strategies such as urban design, lighting, and surveillance measures can help mitigate these risks and create safer environments for all genders.

              Inclusive Design and Accessibility

              An inclusive approach to spatial planning involves designing environments that accommodate the needs of diverse populations, including different genders, ages, abilities, and socioeconomic backgrounds. Gender-sensitive design considers how spaces are used and experienced by men, women, and non-binary individuals, ensuring that infrastructure, facilities, and services are accessible and welcoming to all.

              For example, public restrooms are often designed with binary gender distinctions, which can be exclusionary for transgender and gender-nonconforming individuals. Gender-inclusive design promotes the creation of gender-neutral facilities that accommodate diverse identities and preferences, fostering inclusivity and reducing stigma and discrimination.

              Participation and Decision-Making

              Gender dynamics also influence participation and decision-making processes in spatial planning. Women and other marginalized groups are often underrepresented in planning processes, resulting in policies and interventions that may not adequately address their needs and priorities. Engaging diverse stakeholders, including women, in decision-making processes can lead to more inclusive and responsive spatial planning outcomes.

              Furthermore, empowering women as planners, policymakers, and community leaders can help challenge existing gender norms and biases within the planning profession, promoting greater gender equity in urban and regional development initiatives.

              Conclusion

              Gender is a fundamental aspect of spatial planning, shaping how individuals experience and interact with the built environment. Recognizing and addressing the implications of gender in spatial planning is essential for creating inclusive, safe, and equitable communities where all individuals can thrive. By adopting a gender-sensitive approach to planning and design, policymakers, planners, and stakeholders can work towards building cities and regions that reflect the diverse needs and aspirations of their populations.

              References

              Damyanovic, D. (2016). Gender mainstreaming as a strategy for sustainable urban planning. In Fair Shared Cities (pp. 177-192). Routledge.

              Dehalwar, K., & Singh, J. (2015). Current State of Water Management System: Case Review of Bhopal, Madhya Pradesh. International Journal of Civil, Structural, Environmental and Infrastructure Engineering Research and Development (IJCSEIERD)5(6), 35-40.

              Dehalwar, K. Understanding the Dynamics of Peri-Urban Areas: Navigating the Interface Between Urban and Rural Realms.

              Garcia-Ramon, M. D., Ortiz, A., & Prats, M. (2004). Urban planning, gender and the use of public space in a peripherial neighbourhood of Barcelona. Cities21(3), 215-223.

              Malaza, N., Todes, A., & Williamson, A. (2009). Gender in planning and urban development.

              McDowell, L. (1983). Towards an understanding of the gender division of urban space. Environment and planning D: Society and Space1(1), 59-72.

              Rakodi, C. (1991). Cities and people: Towards a gender‐aware urban planning process?. Public Administration and Development11(6), 541-559.

              Sánchez de Madariaga, I., & Neuman, M. (2016). Mainstreaming gender in the city. Town Planning Review87(5), 493-504.

              Sharma, S. N. (2014). Participatory Planning in Plan Preparation. BookCountry.

              Spain, D. (2014). Gender and urban space. Annual Review of Sociology40, 581-598.

              Understanding Gender Dynamics in Development Planning: A Comprehensive Analysis

              Daily writing prompt
              What book could you read over and over again?

              by Kavita Dehalwar

              Gender dynamics have become a central focus in development planning, reflecting a broader recognition of the significant influence gender plays in shaping societal structures, opportunities, and outcomes. The intertwined concepts of gender and development, gender and sex, gender sensitivity, and their impact on development planning are critical to fostering inclusive and sustainable growth.

              Photo by Ollie Craig on Pexels.com

              Gender and Development: Unraveling the Nexus

              Gender and development refer to the relationship between gender equality and sustainable development. It acknowledges the diverse roles, responsibilities, and experiences of individuals based on their gender identity within socio-economic contexts. Development initiatives that fail to address gender disparities often perpetuate inequalities, hindering progress.

              Gender and Sex: Deconstructing the Binary

              While often used interchangeably, gender and sex represent distinct concepts. Sex typically refers to biological attributes such as anatomy and physiology, categorized as male, female, or intersex. In contrast, gender encompasses the roles, behaviors, expectations, and identities that society constructs around individuals based on their perceived sex. Understanding the fluidity and complexity of gender is crucial for addressing discrimination and promoting inclusivity.

              Gender Sensitivity: A Lens for Inclusivity

              Gender sensitivity involves recognizing, understanding, and responding to the diverse needs, experiences, and perspectives of individuals based on their gender identity. It necessitates challenging stereotypes, biases, and power imbalances embedded within societal structures. By adopting a gender-sensitive approach, development planners can design interventions that empower marginalized groups, promote equitable access to resources, and foster social cohesion.

              Gender and Development Planning: Integrating Perspectives

              Development planning involves the formulation, implementation, and evaluation of policies, programs, and projects aimed at achieving sustainable development goals. Gender mainstreaming, the integration of gender perspectives into all stages of planning processes, is essential for addressing gender inequalities effectively. This requires conducting gender analysis to identify differential impacts, engaging stakeholders from diverse backgrounds, and ensuring equitable participation and representation.

              Examining Gender-Related Issues in Planning

              Gender-related issues manifest across various dimensions of development planning:

              1. Economic Empowerment: Women often face barriers to accessing economic opportunities, including limited access to education, financial services, and property rights. Development planning should prioritize initiatives that promote women’s entrepreneurship, vocational training, and employment in non-traditional sectors.
              2. Education and Health: Gender disparities persist in education and healthcare, with women and girls facing obstacles such as early marriage, lack of reproductive health services, and cultural norms prioritizing male education. Development planners must prioritize investments in girls’ education, reproductive healthcare, and gender-responsive health programs to ensure equitable access to essential services.
              3. Political Participation: Women are underrepresented in political decision-making processes, limiting their ability to influence policy outcomes and advocate for their rights. Development planning should promote gender-balanced representation in leadership positions, implement quotas or affirmative action measures, and provide training on gender-sensitive governance practices.
              4. Social Norms and Cultural Practices: Harmful gender norms and cultural practices perpetuate inequalities and discrimination, particularly affecting marginalized groups such as LGBTQ+ individuals and indigenous communities. Development planners should engage communities in dialogue, awareness-raising, and capacity-building activities to challenge discriminatory beliefs and promote gender equality.
              5. Violence and Security: Gender-based violence remains a pervasive issue globally, undermining individuals’ safety, dignity, and well-being. Development planning should prioritize strategies for preventing and responding to violence, including legal reforms, support services for survivors, and community-based initiatives that challenge harmful attitudes and behaviors.

              In conclusion, integrating gender perspectives into development planning is essential for promoting inclusive, equitable, and sustainable development outcomes. By addressing gender disparities and promoting gender equality, development planners can contribute to building a more just and prosperous society for all.

              References

              Chant, S. (1991). Gender, migration and urban development in Costa Rica: The case of Guanacaste. Geoforum22(3), 237-253.

              Ghannam, F. (2013). Live and die like a man: Gender dynamics in urban Egypt. Stanford University Press.

              Harris, M. T., Laks, J., Stahl, N., Bagley, S. M., Saia, K., & Wechsberg, W. M. (2022). Gender dynamics in substance use and treatment: a women’s focused approach. Medical Clinics106(1), 219-234.

              Lind, A. (1997). Gender, development and urban social change: Women’s community action in global cities. World Development25(8), 1205-1223.

              Thomas-Hunt, M. C., & Phillips, K. W. (2004). When what you know is not enough: Expertise and gender dynamics in task groups. Personality and Social Psychology Bulletin30(12), 1585-1598.

              Sharma, S. N. The Complex Reality of Delhi’s Slums: A Closer Look at Urban Informality.

              Sharma, S.N., Kumar, A., & Dehalwar, K. (2024). The Precursors of Transit-oriented Development. Economic and Political Weekly, 59(14), 16–20. https://doi.org/10.5281/zenodo.10939448

              Different Types of Survey Methods

              Daily writing prompt
              If you could be a character from a book or film, who would you be? Why?

              By Shashikant Nishant Sharma

              Survey methods are essential tools for researchers to gather data from individuals about their opinions, behaviors, attitudes, and demographics. There are various survey methods, each with its strengths and weaknesses, suitable for different research contexts. Here are some common survey methods:

              Photo by fauxels on Pexels.com
              1. Questionnaires: Questionnaires are written sets of questions administered to respondents, who provide written answers. They can be distributed in person, via mail, email, or online platforms. Questionnaires are cost-effective, allow for anonymity, and can reach a large audience. However, they may suffer from low response rates and respondent bias.
              2. Interviews: Interviews involve direct interaction between the researcher and the respondent. They can be structured, semi-structured, or unstructured. Structured interviews follow a predetermined set of questions, while semi-structured and unstructured interviews allow for more flexibility and follow-up questions. Interviews are useful for gathering in-depth qualitative data but can be time-consuming and resource-intensive.
              3. Telephone Surveys: Telephone surveys involve contacting respondents by phone and asking them a series of questions. They can reach a diverse sample and have higher response rates compared to mail surveys. However, they are becoming less common due to declining landline usage and the increasing use of mobile phones, which are more challenging to survey.
              4. Online Surveys: Online surveys are conducted over the internet through email invitations, website pop-ups, or social media platforms. They are cost-effective, allow for easy data collection and analysis, and can reach a large and diverse audience. However, they may suffer from selection bias, as respondents need access to the internet, and there is a risk of fraudulent responses.
              5. Face-to-Face Surveys: Face-to-face surveys involve interviewing respondents in person, either at their homes, in public places, or through intercepts. They allow for high response rates, clarification of questions, and observation of non-verbal cues. However, they can be costly and time-consuming, and respondents may feel uncomfortable disclosing sensitive information in person.
              6. Mixed-Methods Surveys: Mixed-methods surveys combine quantitative and qualitative approaches to gather comprehensive data. For example, a survey might include closed-ended questions for quantitative analysis and open-ended questions for qualitative insights. Mixed-methods surveys provide a more complete understanding of the research topic but require careful planning and analysis.

              When selecting a survey method, researchers should consider factors such as the research objectives, target population, budget, timeline, and resources available. Additionally, researchers must ensure ethical considerations, such as obtaining informed consent, protecting respondent privacy, and minimizing bias, throughout the survey process.

              References

              Bethlehem, J. (2009). Applied survey methods: A statistical perspective. John Wiley & Sons.

              Dehalwar, K., & Sharma, S. N. (2023). Fundamentals of Research Writing and Uses of Research Methodologies. Edupedia Publications Pvt Ltd.

              Dehalwar, K., & Sharma, S. N. (2024). Exploring the Distinctions between Quantitative and Qualitative Research Methods. Think India Journal27(1), 7-15.

              Dehalwar, V., Kalam, A., Kolhe, M. L., & Zayegh, A. (2016, October). Review of machine to machine communication in smart grid. In 2016 International Conference on Smart Grid and Clean Energy Technologies (ICSGCE) (pp. 134-139). IEEE.

              Fowler Jr, F. J. (2013). Survey research methods. Sage publications.

              Moser, C. A., & Kalton, G. (2017). Survey methods in social investigation. Routledge.

              Reang, R., Dehalwar, V., & Pateriya, R. K. (2024, February). Deep Learning Techniques for Automatic Text Summarization: A Review. In 2024 IEEE International Students’ Conference on Electrical, Electronics and Computer Science (SCEECS) (pp. 1-6). IEEE.

              Schwarz, N., Groves, R. M., & Schuman, H. (1998). Survey methods. The handbook of social psychology1, 143-179.

              Empowering Growth: Track2Training’s Commitment to Personal and Professional Development

              Daily writing prompt
              If you could be a character from a book or film, who would you be? Why?

              By Shashikant Nishant Sharma

              In the dynamic landscape of today’s job market, continuous learning and development have become paramount for individuals and organizations alike. With technological advancements and evolving industry trends, the need to upskill and reskill has never been more pressing. Recognizing this demand, Track2Training emerges as a beacon of empowerment, offering tailored programs designed to foster personal and professional growth.

              Photo by Christina Morillo on Pexels.com

              Founded on the principle of democratizing education, Track2Training aims to bridge the gap between aspiration and achievement. Whether you’re a recent graduate looking to enter the workforce or a seasoned professional seeking to enhance your skill set, Track2Training provides a diverse array of courses catering to various interests and career paths.

              Customized Learning Experience

              One of the distinguishing features of Track2Training is its commitment to personalized learning. Recognizing that each individual has unique strengths, weaknesses, and learning styles, the platform employs innovative teaching methodologies to cater to diverse needs. Through a combination of interactive modules, live sessions, and hands-on projects, learners are empowered to take charge of their educational journey.

              Moreover, Track2Training’s adaptive learning algorithms ensure that course content is dynamically adjusted based on the learner’s progress and comprehension levels. This not only enhances engagement but also maximizes retention, enabling participants to apply their newfound knowledge effectively in real-world scenarios.

              Industry-Relevant Curriculum

              In today’s fast-paced world, relevance is key. Track2Training collaborates closely with industry experts and thought leaders to develop curriculum that is aligned with the latest trends and demands of the job market. From emerging technologies like artificial intelligence and blockchain to soft skills such as communication and leadership, the platform offers a comprehensive suite of courses that empower individuals to stay ahead of the curve.

              Furthermore, Track2Training regularly updates its course offerings to reflect changes in industry standards and best practices. This ensures that learners are equipped with the most up-to-date knowledge and skills, enhancing their employability and career prospects in an ever-evolving landscape.

              Community and Mentorship

              Learning is not just about acquiring knowledge; it’s also about fostering connections and gaining insights from others. Track2Training understands the importance of community and mentorship in the learning process and provides a supportive environment where learners can collaborate, share experiences, and seek guidance from experts in their respective fields.

              Through interactive forums, networking events, and one-on-one mentorship sessions, participants have the opportunity to engage with like-minded individuals and industry veterans, gaining invaluable advice and perspective along the way. This sense of camaraderie not only enhances the learning experience but also cultivates a spirit of collaboration and mutual support among members of the Track2Training community.

              Empowering Success Stories

              At Track2Training, success is measured not only by academic achievements but also by real-world impact. The platform takes pride in the success stories of its alumni, who have gone on to make meaningful contributions in their chosen fields. Whether it’s securing a dream job, launching a successful startup, or effecting positive change in their communities, Track2Training’s graduates are testament to the transformative power of education.

              From aspiring entrepreneurs to seasoned professionals, Track2Training welcomes individuals from all walks of life who are eager to learn, grow, and realize their full potential. With its commitment to personalized learning, industry relevance, community engagement, and tangible outcomes, Track2Training stands as a catalyst for empowerment in the ever-evolving landscape of education and professional development.

              References

              Dehalwar, K. Empowering Women and Strengthening Communities: The Role of Community-Based Organizations (CBOs).

              Detsimas, N., Coffey, V., Sadiqi, Z., & Li, M. (2016). Workplace training and generic and technical skill development in the Australian construction industry. Journal of management development35(4), 486-504.

              Kennett, G. (2013). The impact of training practices on individual, organisation, and industry skill development. Australian Bulletin of Labour39(1), 112-135.

              Kumar, G. A., Nain, M. S., Singh, R., Kumbhare, N. V., Parsad, R., & Kumar, S. (2021). Training effectiveness of skill development training programmes among the aspirational districts of Karnataka. Indian Journal of Extension Education57(4), 67-70.

              Meager, N. (2009). The role of training and skills development in active labour market policies. International Journal of Training and Development13(1), 1-18.

              Sharma, L., & Nagendra, A. (2016). Skill development in India: Challenges and opportunities. Indian Journal of Science and Technology.

              Sharma, S. N. (2023). Understanding Citations: A Crucial Element of Academic Writing.

              Mastering Qualitative Data Analysis and Report Writing: A Guide for Researchers

              Daily writing prompt
              What job would you do for free?

              By Kavita Dehalwar

              Qualitative research methods have gained prominence in academia and industry alike for their ability to provide rich insights into complex phenomena. However, mastering qualitative data analysis and report writing can be challenging for novice researchers. In this article, we will explore the essential steps in teaching qualitative research methods and report writing to help researchers effectively analyze data and communicate their findings.

              Understanding Qualitative Data Analysis: Qualitative data analysis involves a systematic approach to interpreting textual or visual data to uncover patterns, themes, and meanings. Unlike quantitative methods that focus on numerical data and statistical analysis, qualitative analysis emphasizes understanding the context, perspectives, and experiences of participants. Here are key steps in qualitative data analysis:

              1. Data Preparation: Organize and transcribe raw data such as interviews, focus group discussions, or observations. This step ensures data are ready for analysis and facilitates easy access during the process.
              2. Familiarization: Immersing oneself in the data by reading and re-reading transcripts or viewing recordings helps researchers gain familiarity with the content and identify initial patterns or themes.
              3. Coding: Coding involves systematically labeling segments of data with descriptive or interpretive tags. Researchers use codes to categorize data based on commonalities, differences, or recurring concepts.
              4. Theme Development: Once coding is complete, researchers identify overarching themes or patterns within the coded data. Themes represent meaningful clusters of codes that capture key aspects of the research topic.
              5. Interpretation: Researchers interpret the identified themes by examining their significance in relation to the research questions or objectives. This involves exploring relationships between themes, considering contextual factors, and generating explanations or theories.

              Teaching Qualitative Data Analysis: Teaching qualitative data analysis requires a combination of theoretical understanding and practical skills development. Here are some strategies for effective instruction:

              1. Theory and Concepts: Begin by introducing students to the fundamental principles of qualitative research, including its philosophical underpinnings, epistemological assumptions, and methodological approaches. Help students understand the rationale behind qualitative data analysis and its suitability for exploring complex social phenomena.
              2. Hands-on Practice: Provide opportunities for students to engage in hands-on data analysis exercises using real or simulated data sets. Encourage them to practice coding, identifying themes, and interpreting findings under guided supervision.
              3. Software Training: Familiarize students with qualitative data analysis software such as NVivo, ATLAS.ti, or MAXQDA. Demonstrate how these tools can streamline the coding process, facilitate data organization, and support collaborative analysis.
              4. Peer Collaboration: Promote peer collaboration and discussion among students to facilitate knowledge sharing, peer feedback, and collective sense-making. Encourage students to work in pairs or small groups to analyze data collaboratively and compare their interpretations.

              Report Writing: Effective report writing is essential for communicating qualitative research findings in a clear, coherent, and compelling manner. Here are key elements of a well-written qualitative research report:

              1. Introduction: Provide a concise overview of the research topic, objectives, and methodology. Clearly articulate the research questions or hypotheses guiding the study and justify the use of qualitative methods.
              2. Literature Review: Situate the study within the existing literature by reviewing relevant theoretical frameworks, prior research findings, and conceptual debates. Identify gaps or unresolved issues that the current study aims to address.
              3. Methodology: Describe the research design, data collection methods, and sampling strategy in detail. Explain how data were analyzed, including the coding process, software used (if applicable), and criteria for theme development.
              4. Findings: Present the key findings of the study, organized around the identified themes or patterns. Use quotes, excerpts, or visual representations to illustrate and support each theme. Provide rich descriptive detail and contextual information to enhance understanding.
              5. Discussion: Interpret the findings in relation to the research questions and theoretical framework. Discuss the implications of the findings for theory, practice, or policy, and consider any limitations or challenges encountered during the study.
              6. Conclusion: Summarize the main findings, reiterate the significance of the study, and suggest directions for future research. Reflect on the broader implications of the research and its contribution to knowledge in the field.

              Conclusion: Teaching qualitative research methods and report writing requires a combination of theoretical knowledge, practical skills development, and hands-on experience. By following a systematic approach to qualitative data analysis and report writing, researchers can effectively uncover insights, generate new knowledge, and communicate their findings to diverse audiences. With proper guidance and support, novice researchers can master the art of qualitative inquiry and make meaningful contributions to their respective fields of study.

              References

              Christensen, L. B., Johnson, B., Turner, L. A., & Christensen, L. B. (2011). Research methods, design, and analysis.

              Dehalwar, K., & Sharma, S. N. (2023). Fundamentals of Research Writing and Uses of Research Methodologies. Edupedia Publications Pvt Ltd.

              Dehalwar, K., & Sharma, S. N. (2024). Exploring the Distinctions between Quantitative and Qualitative Research Methods. Think India Journal27(1), 7-15.

              Lancaster, G. (2007). Research methods in management. Routledge.

              Patten, M. L. (2016). Understanding research methods: An overview of the essentials. Routledge.

              Sevilla, C. G. (1992). Research methods. Rex Bookstore, Inc..

              Sharma, S. N., & Dehalwar, K. (2023). Council of Planning for Promoting Planning Education and Planning Professionals. Journal of Planning Education and Research43(4), 748-749.

              Terrell, S. R. (2012). Mixed-methods research methodologies. Qualitative report17(1), 254-280.

              Williams, C. (2007). Research methods. Journal of Business & Economics Research (JBER)5(3).

              A Comprehensive Guide to Data Analysis Using R Studio

              Daily writing prompt
              What job would you do for free?

              By Shashikant Nishant Sharma

              In today’s data-driven world, the ability to effectively analyze data is becoming increasingly important across various industries. R Studio, a powerful integrated development environment (IDE) for R programming language, provides a comprehensive suite of tools for data analysis, making it a popular choice among data scientists, statisticians, and analysts. In this article, we will explore the fundamentals of data analysis using R Studio, covering essential concepts, techniques, and best practices.

              1. Getting Started with R Studio

              Before diving into data analysis, it’s essential to set up R Studio on your computer. R Studio is available for Windows, macOS, and Linux operating systems. You can download and install it from the official R Studio website (https://rstudio.com/).

              Once installed, launch R Studio, and you’ll be greeted with a user-friendly interface consisting of several panes: the script editor, console, environment, and files. Familiarize yourself with these panes as they are where you will write, execute, and manage your R code and data.

              2. Loading Data

              Data analysis begins with loading your dataset into R Studio. R supports various data formats, including CSV, Excel, SQL databases, and more. You can use functions like read.csv() for CSV files, read.table() for tab-delimited files, and read_excel() from the readxl package for Excel files.

              RCopy code# Example: Loading a CSV file
              data <- read.csv("data.csv")
              

              After loading the data, it’s essential to explore its structure, dimensions, and summary statistics using functions like str(), dim(), and summary().

              3. Data Cleaning and Preprocessing

              Before performing any analysis, it’s crucial to clean and preprocess the data to ensure its quality and consistency. Common tasks include handling missing values, removing duplicates, and transforming variables.

              RCopy code# Example: Handling missing values
              data <- na.omit(data)
              
              # Example: Removing duplicates
              data <- unique(data)
              
              # Example: Transforming variables
              data$age <- log(data$age)
              

              Additionally, you may need to convert data types, scale or normalize numeric variables, and encode categorical variables using techniques like one-hot encoding.

              4. Exploratory Data Analysis (EDA)

              EDA is a critical step in data analysis that involves visually exploring and summarizing the main characteristics of the dataset. R Studio offers a plethora of packages and visualization tools for EDA, including ggplot2, dplyr, tidyr, and ggplotly.

              RCopy code# Example: Creating a scatter plot
              library(ggplot2)
              ggplot(data, aes(x = age, y = income)) + 
                geom_point() + 
                labs(title = "Scatter Plot of Age vs. Income")
              

              During EDA, you can identify patterns, trends, outliers, and relationships between variables, guiding further analysis and modeling decisions.

              5. Statistical Analysis

              R Studio provides extensive support for statistical analysis, ranging from basic descriptive statistics to advanced inferential and predictive modeling techniques. Common statistical functions and packages include summary(), cor(), t.test(), lm(), and glm().

              RCopy code# Example: Conducting a t-test
              t_test_result <- t.test(data$income ~ data$gender)
              print(t_test_result)
              

              Statistical analysis allows you to test hypotheses, make inferences, and derive insights from the data, enabling evidence-based decision-making.

              6. Machine Learning

              R Studio is a powerhouse for machine learning with numerous packages for building and evaluating predictive models. Popular machine learning packages include caret, randomForest, glmnet, and xgboost.

              RCopy code# Example: Training a random forest model
              library(randomForest)
              model <- randomForest(target ~ ., data = data)
              

              You can train models for classification, regression, clustering, and more, using techniques such as decision trees, support vector machines, neural networks, and ensemble methods.

              7. Reporting and Visualization

              R Studio facilitates the creation of professional reports and visualizations to communicate your findings effectively. The knitr package enables dynamic report generation, while ggplot2, plotly, and shiny allow for the creation of interactive and customizable visualizations.

              RCopy code# Example: Generating a dynamic report
              library(knitr)
              knitr::kable(head(data))
              

              Interactive visualizations enhance engagement and understanding, enabling stakeholders to interactively explore the data and insights.

              Conclusion

              Data analysis using R Studio is a versatile and powerful process that enables individuals and organizations to extract actionable insights from data. By leveraging its extensive ecosystem of packages, tools, and resources, you can tackle diverse data analysis challenges effectively. Whether you’re a beginner or an experienced data scientist, mastering R Studio can significantly enhance your analytical capabilities and decision-making prowess in the data-driven world.

              In conclusion, this article has provided a comprehensive overview of data analysis using R Studio, covering essential concepts, techniques, and best practices. Armed with this knowledge, you’re well-equipped to embark on your data analysis journey with R Studio and unlock the full potential of your data.

              References

              Bhat, W. A., Khan, N. L., Manzoor, A., Dada, Z. A., & Qureshi, R. A. (2023). How to Conduct Bibliometric Analysis Using R-Studio: A Practical Guide. European Economic Letters (EEL)13(3), 681-700.

              Grömping, U. (2015). Using R and RStudio for data management, statistical analysis and graphics. Journal of Statistical Software68, 1-7.

              Horton, N. J., & Kleinman, K. (2015). Using R and RStudio for data management, statistical analysis, and graphics. CRC Press.

              Jaichandran, R., Bagath Basha, C., Shunmuganathan, K. L., Rajaprakash, S., & Kanagasuba Raja, S. (2019). Sentiment analysis of movies on social media using R studio. Int. J. Eng. Adv. Technol8, 2171-2175.

              Komperda, R. (2017). Likert-type survey data analysis with R and RStudio. In Computer-Aided Data Analysis in Chemical Education Research (CADACER): Advances and Avenues (pp. 91-116). American Chemical Society.

              Photo by Liza Summer on Pexels.com

              My Experience at Upanayana/Sacred Thread Ceremony in Hyderabad

              On April 4, 2024, I had the opportunity to observe the Upanayana/Sacred Thread ceremony, which was performed at Libdom Villa campus, Bandlaguda Jagir, Hyderabad. The Libdom Villa campus, Raj Reddy Valley, is spread over an area of 17 acres with all modern facilities. It is pertinent to mention that Libdom has been derived from two words – from Liberty, “Lib,” and from Freedom, “Dom,” and finally, the word is “Libdom.” There are 190 villas, except for a few villas; all are occupied. The families are from different parts of India and also different religious groups, so it is a mini-India. All religious festivals are celebrated here in a peaceful way. As a senior citizen, I attended many ceremony functions such as marriages, annaprashan (first rice-eating ceremony), half-saree, etc., but the Upanayana/Sacred Thread Ceremony was very few. I observed in our family and very few in other communities. One thing I have observed is that rituals are the same everywhere. For example, in the ceremony, the sacred thread or upper garment called the yajnopavita is worn by the child, which is made of cotton, the head is tonsured, and Yanga/Havan/Homa, i.e., offering prayers to Fire/Agni Dev is performed.
              The Upanayana/Sacred Thread ceremony of Sri Ram (11 years old, student of 7 grade in London), son of Smt. Srilatha and Sri Raghu started at 8.54 AM on April 4, 2024, at the Libdom Villa campus, where two priests performed rituals along with Yanga/Havan, which is common in such ceremonies also in Hindu marriages. Sri Ram’s father works in London as a software engineer. They came from London to perform the ceremony. They belong to the Telugu Brahmin family, and the child’s grandfather, Sri Radhakrishna Srimushnam, was a senior bank officer in a nationalized bank who served with dignity and settled in Hyderabad, Libdom Villa campus.
              A few facts about the Upanayana/ Sacred Thread ceremony collected from Wikipedia are presented here. Upanayana literally means “the act of leading to or near, bringing”, “introduction (into any science)” or initiation” (as elucidated by Monier-Williams). The initiation or rite of passage ceremony in which the sacred thread is given symbolizes the child drawn towards a school, towards education, by the guru. The student was being taken to the Gods and a disciplined life. It is a ceremony in which a teacher accepts and draws a child towards knowledge and initiates the second birth of the young mind and spirit. As per the website. pujanpujari.com, the Upanayana ceremony can be directed at the age of seven. The supreme mantra, the Gayathri mantra, is whispered in the child’s ear by the father or guru. The child is taken out and asked to look at the Bhagawan Surya/Sun through a small hole formed by joining both palms. The sacred thread strands represent the purity of the wearer’s thoughts, acts, and words. Through the Upanayana ceremony, the child is motivated to do spiritual activities.
              I enjoyed the ceremony and observed that the guests were from different backgrounds. Lunch was scrumptious and included many items. Lastly, I wish to mention that the Upanayana/Sacred Thread ceremony is not restricted to one particular community but is also performed by a few other communities.

              Prof Shankar Chatterjee, Hyderabad

              Bridging the Gap: Community-Based and Workshop-Based Approaches to Address Rural and Urban Planning Issues

              By Kavita Dehalwar

              The dynamics of rural and urban spaces are constantly evolving, presenting unique challenges and opportunities for planners and policymakers. In both settings, community engagement and participatory approaches are essential for sustainable development. However, the methodologies to address issues in rural and urban areas differ due to their distinct characteristics. This article explores the significance of community-based and workshop-based methods in tackling planning issues in both rural and urban environments.

              Photo by Charlotte May on Pexels.com

              Rural Planning Issues:

              Rural areas often face challenges such as limited access to basic amenities, inadequate infrastructure, economic disparities, and environmental degradation. These issues require tailored solutions that consider the specific needs and contexts of rural communities. Community-based methods involve active participation of local residents, stakeholders, and community organizations in the planning process. This approach acknowledges the unique knowledge and perspectives of rural inhabitants, empowering them to be co-creators of their own development.

              Community-based methods in rural planning often include participatory rural appraisal (PRA), community mapping, focus group discussions, and consensus-building exercises. These methods facilitate inclusive decision-making, foster social cohesion, and promote ownership of development initiatives. By engaging local communities, planners can gain insights into the socio-economic dynamics, cultural heritage, and environmental concerns that shape rural landscapes.

              Urban Planning Issues:

              Urban areas, on the other hand, grapple with challenges such as rapid urbanization, inadequate housing, traffic congestion, pollution, and social exclusion. Effective urban planning requires holistic approaches that balance economic growth, social equity, and environmental sustainability. Workshop-based methods offer a structured platform for stakeholders to collaborate, exchange ideas, and co-design solutions to complex urban problems.

              The comparative and exhaustive table outlining planning issues in urban and rural India:

              Planning IssuesUrban IndiaRural India
              Population DensityHigh population density leading to congestion,Low population density with scattered settlements,
              pressure on infrastructure, and housingbut pockets of high population density in some
              shortages.regions.
              InfrastructureInadequate infrastructure including roads,Limited access to basic amenities such as
              water supply, sanitation, and waste management.clean water, electricity, sanitation, and roads.
              HousingInformal settlements, slums, and housingLack of affordable housing, poor quality housing,
              shortages leading to overcrowding andand traditional construction methods.
              inadequate living conditions.
              EmploymentFormal and informal sectors, but high rates ofAgriculture-based livelihoods, seasonal migration
              unemployment and underemployment.to cities for employment opportunities.
              EconomyDiverse economic activities includingAgriculture-dependent economy with low income
              manufacturing, services, and commerce.levels and limited diversification.
              EducationAccess to quality education but disparities inLimited access to schools, especially higher
              rural-urban divide.education institutions.
              HealthcareHealthcare facilities available but disparitiesLimited healthcare infrastructure, lack of
              in quality and accessibility, especially intrained medical professionals, and inadequate
              rural areas.access to healthcare services.
              EnvironmentPollution, degradation of natural resources,Deforestation, soil erosion, water scarcity,
              and loss of green spaces.and pollution from agricultural practices.
              GovernanceComplex governance structures, bureaucraticLimited access to government services,
              hurdles, and corruption.bureaucratic inefficiencies, and corruption.
              Social InclusionUrban poverty, social exclusion, and disparitiesMarginalization of marginalized communities,
              in access to resources and opportunities.caste-based discrimination, and lack of
              social infrastructure.

              This table provides a comprehensive overview of the planning issues in both urban and rural India, highlighting the diverse challenges faced by each setting. These issues necessitate tailored planning and policy interventions to address the unique needs and contexts of urban and rural communities.

              Workshop-based methods in urban planning often involve charrettes, design thinking sessions, urban labs, and scenario planning exercises. These workshops bring together diverse stakeholders, including residents, businesses, government agencies, and non-profit organizations, to brainstorm innovative strategies and visualize future scenarios for urban development. By fostering cross-sectoral collaboration and creative problem-solving, workshop-based methods facilitate the integration of diverse perspectives into urban planning processes.

              Bridging the Gap:

              While rural and urban planning issues may differ in scale and scope, there are common principles that underpin effective planning approaches in both contexts. Community engagement, participatory decision-making, and capacity building are key elements that can bridge the gap between rural and urban planning practices.

              In rural areas, community-based methods empower local residents to identify their priorities, leverage local resources, and build resilient communities. By fostering a sense of ownership and agency, these methods can help address issues such as poverty alleviation, sustainable agriculture, and natural resource management.

              In urban areas, workshop-based methods facilitate collaboration between various stakeholders to address complex urban challenges. By harnessing the collective intelligence of diverse actors, these methods can lead to innovative solutions for improving urban livability, promoting inclusive growth, and enhancing environmental quality.

              Conclusion:

              In conclusion, addressing rural and urban planning issues requires a nuanced understanding of local contexts, stakeholders, and dynamics. Community-based and workshop-based methods offer complementary approaches to engage residents, foster collaboration, and co-create sustainable solutions. By combining the strengths of these methodologies, planners and policymakers can navigate the complexities of rural and urban landscapes, and work towards building inclusive, resilient, and vibrant communities for the future.

              References

              Dehalwar, K., & Sharma, S. N. (2023). Fate of Slums of Bhopal-A Tale of Struggle and Resilience. Think India Journal26(4), 12-18.

              Dehalwar, K., & Singh, J. (2016). Challenges and strategies for the improvement of water management in Bhopal. European Scientific Journal12(2).

              Levy, J. M., Hirt, S., & Dawkins, C. J. (2009). Contemporary urban planning. Upper Saddle River: Pearson/Prentice Hall.

              Pinson, D. (2004). Urban planning: an ‘undisciplined’discipline?. Futures36(4), 503-513.

              Sharma, S. N. (2014). Participatory Planning in Plan Preparation. BookCountry.

              Sharma, S. N., & Abhishek, K. (2015). Planning Issue in Roorkee Town. Planning.

              Sharma, S. N. (2005). Evaluation of the JnNURM Programme of Government of India for Urban Renewal. Think India Journal8(2), 1-7.

              Watson, V. (2009). Seeing from the South: Refocusing urban planning on the globe’s central urban issues. Urban studies46(11), 2259-2275.