Construction management at the site is a critical aspect of the construction industry, focusing on the meticulous planning, coordination, and supervision of a project from inception to completion. Effective site management ensures that projects are delivered on time, within budget, and to the required quality standards. Here, we delve into the key components and practices that make construction management at the site successful.
Pre-construction planning sets the foundation for successful site management. It involves:
Project Scope Definition: Clearly defining the project’s objectives, deliverables, and deadlines.
Budgeting: Establishing a realistic budget considering all potential costs.
Scheduling: Creating a detailed project schedule outlining all phases and milestones.
Risk Assessment: Identifying potential risks and developing mitigation strategies.
2. Site Preparation
Proper site preparation ensures that the project starts on a solid footing. This includes:
Site Surveys and Investigations: Conducting thorough surveys to understand site conditions.
Clearing and Excavation: Preparing the site by clearing vegetation, debris, and excavating as needed.
Setting Up Temporary Facilities: Establishing site offices, storage areas, and worker accommodations.
3. Resource Management
Efficient management of resources—human, material, and equipment—is vital. Key aspects include:
Labor Management: Recruiting skilled labor and ensuring proper workforce allocation.
Material Procurement: Timely procurement of quality materials to avoid delays.
Equipment Management: Ensuring availability and proper maintenance of construction equipment.
4. Quality Control
Maintaining high-quality standards throughout the construction process is essential. This involves:
Inspections and Testing: Regular inspections and testing of materials and workmanship.
Compliance: Ensuring compliance with building codes, standards, and specifications.
Documentation: Keeping detailed records of quality checks and corrective actions taken.
5. Safety Management
Safety is paramount in construction. Effective safety management includes:
Safety Plans: Developing comprehensive safety plans and protocols.
Training: Providing safety training for all site personnel.
Monitoring: Continuous monitoring and enforcement of safety practices.
6. Communication and Coordination
Seamless communication and coordination among stakeholders are crucial. This can be achieved through:
Regular Meetings: Conducting regular progress meetings with project teams and stakeholders.
Reporting: Providing timely updates through detailed progress reports.
Collaboration Tools: Utilizing modern collaboration tools and software for real-time communication.
7. Change Management
Construction projects often encounter changes due to various factors. Effective change management involves:
Change Requests: Formalizing the process for requesting changes.
Impact Analysis: Assessing the impact of changes on schedule, budget, and quality.
Approval Process: Establishing a clear approval process for changes.
8. Progress Monitoring and Reporting
Continuous monitoring and reporting of project progress ensure that the project stays on track. Key practices include:
Progress Tracking: Using project management software to track progress against the schedule.
Performance Metrics: Monitoring key performance indicators (KPIs) to measure efficiency and productivity.
Adjustments: Making necessary adjustments based on progress reports and feedback.
9. Completion and Handover
Successful completion and handover involve:
Final Inspections: Conducting thorough inspections to ensure all work meets the required standards.
Punch List: Creating a punch list of any outstanding items and ensuring their completion.
Handover Documentation: Preparing and handing over all necessary documentation, including warranties, manuals, and as-built drawings.
10. Post-Construction Evaluation
Post-construction evaluation provides valuable insights for future projects. It involves:
Lessons Learned: Conducting a review to capture lessons learned.
Performance Review: Evaluating the performance of the project team and subcontractors.
Client Feedback: Gathering feedback from the client to assess satisfaction and areas for improvement.
Conclusion
Effective construction management at the site is a multifaceted process that requires meticulous planning, resourcefulness, and a proactive approach to problem-solving. By adhering to best practices in site management, construction managers can ensure that projects are completed efficiently, safely, and to the highest quality standards, ultimately leading to successful project delivery and client satisfaction.
Thematic study is a qualitative research technique employed to identify, analyze, and report patterns (themes) within data. This method is highly valuable in various fields, including social sciences, psychology, and market research, as it provides insights into the underlying themes that characterize a particular phenomenon.
What is Thematic Analysis?
Thematic analysis is a method for systematically identifying, organizing, and offering insight into patterns of meaning (themes) across a dataset. It allows researchers to interpret and make sense of collective or shared meanings and experiences. This method is flexible and can be applied across a range of theoretical and epistemological approaches.
Steps in Thematic Analysis
The thematic analysis process generally involves six key phases:
Familiarization with the Data:
This initial phase involves immersing oneself in the data to get a thorough understanding of its content. Researchers transcribe verbal data, read through the text multiple times, and begin noting initial observations and potential codes.
Generating Initial Codes:
Coding involves organizing the data into meaningful groups. This is done by identifying features of the data that appear interesting and systematically tagging them with codes. Codes are the building blocks of themes, and they capture the essence of the data segments.
Searching for Themes:
In this phase, researchers examine the codes to identify significant broader patterns of meaning. Themes are constructed by grouping related codes and data extracts. This phase often involves the creation of thematic maps to visualize relationships between codes and themes.
Reviewing Themes:
Themes are then reviewed and refined to ensure they accurately represent the data. This involves checking if the themes work in relation to the coded extracts and the entire dataset. Themes may be split, combined, or discarded during this phase.
Defining and Naming Themes:
Each theme is then clearly defined and named, which involves formulating a concise description that captures the essence of the theme. Researchers develop a detailed analysis for each theme, describing its scope and the specific data it encompasses.
Producing the Report:
The final phase involves weaving together the themes into a coherent narrative. This report includes compelling data extracts that provide evidence for the themes and illustrates the story the data tells.
Applications of Thematic Analysis
Thematic analysis can be applied in various contexts and for multiple purposes:
Understanding Experiences:
It helps in understanding the experiences and perspectives of individuals or groups by identifying common themes in their narratives. For instance, it can be used to explore patient experiences in healthcare settings.
Developing Interventions:
Themes identified through thematic analysis can inform the development of interventions. For example, themes related to barriers and facilitators in smoking cessation can guide the creation of targeted public health interventions.
Policy Development:
By identifying recurring themes in public opinion or stakeholder feedback, thematic analysis can inform policy development and decision-making.
Market Research:
In market research, thematic analysis can help understand consumer preferences and behaviors, thereby guiding product development and marketing strategies.
Advantages of Thematic Analysis
Flexibility: It is a highly adaptable method that can be used across various research questions and types of data.
Richness of Data: It provides a detailed and nuanced understanding of the data, allowing for in-depth analysis.
Accessibility: The approach is relatively easy to learn and apply, making it accessible to novice researchers.
Challenges and Limitations
Subjectivity: The analysis can be influenced by the researcher’s biases and perspectives, which might affect the interpretation of the data.
Complexity: Handling large datasets can be overwhelming, and ensuring the reliability and validity of the themes requires meticulous work.
Time-Consuming: The process is often time-intensive, requiring a significant amount of effort to thoroughly analyze the data.
Enhancing Rigor in Thematic Analysis
To enhance the rigor of thematic analysis, researchers can adopt the following strategies:
Triangulation: Using multiple data sources or analytical perspectives to cross-verify the findings.
Peer Review: Engaging other researchers to review and critique the themes and interpretations.
Member Checking: Returning to the participants to validate the findings and ensure the accuracy of the themes.
Conclusion
Thematic analysis is a powerful qualitative research technique that allows researchers to uncover the underlying themes within data. Through a systematic process, it provides deep insights into various phenomena, making it an invaluable tool in multiple research fields. Despite its challenges, the benefits of thematic analysis in providing rich, detailed, and nuanced understanding make it a widely adopted and respected method in qualitative research.
References
Agarwal, S., & Sharma, S. N. (2014). Universal Design to Ensure Equitable Society. International Journal of Engineering and Technical Research (IJETR), 1.
Dana, R. H. (1968). Thematic techniques and clinical practice. Journal of Projective Techniques and Personality Assessment, 32(3), 204-214.
Dehalwar, K. Mastering Qualitative Data Analysis and Report Writing: A Guide for Researchers.
Dehalwar, K., & Sharma, S. N. (2024). Exploring the Distinctions between Quantitative and Qualitative Research Methods. Think India Journal, 27(1), 7-15.
Dehalwar, K., & Sharma, S. N. (2023). Fundamentals of Research Writing and Uses of Research Methodologies. Edupedia Publications Pvt Ltd.
Palmer, C. L. (2004). Thematic research collections. A companion to digital humanities, 348-365.
Smith, D. A. (2016). Online interactive thematic mapping: Applications and techniques for socio-economic research. Computers, Environment and Urban Systems, 57, 106-117.
Thomas, J., & Harden, A. (2008). Methods for the thematic synthesis of qualitative research in systematic reviews. BMC medical research methodology, 8, 1-10.
Grounded theory research is a qualitative methodology that aims to generate or discover a theory through the collection and analysis of data. Unlike traditional research methods that begin with a hypothesis, grounded theory starts with data collection and uses it to develop theories grounded in real-world observations. This approach is particularly valuable in social sciences, where understanding complex human behaviors and interactions is essential.
Origins and Evolution
Grounded theory was developed in the 1960s by sociologists Barney Glaser and Anselm Strauss. Their seminal work, The Discovery of Grounded Theory (1967), introduced a new approach to qualitative research that emphasized the generation of theory from data. This was a departure from the traditional positivist approach, which often tested existing theories through quantitative methods.
Over the decades, grounded theory has evolved, with Glaser and Strauss eventually diverging in their approaches. Glaser’s approach remains more aligned with the original inductive methodology, while Strauss, along with Juliet Corbin, introduced a more structured and systematic method of coding and analyzing data, as detailed in their book Basics of Qualitative Research.
Core Principles
Grounded theory is built on several core principles:
Theoretical Sensitivity: Researchers must be open to understanding the subtleties and nuances in the data, allowing theories to emerge naturally without preconceived notions.
Simultaneous Data Collection and Analysis: Data collection and analysis occur concurrently, allowing for constant comparison and theory refinement throughout the research process.
Coding: This involves breaking down data into discrete parts, closely examining and comparing these parts, and grouping them into categories. Strauss and Corbin’s approach includes three types of coding: open, axial, and selective.
Memo-Writing: Researchers write memos throughout the research process to document their thoughts, hypotheses, and theoretical ideas, aiding in the development and refinement of the emerging theory.
Theoretical Sampling: Data collection is guided by the emerging theory, with researchers seeking out new data to fill gaps and refine categories until theoretical saturation is achieved.
Constant Comparison: Each piece of data is compared with others to identify patterns and variations, ensuring the theory is deeply rooted in the data.
Conducting Grounded Theory Research
Initial Data Collection: Researchers begin by collecting data through various qualitative methods, such as interviews, observations, and document analysis. The goal is to gather rich, detailed information about the phenomenon under study.
Open Coding: During this initial phase, researchers break down the data into smaller parts, labeling and categorizing each segment. This process helps identify initial patterns and themes.
Axial Coding: Here, researchers focus on reassembling the data by identifying relationships between categories. This involves linking subcategories to main categories, often through a process of identifying causal conditions, contexts, strategies, and consequences.
Selective Coding: Researchers integrate and refine the categories to develop a coherent theory. This final phase involves selecting the core category around which the other categories are organized, refining relationships, and validating the theory against the data.
Theoretical Saturation: Researchers continue collecting and analyzing data until no new information or categories emerge. This indicates that the theory is well-developed and grounded in the data.
Applications and Impact
Grounded theory has been widely used across various fields, including sociology, psychology, education, nursing, and business. Its flexibility and inductive nature make it particularly useful for exploring new or complex phenomena where existing theories may not adequately explain the data.
For example, in healthcare, grounded theory has been used to understand patient experiences, the dynamics of healthcare teams, and the development of health policies. In education, it has helped uncover the processes of learning and teaching, student motivation, and curriculum development.
Challenges and Criticisms
Despite its strengths, grounded theory is not without its challenges and criticisms. Some researchers argue that the method can be too subjective, as the researcher’s interpretations play a significant role in data analysis. Others point out that the iterative nature of data collection and analysis can be time-consuming and labor-intensive.
Additionally, the divergence in methodologies between Glaser and Strauss has led to debates about the “correct” way to conduct grounded theory research. Researchers must navigate these differing approaches and determine which best fits their study’s goals and context.
Conclusion
Grounded theory research offers a robust framework for generating theories that are deeply rooted in empirical data. Its emphasis on inductive reasoning and iterative analysis allows researchers to uncover the underlying structures of human experience and behavior. While it presents certain challenges, its flexibility and depth make it an invaluable tool in the qualitative research arsenal. By remaining grounded in the data, researchers can develop theories that offer meaningful insights and contribute to a deeper understanding of complex social phenomena.
References
Breckenridge, J., & Jones, D. (2009). Demystifying theoretical sampling in grounded theory research. Grounded Theory Review, 8(2).
Dehalwar, K., & Sharma, S. N. (2023). Fundamentals of Research Writing and Uses of Research Methodologies. Edupedia Publications Pvt Ltd.
Dougherty, D. (2017). Grounded theory research methods. The Blackwell companion to organizations, 849-866.
Dunne, C. (2011). The place of the literature review in grounded theory research. International journal of social research methodology, 14(2), 111-124.
Holton, J. A. (2008). Grounded theory as a general research methodology. The grounded theory review, 7(2), 67-93.
McGhee, G., Marland, G. R., & Atkinson, J. (2007). Grounded theory research: literature reviewing and reflexivity. Journal of advanced nursing, 60(3), 334-342.
Oktay, J. S. (2012). Grounded theory. Oxford University Press.
Sharma, S. N., & Adeoye, M. A. (2024). New Perspectives on Transformative Leadership in Education. EduPedia Publications Pvt Ltd.
In an age where mobility and transportation are pivotal to societal progress, the role of a Road Safety Expert has never been more critical. These professionals are dedicated to minimizing traffic accidents and enhancing the safety of all road users, including drivers, pedestrians, cyclists, and motorcyclists. This article explores the multifaceted job of a Road Safety Expert, highlighting their responsibilities, required skills, and the impact they make on our daily lives.
One of the primary tasks of a Road Safety Expert is collecting and analyzing data related to road accidents and traffic flow. This data includes accident reports, traffic volume statistics, and observational studies. By scrutinizing this information, experts identify patterns and underlying causes of road incidents, which is crucial for developing effective safety strategies.
2. Designing Safety Programs
Based on their data analysis, Road Safety Experts design and implement comprehensive road safety programs. These programs can range from public awareness campaigns to engineering solutions like improved road signage, better lighting, and safer pedestrian crossings. The goal is to reduce accident rates and enhance overall road safety.
3. Policy Development and Advocacy
Road Safety Experts often work closely with government bodies and policymakers to develop and advocate for regulations that enhance road safety. They provide expert opinions on traffic laws, vehicle standards, and road design guidelines, ensuring that these regulations are grounded in empirical evidence and best practices.
4. Conducting Safety Audits
A significant aspect of their job involves conducting road safety audits. These audits are thorough examinations of existing road conditions and traffic systems. The experts identify potential hazards and recommend modifications to improve safety. This might involve redesigning dangerous intersections, implementing traffic calming measures, or improving road maintenance.
5. Training and Education
Educating the public and professionals about road safety is another critical role. Road Safety Experts develop training programs for drivers, school children, and even road maintenance workers. They might also conduct workshops and seminars to raise awareness about the importance of road safety and safe driving practices.
Essential Skills and Qualifications
1. Technical Knowledge
A strong foundation in civil engineering, traffic engineering, or transportation planning is essential. Knowledge of road design principles, traffic flow theories, and accident analysis techniques forms the bedrock of their expertise.
2. Analytical Skills
The ability to analyze complex data sets and derive meaningful insights is crucial. Road Safety Experts must be proficient in using statistical software and geographic information systems (GIS) to interpret data and visualize safety trends.
3. Communication Skills
Effective communication is vital for advocating safety measures and educating the public. Road Safety Experts must be able to convey technical information in a clear and persuasive manner to various stakeholders, including government officials, engineers, and the general public.
4. Attention to Detail
Given the potential consequences of their work, a meticulous approach is necessary. Road Safety Experts must thoroughly evaluate road conditions and traffic patterns, identifying even the smallest risk factors that could lead to accidents.
Impact on Society
The work of Road Safety Experts has a profound impact on society. By reducing the frequency and severity of road accidents, they help save lives and prevent injuries. Their efforts contribute to smoother traffic flow, less congestion, and a more efficient transportation system. Moreover, enhancing road safety fosters a sense of security among all road users, encouraging more people to use non-motorized forms of transport, such as cycling and walking, which also benefits public health and the environment.
Conclusion
The role of a Road Safety Expert is indispensable in creating a safer and more sustainable transportation system. Their expertise in data analysis, safety program design, policy development, and education significantly contributes to reducing road accidents and saving lives. As urbanization continues and traffic volumes increase, the demand for skilled Road Safety Experts will undoubtedly grow, underscoring the importance of their role in ensuring that our journeys are not only efficient but also safe.
References
Agarwal, S., & Sharma, S. N. (2014). Universal Design to Ensure Equitable Society. International Journal of Engineering and Technical Research (IJETR), 1.
Huvarinen, Y., Svatkova, E., Oleshchenko, E., & Pushchina, S. (2017). Road safety audit. Transportation Research Procedia, 20, 236-241.
Korchagin, V., Pogodaev, A., Kliavin, V., & Sitnikov, V. (2017). Scientific basis of the expert system of road safety. Transportation Research Procedia, 20, 321-325.
Proctor, S., Belcher, M., & Cook, P. (2001). Practical road safety auditing. Thomas Telford.
Sayed, T. A. (1995). A highway safety expert system: A new approach to safety programs (Doctoral dissertation, University of British Columbia).
Sharma, S. N. Enhancing Safety Analysis with Surrogate Methods: A Focus on Uncontrolled Traffic Intersections.
Sharma, S. N., & Adeoye, M. A. (2024). New Perspectives on Transformative Leadership in Education. EduPedia Publications Pvt Ltd.
Sharma, S. N., & Singh, D. (2023). Understanding mid-block traffic analysis: A crucial tool for road safety. Think India Journal, 26(3), 5-9.
Singh, D., Das, P., & Ghosh, I. (2024). Bridging conventional and proactive approaches for road safety analytic modeling and future perspectives. Innovative Infrastructure Solutions, 9(5), 1-21.
Toroyan, T. (2009). Global status report on road safety. Injury prevention, 15(4), 286-286.
Artificial Intelligence (AI) is revolutionizing various sectors, and public transport is no exception. With the ability to process vast amounts of data and make real-time decisions, AI is enhancing the efficiency, safety, and convenience of public transportation systems worldwide. Here are some of the key applications of AI in public transport:
1. Predictive Maintenance
AI-driven predictive maintenance systems use data from sensors placed on vehicles and infrastructure to predict when a part is likely to fail. This proactive approach allows for maintenance to be performed before breakdowns occur, reducing downtime and improving reliability. By analyzing patterns and trends, AI can forecast potential issues, ensuring that vehicles are always in optimal condition.
2. Traffic Management
AI algorithms are being used to manage traffic flow in real-time. By analyzing data from traffic cameras, sensors, and GPS devices, AI can adjust traffic light timings, reroute buses, and provide real-time updates to commuters. This helps to reduce congestion, minimize delays, and enhance the overall efficiency of the public transport network.
3. Autonomous Vehicles
Self-driving buses and trains are one of the most exciting applications of AI in public transport. Autonomous vehicles can operate with precision, adhere to schedules, and reduce human error. Pilot programs for autonomous buses are already underway in several cities, promising a future where public transport is not only more efficient but also safer and more reliable.
4. Smart Ticketing and Payment Systems
AI-powered ticketing systems are simplifying the payment process for passengers. Using machine learning algorithms, these systems can provide dynamic pricing based on demand, offer personalized travel recommendations, and streamline fare collection. Contactless payment options and mobile ticketing apps enhance the convenience for users, reducing the need for physical tickets and cash transactions.
5. Route Optimization
AI can analyze vast amounts of data to determine the most efficient routes for public transport vehicles. This includes considering factors such as traffic conditions, passenger demand, and historical data. By optimizing routes, AI helps in reducing travel time, lowering fuel consumption, and improving the overall service quality for passengers.
6. Passenger Information Systems
AI enhances passenger information systems by providing real-time updates on schedules, delays, and disruptions. Chatbots and virtual assistants powered by AI can answer passenger queries, provide travel recommendations, and assist with trip planning. These systems improve the passenger experience by ensuring that they have access to accurate and timely information.
7. Safety and Security
AI is playing a crucial role in improving safety and security in public transport. Surveillance systems equipped with AI can detect unusual behavior, monitor crowd density, and identify potential threats. Facial recognition technology can be used to enhance security measures, ensuring that public transport systems remain safe for all users.
8. Energy Efficiency
AI can optimize the energy consumption of public transport vehicles. By analyzing data on fuel usage, driving patterns, and environmental conditions, AI systems can suggest ways to reduce energy consumption and emissions. This not only lowers operational costs but also contributes to a more sustainable and environmentally friendly public transport system.
9. Accessibility
AI applications are making public transport more accessible to individuals with disabilities. AI-powered apps can provide real-time information on accessible routes, help with navigation, and even assist with boarding and alighting from vehicles. This ensures that public transport is inclusive and caters to the needs of all passengers.
Conclusion
The integration of AI into public transport systems is transforming the way we travel. From improving operational efficiency and safety to enhancing the passenger experience, AI is paving the way for smarter, more reliable, and more sustainable public transport. As AI technology continues to advance, we can expect even more innovative applications that will further revolutionize the public transport industry.
References
Costa, V., Fontes, T., Costa, P. M., & Dias, T. G. (2015). Prediction of journey destination in urban public transport. In Progress in Artificial Intelligence: 17th Portuguese Conference on Artificial Intelligence, EPIA 2015, Coimbra, Portugal, September 8-11, 2015. Proceedings 17 (pp. 169-180). Springer International Publishing.
Jevinger, Å., Zhao, C., Persson, J. A., & Davidsson, P. (2024). Artificial intelligence for improving public transport: a mapping study. Public Transport, 16(1), 99-158.
Kouziokas, G. N. (2017). The application of artificial intelligence in public administration for forecasting high crime risk transportation areas in urban environment. Transportation research procedia, 24, 467-473.
Lodhia, A. S., Jaiswalb, A., & Sharmac, S. N. (2023). An Investigation into the Recent Developments in Intelligent Transport System. In Proceedings of the Eastern Asia Society for Transportation Studies (Vol. 14).
Okrepilov, V. V., Kovalenko, B. B., Getmanova, G. V., & Turovskaj, M. S. (2022). Modern trends in artificial intelligence in the transport system. Transportation Research Procedia, 61, 229-233.
Sharma, S. N., Dehalwar, K., & Singh, J. (2023). Cellular Automata Model for Smart Urban Growth Management.
Ushakov, D., Dudukalov, E., Shmatko, L., & Shatila, K. (2022). Artificial Intelligence as a factor of public transportations system development. Transportation Research Procedia, 63, 2401-2408.
In recent years, the construction industry has witnessed a significant transformation with the rise of prefabricated building construction. This method involves assembling components of a structure in a manufacturing site and transporting complete assemblies or sub-assemblies to the construction site where the structure is to be located. This innovative approach not only accelerates building timelines but also offers improvements in cost, quality, and sustainability.
What is Prefabricated Building Construction?
Prefabricated building construction, also known as modular construction, involves the off-site manufacturing of building sections, known as modules. These modules are constructed in a controlled factory setting, where environmental factors can be managed to avoid delays. Once completed, these modules are transported to the building site and assembled to form a fully functional structure.
The technology used in prefabricated construction has evolved significantly, allowing for greater complexities in design and larger scales of construction. This method is used for a wide range of buildings, from single residential units to large-scale commercial projects.
Benefits of Prefabricated Building Construction
1. Efficiency and Speed: Construction speed is one of the most significant advantages of prefabrication. Buildings can be completed 30% to 50% quicker than those using traditional construction methods. This is largely due to the simultaneous progress in site preparation and building manufacturing, which drastically cuts down overall project time.
2. Cost-Effectiveness: Although the initial costs might be similar or slightly higher than traditional construction, prefabricated building construction saves money in the long run. This saving is due to reduced construction times, decreased labor costs, and less waste.
3. Quality Control: Since the components are manufactured in a controlled environment, the quality is often superior to that of traditional construction, where environmental factors and varying skill levels can affect the build.
4. Sustainability: Prefabricated construction is often more sustainable than traditional construction methods. The controlled factory environment leads to more accurate assemblies, better air filtration, and tighter joints, which make the buildings more energy-efficient. Moreover, the factory setting allows for recycling materials, controlling inventory, and optimizing material usage which reduces waste.
5. Safety: Enhanced safety is another crucial benefit of prefabricated construction. Factory settings are less hazardous compared to construction sites, and workers are not exposed to environmental hazards and risks associated with traditional construction sites, such as extreme weather and heights.
Challenges and Considerations
While prefabricated building construction offers numerous benefits, there are also challenges that need to be addressed:
1. Transportation: The larger the modules, the more complex and costly it becomes to transport them to the site. Logistics require careful planning and sometimes special transportation permits.
2. Design Limitations: Although technology has advanced, there are still some design limitations compared to traditional methods. Complex, non-repetitive structures can be more challenging to achieve with prefabrication.
3. Upfront Planning: Prefabrication requires detailed planning and coordination at the early stages of a project. Changes to the design after the production process begins can be costly and difficult to implement.
4. Market Perception: There is a perception issue where some clients believe prefabricated buildings are inferior or less durable than traditional structures, though this is changing as more high-quality projects are completed.
Conclusion
Prefabricated building construction is poised to be a game-changer in the construction industry. With the ongoing advancements in technology and increasing focus on sustainable development, it offers an efficient, economical, and environmentally friendly alternative to traditional construction methods. As the industry overcomes the existing challenges and more successes are documented, prefabricated construction is likely to become more prevalent globally, shaping the future of how buildings are created.
References
Baghchesaraei, A., Kaptan, M. V., & Baghchesaraei, O. R. (2015). Using prefabrication systems in building construction. International journal of applied engineering research, 10(24), 44258-44262.
Fard, M. M., Terouhid, S. A., Kibert, C. J., & Hakim, H. (2017). Safety concerns related to modular/prefabricated building construction. International journal of injury control and safety promotion, 24(1), 10-23.
Jaillon, L., & Poon, C. S. (2010). Design issues of using prefabrication in Hong Kong building construction. Construction Management and Economics, 28(10), 1025-1042.
Navaratnam, S., Ngo, T., Gunawardena, T., & Henderson, D. (2019). Performance review of prefabricated building systems and future research in Australia. Buildings, 9(2), 38.
Shashikant Nishant Sharma , Dr. Kavita Dehalwar , Arjun Singh Lodhi , Gopal Kumar,”PREFABRICATED BUILDING CONSTRUCTION: A THEMATIC ANALYSIS APPROACH “, Futuristic Trends in Construction Materials & Civil Engineering Volume 3 Book 1,IIP Series, Volume 3, May, 2024, Page no.91-114, e-ISBN: 978-93-5747-479-5
In the modern era of urbanization and environmental awareness, site suitability analysis plays a pivotal role in guiding sustainable development. It is a comprehensive process that evaluates the suitability of a particular location for specific uses, balancing socio-economic benefits with environmental sustainability. By identifying the optimal locations for development, site suitability analysis minimizes environmental impacts and maximizes resource efficiency, ensuring projects align with local regulations and community needs.
Understanding the Process
Site suitability analysis involves a multidisciplinary approach that integrates geographic, environmental, economic, and social data. It typically includes several steps:
Define Objectives:
Establish the purpose of the analysis, such as residential zoning, industrial development, or conservation efforts. Clear objectives guide data collection and evaluation criteria.
Data Collection:
Gather relevant information about the site, including topography, soil quality, hydrology, climate, land use patterns, infrastructure, and socio-economic data.
Assessment Criteria:
Develop a framework of criteria based on objectives. For instance, residential development may prioritize proximity to schools and healthcare facilities, while agricultural suitability might focus on soil quality and water availability.
Developing a framework of criteria for site suitability analysis begins by clearly defining the objectives for each type of development or use. The criteria selected should directly support these objectives, ensuring that the analysis accurately reflects the needs and priorities of the project.
For residential development, the framework might include criteria such as:
Proximity to essential services: Evaluate the distance to schools, healthcare facilities, shopping centers, and public transportation. Closer proximity enhances the quality of life for residents and can increase property values.
Safety: Consider crime rates and public safety measures in potential areas to ensure resident security.
Environmental quality: Include measures of air and noise pollution to ensure a healthy living environment.
Infrastructure: Assess the availability and quality of essential utilities like water, electricity, and internet service.
For agricultural development, the criteria would be quite different, focusing on aspects such as:
Soil quality: Analyze soil composition, pH levels, and fertility to determine the suitability for various types of crops.
Water availability: Assess local water resources to ensure sufficient irrigation capabilities, considering both surface and groundwater sources.
Climate: Evaluate local climate conditions, including average temperatures and precipitation patterns, which directly affect agricultural productivity.
Accessibility: Include the ease of access to markets and processing facilities to reduce transportation costs and spoilage of agricultural products.
In both cases, these criteria are quantified and, where necessary, weighted to reflect their importance relative to the overall goals of the project. This structured approach ensures that the site suitability analysis is both comprehensive and aligned with the strategic objectives, leading to more informed and effective decision-making.
Data Analysis:
Utilize Geographic Information System (GIS) tools and statistical models to analyze spatial data against criteria. This step often involves weighting factors to reflect their relative importance.
During the data analysis phase of site suitability analysis, Geographic Information System (GIS) tools and statistical models are employed to evaluate spatial data against established criteria. This sophisticated analysis involves layering various data sets—such as environmental characteristics, infrastructural details, and socio-economic information—within a GIS framework to assess each location’s compatibility with the desired outcomes.
A critical component of this phase is the application of weighting factors to different criteria based on their relative importance. These weights are determined by the objectives of the project and the priorities of the stakeholders, ensuring that more crucial factors have a greater influence on the final analysis. For example, in a project prioritizing environmental conservation, factors like biodiversity and water quality might be assigned higher weights compared to access to road networks.
GIS tools enable the visualization of complex datasets as interactive maps, making it easier to identify patterns and relationships that are not readily apparent in raw data. Statistical models further assist in quantifying these relationships, providing a robust basis for scoring and ranking the suitability of different areas. This rigorous analysis helps ensure that decisions are data-driven and align with strategic planning objectives, enhancing the efficiency and sustainability of development projects.
Mapping and Scoring:
In the mapping and scoring phase of site suitability analysis, the collected and analyzed data are transformed into visual representations—maps that highlight the suitability of different areas for specific uses. These maps are created using Geographic Information System (GIS) technology, which allows for the layering of various datasets including environmental attributes, infrastructural factors, and socio-economic indicators. Each area is scored based on its alignment with the predetermined criteria; these scores are then color-coded or symbolized to indicate varying levels of suitability. The resulting maps serve as practical tools for decision-makers, enabling them to visually identify and compare the most suitable locations for development, conservation, or other purposes. This process not only simplifies complex data into an understandable format but also ensures that decisions are grounded in a comprehensive and systematic evaluation, leading to more informed, efficient, and sustainable outcomes.
Decision-Making:
Interpret the results to inform planning decisions. This may involve consultation with stakeholders to ensure decisions reflect broader community goals.
In the decision-making phase of site suitability analysis, the results obtained from mapping and scoring are interpreted to guide planning and development decisions. This step involves a detailed examination of the visualized data to identify the most optimal locations for specific projects or uses based on their suitability scores. Planners and decision-makers may consider various factors, such as economic viability, environmental impact, and social acceptability.
Consultation with stakeholders is crucial at this stage. Engaging local communities, business owners, government officials, and other relevant parties ensures that the decisions made reflect the broader goals and needs of the community. This collaborative approach helps to balance different interests and priorities, which is essential for the successful implementation of sustainable development projects.
By integrating stakeholder feedback and aligning it with the analytical data from the site suitability analysis, decision-makers can develop plans that are not only technically sound but also socially and environmentally responsible. This holistic approach fosters greater community support and enhances the effectiveness of the development initiatives, leading to more sustainable and inclusive outcomes.
Applications and Benefits
Site suitability analysis offers benefits across various sectors. In urban planning, it identifies optimal locations for new infrastructure, helping to reduce traffic congestion and improve quality of life. For agricultural expansion, the process ensures that only areas with the highest crop yield potential are utilized, preserving less suitable lands. Conservation projects also benefit by pinpointing critical habitats that need protection.
Furthermore, this analysis supports disaster resilience planning by identifying safe zones for development, away from flood-prone or seismic areas.
Challenges and Considerations
Despite its benefits, site suitability analysis faces challenges such as data availability and accuracy. Remote areas may lack comprehensive data, and changing environmental conditions could quickly render findings obsolete. Moreover, socio-political dynamics and economic interests may affect decision-making, requiring a balance between development objectives and community needs.
Conclusion
Site suitability analysis is an indispensable tool for sustainable development. It provides a data-driven foundation for making informed, forward-looking decisions that can help balance growth with environmental conservation. By incorporating this analysis into planning processes, decision-makers can shape resilient, inclusive, and environmentally responsible communities for the future.
References
Banai-Kashani, R. (1989). A new method for site suitability analysis: The analytic hierarchy process. Environmental management, 13, 685-693.
Baseer, M. A., Rehman, S., Meyer, J. P., & Alam, M. M. (2017). GIS-based site suitability analysis for wind farm development in Saudi Arabia. Energy, 141, 1166-1176.
Charabi, Y., & Gastli, A. (2011). PV site suitability analysis using GIS-based spatial fuzzy multi-criteria evaluation. Renewable Energy, 36(9), 2554-2561.
Dehalwar, K., & Sharma, S. N. (2023). Fundamentals of Research Writing and Uses of Research Methodologies. Edupedia Publications Pvt Ltd.
Dehalwar, K. Mastering Qualitative Data Analysis and Report Writing: A Guide for Researchers.
Misra, S. K., & Sharma, S. (2015). Site suitability analysis for urban development: a review. Int J Recent Innov Trends Comput Commun, 3(6), 3647-3651.
Patel, R. S., Taneja, S., Singh, J., & Sharma, S. N. (2024). Modelling of Surface Runoff using SWMM and GIS for Efficient Storm Water Management. CURRENT SCIENCE, 126(4), 463.
Pramanik, M. K. (2016). Site suitability analysis for agricultural land use of Darjeeling district using AHP and GIS techniques. Modeling Earth Systems and Environment, 2, 1-22.
Sharma, S. N., & Abhishek, K. (2015). Planning Issue in Roorkee Town. Planning.
📢 Exciting Opportunity for Scholars and Researchers!
We are thrilled to announce the ICSSR Sponsored 10 Days Research Methodology Workshop, scheduled for 13-22 July 2024. This comprehensive workshop is designed to enhance your skills in research methodology, academic writing, and publication. * No Registration Fee * 10 Days free Accommodation and Food during the course * Free Study materials * Compulsory to bring your own laptop * Limited Seats Available
🔗 Register Now: Registration Form https://lnkd.in/duA4szjt Key Highlights: Engage with expert researchers and academics. Hands-on sessions on qualitative, quantitative, and mixed research methods. Insights into effective writing and publication strategies. Don’t miss this chance to advance your research capabilities and network with peers from various disciplines. 📄 For more details, download our brochure: Workshop Brochure https://lnkd.in/dymRVYPb 📍 Location: Maulana Azad National Institute of Technology (MANIT), Bhopal 📅 Dates: 13-22 July 2024 Spread the word and bring your research journey to the next level! Let’s make a significant impact together. Looking forward to seeing you there! hashtag#ResearchMethodology hashtag#AcademicWriting hashtag#ScholarlyPublication hashtag#ICSSR hashtag#Workshop hashtag#Education hashtag#Networking hashtag#MANITBhopal For more details, visit us at https://lnkd.in/gmiRQPiX
Short-term courses have become increasingly popular as a means to acquire new skills, boost career prospects, and explore personal interests. These courses, typically ranging from a few days to several months, offer a variety of benefits that make them an appealing option for many individuals. Here are some key benefits of attending short-term courses:
Short-term courses are highly focused and designed to impart specific skills or knowledge. They provide participants with the opportunity to quickly learn new technologies, methodologies, or theories that can be immediately applied in their current job roles, thus enhancing their capabilities and efficiency.
2. Career Advancement
By acquiring new skills and certifications through these courses, individuals can make themselves more attractive to employers. These courses often cover cutting-edge topics that are in high demand, helping participants stay relevant in their fields or even prepare for a career shift.
3. Networking Opportunities
Attending a short-term course allows participants to meet peers, industry experts, and professionals with similar interests. This networking can lead to collaborations, job opportunities, and the exchange of ideas and best practices. Building a professional network is often just as valuable as the skills acquired from the course itself.
4. Cost-Effectiveness
Compared to traditional degree programs, short-term courses are generally more affordable. They require a lower financial investment and often focus on delivering practical skills that have immediate applications, offering a good return on investment.
5. Flexible Learning Options
Many short-term courses are offered in various formats, including online, part-time, and intensive weekends, making them accessible to those who are working full-time or have other commitments. This flexibility allows learners to balance their education with personal and professional responsibilities.
6. Personal Development
These courses also offer individuals the chance to explore new areas of interest without the commitment required by a longer program. They can be a source of personal fulfillment and confidence as learners achieve new competencies and overcome challenges.
7. Immediate Application
Short-term courses often focus on practical skills and real-world applications. This immediacy ensures that participants can quickly apply what they’ve learned, allowing for immediate improvements in their work outputs or personal projects.
8. Certifications and Credentials
Many short-term courses provide certifications upon completion that can enhance a resume. These credentials are often recognized by employers and can be pivotal in job applications or promotions.
9. Experimentation with Lower Risk
For those considering a new field or career change, short-term courses offer a way to explore this new territory without the commitment of changing jobs or enrolling in a long-term academic program. This can be an invaluable way to test the waters before making more significant commitments.
10. Increased Adaptability
Engaging in various short-term courses can help individuals become more adaptable and versatile. This adaptability is highly valued in today’s fast-changing job market, where the ability to quickly learn and apply new skills is crucial.
Conclusion
Short-term courses are an excellent way to continue learning throughout one’s career. Whether the goal is professional development, personal growth, or merely exploring a new interest, these courses provide valuable opportunities to achieve those objectives efficiently and effectively. For many, they serve as a stepping stone towards greater opportunities and a more fulfilling career.
References
Dehalwar, K., & Sharma, S. N. (2024). Exploring the Distinctions between Quantitative and Qualitative Research Methods. Think India Journal, 27(1), 7-15.
Dehalwar, K., & Singh, J. Determining the Role of Different Stakeholders towards Sustainable Water Management within Bhopal.
Jaeggi, S. M., Buschkuehl, M., Jonides, J., & Shah, P. (2011). Short-and long-term benefits of cognitive training. Proceedings of the National Academy of Sciences, 108(25), 10081-10086.
Robins, R. W., & Beer, J. S. (2001). Positive illusions about the self: short-term benefits and long-term costs. Journal of personality and social psychology, 80(2), 340.
Sharma, S. N., & Dehalwar, K. (2023). Council of Planning for Promoting Planning Education and Planning Professionals. Journal of Planning Education and Research, 43(4), 748-749.
Simons, N. E., & Menzies, B. (2000). A short course in foundation engineering (Vol. 5). Thomas Telford.
Wright, M. C. (2000). Getting more out of less: The benefits of short-term experiential learning in undergraduate sociology courses. Teaching Sociology, 116-126.
In the era of big data and information explosion, scientometric analysis emerges as a powerful tool to evaluate and map the landscape of scientific research. This methodological approach involves the quantitative study of science, technology, and innovation, focusing primarily on the analysis of publications, patents, and other forms of scholarly literature. By leveraging data-driven techniques, scientometrics aids in understanding the development, distribution, and impact of research activities across various disciplines.
What is Scientometric Analysis?
Scientometric analysis refers to the study of the quantitative aspects of science as a communication process. The field applies statistical and computational methods to analyze scientific literature, aiming to uncover trends, patterns, and network interactions among researchers, institutions, and countries. Common metrics used in scientometrics include citation counts, h-index, impact factors, and co-authorship networks.
Applications of Scientometric Analysis
Research Evaluation: Scientometrics provides tools for assessing the impact and quality of research outputs. Universities, funding agencies, and policymakers use these metrics to make informed decisions regarding funding allocations, tenure appointments, and strategic planning.
Trend Analysis: By examining publication and citation patterns, scientometrics helps identify emerging fields and trends in scientific research. This insight is crucial for researchers and institutions aiming to stay at the forefront of innovation.
Collaboration Networks: Analysis of co-authorship and citation networks offers valuable information about the collaboration patterns within and across disciplines. This can highlight influential researchers and key collaborative groups.
Policy and Strategic Planning: Government and organizational leaders use scientometric analysis to shape science policy and research strategies. Insights gained from such analyses can guide the allocation of resources and efforts towards areas with the greatest potential impact.
Challenges in Scientometric Analysis
Despite its usefulness, scientometric analysis faces several challenges:
Data Quality and Accessibility: The reliability of scientometric studies depends heavily on the quality and completeness of the data. Issues such as publication biases and limited access to full datasets can affect the accuracy of analysis.
Overemphasis on Metrics: There is a risk of placing too much emphasis on quantitative metrics like citation counts, which may not fully capture the scientific value of research. This can lead to skewed perceptions and decisions.
Interdisciplinary Research: Quantifying the impact of interdisciplinary research is complex due to the diverse nature of such studies. Standard metrics may not adequately reflect their value or impact.
Future Directions
As scientometric techniques continue to evolve, integration with advanced technologies like artificial intelligence and machine learning is likely. These advancements could enhance the ability to process and analyze large datasets, providing deeper insights and more accurate predictions. Additionally, there is a growing call for more nuanced metrics that can account for the quality and societal impact of research, beyond traditional citation analysis.
Conclusion
Scientometric analysis stands as a cornerstone in understanding the dynamics of scientific research. While it offers significant insights, it is crucial to approach its findings with an understanding of its limitations and the context of the data used. As the field advances, a balanced view that incorporates both qualitative and quantitative assessments will be essential for harnessing the full potential of scientometric insights in shaping the future of scientific inquiry.
References
Chen, C., Hu, Z., Liu, S., & Tseng, H. (2012). Emerging trends in regenerative medicine: a scientometric analysis in CiteSpace. Expert opinion on biological therapy, 12(5), 593-608.
Darko, A., Chan, A. P., Huo, X., & Owusu-Manu, D. G. (2019). A scientometric analysis and visualization of global green building research. Building and Environment, 149, 501-511.
Heilig, L., & Voß, S. (2014). A scientometric analysis of cloud computing literature. IEEE Transactions on Cloud Computing, 2(3), 266-278.
Mooghali, A., Alijani, R., Karami, N., & Khasseh, A. A. (2011). Scientometric analysis of the scientometric literature. International Journal of Information Science and Management (IJISM), 9(1), 19-31.
Ramy, A., Floody, J., Ragab, M. A., & Arisha, A. (2018). A scientometric analysis of Knowledge Management Research and Practice literature: 2003–2015. Knowledge Management Research & Practice, 16(1), 66-77.
Delphi research is a methodical and structured communication technique, originally developed as a systematic, interactive forecasting method which relies on a panel of experts. The Delphi method is widely used in various research fields including health, education, and social sciences, aiming to achieve convergence of opinion on a specific real-world issue. The essence of the method lies in a series of rounds of questionnaires sent to a panel of selected experts. Responses are collected and aggregated after each round, and anonymized results are shared with the panel until consensus is reached, or the returns diminish marginally.
Step-by-Step Guide to Conducting Delphi Research
Step 1: Define the Problem and Research Questions
The first step in Delphi research is to clearly define the problem and establish specific research questions that need answering. This involves identifying the key issues at hand and formulating questions that are specific, measurable, and suitable for expert interrogation. It is crucial that the problem is framed in a way that harnesses the experts’ knowledge effectively.
Step 2: Choose a Facilitator
A neutral facilitator, often a researcher, is responsible for designing the study, choosing participants, distributing questionnaires, and synthesizing the responses. The facilitator must possess good communication skills and be capable of summarizing information in an unbiased manner.
Step 3: Select the Panel of Experts
The quality of the Delphi study heavily depends on the panel selected. Experts should be chosen based on their knowledge, experience, and expertise related to the topic. The panel size can vary but typically ranges from 10 to 50 members. Diversity in panel composition can enrich the results, bringing in multiple perspectives.
Step 4: Develop and Send the First Round Questionnaire
The initial questionnaire should gather basic information on the issue and understand the perspectives of the experts. Open-ended questions are useful at this stage to capture a wide range of ideas and insights. The questionnaire should be clear and concise to avoid misinterpretation.
Step 5: Analyze Responses
After the first round, responses are collected and analyzed. The facilitator plays a key role in summarizing these responses, identifying areas of agreement and divergence. This summary is crucial as it forms the basis for subsequent rounds.
Step 6: Iterative Rounds
Based on the summary of the first round, subsequent questionnaires are crafted to delve deeper into the topic, focusing on areas where consensus was not achieved. These rounds are more structured and often use scaled questions to measure the level of agreement or the ranking of priorities. The process is repeated, with each round refining and narrowing down the scope of inquiry based on the latest set of responses.
Step 7: Reach Consensus
The Delphi process continues until a consensus is reached or when additional rounds no longer provide significant changes in responses. It’s important to define what constitutes a “consensus” in the context of the study, which can be a certain percentage agreement among the experts.
Step 8: Report the Findings
The final step involves compiling the findings into a comprehensive report that outlines the consensus achieved, differences in opinions, the methodology used, and the implications of the findings. The report should be clear and detailed to allow for further academic scrutiny or practical application.
Tips for Effective Delphi Research
Preparation is Key: Spend adequate time designing the study and formulating the questionnaire.
Maintain Anonymity: Anonymity helps prevent the dominance of certain opinions and reduces the bandwagon effect.
Feedback: Regular and clear feedback between rounds helps inform the experts of the group’s progress and encourages thoughtful responses.
Patience and Persistence: Delphi studies can be time-consuming, and maintaining engagement from all participants throughout the rounds can be challenging but is crucial for the richness of the data.
Conclusion
Delphi research is a powerful tool for harnessing expert opinion and fostering a deep understanding of complex issues. By following a structured and systematic process, researchers can effectively manage the complexities of group communications and make informed predictions or decisions in their fields of study.
References
Balasubramanian, R., & Agarwal, D. (2012). Delphi technique–a review. International Journal of Public Health Dentistry, 3(2), 16-26.
Dehalwar, K., & Sharma, S. N. (2023). Fundamentals of Research Writing and Uses of Research Methodologies. Edupedia Publications Pvt Ltd.
Green, R. A. (2014). The Delphi technique in educational research. Sage Open, 4(2), 2158244014529773.
Hasson, F., Keeney, S., & McKenna, H. (2000). Research guidelines for the Delphi survey technique. Journal of advanced nursing, 32(4), 1008-1015.
Hasson, F., & Keeney, S. (2011). Enhancing rigour in the Delphi technique research. Technological forecasting and social change, 78(9), 1695-1704.
Jain, Sarika, Kavita Dehalwar, and Shashikant Nishant Sharma. “Explanation of Delphi research method and expert opinion surveys.” Think India 27, no. 4 (2024): 37-48.
Keeney, S., Hasson, F., & McKenna, H. P. (2001). A critical review of the Delphi technique as a research methodology for nursing. International journal of nursing studies, 38(2), 195-200.
Ogbeifun, E., Agwa-Ejon, J., Mbohwa, C., & Pretorius, J. H. (2016). The Delphi technique: A credible research methodology.
Williams, P. L., & Webb, C. (1994). The Delphi technique: a methodological discussion. Journal of advanced nursing, 19(1), 180-186.
In the dynamic landscape of today’s job market, continuous learning and development have become paramount for individuals and organizations alike. With technological advancements and evolving industry trends, the need to upskill and reskill has never been more pressing. Recognizing this demand, Track2Training emerges as a beacon of empowerment, offering tailored programs designed to foster personal and professional growth.
Founded on the principle of democratizing education, Track2Training aims to bridge the gap between aspiration and achievement. Whether you’re a recent graduate looking to enter the workforce or a seasoned professional seeking to enhance your skill set, Track2Training provides a diverse array of courses catering to various interests and career paths.
Customized Learning Experience
One of the distinguishing features of Track2Training is its commitment to personalized learning. Recognizing that each individual has unique strengths, weaknesses, and learning styles, the platform employs innovative teaching methodologies to cater to diverse needs. Through a combination of interactive modules, live sessions, and hands-on projects, learners are empowered to take charge of their educational journey.
Moreover, Track2Training’s adaptive learning algorithms ensure that course content is dynamically adjusted based on the learner’s progress and comprehension levels. This not only enhances engagement but also maximizes retention, enabling participants to apply their newfound knowledge effectively in real-world scenarios.
Industry-Relevant Curriculum
In today’s fast-paced world, relevance is key. Track2Training collaborates closely with industry experts and thought leaders to develop curriculum that is aligned with the latest trends and demands of the job market. From emerging technologies like artificial intelligence and blockchain to soft skills such as communication and leadership, the platform offers a comprehensive suite of courses that empower individuals to stay ahead of the curve.
Furthermore, Track2Training regularly updates its course offerings to reflect changes in industry standards and best practices. This ensures that learners are equipped with the most up-to-date knowledge and skills, enhancing their employability and career prospects in an ever-evolving landscape.
Community and Mentorship
Learning is not just about acquiring knowledge; it’s also about fostering connections and gaining insights from others. Track2Training understands the importance of community and mentorship in the learning process and provides a supportive environment where learners can collaborate, share experiences, and seek guidance from experts in their respective fields.
Through interactive forums, networking events, and one-on-one mentorship sessions, participants have the opportunity to engage with like-minded individuals and industry veterans, gaining invaluable advice and perspective along the way. This sense of camaraderie not only enhances the learning experience but also cultivates a spirit of collaboration and mutual support among members of the Track2Training community.
Empowering Success Stories
At Track2Training, success is measured not only by academic achievements but also by real-world impact. The platform takes pride in the success stories of its alumni, who have gone on to make meaningful contributions in their chosen fields. Whether it’s securing a dream job, launching a successful startup, or effecting positive change in their communities, Track2Training’s graduates are testament to the transformative power of education.
From aspiring entrepreneurs to seasoned professionals, Track2Training welcomes individuals from all walks of life who are eager to learn, grow, and realize their full potential. With its commitment to personalized learning, industry relevance, community engagement, and tangible outcomes, Track2Training stands as a catalyst for empowerment in the ever-evolving landscape of education and professional development.
References
Dehalwar, K. Empowering Women and Strengthening Communities: The Role of Community-Based Organizations (CBOs).
Detsimas, N., Coffey, V., Sadiqi, Z., & Li, M. (2016). Workplace training and generic and technical skill development in the Australian construction industry. Journal of management development, 35(4), 486-504.
Kennett, G. (2013). The impact of training practices on individual, organisation, and industry skill development. Australian Bulletin of Labour, 39(1), 112-135.
Kumar, G. A., Nain, M. S., Singh, R., Kumbhare, N. V., Parsad, R., & Kumar, S. (2021). Training effectiveness of skill development training programmes among the aspirational districts of Karnataka. Indian Journal of Extension Education, 57(4), 67-70.
Meager, N. (2009). The role of training and skills development in active labour market policies. International Journal of Training and Development, 13(1), 1-18.
Sharma, L., & Nagendra, A. (2016). Skill development in India: Challenges and opportunities. Indian Journal of Science and Technology.
Sharma, S. N. (2023). Understanding Citations: A Crucial Element of Academic Writing.
In today’s data-driven world, the ability to effectively analyze data is becoming increasingly important across various industries. R Studio, a powerful integrated development environment (IDE) for R programming language, provides a comprehensive suite of tools for data analysis, making it a popular choice among data scientists, statisticians, and analysts. In this article, we will explore the fundamentals of data analysis using R Studio, covering essential concepts, techniques, and best practices.
1. Getting Started with R Studio
Before diving into data analysis, it’s essential to set up R Studio on your computer. R Studio is available for Windows, macOS, and Linux operating systems. You can download and install it from the official R Studio website (https://rstudio.com/).
Once installed, launch R Studio, and you’ll be greeted with a user-friendly interface consisting of several panes: the script editor, console, environment, and files. Familiarize yourself with these panes as they are where you will write, execute, and manage your R code and data.
2. Loading Data
Data analysis begins with loading your dataset into R Studio. R supports various data formats, including CSV, Excel, SQL databases, and more. You can use functions like read.csv() for CSV files, read.table() for tab-delimited files, and read_excel() from the readxl package for Excel files.
RCopy code# Example: Loading a CSV file
data <- read.csv("data.csv")
After loading the data, it’s essential to explore its structure, dimensions, and summary statistics using functions like str(), dim(), and summary().
3. Data Cleaning and Preprocessing
Before performing any analysis, it’s crucial to clean and preprocess the data to ensure its quality and consistency. Common tasks include handling missing values, removing duplicates, and transforming variables.
Additionally, you may need to convert data types, scale or normalize numeric variables, and encode categorical variables using techniques like one-hot encoding.
4. Exploratory Data Analysis (EDA)
EDA is a critical step in data analysis that involves visually exploring and summarizing the main characteristics of the dataset. R Studio offers a plethora of packages and visualization tools for EDA, including ggplot2, dplyr, tidyr, and ggplotly.
RCopy code# Example: Creating a scatter plot
library(ggplot2)
ggplot(data, aes(x = age, y = income)) +
  geom_point() +
  labs(title = "Scatter Plot of Age vs. Income")
During EDA, you can identify patterns, trends, outliers, and relationships between variables, guiding further analysis and modeling decisions.
5. Statistical Analysis
R Studio provides extensive support for statistical analysis, ranging from basic descriptive statistics to advanced inferential and predictive modeling techniques. Common statistical functions and packages include summary(), cor(), t.test(), lm(), and glm().
Statistical analysis allows you to test hypotheses, make inferences, and derive insights from the data, enabling evidence-based decision-making.
6. Machine Learning
R Studio is a powerhouse for machine learning with numerous packages for building and evaluating predictive models. Popular machine learning packages include caret, randomForest, glmnet, and xgboost.
RCopy code# Example: Training a random forest model
library(randomForest)
model <- randomForest(target ~ ., data = data)
You can train models for classification, regression, clustering, and more, using techniques such as decision trees, support vector machines, neural networks, and ensemble methods.
7. Reporting and Visualization
R Studio facilitates the creation of professional reports and visualizations to communicate your findings effectively. The knitr package enables dynamic report generation, while ggplot2, plotly, and shiny allow for the creation of interactive and customizable visualizations.
RCopy code# Example: Generating a dynamic report
library(knitr)
knitr::kable(head(data))
Interactive visualizations enhance engagement and understanding, enabling stakeholders to interactively explore the data and insights.
Conclusion
Data analysis using R Studio is a versatile and powerful process that enables individuals and organizations to extract actionable insights from data. By leveraging its extensive ecosystem of packages, tools, and resources, you can tackle diverse data analysis challenges effectively. Whether you’re a beginner or an experienced data scientist, mastering R Studio can significantly enhance your analytical capabilities and decision-making prowess in the data-driven world.
In conclusion, this article has provided a comprehensive overview of data analysis using R Studio, covering essential concepts, techniques, and best practices. Armed with this knowledge, you’re well-equipped to embark on your data analysis journey with R Studio and unlock the full potential of your data.
References
Bhat, W. A., Khan, N. L., Manzoor, A., Dada, Z. A., & Qureshi, R. A. (2023). How to Conduct Bibliometric Analysis Using R-Studio: A Practical Guide. European Economic Letters (EEL), 13(3), 681-700.
Grömping, U. (2015). Using R and RStudio for data management, statistical analysis and graphics. Journal of Statistical Software, 68, 1-7.
Horton, N. J., & Kleinman, K. (2015). Using R and RStudio for data management, statistical analysis, and graphics. CRC Press.
Jaichandran, R., Bagath Basha, C., Shunmuganathan, K. L., Rajaprakash, S., & Kanagasuba Raja, S. (2019). Sentiment analysis of movies on social media using R studio. Int. J. Eng. Adv. Technol, 8, 2171-2175.
Komperda, R. (2017). Likert-type survey data analysis with R and RStudio. In Computer-Aided Data Analysis in Chemical Education Research (CADACER): Advances and Avenues (pp. 91-116). American Chemical Society.
Technology has significantly transformed the landscape of educational teaching jobs, revolutionizing the way educators teach and students learn. Here are some ways in which technology has reshaped educational teaching jobs:
Access to Information: Technology has democratized access to information, allowing educators to supplement traditional teaching materials with a wealth of online resources such as e-books, academic journals, multimedia presentations, and educational websites. This abundance of information enables teachers to create more dynamic and engaging lessons tailored to the diverse needs and interests of their students.
Interactive Learning Tools: Educational technology tools, such as interactive whiteboards, educational apps, and learning management systems, have enhanced the classroom experience by facilitating interactive and collaborative learning. These tools enable educators to create immersive learning environments where students can actively engage with course material, participate in virtual simulations, and collaborate with peers in real-time.
Personalized Learning: Technology has enabled the implementation of personalized learning approaches, allowing educators to tailor instruction to individual student needs, interests, and learning styles. Adaptive learning platforms, intelligent tutoring systems, and educational software with built-in analytics provide valuable insights into student progress and performance, enabling teachers to differentiate instruction and provide targeted support where needed.
Remote Teaching and Learning: The proliferation of digital communication tools and online learning platforms has facilitated remote teaching and learning, especially in the wake of global events such as the COVID-19 pandemic. Educators can conduct virtual classes, deliver lectures via video conferencing, and engage students in online discussions, breaking down geographical barriers and expanding access to education.
Blended Learning Models: Blended learning models, which combine traditional face-to-face instruction with online learning activities, have become increasingly popular in educational settings. Technology enables educators to create hybrid learning environments where students can access course materials, collaborate with peers, and participate in interactive activities both in the classroom and online, fostering flexibility and autonomy in learning.
Professional Development Opportunities: Technology has also transformed professional development opportunities for educators, providing access to online courses, webinars, virtual conferences, and digital learning communities. Educators can engage in ongoing professional growth, exchange best practices with peers, and stay abreast of the latest trends and innovations in education, enhancing their teaching effectiveness and job satisfaction.
Data-Driven Decision Making: Educational technology tools capture vast amounts of data on student performance, engagement, and learning outcomes. By analyzing this data, educators can make data-driven decisions to optimize instruction, identify areas for improvement, and tailor interventions to support student success. Data analytics tools enable educators to monitor student progress in real-time and adjust teaching strategies accordingly.
Global Collaboration and Communication: Technology has facilitated global collaboration and communication among educators and students, breaking down cultural barriers and fostering cross-cultural understanding. Educators can collaborate with colleagues from around the world, participate in global projects and initiatives, and expose students to diverse perspectives and experiences, preparing them for success in an interconnected world.
In conclusion, technology has fundamentally transformed educational teaching jobs, empowering educators to enhance the quality, accessibility, and effectiveness of teaching and learning. By leveraging technology tools and innovative pedagogical approaches, educators can create dynamic learning experiences that inspire curiosity, foster critical thinking, and prepare students for success in the 21st century.
References
Januszewski, A., & Molenda, M. (Eds.). (2013). Educational technology: A definition with commentary. Routledge.
Kumar, K. L. (1996). Educational technology. New Age International.
Luppicini, R. (2005). A systems definition of educational technology in society. Journal of Educational Technology & Society, 8(3), 103-109.
Mangal, S. K., & Mangal, U. (2019). Essentials of educational technology. PHI Learning Pvt. Ltd..
Saettler, P. (2004). The evolution of American educational technology. IAP.
Spector, J. M. (2001). An overview of progress and problems in educational technology. Interactive educational multimedia: IEM, 27-37.
In an era characterized by rapid technological advancements, globalization, and ever-evolving societal landscapes, the skill sets required to succeed have undergone a profound transformation. As the world becomes increasingly interconnected and dynamic, certain skills have emerged as invaluable assets in navigating the complexities of the modern age. These skills not only empower individuals to adapt to change but also enable them to thrive amidst uncertainty and competition. Here, we unveil the top secret skills essential for success in the modern era.
Adaptability and Resilience: In a world where change is constant, adaptability and resilience are paramount. The ability to swiftly adjust to new circumstances, learn new technologies, and bounce back from setbacks is indispensable. Those who can embrace change and view challenges as opportunities for growth are better equipped to succeed in today’s fast-paced environment.
Critical Thinking and Problem-Solving: With an abundance of information at our fingertips, the ability to analyze, evaluate, and synthesize information is crucial. Critical thinking enables individuals to make sound decisions, solve complex problems, and innovate effectively. In an age where solutions are not always obvious, those who can think critically are invaluable assets to any organization.
Digital Literacy: As digital technologies continue to permeate every aspect of our lives, digital literacy has become non-negotiable. Proficiency in using digital tools, navigating online platforms, and understanding digital security is essential for both personal and professional success. From basic computer skills to advanced data analysis, individuals who are digitally literate are better equipped to thrive in the modern workforce.
Emotional Intelligence: In a hyper-connected world, interpersonal skills are more important than ever. Emotional intelligence, which encompasses self-awareness, empathy, and effective communication, plays a crucial role in building strong relationships and navigating social dynamics. Individuals with high emotional intelligence are better equipped to collaborate with others, resolve conflicts, and inspire teams towards common goals.
Creativity and Innovation: In an increasingly competitive marketplace, creativity and innovation are key drivers of success. The ability to think outside the box, generate novel ideas, and turn them into reality is highly sought after. Whether it’s developing groundbreaking products, designing captivating marketing campaigns, or finding inventive solutions to complex problems, creativity fuels progress and sets individuals apart in a crowded landscape.
Cultural Competence: As the world becomes more interconnected, cultural competence is essential for effective communication and collaboration across diverse settings. Understanding and appreciating different cultures, perspectives, and ways of thinking fosters inclusivity and enhances teamwork. Individuals who possess cultural competence are better equipped to navigate multicultural environments and leverage diversity as a source of strength.
Lifelong Learning: In a knowledge-driven economy, the pursuit of learning doesn’t end with formal education. Lifelong learning, characterized by a growth mindset and a commitment to continuous self-improvement, is vital for staying relevant and adaptable in the face of change. Whether through formal education, online courses, or hands-on experience, individuals who prioritize learning are better positioned to thrive in an ever-evolving world.
In conclusion, the modern age demands a new set of skills to navigate its complexities and seize its opportunities. From adaptability and critical thinking to digital literacy and emotional intelligence, the top secret skills outlined above are essential for success in today’s dynamic landscape. By cultivating these skills, individuals can not only survive but thrive in the modern era, unlocking their full potential and making a meaningful impact in the world.
References
Cashion, J., & Palmieri, P. (2002). The secret is the teacher: The learner’s view of online learning. National Centre for Vocational Education Research.
Goleman, D. (2008). The secret to success. The Education Digest, 74(4), 8.
Noel, P. (2006). The secret life of teacher educators: becoming a teacher educator in the learning and skills sector. Journal of vocational education and training, 58(2), 151-170.
Thornton, C. (2016). Group and team coaching: The secret life of groups. Routledge.
Watson, J. (2019). The Secret of Success. IEEE Potentials, 38(6), 8-12.
Travel Time and Delay Studies are crucial techniques in transport planning, providing valuable insights into the efficiency, reliability, and performance of transportation systems. These studies aim to quantify the time required for individuals or goods to travel between different locations, identify delays, and understand the factors contributing to congestion. Here is a detailed overview of this technique:
Assess the performance of transportation networks, including roadways, public transit, and other modes of transport.
Identify areas of congestion, bottlenecks, and critical points where delays are most likely to occur.
Capacity Analysis:
Determine the capacity of roads and intersections by analyzing the relationship between traffic volume and travel time.
Identify potential over-capacity or under-capacity issues and propose solutions.
Traffic Flow Dynamics:
Understand the dynamics of traffic flow, including peak hours, directional patterns, and variations in travel speeds.
Analyze the impact of signal timings, road geometry, and other infrastructure elements on traffic behavior.
Identification of Bottlenecks:
Locate specific points in the transportation network where congestion regularly occurs.
Evaluate the causes of bottlenecks, such as intersections, merging lanes, or insufficient road capacity.
Mode Comparison:
Compare travel times and delays across different transportation modes (e.g., private cars, public transit, walking, cycling) to identify mode preferences.
Assess the effectiveness of multimodal transportation strategies.
Methodology of Travel Time and Delay Studies:
Data Collection:
Use various data sources, including manual traffic counts, automated traffic surveillance systems, and GPS tracking.
Collect data on travel times, speeds, and delays at different points within the transportation network.
Sampling Techniques:
Employ random or systematic sampling to ensure representative data collection.
Consider peak and off-peak periods to capture variations in travel time and delay patterns.
GPS and Mobile Apps:
Utilize GPS data from vehicles and mobile applications to track real-time travel routes and speeds.
Analyze the data to understand travel time variability and identify areas with recurrent delays.
Incident Analysis:
Investigate the impact of incidents such as accidents, road closures, or construction on travel times and delays.
Quantify the duration and severity of disruptions caused by incidents.
Congestion Metrics:
Calculate congestion indices, such as the Travel Time Index (TTI) or the Planning Time Index (PTI), to quantify delays and provide a measure of reliability.
Use these metrics to compare congestion levels over time and across different locations.
GIS and Spatial Analysis:
Map travel times and delays spatially using Geographic Information System (GIS) tools.
Identify spatial patterns, hotspots, and areas with consistent travel time challenges.
Regression Analysis:
Employ regression models to identify relationships between travel times, delays, and various contributing factors such as traffic volume, road geometry, and signal timings.
Applications of Travel Time and Delay Studies:
Transportation Planning and Policy:
Inform the development of transportation policies and infrastructure projects based on identified bottlenecks and congestion points.
Assess the impact of proposed changes on travel times and delays.
Traffic Management Strategies:
Optimize signal timings, lane configurations, and other traffic management strategies to reduce delays.
Implement dynamic traffic management systems that respond to real-time conditions.
Infrastructure Investment Decisions:
Guide decisions on infrastructure investments by prioritizing projects that address key congestion points.
Justify the need for capacity expansions or alternative transportation modes.
Public Communication:
Provide real-time travel information to the public, helping users make informed decisions and potentially influencing travel behavior.
Communicate planned road closures or construction activities to minimize disruptions.
In summary, Travel Time and Delay Studies play a crucial role in understanding the performance of transportation systems, guiding infrastructure investments, and implementing effective traffic management strategies. The data collected through these studies contribute to evidence-based decision-making in transport planning, ultimately improving the efficiency and reliability of transportation networks.
References
Carrion, C., & Levinson, D. (2012). Value of travel time reliability: A review of current evidence. Transportation research part A: policy and practice, 46(4), 720-741.
Dehalwar, K., & Sharma, S. N. (2023). Fundamentals of Research Writing and Uses of Research Methodologies.
Kotagiri, Y., & Pulugurtha, S. S. (2016). Modeling bus travel delay and travel time for improved arrival prediction. In International Conference on Transportation and Development 2016 (pp. 562-573).
LODHI, A. S., & SHARMA, S. N. Framework for Road Safety Improvement Measures for Madhya Pradesh.
Oppenlander, J. C. (1976). Sample size determination for travel time and delay studies. Traffic Engineering, 46(9).
Zang, Z., Xu, X., Qu, K., Chen, R., & Chen, A. (2022). Travel time reliability in transportation networks: A review of methodological developments. Transportation Research Part C: Emerging Technologies, 143, 103866.
Transport planning involves a multidisciplinary approach to analyzing, designing, and managing transportation systems. Various research techniques are employed to gather data, model scenarios, and make informed decisions in the field of transport planning. Here are some commonly used research techniques:
Origin-Destination Surveys: Collect data on the travel patterns and destinations of individuals within a region.
Household Surveys: Gather information on transportation preferences, commuting patterns, and socio-economic factors.
Mode Choice Surveys: Understand the factors influencing individuals’ choices of transportation modes.
Traffic Counts and Volume Studies:
Manual and Automated Traffic Counts: Collect data on the volume and types of vehicles at specific locations.
Turning Movement Counts: Analyze the movements of vehicles at intersections to understand traffic flow patterns.
Geographic Information System (GIS) Analysis:
Spatial Analysis: Use GIS to analyze spatial relationships, plan routes, and identify areas with transportation challenges.
Network Analysis: Model transportation networks, evaluate connectivity, and assess the impact of changes.
Simulation and Modeling:
Traffic Simulation Models: Simulate traffic flow to analyze the impact of changes in infrastructure or traffic management strategies.
Transport Demand Models: Predict future transportation demand based on population growth, economic factors, and land use.
Travel Time and Delay Studies:
GPS Data Analysis: Utilize GPS data to analyze travel times, congestion, and identify bottlenecks.
Delay Studies: Assess delays in transportation systems and identify factors contributing to congestion.
Cost-Benefit Analysis (CBA):
Evaluate the economic feasibility of transportation projects by comparing costs and benefits over time.
Consider factors such as time savings, reduced congestion, and environmental impact.
Stakeholder Consultation and Public Participation:
Engage with the community, businesses, and other stakeholders to gather input on transportation needs and preferences.
Public Meetings and Workshops: Facilitate discussions to gather feedback on proposed transportation projects.
Environmental Impact Assessment (EIA):
Evaluate the environmental consequences of transportation projects, considering factors like air quality, noise, and habitat disruption.
Accessibility Analysis:
Assess how easily individuals can reach various destinations, considering factors like transportation modes, distance, and connectivity.
Smart Mobility Data:
Use data from intelligent transportation systems, such as real-time traffic information and smart city technologies, to enhance planning and decision-making.
These techniques are often used in combination to provide a comprehensive understanding of transportation systems and to formulate effective planning strategies. The integration of technology and data analytics continues to play a growing role in modern transport planning.
References
Dehalwar, K., & Sharma, S. N. (2023). Fundamentals of Research Writing and Uses of Research Methodologies.
LODHI, A. S., & SHARMA, S. N. Framework for Road Safety Improvement Measures for Madhya Pradesh.
Lodhi, A. S., & Jaiswal, A. (2022, December). Passengers Perception and Satisfaction Level Towards Public Transport: A Review. In International Conference on Transportation Planning and Implementation Methodologies for Developing Countries (pp. 403-410). Singapore: Springer Nature Singapore.
Sharma, S. N. Leveraging GIS for Enhanced Planning Education.
Sharma, S. N. Understanding the Distinction: Quantitative vs. Qualitative Research.
Science, Technology, Engineering, and Mathematics, collectively known as STEM, form the bedrock of innovation and progress in our modern world. From groundbreaking discoveries in medicine to the latest advancements in artificial intelligence, STEM fields play a pivotal role in shaping the future of humanity. In this article, we’ll delve into the significance of STEM and explore how it drives innovation across various sectors.
At the heart of STEM lies science—the pursuit of knowledge through observation, experimentation, and analysis. Scientific discoveries have transformed our understanding of the natural world and led to revolutionary breakthroughs. From Isaac Newton’s laws of motion to the discovery of DNA structure by James Watson and Francis Crick, science lays the foundation for technological advancements and drives innovation by answering fundamental questions about the universe.
Technology:
Technology is the application of scientific knowledge for practical purposes, and it permeates every aspect of our daily lives. The rapid evolution of technology has given rise to the digital age, with innovations like smartphones, the internet, and artificial intelligence becoming integral parts of society. STEM professionals in the field of technology are instrumental in developing new software, hardware, and systems that enhance efficiency, communication, and overall quality of life.
Engineering:
Engineers are the architects of the technological landscape, translating scientific principles into tangible solutions. Whether it’s designing sustainable infrastructure, creating cutting-edge medical devices, or developing renewable energy sources, engineers play a crucial role in addressing global challenges. STEM-driven engineering fosters creativity, problem-solving, and a commitment to building a better future.
Mathematics:
Mathematics serves as the language of STEM, providing the framework for scientific theories and technological applications. From cryptography algorithms to predicting climate patterns, mathematics is the invisible force that underpins many advancements. Mathematicians contribute not only to theoretical frameworks but also to practical solutions in various fields, including finance, cryptography, and data analysis.
STEM in Action:
STEM education and research are essential components for nurturing the next generation of innovators. Initiatives promoting STEM in schools, colleges, and universities aim to equip students with the skills and knowledge needed to tackle complex problems. Hands-on experiments, coding workshops, and collaborative projects cultivate a passion for STEM disciplines and prepare future leaders for the challenges of tomorrow.
Challenges and Opportunities:
While STEM has propelled humanity forward, it also faces challenges such as gender and racial underrepresentation. Efforts are being made to bridge these gaps and create a more inclusive environment. Additionally, the ethical implications of technological advancements, such as privacy concerns and the impact on employment, demand careful consideration and responsible innovation.
Conclusion:
STEM is more than just an acronym; it is a dynamic force that drives progress and shapes the world we live in. As we continue to explore the frontiers of science, technology, engineering, and mathematics, the possibilities for innovation are boundless. By fostering a culture of curiosity, collaboration, and inclusivity, we can unlock the full potential of STEM and build a future that embraces the limitless opportunities it presents.
References
Bongso, A., & Richards, M. (2004). History and perspective of stem cell research. Best practice & research Clinical obstetrics & gynaecology, 18(6), 827-842.
Breiner, J. M., Harkness, S. S., Johnson, C. C., & Koehler, C. M. (2012). What is STEM? A discussion about conceptions of STEM in education and partnerships. School science and mathematics, 112(1), 3-11.
Brown, R., Brown, J., Reardon, K., & Merrill, C. (2011). Understanding STEM: current perceptions. Technology and Engineering Teacher, 70(6), 5.
Dehalwar, K., & Sharma, S. N. (2024). Exploring the Distinctions between Quantitative and Qualitative Research Methods. Think India Journal, 27(1), 7-15.
English, L. D. (2016). STEM education K-12: Perspectives on integration. International Journal of STEM education, 3, 1-8.
Sharma, S. N., & Dehalwar, K. (2023). Council of Planning for Promoting Planning Education and Planning Professionals. Journal of Planning Education and Research, 43(4), 748-749.
Writing a case study research involves thorough analysis and documentation of a specific subject, often focusing on a real-life situation or scenario. Here’s a step-by-step guide on how to write a case study research:
Select a case that is relevant and interesting to your target audience.
Ensure that your case study has a clear problem or issue to address.
Selecting an appropriate subject is the first crucial step in crafting a case study research. Opt for a case that holds relevance and interest for your target audience. Ensure that the chosen case encompasses a clear problem or issue that merits investigation and analysis.
Define the Purpose:
Clearly state the purpose of your case study. What do you aim to achieve with this research? Is it to analyze a problem, propose a solution, or explore a particular phenomenon?
Conduct Background Research:
Gather information about the subject, industry, and context.
Identify any relevant theories or concepts that will help frame your analysis.
Identify the Key Issues:
Pinpoint the main problems or challenges faced by the subject.
Understand the factors contributing to the issues.
Formulate Research Questions:
Develop specific research questions that guide your investigation.
These questions should be focused on the key issues identified.
Choose a Case Study Type:
Decide on the type of case study you want to conduct. Common types include exploratory, explanatory, descriptive, or intrinsic.
Collect Data:
Use various methods to gather data, such as interviews, surveys, observations, and document analysis.
Ensure your data collection is thorough and unbiased.
Organize and Analyze Data:
Organize your data and categorize it according to themes or patterns.
Use appropriate analytical tools and techniques to interpret the information.
Develop a Case Study Outline:
Create a clear structure for your case study, including an introduction, background, presentation of key issues, analysis, solutions, and conclusion.
Write the Introduction:
Provide a brief overview of the case and its significance.
Clearly state the purpose and objectives of the case study.
Present the Background:
Provide context by offering relevant background information.
Discuss any theories or concepts that are pertinent to the case.
Describe the Case:
Present the details of the case, including the individuals or entities involved, the timeline, and the setting.
Analyze the Issues:
Explore the key issues in-depth, using your research questions as a guide.
Apply relevant theories or frameworks to analyze the data.
Propose Solutions:
Recommend practical solutions or strategies to address the identified issues.
Justify your recommendations with evidence from your analysis.
Write the Conclusion:
Summarize the key findings and solutions.
Reflect on the implications of your research and suggest areas for further investigation.
Include Citations:
Properly cite all sources used in your case study to give credit and provide a basis for further reading.
Review and Revise:
Proofread your case study for clarity, coherence, and consistency.
Seek feedback from peers or mentors and make revisions accordingly.
Remember, each case study is unique, and the above steps provide a general guideline. Adapt them to fit the specific requirements and nuances of your case study research.
References
Brown, P. A. (2008). A review of the literature on case study research. Canadian Journal for New Scholars in Education/Revue canadienne des jeunes chercheures et chercheurs en education, 1(1).
Cousin, G. (2005). Case study research. Journal of geography in higher education, 29(3), 421-427.
Dehalwar, K., & Sharma, S. N. (2023). Fundamentals of Research Writing and Uses of Research Methodologies.
Hays, P. A. (2003). Case study research. In Foundations for research (pp. 233-250). Routledge.
To promote Digital Skills amongst all the learners across the country, Ministry of Education through its autonomous bodies such as All India Council for Technical Education (AICTE) has entered into Memorandum of Understanding (MoU) with leading technology companies to drive skilling and future readiness for the students. The partnerships cover wide areas such as project-based assignments, courses in Animation, Visual Effects, Gaming and Comics (AVGC), online teaching materials, familiarization with digital tools and platforms that will be pursued on a best-efforts basis across colleges to cover students of the higher education institutions in India including but not limited to Engineering colleges, Degree colleges and Polytechnics for expanding digital skills.
The Directorate General of Training (DGT) under Ministry of Skill Development & Entrepreneurship (MSDE) is implementing the Craftsmen Training Scheme (CTS) in Industrial Training Institutes (ITIs) across the country. Under this scheme, Essential Digital Skills are taught under the subject of Employability Skills that are mandatory for trainees under all trades. DGT has signed MoU with IT Tech companies like IBM, CISCO, Future Skill Rights Network (erstwhile Quest Alliance), Amazon Web Services (AWS) and Microsoft under which technical and professional skills with respect to new age technologies which includes courses on topics like Artificial Intelligence (AI), Big Data Analytics (BDA), Blockchain, Cloud Computing, Cyber security, Internet of Things (IoT), Web, Mobile Development and Marketing, Machine Learning, etc. is being provided to trainees through Bharatskills, a Central Repository for skills, to make the trainees industry ready.
National Institute for Entrepreneurship and Small Business Development (NIESBUD), an Autonomous Institute under the administrative control of Ministry of Skill Development and Entrepreneurship (MSDE) as of now has signed an Memorandum of Understanding (MoU) with Meta on 4th September, 2023 to support the Indian entrepreneurial ecosystem. The aim of the MoU is to provide aspiring and current small business owners with the necessary tools, knowledge, and resources to thrive in today’s dynamic market environment. The partnership will help in training budding and existing entrepreneurs in digital marketing skills by Meta platforms like Facebook, WhatsApp and Instagram in seven regional languages.
Indian Institute of Entrepreneurship (IIE), Guwahati, an Autonomous Institute under the administrative control of Ministry of Skill Development and Entrepreneurship (MSDE) has partnered with reputed institutions and colleges to take digital skill to rural youth and is assisting in building talent pool capacities and seamlessly connecting students, youth and micro-entrepreneurs across North Eastern Region of India.
Under the partnership of Ministry of Education with leading technology companies and NIESBUD with Meta, there are no financial obligations. Under the partnership of NIESBUD with Meta, the Meta platforms like Facebook, WhatsApp, and Instagram have provided inputs for participants on Digital Marketing in seven regional languages.
Gearing up for the success of the first tranche of auction of Critical and Strategic Minerals, launched on 29th November, 2023, the Ministry of Mines conducted a roadshow here on 19th December, 2023, in the presence of Union Minister of Parliamentary Affairs, Coal and Mines, Shri Pralhad Joshi, Minister of state for Mines, Coal & Railways, Shri Raosaheb Patil Danve and Secretary, Ministry of Mines Shri V.L. Kantha Rao, senior officers of the Ministry, Industry Associations and PSUs. Over 45 companies, consultants and exploration agencies participated in the event. Minister Shri Pralhad Joshi also launched the National Geoscience Data Repository Portal (NGDR) during the event.
A total of 20 critical & strategic mineral blocks will be auctioned in the 1st tranche, out of which 16 mineral blocks are put up for grant of Composite Licence and four mineral blocks for grant of Mining Lease. The minerals include Graphite, Glauconite, Lithium, REE, Molybdenum, Nickel, Potash etc. The blocks are spread across the States of Tamil Nadu, Odisha, Uttar Pradesh, Bihar, Jharkhand, Chhattisgarh, Gujarat and UT – Jammu & Kashmir.
Addressing the function, Minister Shri Pralhad Joshi appraised the efforts and initiatives undertaken by Ministry of Mines for increasing domestic production of minerals, meeting the goals of self-sufficiency as envisioned by the Prime Minister Shri Narendra Modi. He emphasized how the Indian mining sector in general, and critical minerals in particular are significant in the present global context, underscoring priorities such as strengthening domestic production, fostering self-sufficiency, diminishing import reliance, advocating sustainable resource management, attracting investments in the mining sector and advancing key industries crucial for India’s industrial and technological progress. The Government is committed to bring more critical mineral blocks to auction in a phased manner, the Minister added.
The Minister of State for Mines, Coal and Railways, Shri Raosaheb Patil Danve expressed optimism about the potential success of the initial phase of the critical minerals auction, seeing it as a positive stride toward establishing a dependable supply chain for these minerals, aligning with the vision of Atma Nirbhar Bharat and contributing to heightened economic growth. The Minister of State of Mines reiterated the government’s efforts to bring these blocks into auction and how the success of this auction process relies on the active participation from the industry. He called upon all the participants to demonstrate the highest standards of transparency, fairness and ethical practices throughout the auction process.
Shri V.L. Kantha Rao, Secretary, Ministry of Mines gave insights about the steps taken by Ministry of Mines to increase the exploration activity carried out in the country and about the efforts to streamline the policy framework for multifaceted growth of the mineral sector. Secretary, Mines also responded to the queries of the participants and ensured all assistance from the Ministry for easy participation in the e-auction process. Shri Rao also encouraged the participants to give their suggestions for the e-auction process being conducted by Central Government.
The roadshow was held with the objective to guide the potential bidders regarding the auction process. Additional Secretary – Ministry of Mines, Mr. Sanjay Lohiya welcomed the dignitaries and initiated the discussion on the importance of the auction of critical & strategic minerals.
Dr Veena Kumari Dermal, Joint Secretary, Ministry of Mines began with the presentation and appraised the audience regarding the prevalent mineral policies and the reform of MMDR Act and rules thereunder for enabling the Central Government for auction of critical & strategic mineral blocks. Further, the Joint Secretary briefed the audience about the 20 blocks launched in the first tranche of auction and presented the estimated timeline of the e-auction process. This was followed by presentations of SBI Capital Markets Limited – Transaction Advisor, MECL – Technical Advisor, and MSTC – Auction Platform provider, giving information to the potential bidders regarding the e-auction and details of the critical mineral blocks put to auction.
SBI Capital Markets Limited presented the details of the auction process to the stakeholders including the eligibility conditions, general guidelines to the auction process, and bidding parameters. MECL highlighted the importance of Critical and Strategic Minerals in modern technologies and shared the details of 20 critical mineral blocks being put to auction. MSTC walked participants through the registration process along with the technicalities of the auction portal. Subsequently, the queries received from the audience were addressed by the presenters.
Director (NMET), Ministry of Mines highlighted the efforts of Ministry in facilitating the engagement of Notified Private Exploration Agencies (NPEAs) to expedite mineral exploration in the country. He further informed about the scheme on funding of Notified Private Exploration Agency (NPEA) through National Mineral Exploration Trust (NMET). The Ministry has notified 16 such private agencies. Also informed about the proposed amendment in Mineral (Auction) Rules 2015 and comments were sought on the same.
Further, presentation on the details of Exploration Licence, a recently included provision in the MMDR Act and the rules thereunder. Exploration Licence is a provision for grant of a mineral concession for undertaking full range of exploration starting from reconnaissance to prospecting operations. The move is to engage the private players and junior mining companies in the exploration of deep-seated minerals, in line with international practice. The draft amendments made in the MMDR Act were presented to the participants and suggestions/comments were sought from the stakeholders.
Pre-bid conference with prospective bidder is scheduled on 22nd December 2023, last date of sale of Tender Document is 16th January 2024 and last date of bid submission is 22nd January 2024. Thereafter, e-auction will commence for selection of preferred bidder. Details of the mines, auction terms, timelines etc. can be accessed on MSTC auction platform at www.mstcecommerce.com/auctionhome/mlcl/index.jsp.
The National Geoscience Data Repository(NGDR) has been created, as a part of the National Mineral Exploration Policy, 2016, hosting all baseline and exploration-related geoscientific data in a single GIS platform, to expedite, enhance and facilitate the exploration coverage of the country. The NGDR initiative, spearheaded by Geological Survey of India (GSI) and Bhaskarachaya Institute of Space Applications and Geoinformatics (BISAG-N) represents a significant leap forward in democratizing critical geoscience data, empowering stakeholders across industries and academia with unprecedented access to invaluable resources.
Currently, 35 map services like geological, geochemical and geophysical, data layers have been incorporated with the NGDR portal. These data sets can be viewed accessed and downloaded. This interplay of different geo-layers and further interpretation helps in targeting potential mineral zones. The NGDR portal can be accessed through https://geodataindia.gov.in. The user, after registration in the portal can view, download and interpret the data.
The creation of NGDR was conceptualized by the Ministry of Mines (MoM) as part of the National Mineral Exploration Policy (NMEP) 2016. The Geological Survey of India (GSI) was given the responsibility to establish NGDR. The NGDR will make available all geological, geochemical, geophysical and mineral exploration data in public domain on a digital geospatial platform. This will include baseline geoscience data and all mineral exploration information generated by various central and state government agencies and mineral concession holders . The greater goal of this initiative is to increase the investment attractiveness of the mining sector in India.
Key Features of the National Geoscience Data Portal (NGDR):
Centralized Access: Provides a centralized repository of diverse geoscience datasets, including geological maps, mineral resources, seismic data, and environmental information.
User-Friendly Interface: An intuitive interface designed to cater to a wide range of users, enabling seamless navigation and exploration of data.
MERT template: The Mineral Exploration Reporting Template facilitates all the geoscientific stakeholders to submit their data in the NGDR portal in a standard reporting template.
Analytical Tools: Equipped with state-of-the-art analytical tools to interpret and extract valuable insights from complex geospatial data.
Open Access: Encourages transparency and knowledge sharing by offering open access to a wealth of geoscience information.
The development of this portal will help various geoscience agencies such as GSI, MECL, State Departments of Mining and Geology, private agencies, and other stakeholders agencies of the country. As the geoscience data through this portal will be available globally for viewing, downloading and interpretation, it will facilitate global mining companies to invest in India and bring new technologies in mineral exploration.
Globally, all the mineral-rich countries have a robust geoscience data portal having various layers of geoscientific information i.e. geological, geophysical, geochemical, etc. to support their mineral exploration programmes. With this state-of-the-art, user-friendly, interoperable platform, India is now in the league of other mineral-rich countries where the accessibility of geoscientific data plays a vital role in fostering their mineral exploration programmes.
As per the annual field season program, field survey and preparation of reports normally takes 18 months, out of which 12 months are required for completion of field survey and the next 6 months for writing/ finalization of the report before it is circulated. However, for some of the projects, this time duration may be more than 18 months depending upon the nature and quantum of work.
GSI has taken a number of steps to finalize the resource bearing reports at the earliest which are summarized below-
Sufficient budget grants especially in the mineral exploration head allotted to all regions/missions of GSI for execution of field projects.
To achieve the drilling target, empanelled outsourced drilling agencies are deployed for certain exploration projects in addition to in-house drilling capacity. Drilling activities are initiated on priority from the beginning of Field Season.
To expedite sample analysis, outsourcing is carried out through reputed laboratories as per requirement in addition to in-house capacity.
For timely execution of projects, field vehicles are outsourced in addition to in-house capacity.
The laboratories are being modernized with various state-of-the-art instruments for precise and quick analysis. Various modern software are also being used for quick and precise analysis of field data.
The concerned State Governments are intimated to render all possible support for execution of field projects and field officers of GSI are instructed to coordinate with local administration to resolve any local issues. Necessary formalities for getting permission for exploration from various authorities are taken before initiation of the project.
Constant monitoring of the projects at various levels is carried out to ensure proper and timely completion of the project.
The following technology initiatives have been adopted for expediting field surveys and reports on potential mineral resource deposits by GSI:
Generation of baseline geoscience data- GSI is generating almost all types of baseline geoscience data e.g. geological, geochemical, and geophysical pan India which are crucial for effective planning of mineral exploration. GSI has targeted to complete National Geochemical and Geophysical mapping of the accessible part of the country on priority by involving in-house resources as well as through outsourcing using the National Mineral Exploration Trust (NMET) fund.
Aerial Survey: GSI is executing the project “National Aero-Geophysical Mapping Programme (NAGMP)” to acquire aero-geophysical data over the Obvious Geological Potential areas (7.78 lakh sq km) through outsourcing using NMET fund.
Remote Sensing aided Survey: GSI is carrying out delineation of alteration/ mineralization zone using spectral mapping algorithms. Recently, GSI has completed acquisition of AVIRIS NG data in collaboration with NASA and ISRO in certain potential areas in the country. GSI has initiated surface mineral mapping using ASTER multispectral remote sensing data to generate alteration zone /mineral mapping.
Regional Mineral Targeting (RMT): GSI has introduced RMT program to gain insight into the process of finding mineral deposits on a regional scale by synthesis & collation of surface and subsurface data followed by fieldwork.
Project ‘Uncover’ India: Given the rapid depletion of surface/near-surface deposits, there is a paradigm shift in thrust to probe deep-seated deposits under “Project Uncover (India)” in two transacts, in collaboration with Geoscience Australia (GA).
Necessary steps have been taken to increase the depth of exploratory drilling in G3 & G2 stage exploration projects from FS 2020-21 for non-bulk minerals depending on the potential of mineralized zones. For fast drilling, GSI is mostly utilizing hydrostatics rigs in mineral exploration projects.
National Geoscience Data Repository (NGDR): GSI is setting up the National Geoscience Data Repository (NGDR) through outsourcing using NMET fund for the benefit of all stakeholders wherein all geoscientific data will be made available on one platform.
Modernization Programme: GSI has been modernizing its laboratories by procuring high-end machinery and equipment to improve its capabilities in generating vital geoscience data and their processing and interpretation.
Google has been able to acquire the best of the best in almost all sections of the technology world. YouTube has been one of its prized possessions. But at the end of the day. There are some demerits of every app. In the latest development, some YouTube users are getting a new option in their apps. Some users are getting a premium sign alongside the 4k video resolution option in their video settings. It means that 4k resolution will only be available for premium subscribers. This particular change will help Google in getting more subscribers and will also increase its revenue. But it is not confirmed, as the trial is still going on and the decision will be taken after some time. Until now, there is still no update from Google regarding this change. In the recent past, Google has been trying to increase its revenue through different methods. One of them has been evident with the trial that is going on with the several ads for the free account users. Google also shut down its Stadia gaming platform to redirect the revenue flow. It will also increase their focus on the selective few options, that are the real money maker for them.
Now, there have also been speculations that Google is trying various things to increase its user base for subscriptions. It is due to lesser revenue this year than last year. But on the bright side, the number of subscriptions is increasing on various platforms for Google. One of them is YouTube music. Now, on the evidence part, users are posting screenshots of the new premium option on Reddit. In return, Google has confirmed that some of the users are getting such options as a part of the trial program. It will let them analyze whether users are willing to pay for such options or not. Now, it remains to be seen whether users will accept such a change or not. On the contrary, users can also look at a future where there will be two different options. Users can experience so on various platforms like YouTube, YouTube Music, and many others. A bigger subscriber base here does not mean that it is the end for the free account users because there are quite a few free account users. Google will support the free users also as it is the first reason that users are using YouTube in the first place. The other reason is the rapidly increasing traffic on the internet. It is for the content that allows the users to learn various things, that are related to various fields. With 5G, taking on the world in different parts of the world, at a fast pace. As the network coverage will improve, the users will be willing to experience better and more advanced features. They will like to experience a video in 4k resolution. So, in return, it might help Google in getting more subscribers. On the other hand, it might not help Google as people may get comfortable with 2k or even Full HD. All of these, are just speculations, and the future is uncertain but exciting.
What is citizenship journalism? It is more or less a medium through which rural people can communicate and share the ongoing problems in their state. One such example is cgnet Swara. Cgnet Swara started in 2004 as a website which acted as a middleman between the people and the news. Using the site is simple. All you need to do is call a number and tell them your problem and they’ll report it. A lot of times these stories have broken up like wildfire.
Ndtv once reported a piece of news that was reported by cgnet Swara first. The wonderful thing about this is illiterate people can also tell the news from the ground in a very convenient way. This is revolutionary. Keeping in mind that most of the people only speak their tribal language, it becomes hard for them to understand English or Hindi. But the problem with citizen journalism is that its structure is not very professional. Most of the time the calls might not result in anything because they are just opinions.
This is one of the reasons journalists are sceptical about this. Sometimes the mainstream media has used information from cgnet Swara and didn’t credit them. This makes the relationship worse. One of the officials from cgnet Swara said “Their relationship has become more antagonistic … It is very unfortunate, that local media see us as a competitor—which we cannot be and never intended to be. Every platform has its problems and strengths. We understand the structural problems of mainstream media and we want to fill in the gaps.” The initial goal of citizen journalism was to bridge the gap between the alienated theories that mainstream media provides us as entertainment. This is why the big conglomerates don’t like the idea of citizen journalism. Although it’s unprofessional, it represents the voices of the people in the rawest way possible. Since the narrative in India is controlled by a handful of people, they’ll always try to not let citizenship journalism grow. Going forward, one of the major challenges for citizen journalism is building a structure and improving fact-checking.
Micro learning is a form of short-term learning. Micro learning means learning small bits of information at a time that is simple to process. Over the last few years, everyone’s attention span is on a constant decline. In times like these, micro learning is a very efficient way of training people. It has its own pros and cons. It is very time efficient. It’s budget-friendly. It also keeps the learner hooked. But one of the biggest issues with this is that you can’t make people learn complex problems or concepts through this concept. Micro learning is a concept of an oversimplification to reduce the time and effort required to train. It may not be very useful when you aim to teach people complex concepts. In today’s world, we are surrounded by micro learning. Let’s take the internet, for example, a lot of people refer to different creators and sources for their consumption of information. They provide them with a total overview of a particular matter. This overview is rather oversimplified.
People seek political, local and lifestyle news in a simplified way. Short-duration content like reels and shorts or a ted talk are living examples of micro learning. Micro learning is a very good way to teach people small skills that are a means to a different end. For example, teaching someone how to operate a device or how to follow protocols. But it may not be very useful for teaching complex skills like writing, speaking and photography. Micro learning is the new way that people have preferred to learn about things that are relevant to them. If you can give them exactly what they need then it’s also not a very bad career choice. You must have come across many YouTube creators that simplify complex news and provide it to their viewers. That is a form of microlearning. It is a very popular and very effective way of grasping people’s attention.
Robots may be travelling to strange planets in 2030 and operating on patients from the other side of the earth. One of the areas of technology that is rapidly developing is robotics, which is influencing how people will travel, work, and explore in the future. IoT, AI, and other down side developments are assisting in further elevating the situation. Robotics is home to numerous fascinating discoveries that will be essential to daily living everywhere.
Saul -The Robot.
The robotics sector continues to innovate by fusing artificial intelligence with vision and other sensory technologies. According to the magazine, more recent versions of robots are simpler to set up and programme than older ones. High-tech ocean robots that explore the world beneath the waves, Saul the robot that shoots UV rays at the Ebola virus to kill it, and an AI-controlled therapeutic robot that facilitates more effective communication between patients and healthcare providers to lessen stress are a few noteworthy developments that will occur in 2021.
Cognitively and, in some situations, physically, more human-like. They already coexist with people in factories, warehouses, fast food restaurants, and apparel stores.
Future employees may have a far better future if technologies are developed to support new activities for which people are better suited. While millions of secretaries and typists were undoubtedly made redundant by the widespread use of computers in businesses, new jobs in related areas, such as computer engineers, software engineers, and IT advisors, were also created.
Science and technology are widely recognized as important tool to promote and enhance the country’s socio-economic development. India has made considerable progress in various fields of science and technology over the years and can now boast of having a strong network of Science & Technology institutions, skilled manpower and infrastructure. innovative knowledge. Given the rapid pace of globalization, the rapid depletion of raw materials, the increasing competition between countries and the growing need for intellectual property protection, the importance of strengthening the knowledge base becomes even more important. Agenda is to enhance application-oriented research and development to create technology; promote human resource development, including encouraging bright students to pursue scientific careers; encouraging research and application of science and technology for forecasting, prevention and mitigation of natural disasters; integrate the development of science and technology into all areas of national activities; and exploiting science and technology to improve livelihoods and create jobs; environmental protection and ecological security. Science and technology is of great importance for economic growth at the macro level and for enhancing the competitiveness of enterprises at the micro level. Globalization and liberalization have created great opportunities and some challenges for Science and technology.
DEVELOPMENTS
In India, the role of science and technology in national development has been recognized by the government. The second five-year plan emphasizes that “the most important factor to promote economic development is the will of the community to apply modern science and technology”. In 1971, the Department of Science and Technology (DST) was established to promote new fields of science and technology. Similarly, State Councils of Science and Technology have also been established at the state level. As part of national policy, the government promotes various research and development programs to encourage scientific activities. Thus, we see that modern scientific and technological knowledge has had an impact on almost all fields such as agriculture, industry, nuclear energy, space technology, electronics, medicine and science. Development of Health Sciences. In addition to these key areas, India has also made progress in several other areas. These include the activities of the Petroleum and Natural Gas Commission in oil exploration and refining and the National Environmental Planning Commission in environmental protection and solar power generation. A Central Ganges Administration has been established to control Ganga pollution using wastewater treatment plants, etc. Currently, the country has a solid foundation in modern technology. It also has the third largest science and engineering workforce in the world. India has become a major destination for outsourced R&D activities. We currently have more than 1,100 R&D centers established by multinational enterprises (MNCs) such as IBM, Google, Microsoft, Intel, Lupin, Wockhardt, etc. These R&D centers cover areas such as information and communication technology, biotechnology, aerospace, automotive, chemical and materials technology. India’s relatively strong intellectual property regime will enable the country to emerge as a major R&D hub. Indian scientists are at the forefront of some of the world’s ground-breaking works. Recent contributions by Indian scientists to cutting-edge research and technology have been encouraging. For example, 37 Indian scientists from 9 Indian institutions who played a key role in the discovery of gravitational waves received the 2017 Nobel Prize in Physics. Indian scientists also contributed. on the discovery of neutron star mergers at the Laser Interferometer Gravitational-Wave Observatory (LIGO), USA. The development of Brahmos, advanced supersonic anti-aircraft interceptors, various types of missiles and missile systems, remote control vehicles, light combat aircraft, etc. are examples. highlights India’s advances in strategic and defense technology. India currently ranks among the few countries with reliable space technology capabilities. The upgrade of SLV to ASLV and PSLV to GSLV, the first lunar orbiter project Chandrayan-1, the Mars Orbiter Mission and the recent simultaneous launch of 104 satellites are remarkable achievements of India. India is currently the third largest country in terms of number of startups. This number is predicted to grow exponentially in the coming years. The government has established the Atal Innovation Mission (AIM) to completely transform the country’s innovation, entrepreneurship and startup ecosystem.
Applications and Effects in Everyday Life
Science and technology affect us all, every day of the year, as soon as we wake up, day and night. Our digital alarm clocks, the weather, the vehicles we drive, the buses we take, our decision to eat a baked potato instead of fries, our cell phones. me, antibiotics for your sore throat, clean water and all the lights have brought us the contributions of science. It affects socialization and productivity. The power of the Internet has made it easier for global communities to form and share ideas and resources. The modern world would not be modern at all without the knowledge and technology created by science. The influence of science on people’s lives is growing. Although the recent benefits to humanity are unprecedented in human history, in some cases harmful or long-term effects raise serious concerns. Today, the public distrust of science and fear of technology is a significant metric. This is partly due to the belief of some individuals and communities that they will be the ones to bear the indirect negative consequences of technical innovations introduced for the benefit of a special minority. permission. The power of science to bring about change forces scientists to proceed with caution in what they do and what they say. Scientists should reflect on the social consequences of technology applications or partial disclosures about their work and explain to the public and policymakers the degree of uncertainty. or the scientific incompleteness of their findings. At the same time, however, the exploitation of the full predictive power of qualified science should not be avoided to help humans cope with environmental change, especially in the face of direct threats such as natural disasters. or water shortage. Science and Technology offers simple and affordable science-based solutions that help individuals save time, energy and increase income. Technology adds value to handicraft products, playing an important role in enhancing their competitiveness. In general, S&T can play an important role in extending informatics to the most remote areas of the country by emphasizing computer literacy, making it accessible to those without formal education. Information Technology. Thus, “problem populations” can be transformed into valuable “human resources” through activity-oriented training and skill upgrading, which develop entrepreneurship and facilitate for independent employment through the use of new technologies. S&T provides solutions to long-term problems such as drought, disease, lack of domestic water, nutrition, sanitation, health, housing, etc. and other everyday issues, including the transition to unconventional energy sources and product packaging. Knowledge of science and technology helps to find ways for people to have the habit of using natural resources more wisely such as wood, bamboo, medicinal plants, etc. through the application of environmentally friendly technologies.
An IP address abbreviation of Internet Protocol address, it is an address that is provided by the Internet Service Provider to the user, it is just like a postal address code that is pin code to find the location or place where to send the message. An IP address is a unique group of number what are separated by the period (.), it varies from 0 to 255, and every device has a separate and unique IP address that is assigned by the specific Internet Service Provider (ISP) to identify which particular device is communicating with them and accessing the internet from there.
If you want to access internet from you device which may be your Android, I phone, Computer the service provider assigned them a particular, unique address that is help them to communicate send, receive information from the right person without any misunderstanding, mistake the message is pass to the authentic person to whom it has to send. This problem is solved by the IP address, in olden days; we have postal address to send the message/letter to the person, the message that has to be sent with the help of the address which may be his house number, city, town, postal code. The sender will write the address on the top of the letter envelope so that it will be delivery to the right person. If the person connected his device to internet provide by the hotel, the hotel‘s Internet Service Provider will assign an IP address to the device.
Types of IP addresses
There are different types of IP based on different categories, types.
Consumer IP addresses
A Consumer IP addresses is the individual IP addresses of a customer who connects his/her device to a public or private network. A consumer connects his device through internet from his Internet Service Provider, or from the Wi-Fi. In these days the Consumer has many electronic gadgets which he connects to his router that transfer the data from the Internet Service Provider.
Private IP addresses
A Private IP addresses are a secure one that is connected Private Network and every devices that is connected to this Private Network is assigned a unique IP address that is assigned by the Internet Service Provider. All Mobile devices, Computer, and Internet of Things that are connected to this private network are assigned a unique string number to the devices.
Public IP addresses
A Public IP addresses is the main address that is related to your network, as stated above that the IP address are assigned by the Internet Service Provider, the Public IP address is also assigned by the Internet Service Provider, The Internet Service Provider has a large amount of IP addresses that are stored and assigned to the customer. The public IP address is the address that devices that are outside the network use to identify the network.
The Public IP addresses are further classified into two types they are:
Dynamic
Static
Dynamic IP addresses
The Dynamic IP address are the IP address that changes very frequently, so the Internet Service Providers purchase a very huge amount of IP addresses , they assign it mechanically to the customer . This frequently changing the IP address helps the customer not to make the security actions. The frequently changing IP address won’t let the hacks to track or pool your data.
Static IP addresses
The Static IP addresses is the contradictory to the Dynamic IP address, it remain fixed. The IP address remains fixed when it is assigned by the Internet Service Provider. The mostly many person and business man don’t choose static because it is risk of getting easily track, but most business which are trying host her own website server choose Static IP address so it will easier for the customer to find them.
The IP address can be protect by 2 ways that are using proxy and the other one is use of Virtual Private Network. A proxy server acts as a intermediary between the internet server and your internet service providers, when you visit any website it will show the proxy IP address not yours.
Where to find IP address is Device?
The IP address set up in every device that is connected to the Internet, but the steps or direction is different in different devices. Some of device direction is given below:
Everyone makes mistakes in life, we are believed to learn from our mistakes or try to avoid them, same happens when building a niche website, mistakes can cause damage to your brand value or prevent you get disire results.
However, no one really talks much about how doing things wrong on your website can deteriorate your image and cost you your business. There are common mistakes that are often made not out of ignorance but coincidentally or because of forgetfulness.
Effects of these mistakes can be seen in sales, website visitation rates, and bounce rates. This is why you need to be aware of them and have tools and knowledge to improve your website, eliminate the mistakes you are making, and inevitably, improve your business.
To avoid certain things which are causing us to gain the maximum number of reach I want you to keep these ‘10 Disappointing Niche Website Mistakes You Make Now’ in your mind while building a website.
Under-Plan Website: Without a plan, you can never ever run any business. Can you run a restaurant without having a proper plan? No. If you try it, you will create a mess, will be unable to get customer satisfaction. Similarly, it happens with websites.
“A successful website does three things:
It attracts the right kinds of visitors.
Guides them to the main services or products you offer.
Collect Contact details for future ongoing relations.”
― Mohamed Saad
The most successful component of a growing website is single, original quality content, which will increase your credibility and authority in your chosen area. It will also increase your search engine ranking.
Evergreen content would be something like an article that teaches you how to tie a bowtie. Something like that isn’t time-sensitive, so you can essentially write it once and continue driving traffic to it forever.
Working on multiple websites at a time: If you are working on a certain website stick to it. You may think that working on more websites will multiply your earning but, it will not, it will require more time and pace which will be not possible and will cost you the quality of your content. There are many other ways to accelerate your growth on your single website.
Not focusing on the quality of your website: You need to focus on the quality of the website while side keeping the quantity of the site. The quality of your website will determine the content of your website which will increase the audience towards your websites.
For example: if you own a photography studio you must add your best high-res photos or video to your website which attracts the customer which will direct them to buy your services.
Indicators
Checklist
Timely
Up-to-date information
How frequently the website is updated
When the website was updated
Relevant
Organization’s objectives
Organization’s history
Customers (audience)
Products or services
Photography of organization’s facilities
Multilanguage/culture
Use different languages
Present to different cultured
Variety of presentation
Different forms (text, audio, video, …)
Accuracy
Precise information (no spelling, grammar errors)
Sources of information are identified
Objective
Objective presentation of information
Authority
Organization’s physical address
Sponsor (s) of the site
Manager (s) of the site
Specifications of site’s managers
Identification of copyright
Email to manager
No presence in Social Media: Social media is just not for making friends is can be also used to marketing a business. Making a good presence on social media could help you to connect to the audience. Most users of social media platforms like Facebook, Instagram, Pinterest, Twitter, etc will help you to divert the attention of the audience towards your websites. All the social media outlets have a ‘Paid’ section by which you can grow your presence or multiply your reach by a promoted content.
The point is marketing on Social Media is rapidly becoming an excellent way to drive traffic to your website. Likely to soon be second only to Organic traffic as one of the more economical means of attracting visitors.
Ignoring keyword research: Some keyword research was necessary in order to pick a niche that was feasible to create a website about. You may use several keywords some of them for free or some with a price. By using free keyword tools as google Adwords can really help to find the adequate keyword we can maximize your reach. making a keywords research will be highlighted by google which will increase traffic on your website.
Google looks for keywords on your website and Google will send visitors to your website based on the keywords they find there.
Not getting proper training: You need to get the proper training to build a good niche website. You can search on the internet for various online training programs various website runs a training program that can help you to learn to run a website. Do some research and make a sound decision regarding a comprehensive training platform for starting an online business. You will likely experience some doubt as you continue to build your business, and the money does not start pouring in right away. So it is best that you start your journey on firm ground.
There are various websites you can follow like niche affiliate, niche academy a super affiliate, etc. they are all here to train you, build up your skills, and make your website more attractive and interesting. Some of them are paid courses and some will train you for free. I would recommend you can start with the free course then go for the paid version for a better understanding and advanced learning.
Not treating your business like a business: This is most likely the biggest reason that people fail to achieve success online. Establishing yourself as an Authority online and creating a business that will support your family is serious stuff and should be treated as such.
Unfortunately, many Newcomers treat this more like a “hobby”, than a business. You will be never able to figure that out. It can be used to get a little better organized yourself. You must have ‘hunger’ enough to take the advice of some very successful people and treat my business, as a business.
Not writing a site blog: Your website’s blog is an integral part of your overall success. A blog is where you can personalize your site, and therefore, differentiate yourself from your competitors. It’s where you can add fresh and interesting content that engages with your potential conversions in the way that a straightforward eCommerce platform cannot. Your blog should have regularly scheduled updates, with content that is relevant and well-written.
A blog is an aspect of operations that many websites outsource, and if you’re incapable of producing an interesting blog, then you should certainly consider farming the task out to a professional writer. A good writer will be able to create engaging headlines and titles, with an article that is written utilizing SEO, and yet is still personable and promotional (but not too promotional – a blog is different from an advertorial). You may hire a content writer online at a price. Prices vary from their experience in the field.
Not Getting Personal and Not Starting an Email List: If you have a great connection with the customers online directly, it will help to organic traffic on your website. It will help you when they can relate to you and your situation. Do not hesitate to let your visitors know that who you are and why you are an expert in your niche.
Not mentioning or forgetting to mention NAP (Name, Address, Telephone number) or not keeping it up updated will cost you to lose your customer forever. Your NAP needs to be clearly displayed and updated as needed, they can be directed to an incorrect location, or are unable to contact you via a method of their choosing.
Underestimate the Importance of Mobile Traffic: It’s amazing how many people are glued to their smartphones while out and about. You might see a group of people at a bar, totally ignoring each other as they intently tap away at their phones. They might be shopping for a new product or service, but are you prepared to receive them? Your website needs to be responsive to smartphone-based web browsers, meaning it needs to be configured to load quickly and display quickly on a screen of any size. If your page cannot be adequately navigated using a smartphone, then you could potentially be missing out on a significant amount of traffic and conversions.
Conclusion
Starting a niche website is easy. Getting it set up on WordPress and writing your first article is simple stuff that anybody can do. The difficult part comes in growing it into a money-making niche site. As you learned in this guide, there are a lot of moving parts. It takes patience, hard work, and persistence.
The biggest reason for failure is simply that people give up too quickly. And it’s not their fault. If it’s your first time, you don’t know what to expect. You don’t know the processes and different cycles that a new niche website goes through before breaking through and finally being successful.
Niche websites can truly change your life if you want them to. Starting a successful website can open a lot of different doors for you. It can allow you to quit your job, finally, travel the world, or just get some really good side income money.
E-Agriculture is a new area of knowledge emerging out of the convergence of IT and farming techniques. It enhances the agricultural value chain through the application of the Internet and related technologies. IT helps farmers to have better access to information which increases productivity. It also enables him to get better prices through the information of changes in price in different markets.
The information related to policies and programs of the government, schemes for farmers, institutions through which these schemes are implemented, innovations in agriculture, Good Agricultural Practices (GAPs), Institutions providing new agricultural inputs(high yielding seeds, new fertilizers etc) and training in new techniques are disseminated to farmers through the use of Information technology to ensure inclusiveness and to avoid digital divide.
The advantages of E-Agriculture are –
Better and spontaneous agricultural practices.
Better marketing exposure and pricing.
Lessening of agricultural risks and enhanced incomes.
Better awareness and information.
Enhanced networking and communication.
Facility of online trading and e-commerce.
Better representation at various forums, authorities and platform.
E-agriculture can play vital role in the increased food production and productivity in India.
Access to price information, access to agriculture information, access to national and international markets, increasing production efficiency and creating a ‘conducive policy environment’ are the beneficial outcomes of e-Agriculture which enhances the quality of life of farmers.
Soil Management, Water Management, Seed Management, Fertilizer Management, Pest Management, Harvest Management and Post-Harvest Management are the important components of e-Agriculture where technology aids farmers with better information and alternatives. It uses a host of technologies like Remote Sensing, Computer Simulation, Assessment of speed and direction of Wind, Soil quality assays, Crop Yield predictions and Marketing using IT.
In India, there have been several initiatives by State and Central Governments to meet the various challenges facing the agriculture sector in the country. The E-Agriculture is part of the Mission Mode Project, which has been included in NeGP (under National E-governance Plan) to consolidate the various learnings from the past, integrate all the diverse and disparate efforts currently underway, and upscale them to cover the entire country.
In the framework of agriculture, the impact of information technology can be evaluated broadly under two categories. First, Information technology is a tool for direct contribution to agricultural productivity and secondly, it is an indirect tool for empowering agriculturalists to make informed and quality decisions that will have a positive impact on the agriculture and allied activities conducted. Precision agriculture which is popular in developed countries broadly uses information technology to make a direct contribution to agricultural efficiency.
It is well recognized that E-Agriculture is a developing field focusing on the augmentation of agricultural and rural development through better information and communication processes. More precisely, e-Agriculture involves the conceptualization, design, development, evaluation and application of innovative ways to use information and communication technologies in the rural area, with a primary focus on agriculture.
Information technology can aid Indian farmers to get significant information regarding agro-inputs, crop production technologies, agro-processing, market support, agro-finance and management of farm agri-business. The agricultural extension tool is becoming dependent on Information technology to provide appropriate and location-specific technologies for the farmers to provide timely and proficient advice to the farmers. Information technology can be the best means not only to develop agricultural extension but also to expand agriculture research and education system.
Information and communication technologies can enhance the agricultural sector in developing countries by functioning as pioneering solutions to agricultural challenges. Information technology is drastically changing the lives of humans in all areas including the agriculture sector. Information technology use computers along with telecommunication equipment for the retrieval, storage, transmission and manipulation of data, which are aimed to improve competence in the agriculture sector.
Home automation or domotics is building automation for a home, called a smart home or a smart house. The word “domotics” is a contraction of the Latin word for a home (Domus) and the word robotics. The word “smart” in “smart home” refers to the system being aware of the state of its devices, which is done through the information and communication technologies (ICT) protocol and the Internet of Things (IoT).
A home automation system will monitor and control home attributes such as lighting, climate, entertainment systems, and appliances. It may also include home security such as access control and alarm systems. Home automation allows you to control almost every aspect of your home through the Internet of Things.
A home automation system typically connects controlled devices to a central smart home hub (also called a “gateway”). The user interface for controls of the system uses either wall-mounted terminals, tablet or desktop computers, a mobile phone application, or a Web interface that may also be accessible off-site through the Internet. Home automation has a high potential for sharing data between family members or trusted individuals for personal security and leads to energy-saving measures with a positive environmental impact in the future.
Applications and technologies:
Home automation is prevalent in a variety of different realms, including:
Heating, ventilation and air conditioning (HVAC): it is possible to have remote control of all home energy monitors over the internet incorporating a simple and friendly user interface.
Lighting control system: a “smart” network that incorporates communication between various lighting system inputs and outputs, using one or more central computing devices.
Occupancy-aware control system: it is possible to sense the occupancy of the home using smart meters and environmental sensors like CO2 sensors, which can be integrated into the building automation system to trigger automatic responses for energy efficiency and building comfort applications.
Appliance control and integration with the smart grid and a smart meter, taking advantage, for instance, of high solar panel output in the middle of the day to run washing machines.
Home robots and security: a household security system integrated with a home automation system can provide additional services such as remote surveillance of security cameras over the Internet, or access control and central locking of all perimeter doors and windows.
Leak detection, smoke and CO detectors
Laundry-folding machine
Indoor positioning systems (IPS). Home automation for the elderly and disabled.
Pet and baby care, for example, tracking the pets and babies’ movements and controlling pet access rights.
Air quality control (inside and outside). For example, Air Quality Egg is used by people at home to monitor the air quality and pollution level in the city and create a map of the pollution.
Smart kitchen, with refrigerator inventory, premade cooking programs, cooking surveillance, etc.
Voice control devices like Amazon Alexa or Google Home are used to control home appliances or systems.
Advantages:
1. Energy Savings
Home automation systems have proven themselves in the arena of energy efficiency. Automated thermostats allow you to pre-program temperatures based on the time of day and the day of the week. And some even adjust to your behaviours, learning and adapting to your temperature preferences without your ever inputting a pre-selected schedule. Traditional or behaviour-based automation can also be applied to virtually every gadget that can be remotely controlled – from sprinkler systems to coffee makers. Actual energy savings ultimately depend on the type of device you select and its automation capabilities. But on average, product manufacturers estimate the systems can help consumers save anywhere from 10 to 15 per cent off of heating and cooling bills.
2. Convenience
In today’s fast-paced society, the less you have to worry about, the better. Right? Convenience is another primary selling point of home automation devices, which virtually eliminate small hassles such as turning the lights off before you go to bed or adjusting the thermostat when you wake up in the morning.
Many systems come with remote dashboard capabilities, so forgetting to turn off that coffee pot before you leave no longer requires a trip back to the house. Simply pull up the dashboard on a smart device or computer, and turn the coffee pot off in a matter of seconds.
3. Security
Remote monitoring can put your mind at ease while you’re away from the house. With remote dashboards, lights and lamps can be turned on and off, and automated blinds can be raised and lowered. These capabilities – combined with automated security systems – can help you mitigate the risks of intrusions: you will be alerted immediately if something uncharacteristic happens.
The Disadvantages
1. Installation
Depending on the complexity of the system, installing a home automation device can be a significant burden on the homeowner. It can either cost you money if you hire an outside contractor or cost you time if you venture to do it yourself.
2. Complex Technology
Automating everything in life may sound extremely appealing, but sometimes a good old-fashioned flip of the switch is a lot easier than reaching for your smartphone to turn lights on and off. Before you decide which system is right for you, think about how far you want to take home automation in your household.
3. System Compatibility
Controlling all aspects of home automation from one centralized platform is important, but not all systems are compatible with one another. Your security system, for example, may require you to log in to one location to manage settings, while your smart thermostat may require you to log in to another platform to turn the air conditioner on and off. To truly leverage the convenience of home automation, you may need to invest in centralized platform technology to control all systems and devices from one location.
4. Cost
Even though the price of home automation systems has become much more affordable in recent years, the cost to purchase and install a device can still add up. Consumer Reports offers a wide range of information and insights – including costs – on the best home automation systems on the market.
Main purpose of home automation system is to provide ease to people to control different home appliances with the help of the android application present in their mobile phones and to save electricity, time and money. The sheer quantity of consumer attention generated by home automation technology means the biggest technology businesses and innovators have entered a race to overtake one another. That means better smart house technology is continually improved to coincide with our technological requirements.
Computer Crime Cyber crime encompasses any criminal act dealing with computers and networks (called hacking).Additionally, cyber crime also includes traditional crimes conducted through the internet. For example; The computer may be used as a tool in the following kinds of activity- financial crimes, sale of illegal articles, pornography, online gambling, intellectual property crime, e-mail spoofing, forgery, cyber defamation, cyber stalking.The computer may however be target for unlawful acts in the following cases- unauthorized access to computer/ computer system/ computer networks, theft of information contained in the electronic form, e-mail bombing, Trojan attacks, internet time thefts, theft of computer system, physically damaging the computer system
Cyber Law is the law governing cyberspace. Cyberspace is a wide term and includes computers, networks,software, data storage devices (such as hard disks, USB disks), the Internet, websites, emails and even electronic devices such as cell phones, ATM machines etc.
Computer crimes encompass a broad range of potentially illegal activities. Generally, however, it may be divided into one of two types of categories
(1) Crimes that target computer networks or devices directly; Examples – Malware and malicious code, Denial-of-service attacks and Computing viruses.
(2) Crimes facilitated by computer networks or devices, the primary target of which is independent of the computer network or device. Examples – Cyber stalking, Fraud and identity theft, Phishing scams and Information warfare.
CASE STUDIES
Case no:1 Hosting Obscene Profiles (Tamil Nadu)
The case is about the hosting obscene profiles. This case has solved by the investigation team in Tamil Nadu. The complainant was a girl and the suspect was her college mate. In this case the suspect will create some fake profile of the complainant and put in some dating website. He did this as a revenge for not accepting his marriage proposal. So this is the background of the case.
Investigation Process
Let’s get into the investigation process. As per the complaint of the girls the investigators started investigation and analyze the webpage where her profile and details. And they log in to that fake profile by determining its credentials, and they find out from where these profiles were created by using access log. They identified 2 IP addresses, and also identified the ISP. From that ISP detail they determine that those details are uploaded from a café. So the investigators went to that café and from the register and determine suspect name. Then he got arrested and examining his SIM the investigators found number of the complainant.
Conclusion
The suspect was convicted of the crime, and he sentenced to two years of imprisonment as well as fine.
Case no:2 Illegal money transfer (Maharashtra)
ThIS case is about an illegal money transfer. This case is happened in Maharashtra. The accused in this case is a person who is worked in a BPO. He is handling the business of a multinational bank. So, he had used some confidential information of the banks customers and transferred huge sum of money from the accounts.
Investigation Process
Let’s see the investigation process of the case. As per the complaint received from the frim they analysed and studied the systems of the firm to determine the source of data theft. During the investigation the system server logs of BPO were collected, and they find that the illegal transfer were made by tracing the IP address to the internet service provider and it is ultimately through cyber café and they also found that they made illegal transfer by using swift codes. Almost has been The registers made in cyber café assisted in identifying the accused in the case. Almost 17 accused were arrested.
Conclusion
Trail for this case is not completed, its pending trial in the court.
Case no:3 Creating Fake Profile (Andhra Pradesh)
The next case is of creating fake profile. This case is happened in Andhra Pradesh. The complainant received obscene email from unknown email IDs. The suspect also noticed that obscene profiles and pictures are posted in matrimonial sites.
Investigation Process
The investigators collect the original email of the suspect and determine its IP address. From the IP address he could confirm the internet service provider, and its leads the investigating officer to the accused house. Then they search the accused house and seized a desktop computer and a handicam. By analysing and examining the desktop computer and handicam they find the obscene email and they find an identical copy of the uploaded photos from the handicam. The accused was the divorced husband of the suspect.
Conclusion
Based on the evidence collected from the handicam and desktop computer charge sheet has been filed against accused and case is currently pending trial.
Hacking is a widespread crime nowadays due to the rapid development of the computer technologies. In order to protect from hacking there are numerous brand new technologies which are updated every day, but very often it is difficult to stand the hacker’s attack effectively. With some of these case studies, one is expected to learn about the cause and effect of hacking and then evaluate the whole impact of the hacker on the individual or the organization.
The dependency of societies on technology is undebatable. Social media has emerged as a saviour amidst the pandemic which made it very challenging to stay connected in terms of our personal and professional life. However, the recent social media outages have revealed a scary fact: we cannot afford them. They cause damages to as many sectors of society as technology benefits.
Effects on economy
Facebook, home to one of the largest social media networks across the globe, upon recently facing a major outage and disruption in its services like WhatsApp and Instagram, took entrepreneurs by shock as their sales dipped dramatically and they scrambled to cater to the increasingly impatient customers. From beauty and clothing to food delivery, many industries were simultaneously affected. The services were completely stalled for hours which created a lot of stress and panic.
Facebook itself suffered revenue losses of billions and the world economy had to pay the price. The small-scale advertisers, influencers, and content creators were forced into helplessness as their only methods of interacting with the audience and making ends meet suffered a blow. Such financial dependence on social media continues to prove itself a major cause of concern.
Effects on education
Social media has been a boon for the education sector, providing students and educators around the world with ample opportunities to enhance knowledge sharing, despite the uncertainties of a global pandemic. But the outages on educational platforms have proved to be costly. Zoom, for example, suffered major glitches which were very inconvenient and caused communication problems between students and educators, which, in turn, is detrimental for their academic growth.
Moreover, educators also feel the pressure to rush through the materials since these technical issues take much time to be fixed. Many other platforms such as WhatsApp, Facebook and YouTube, which are also used by educators to keep the students updated, upon facing such issues, create a lot of panic and confusion.
Effects on mental health
Social media is constantly used by many as a way of entertainment and recreation. It allows us to relieve stress and cope with day-to-day life. But many people also use it as a form of escapism and eventually become addicted. Outages expose them to periods where they experience extreme withdrawal symptoms. When their mental health and happiness are dependent upon an external source such as social media in the form of validation received through likes and comments, feelings of anxiety, stress and emptiness creep in when those services are stalled for hours.
Not only are they unable to connect with others to reduce loneliness but they also get stuck with their negative thoughts which have a very poor effect on their overall well-being. Research shows that social media is one of the leading causes of depression as it is designed in such a way that people automatically fall into the trap of comparison and information overload.
Is there a way out?
While social media outages are abrupt and often uncontrollable, as individuals, we can educate others and take steps towards reducing our dependence on it in some ways-
Limiting screen time – Instead of scrolling endlessly for hours, social media can be used mindfully by delegating certain hours of the day to it while engaging in other activities and hobbies during the day. This would ensure that our well-being is not compromised and we can successfully achieve our goals.
Spending time with others – Be it a family member, friend or even a pet, we must make sure that we have some company so that we do not slip into loneliness or other destructive habits which can worsen social media addiction. Participating in volunteering work or joining local communities that align with our interests is also a great way to be more active physically and mentally.
Social media detox – Refraining from using technology and social media for a fixed amount of time is also a good method to overcome social media dependency. Taking help from family members and friends, identifying triggers which guide the over-consumption and making a planner to track its effects on daily mood are some helpful ways that can make this process easier.
Choosing alternatives – In the case of finance, we must make sure that social media is never the only source of making ends meet. We must always be prepared and have enough skills to tackle the challenges of a physical workspace in case our social media business comes to a halt. Multiple courses can be easily found, online or offline, which can aid us in the process.
Social media outages serve as a reminder that although it is a great source of education, entertainment and much more, it has an unpredictable aspect to it which can prove to be damaging if we do not gain control over our online consumption. Hence, we must learn to strike a balance between our online and offline worlds.
“Like all technology, social media is neutral but is best put to work in the service of building a better world.”
In today’s world we can’t even imagine life without Technology. And since the pandemic broke out the technology has became an absolute necessity. In the current time, everything we do is mostly online whether it is classes, meetings, webinar etc. And this might be the way our future will be working.
Technology as friend
No place limitation : Technology has remove the hindrance of place as you can have your meetings classes webinars competition online from all over the world at any place in the any corner of the world
Connecting to a wider range of people: with the help of social media you can connect to wider range of people, know more about the culture tradition or you can connect with the people who like you, might be friends with you from any part of this world.
Learn coursesonline: it provides with the opportunity to learn online on your pace and time when ever you want.
Online payment : now no longer we have to keep a wallet with ourselves, we just need our smartphone and there is no fear of theft as everything is locked with secure password.
Online shopping : no need to roam shop to shop to get your favourite outfit or anything and at your price, home delivery with just one click.
Technology as foe
Slave of Technology: we are so much dependent on technology that we don’t use it are actually became a slave of it.
Loss of memory power : earlier when there were no call logs present, we use to remember the numbers of everyone but now we have started storing everything in our phones, laptop we have started losing the memory power.
Causing damage to Eyes : the screen time has increased ever since the pandemic has started everything we attend is online and it is causing damage to our eyes.
Online fraud : the cases for online fraud has increased as we don’t know whom to trust and whom to not. We are not meeting anyone personally or know where to report it.
Unethical hacking : hacking has increased which cause us loss of money in even leads to stalking.
Trolling and bullying online : everyone is on social media when we post anything there are mean comment, trolling, bullying which cause mental pressure.
At the end I want to say that there is a positive and a negative side of everything we should always focus on the positive side and stay happy in our life.
The 19th and 20th centuries were marked by great scientific and technological developments. These developments encompassed many different fields like transportation, communication, manufacturing, education, trade, health care and others.
The life of people has become quite comfortable with these scientific innovations as various types of machines have begun to perform complex tasks for them.
There was a time when man used to walk long distances to reach other places for trade and other pursuits. The invention of wheel enabled him to make hand-driven and animal driven carts to transport various types of goods to different destinations.
With the invention of petrol and the engines that could be used it as fuel came different types of vehicles. Cars, trucks, buses, bikes and other road transport means started being made. This was perhaps the greatest scientific development. People could go to long distances and in large number.
They started going to other countries. Not only the trade flourished but also there was cultural development because of interaction of people of different heritages, beliefs, traditions-each influencing the other in some way. Man conquered the oceans with the making of ships, vessels, boats. Going to other continents became easier. Also with the help of large ships the countries could transport large quantities of products to other places for purposes of trade. The fishing trawlers enabled people to get sea-food in large quantities, adding to their food security.
The biggest achievement in the field of transportation came in the shape of aeroplanes. The Wright brothers made the first aeroplane and flew on it for a few seconds, but most importantly, they gave the idea of the air transport. The idea was subsequently developed by aeronautical engineers into the making of aeroplanes. Today, air travel is perhaps the most important means of travel for its speed and comfort.
A person can have breakfast in India, lunch in London and dinner in some American or African country-thanks to the speedy air-travel. With the development of trade and increase in population, there was a need to build a transport system that could carry a large number of people and heavy amounts of cargo to different places on a regular basis. The answer came in the form of railways which solved both these problems. Crores of people travel to various destinations in trains across the globe. India’s railway transport system is the biggest in Asia.
The latest technological development in this area is the metro railways. The Delhi Metro Rail Corporation has made a network of metro services in the capital providing sophisticated, comfortable and quick mode of mass public transport system. Similar services are being started in many other major cities in India.
The invention of computers has been another major development in the history of mankind. Broadly speaking, computers are the machines that convert data into information. But with regular upgradation of computer technology, these machines have started to perform the most complex functions.
They are the storehouses of information, disseminators of data, processors of fed information and display systems of the latest positions relating to the area being searched. Invariably all the fields concerned with service industry-including banking, insurance, booking, education, diagnostics, developing, designing, etc. are working with the help of computers-which not only provide accuracy and speed but also variety and attractiveness.
Whereas the new technologies in diagnosis of various diseases have enabled us to detect deformities at exact places in the body and at an early stage of such happening, the treatment has also become easy and sure though expensive. There was a time when lakhs of people died due to epidemics of plague, smallpox, cholera, etc. But, due to research and new treatment technologies involving prevention through immunisation, these diseases are not allowed to assume epidemic and devastating proportions.
Some of diseases like plague, polio, smallpox, etc. have been eradicated. There are medicines for most dangerous of diseases and conditions. Serious ailments like heart trouble, diabetes, cancer, high blood pressure, liver damage, etc. are kept under control with the use of medication regularly. Medical check-ups have been very convenient and accurate with the help of new machines.
In the field of communication technology, the innovation of mobile phones has revolutionised the society. People can make a call from anywhere to anywhere exchanging valuable information. This has facilitated trade, strengthened relationships and brought connectivity in the society.
The cellphones can also be used to send messages, listen to music, set alarms, store telephone numbers, addresses, etc. Mass media thrives on technology. The TV programmes which run twenty-four hours a day, three-hundred-sixty-five days a year, bring latest news from all over the world. With serials, films, live telecasts and game shows, the TV has become the biggest source of information and entertainment for us. Its value to students through educational programmes and to people in general for increasing their awareness level is highly significant.
There are certain disadvantages of scientific developments. Scientists have made weapons of mass destruction and other warheads which are used in wars. Humanity has already suffered vast damage and destruction in two Japanese cities Hiroshima and Nagasaki when America dropped atom bombs on them in the Second World War-in which thousands of people were killed, several thousands were wounded, property worth several crores of rupees was destroyed.
With the making of such dangerous weapons, today’s wars have become highly dangerous. If there is a third World War only God knows what will happen to the world. The terrorists are using dangerous weapons like mines, explosives, machine guns and rocket launchers to terrorise civil society.
Another fall out of scientific development is the pollution of air and water which has reached alarming levels. The factories, industries and vehicles are giving out tonnes of smoke and effluents which are vitiating the air and water which are our main sources of consumption.
Scientific and technological inventions are for the benefit of mankind. It is for us to use them to bring progress and happiness in society. What we require is judicial use of resources at our proposal, banish war and confrontation and adopt methods of sustainable development. We need to enforce strict discipline to stop unscrupulous and illegal use of technologies.
Stringent laws need to be made against cyber crimes. We also have to ensure that scientific development does not become environmentally destructive. Sustainable practices need to be adopted to protect habitats and natural ecosystems. At international level, the world body-the UNO and other leading nations should assume the responsibility of ensuring that science and technology are not misused.
Advertisements
Science and technology has a profound impact on all of humanity’s activities.
Science and technology inventions and discoveries, including the theory of the origin of the universe, the theory of evolution, and the discovery of genes, have given humanity many hints relating to human existence from civilized and cultural points of view. Science and technology have had an immeasurable influence on the formation of our understanding of the world, our view of society, and our outlook on nature.
The wide variety of technologies and science discoveries produced by humanity has led to the building and development of the civilizations of each age, stimulated economic growth, raised people’s standards of living, encouraged cultural development, and had a tremendous impact on religion, thought, and many other human activities. The impact of science and technology on modern society is broad and wide-ranging, influencing such areas as politics, diplomacy, defense, the economy, medicine, transportation, agriculture, social capital improvement, and many more. The fruits of science and technology fill every corner of our lives.
The hundred years of the twentieth century have been called the “century of science and technology,” the “century of war,” and the “century of human prosperity,” among other expressions. Science and technology have thus far brought humanity immeasurable benefits. In the twenty-first century, dubbed the “century of knowledge” and the time of a “knowledge-based society,” it is hoped that the diverse potentials of science and technology, built upon the foundation of the hard-won science and technology of the twentieth century, will be used to solve the serious issues faced by humanity, such as global environmental problems. Moreover, it is also important to hold the firm belief that science and technology must be faithfully passed on to future generations as an irreplaceable asset of humanity, driven by the trust and support of the public.
In the present, squarely addressing the relationship between science and technology and society is an essential challenge to the sound development of science and technology, one which it is important to continue addressing in the future based on historical and civilized perspectives, while also maintaining a deep awareness of the needs of the times.
The immune system is a system that operates 24 hours a day, seven days a week to keep assaults at bay and diseases at bay. The whole system is made up of organs, tissues, and a variety of cell types that work together to defend the body. Immune cells must be able to tell the difference between native and non-native cells and proteins. Microbial cells have antigens that serve as identifiers. Antigens can induce an immune response in the human body. Each species has its own set of characteristics. Vaccines function by inducing an antibody memory response in the body without producing illness. As a result, you build immunity without becoming sick. It must include at least one antigen from the target species to trigger a response.
INTRODUCTION TO VACCINE TECHNOLOGY
A vaccination, often known as an immunisation, is a biological substance that protects people from disease-causing microorganisms. They make advantage of our immune system’s built-in ability to fight infection.
They’re produced from the same pathogens that cause the disease. They have, however, been destroyed or reduced to the point that they are no longer a source of it. Certain medicines just contain a part of the microorganism.
This is why they work so well as medications. They don’t treat or cure diseases like conventional medications; instead, they prevent them. They deceive the immune system that it has been invaded by a real intruder. When real germs enter our bodies, the same thing happens, but you don’t become ill. If you ever come into touch with a pathogen, your immune system will remember it and eradicate it before it can damage you.
TYPES
Vaccines are made using a number of techniques. Various vaccine types need different techniques to development. Antigens can be used in a variety of ways, including:
These can be delivered by a needle injected into the human skin, or ingested orally or through the nasal route.
LIVE (CHICKEN POX AND MMR)
Attenuated vaccines can be made in a variety of ways. All methods involving the transmission of a virus to a non-human host result in a virus that can be recognised by the immune system but cannot replicate in humans. When given to a human, the resulting will not be able to proliferate sufficiently to cause disease, but it will protect the individual from infection in the future. Its protection outlasts that of a dead or inactivated vaccination in most cases.
INACTIVATED (POLIO VIRUS)
A pathogen is inactivated using heat or chemicals to create this sort of vaccination. Because destroyed viruses are unable to replicate, they cannot revert to a more virulent form capable of causing disease. They are, however, less effective than live vaccines and are more likely to require renewals in order to acquire long-term protection.
RECOMBINANT (HPV)
They have been genetically modified in a lab. This method may be used to duplicate a certain gene. The HPV vaccine may be tailored to protect against strains that cause cervical cancer.
SUBUNIT (INFLUENZA AND ACELLULAR PERTUSSIS) AND CONJUGATE VACCINES (HAVING ONLY PIECES OF THE PATHOGEN)
Subunit vaccines use only a fraction of a target pathogen to elicit a response. This can be accomplished by isolating and administering a specific pathogen protein as a stand-alone antigen.
Conjugate vaccines, like recombinant vaccines, are made up of two different components. The “piece” of microbe being supplied would not typically elicit a substantial reaction on its own, but the carrier protein would. The bacterium is not the sole cause of the disease, but when combined with a carrier protein, it can render a person resistant to subsequent infections.
TOXOIDS (DIPHTHERIA AND TETANUS)
Some diseases are caused by a toxin produced by bacterium rather than by the bacterium themselves. Toxoids are inactivated toxoids that are used in vaccinations. Toxoids are classed as killed vaccines, although they are sometimes given their own category to emphasise the fact that they include an inactivated toxin.
DEVELOPMENT AND PRODUCTION
Vaccine development is a lengthy process that involves both public and private parties and takes almost a decade. Millions of individuals receive them each year, and the most of them have been in use for decades. Before being included in a country’s vaccination programme, they must undergo extensive testing to ensure their safety. Each vaccine in development must first go through screenings and evaluations to determine which antigen should be utilised to elicit a reaction. This step is completed without the use of humans. Animals are used to assess the safety and disease-prevention potential of experimental vaccinations.
STAGE 1
It takes around 2-4 years to produce and necessitates some fundamental research. Antigens, whether natural or synthetic, are identified by scientists and may help in disease prevention or therapy. Antigens might be virus-like particles, attenuated viruses or bacteria, weakened bacterial toxins, or other pathogen-derived substances.
STAGE 2
Using tissue or cell-culture techniques and animal testing, studies assess the candidate vaccine’s safety or ability to elicit an immune response. Animal topics include fish, monkeys, and mice. These studies give an idea of what to expect in terms of cellular responses in people. This period often lasts 1-2 years.
PHASE I TRIALS
The vaccine is administered to a small number of volunteers to determine its safety, confirm that it induces a reaction, and determine the optimum dosage. This round of testing is carried out on young, healthy adult participants. The goals are to determine the type and number of reactions generated by the candidate vaccine, as well as to assess the candidate vaccine’s safety.
PHASE II TRIALS
The vaccine is then given to several hundred participants to assess its safety and ability to elicit a response. Participants in this phase share the same traits as the vaccine’s intended recipients. Several studies are often undertaken during this phase to test various age groups and vaccination formulations. In most studies, a non-vaccinated group is included as a comparison group to check if the changes in the vaccinated group were due to chance or medicine.
PHASE III TRIALS
The goal is to assess vaccine safety in a large group of patients. Certain rare side effects may not have showed themselves in the low numbers of people tested in the first phase. Thousands of volunteers are given the vaccination compared to a similar number of individuals who did not receive the injection but received a comparator product to assess the vaccine’s efficacy against the illness. It is meant to protect against and to examine its safety in a much bigger group of people. To guarantee that the performance findings are applicable to a wide variety of persons, the bulk of phase three trials are conducted across various countries and different sites within a country.
PHASE IV TRIALS
Firms may conduct optional studies following the launch of a vaccine. The producer may do additional testing to determine the vaccine’s safety, efficacy, and other potential applications.
REVERSE VACCINOLOGY
Reverse vaccinology is the use of genetic information combined with technology to make vaccines without the use of microorganisms. It assists in the study of an organism’s genome for the purpose of identifying novel antigens and epitopes that may be utilised as prospective candidates. This method has been around for at least a decade. By unravelling the entire genomic sequence, it is possible to determine what molecules make up the genomic sequence. Without needing to grow the pathogen for a longer amount of time, candidate antigens can be discovered.
Reverse vaccinology has been used to create vaccines for meningococcal and staphylococcal diseases all over the world. Infections are caused by Staphylococcus bacteria, which can be found on the skin or in the nose of even healthy persons. The bacteria Neisseria meningitidis causes a serious infection of the thin covering of the brain and spinal cord.
PRODUCTION QUALITY CONTROL AND COMMERCIALIZATION
Vaccines are biological compounds that are frequently hybridised and complex to understand. They are made through a succession of manufacturing and formulation steps, with the finished product often containing a large number of component items. As a result, unlike a tiny molecule medicine, the finished product is impossible to classify. This needs a highly controlled production system as well as a personnel capable of performing such processes on a continual basis. Control testing takes over two years and occupies more than half of the time in the subsequent manufacturing process.
STEP 1- PRODUCTION
Following clinical trials, when a vaccine reaches the pre-approval stage, it is evaluated by the applicable regulatory authority for quality, safety requirements.
STEP -2 MAKING
Businesses will create development plans for a vaccine on their own. Once a vaccine is approved, production begins to pace up. The antigen has been rendered inactive. All of the components are mixed to make the final product. The entire process, from testing to manufacturing, can take a lengthy time to complete.
STEP- 3 PACKAGING
It is then bottled in glass vials and packed for safe cold storage and transportation once it is produced in bulk. It must be able to resist severe temperatures as well as the dangers associated with international shipping. As a result, glass is the most often used material for vials since it is robust and can keep its integrity under severe extrinsic factors.
STEP- 4 STORAGE
When it is excessively hot or cold, it loses its effectiveness and may even become inert. Vaccinations can be destroyed or rendered dangerous to use if kept at the improper temperature. Most vaccinations must be kept chilled between 2 and 8 degrees Celsius, necessitating the use of specialist medical freezers.
STEP-5 SHIPPING
They are transported out using particular equipment so as to maintain its integrity. Lorries deliver them from the airport to the warehouse cool room after supplies arrive in the market. New innovations have resulted in the development of portable devices that can keep vaccines cold for several days without the need of power.
QUALITY CONTROL
Once they are given out, authorities continuously check for – and assess the severity of – any potential side effects and responses from the recipients. Safety is a top priority, with frequent reviews and post-approval clinical trials reporting on its effectiveness and safety.
CAREER SCOPE
There are several prospects in vaccine research and development, clinical trials, vaccine manufacturing, and public distribution. These jobs are available at universities, companies, government laboratories and agencies, hospitals, and on the front lines of vaccine distribution all around the world. When different components of a project are handled by different groups at the same time in industry, greater teamwork is usually required, whereas a scientist in an academic lab may be a lone worker overseeing all parts of a project.
The balance between creative science and all of the business administration that comes with securing money, maintaining a budget, and overseeing other scientists or assistants is the most challenging aspect.
Research allows scientists to work on a project that has the potential to have a direct influence on public health, whether it’s on a lab bench, a production line, or to support a clinical trial.
The year 2020, as we all know, will be a major change in our life. It has also demonstrated the opposite side of existence. We continued to count things for the future, and when the pandemic struck, it reminded us of how unexpected life can be; different aspects of life were affected, and working conditions were significantly altered. There was a lot of misunderstanding in the education industry about how to teach pupils, how to start lessons, and so on. However, technology was the solution to all problems.
People have used mobile phones for social interactions and pleasure in the past, but they have now evolved into a source of information, and we can say that school has come within our grasp. This situation is very similar to one of the chapters in NCERT’s English course book for class 9 called “The fun they had,” in which two children from the future (2050) got their hands on a real hardcover book from their grandfather and were amused by the idea of a real school and school building where all the children of the same age group used to study together under one roof and thought that happiness was being together with their friends. Did the pupils in this circumstance realise that this narrative would become so relevant and genuine to them? Many parents used to refuse to let their children to use cell phones, but it has now become a necessity.
Although there are always two sides to a coin, sales of smart phones soared as a result of the epidemic, since every home needed one additional one for their children to attend courses. Technology has also played a significant role in education, and how we use it can have positive or negative consequences. Phones have evolved into more than simply a means of communication; they have also become a lifeline and an indispensible component of our lives in some manner. It was a struggle for teachers to not only teach their material but also to engage with their pupils throughout these testing periods. They’ve also learned to utilise technology in a variety of ways, including not just communicating but also using various digital classrooms, boards, and audio and visual teaching and learning methods. They were not only effective in speaking with pupils, but also with their guardians, and despite the challenges, they were able to establish an emotional bond with them.
Many parents lost their jobs as a result of industry losses and were obliged to shift their children from private to government schools, but many were pleased to do so because the curriculum is on par with top institutions. The government and teachers have made it a point to link each and every kid with them. Many teachers aided their students financially as well as academically. Many teachers have also attempted to offer phones or internet connections to their kids, demonstrating that humanity bears primary responsibility in any scenario.
The desire for change in school education emerges as a result of continual changes in society on psychological, social, and economic levels. As a result, we must constantly introduce and upgrade a framework. As you can see with the current pandemic, a lot of adjustments are required both during and after the crisis. With this in mind, the Delhi government began giving curriculum-based work sheets to children of all grades, as well as training their teachers.
Teachers’ ability and efficiency have been improved via the use of webinars and online seminars on a regular basis. Regular trainings were provided to demonstrate how to use Google products to make the teaching and learning process more engaging and beneficial. The government has also launched a number of applications, such as Chalklit and Diksha, to provide a platform for various trainings and to keep instructors informed about innovative ways of teaching and learning. It was remarkable that students continued to attend courses on a regular basis, whether they were in the same city or in their village; their desire to study grew day by day, and they began to respond positively.
The Center on Thursday declared another robot strategy. Under the Drone Rules 2021, the inclusion of robots expanded from 300 kg to 500 kg, and will incorporate weighty payload-conveying robots and robot taxis.
Furthermore, the new robot rules eliminate trusted status before any enlistment or permit issuance.
In view of the input, the Ministry of Civil Aviation (MoCA) said it chose to annul the UAS Rules, 2021 and supplant something similar with the changed Drone Rules, 2021.
The Aviation service had distributed UAS Rules, 2021 in March.
Here are 30 vital elements of Drone Rules 2021:
1.According to the Civil Aviation Ministry, a few endorsements annulled: remarkable authorisation number, one of a kind model recognizable proof number, declaration of assembling and airworthiness, testament of conformance, authentication of support, import leeway, acknowledgment of existing robots, administrator grant, authorisation of R&D association, understudy distant pilot permit, far off pilot teacher authorisation, drone port authorisation and so on
2.Number of structures decreased from 25 to 5.
3.Types of expenses diminished from 72 to 4.
4.Quantum of charge diminished to ostensible levels and delinked with size of robot. For example, the charge for a far off pilot permit expense has been diminished from ₹3,000 (for enormous robot) to ₹100 for all classes of robots; and is substantial for a very long time.
5.Digital sky stage will be created as an easy to understand single-window framework, the Civil Aviation Ministry said in an articulation.
6.Interactive airspace map with green, yellow and red zones will be shown on the computerized sky stage inside 30 days of distribution of these standards.
7.No authorization needed for working robots in green zones. Green zone implies the airspace up to an upward distance of 400 feet or 120 meter that has not been assigned as a red zone or yellow zone in the airspace map; and the airspace up to an upward distance of 200 feet or 60 meter over the space situated between a horizontal distance of 8 and 12 kilometer from the border of a functional air terminal.
8.Yellow zone diminished from 45 km to 12 km from the air terminal edge.
9.No far off pilot permit needed for miniature robots (for non-business use) and nano drones.
10.No necessity for exceptional status before issuance of any enrollment or permit.
11.No prerequisite of Type Certificate, novel recognizable proof number and distant pilot permit by R&D elements working robots in own or leased premises, situated in a green zone.
12. No limitation on unfamiliar proprietorship in Indian robot organizations.
13. Import of robots to be controlled by DGFT.
14. Requirement of import freedom from DGCA nullified.
15.Coverage of robots under Drone Rules, 2021 expanded from 300 kg to 500 kg. This will cover drone taxis moreover.
16.DGCA will endorse drone preparing necessities, regulate drone schools and give pilot licenses on the web.
17. Remote pilot permit to be given by DGCA inside 15 days of pilot getting the far off pilot endorsement from the approved robot school through the advanced sky stage.
18.Testing of robots for issuance of Type Certificate to be done by Quality Council of India or approved testing substances.
19. Type Certificate required
20.Nano and model robots (made for examination or amusement intentions) are absolved from type confirmation.
21.Manufacturers and merchants might produce their robots’ extraordinary ID number on the advanced sky stage through the self-accreditation course.
22.Drones present in India at the latest November 30, 2021 will be given an extraordinary ID number through the computerized sky stage gave, they have a DAN, a GST-paid receipt and are essential for the rundown of DGCA-supported robots.
23.Standard working methods (SOP) and preparing strategy manuals (TPM) will be recommended by DGCA on the advanced sky stage for self-observing by clients.
24.. No endorsements required except if there is a huge takeoff from the recommended strategies.
25.Maximum punishment for infringement decreased to Rs1 lakh.
26.Safety and security highlights like ‘No consent – no take-off’ (NPNT), continuous following reference point, geo-fencing and so on to be told in future.
27.A half year lead time will be given to the business to consistence.
28.Drone passages will be created for load conveyances.
29.Drone advancement committee to be set up by Government with cooperation from the scholarly community, new businesses and different partners to work with a development arranged administrative system.
30.There will be insignificant human interface and most consents will act naturally produced, the association flight service added.
You can find the Intel VPro technology in many devices. VPro technology is a platform that has both the hardware and firmware. VPro can be found in laptops and mobile workstations. VPro is available in the CPU of a device or in its wireless chip. In April 2019, Intel launched the latest vPro which is the 8th Generation Intel Core series. The latest version is around 60 percent better than its previous counterparts. It has around ten to eleven hours of battery.
Also, it supports Wi-Fi that will allow fast internet connectivity. A vPro needs to have a Trusted Platform Module, cryptoprocessor and wireless/ wired internet speed. To most people still confused about what is vPro technologyand the features it offers, Intel support will answer all your queries.
Contents of Intel VPro Technology
They will include a multi core and multi thread XEON or Core processors
Intel AMT which is a set of features that help remote access enabling for PCs
Most people opt for VPro due to this AMT technology that help enterprises seek help remotely.
Wired or a wireless internet connectivity.
Intel TXT that will verify the launch environment. It is a computer hardware technology whose primary goals are: Attestation of the authenticity of a platform and its operating system.
Intel vPro provides support for IEEE 802.1X, Cisco Self Defending Network and Microsoft NAP(Network Access Protector).
Intel VT-x for CPU and memory. The Intel VT-x extensions are probably the best recognized extensions, adding migration, priority and memory handling capabilities to a wide range of Intel processors.
Intel VT-d for I/O to support remote environment.Intel VT-d is the latest part of the Intel Virtualization Technology hardware architecture. VT-d helps the VMM better utilize hardware by improving application compatibility and reliability, and providing additional levels of manageability, security, isolation, and I/O performance.
Intel VT-x will help to accelerate hardware virtualization.The Intel VT-x extensions are probably the best recognized extensions, adding migration, priority and memory handling capabilities to a wide range of Intel processors.
VPro was initially installed to help IT departments streamline the procedure to turn on and off enterprise desktop computers.To remotely manage an AMT device, it has to be configured and communication needs to be established over the corporate network. It must have an AMT Master password for admin assigned and the local network connection information applied to the firmware. No matter what the AMT type is, it has to be configured and set up for use by following Intel’s setup and configuration manual. For all those who are still seeking answers to What is intel vPro technology and if their business needs one.
How does VPro Function?
A pre-existing software is used to manage all intel vPro technology features. Microsoft SCCM is a commonly used console client. 90 % of IT departments manage remote activities with SCCM
What are the Intel vPro technology advanced management features?
VPro technology manages, scans and updates PC remotely
VPro is a go to platform when a person who is away from the IT team required help in their device
For eg. incase of a virus attack while working remotely, the IT professionals can update and reset your device using VPro instead of physically visiting the device location
In cases of mass updating or installation for the whole company, the IT team can easily access all the devices remotely. This includes updating OS, BIOS or any other software. This will ensure all are using the same software and updated version
An Intel Pro SSD hard drive can be erased easily while using Intel’s VPro system.
The remote erase helps a lot especially if a PC is stolen or when an employee leaves the organization.
VPro Secure?
With a large number of devices connected over a large network, managing and protecting data is a very crucial task. Intel Authenticate (IA) has helped Intel update the security for vPro. IA has helped secure devices by locking them for use by only one user . The authentication is done using fingerprint or password protected PIN.Intel vPro technology advanced management features also offers Intel’s Software Guard Extensions (SGX), which provide secure enclaves for application developers. Those enclaves are safe, protected spaces for programs to be developed without entailing security risks, including data loss or disclosure.
Who can use Intel vPro technology features?
VPro is not designed for common man’s use. Activating VPro requires one to use an enterprise OS and an administrator console. A user would need significant IT expertise to understand the terms, conditions and how it functions. Also, VPro is used to make the job easier for IT professionals functioning remotely. Businesses that have more than 1000 employees can use VPro.Also, for organizations with lesser employees VPro will help organize and manage access levels across different roles. Also, for those organizations that have a large number of employees working remotely; IT department can easily manage the software and IT processes using VPro.
Business Benefits of the Intel vPro Platform
Intel VPro Platform will ensure to provide highest performing Core i5 and i7 that can support and enhance employee’s productivity and performance
It has in built security features that will protect and keep OS secure
Virtual management of systems that are not present on the premise.
Verified platform that integrate latest technologies available for the PC
Intel VPro technology is mostly mistaken to be a tool used to enable remote access. However, apart from remote access that is enabled through AMT; vPro includes innumerable other security benefits. Intel is constantly upgrading its vPro version enhanced with more exciting features and safeguarded with more security.
This is the last article in this series. This article is about another pre-trained CNN known as the ResNet along with an output visualization parameter known as the confusion matrix.
ResNet
This is also known as a residual network. It has three variations 51,101,151. They used a simple technique to achieve this high number of layers.
The problem in using many layers is that the input information gets changed in accordance with each layer and subsequently, the information will become completely morphed. So to prevent this, the input information is sent in again like a recurrent for every two steps so that the layers don’t forget the original information. Using this simple technique they achieved about 100+ layers.
ResNet these are the three fundamentals used throughout the network.
There are many bottlenecks like these throughout the network. Hence by this, the ResNet is able to perform well and produce good accuracy. As a matter of fact, the ResNet is the model which won the ImageNet task competition.
There are 4 layers in this architecture. Each layer has a bottleneck which comprises convolution followed by relu activation function. There are 46 convolutions, 2 pooling, 2 FC layers.
There is a particular aspect apart from the accuracy which is used to evaluate the model, especially in research papers. That method is known as the confusion matrix. It is seen in a lot of places and in the medical field it can be seen in test results. The terms used in the confusion matrix have become popularized in the anti-PCR test for COVID.
The four terms used in a confusion matrix are True Positive, True Negative, and False positive, and false negative. This is known as the confusion matrix.
True positive- both the truth and prediction are positive
True negative- both the truth and prediction are negative
False-positive- the truth is negative but the prediction is positive
False-negative- the truth is positive but the prediction is false
Out of these the false positive is dangerous and has to be ensured that this value is minimal.
We have now come to the end of the series. Hope that you have got some knowledge in this field of science. Deep learning is a very interesting field since we can do a variety of projects using the artificial brain which we have with ourselves. Also, the technology present nowadays makes these implementations so easy. So I recommend all to study and do projects using these concepts. Till then,
This article is about one of the pre-trained CNN models known as the VGG-16. The process of using a pretrained CNN is known as transfer learning. In this case, we need not build a CNN instead we can use this with a modification. The modifications are:-
Removing the top (input) and bottom (output) layers
Adding input layer with size equal to the dimension of the image
Adding output layer with size equal to number of classes
Adding additional layers (if needed)
The pre-trained model explained in this article is called the VGGNet. This model was developed by the Oxford University researchers as a solution to the ImageNet task. The ImageNet data consists of 10 classes with 1000 images each leading to 10000 images in total.
This is the architecture for VGGNet. This has been found for the CIFAR-10 dataset, a standard dataset containing 1000 classes. This was used for multiclass classification. Some modifications are made before using it for detecting OA. The output dimension is changed into 1*1*2 and the given images must be reshaped to 224*224 since this dimension is compatible with VGGNet. The dimensions and other terms like padding, stride, number of filters, dimension of filter are chosen by researchers and found optimal. In general, any number can be used in this place.
The numbers given below the figure correspond to the layer number. So the VGGNet is 13 layered and is CNN till layer 10 and the rest are FNN.
Colour index
Name
Grey
Convolution
Red
Pooling
Blue
FFN
Computations and parameters for each layer
Input
224*224 images are converted into a vector whose dimension is 224*224*3 based on the RGB value.
Layer 1-C1
This is the first convolutional layer. Here 64 filters are used.
Wi =224, P=1, S=1, K=64, f=3*3
Wo =224 (this is the input Wi for the next layer)
Dim= 224*224*64
Parameter= 64*3*3= 576
Layer 2-P1
This is the first pooling layer
Wi =224, S=2, P=1, f=3
Wo=112 (this is the input Wi for the next layer)
Dim= 112*112*3
Parameter= 0
Layer 3-C2C3
Here two convolutions are applied. 128 filters are used.
Wi =112, P=1, S=1, K=64, f=3
Wo=112 (this is the input Wi for the next layer)
Dim= 112*112*128
Parameter= 128*3*3=1152
Layer 4- P2
Second pooling layer
Wi =112, P=1, S=2, f=3*3
Wo =56 (this is the input Wi for the next layer)
Dim= 56*56*3
Parameter= 0
Layer 5- C4C5C6
Combination of three convolutions
Wi =56, P=1, S=1, K=256, f=3*3
Wo = 56 (this is the input Wi for the next layer)
Dim= 224*224*64
Parameter= 64*3*3= 576
Layer 6-P3
Third pooling layer
Wi =56, P=1, S=2, f=3*3
Wo =28 (this is the input Wi for the next layer)
Dim= 28*28*3
Parameter= 0
Layer 7-C7C8C9
Combination of three convolutions
Wi =28, P=1, S=1, K=512, f=3*3
Wo =28 (this is the input Wi for the next layer)
Dim= 28*28*512
Parameter= 512*3*3= 4608
Layer 8-P4
Fourth pooling layer
Wi =28, P=1, S=2, f=3*3
Wo =14 (this is the input Wi for the next layer)
Dim= 14*14*3
Parameter= 0
Layer 9-C10C11C12
Last convolution layer, Combination of three convolutions
Wi =14, P=1, S=1, K=512, f=3*3
Wo =14 (this is the input Wi for the next layer)
Dim= 14*14*512
Parameter= 512*3*3= 4608
Layer 10-P5
Last pooling layer and last layer in CNN
Wi =14, P=1, S=2, f=3*3
Wo =7 (this is the input Wi for the next layer)
Dim= 7*7*3
Parameter= 512*3*3= 4608
With here the CNN gets over. So a complex 224*224*3 boil down to 7*7*3
Trends in CNN
As the layer number increases,
The dimension decreases.
The filter number increases.
Filter dimension is constant.
In convolution
Padding of 1 and stride of 1 to transfer original dimensions to output
In pooling
Padding of 1 and stride of 2 are used in order to half the dimensions.
Layer 11- FF1
4096 neurons
Parameter= 512*7*7*4096=102M
Wo= 4096
Layer 12- FF2
4096 neurons
Wo= 4096
Parameter= 4096*4096= 16M
Output layer
2 classes
non-osteoarthritic
osteoarthritic
Parameter= 4096*2= 8192
Parameters
Layer
Value of parameters
Convolution
16M
FF1
102M
FF2
16M
Total
134M
It takes a very large amount of time nearly hours for a machine on CPU to learn all the parameters. Hence they came with speed enhancers like faster processors known as GPU Graphic Processing Unit which may finish the work up to 85% faster than CPU.
The previous article was about the padding, stride, and parameters of CNN. This article is about the pooling and the procedure to build an image classifier.
Pooling
This is another aspect of CNN. There are different types of pooling like min pooling, max pooling, avg pooling, etc. the process is the same as before i.e. the kernel vector slides over the input vector and does computations on the dot product. If a 3*3 kernel is considered then it is applied over a 3*3 region inside the vector, it finds the dot product in the case of convolution. The same in pooling finds a particular value and substitutes that value in the output vector. The kernel value decides the type of pooling. The following table shows the operation done by the pooling.
Type of pooling
The value seen in the output layer
Max pooling
Maximum of all considered cells
Min pooling
Minimum of all considered cells
Avg pooling
Average of all considered cells
The considered cells are bounded within the kernel dimensions.
The pictorial representation of average pooling is shown above. The number of parameters in pooling is zero.
Convolution and pooling are the basis for feature extraction. The vector obtained from this step is fed into an FFN which then does the required task on the image.
Features of CNN
Sparse connectivity
Weight sharing.
Feature extraction-CNN classifier-FNN
In general, CNN is first then FFN is later. But the order or number or types of convolution and pooling can vary based on the complexity and choice of the user.
Already there are a lot of models like VGGNet, AlexNet, GoogleNet, and ResNet. These models are made standard and their architecture has been already defined by researchers. We have to reshape our images in accordance with the dimensions of the model.
General procedure to build an image classifier using CNN
Obtain the data in the form of image datasets.
Set the output classes for the model to perform the classification on.
Transform or in specific reshape the dimension of the images compatible to the model. The image size maybe 20*20 but the model accepts only 200*200 images; then we must reshape them to that size.
Split the given data into training data and evaluation data. This is done by creating new datasets for both training and validation. More images are required for training.
Define the model used for this task.
Roughly sketch the architecture of the network.
Determine the number of convolutions, pooling etc. and their order
Determine the dimensions for the first layer, padding, stride, number of filters and dimensions of filter.
Apply the formula and find the output dimensions for the next layer.
Repeat 5d till the last layer in CNN.
Determine the number of layers and number of neurons per layer and parameters in FNN.
Sketch the architecture with the parameters and dimension.
Incorporate these details into the machine.
Or import a predefined model. In that case the classes in the last layer in the FNN must be replaced with ‘1’ for binary classification or with the number of classes. This is known as transfer learning.
Train the model using the training dataset and calculate the loss function for periodic steps in the training.
Check if the machine has performed correctly by comparing the true output with model prediction and hence compute the training accuracy.
Test the machine with the evaluation data and verify the performance on that data and compute the validation accuracy.
If both the accuracies are satisfactory then the machine is complete.
The previous article was about the process of convolution and its implementation. This article is about the padding, stride and the parameters involved in a CNN.
We have seen that there is a reduction of dimension in the output vector. A technique known as padding is done to preserve the original dimensions in the output vector. The only change in this process is that we add a boundary of ‘0s’ over the input vector and then do the convolution process.
Procedure to implement padding
To get n*n output use a (n+2*n+2) input
To get 7*7 output use 9*9 input
In that 9*9 input fill the first row, first column, last row and last column with zero.
Now do the convolution operation on it using a filter.
Observe that the output has the same dimensions as of the input.
Zero is used since it is insignificant so as to keep the output dimension without affecting the results
Here all the elements in the input vector have been transferred to the output. Hence using padding we can preserve the originality of the input. Padding is denoted using P. If P=1 then one layer of zeroes is added and so on.
It is not necessary that the filter or kernel must be applied to all the cells. The pattern of applying the kernel onto the input vector is determined using the stride. It determines the shift or gaps in the cells where the filter has to be applied.-
S=1 means no gap is created. The filter is applied to all the cells.
S=2 means gap of 1. The filter is applied to alternative cells. This halves the dimensions on the output vector.
This diagram shows the movement of filter on a vector with stride of 1 and 2. With a stride of 2; alternative columns are accessed and hence the number of computations per row decreases by 2. Hence the output dimensions reduce while use stride.
The padding and stride are some features used in CNN.
Parameters in a convolution layer
The following are the terms needed for calculating the parameter for a convolution layer.
Input layer
Width Wi – width of input image
Height Hi – height of input image
Depth Di – 3 since they follow RGB
We saw that 7*7 inputs without padding and stride along with 3*3 kernels gave a 5*5 output. It can be verified using this calculation.
The role of padding can also be verified using this calculation.
The f is known as filter size. It can be a 1*1, 3*3 and so on. It is a 1-D value so the first value is taken. There is another term K which refers to the number of kernels used. This value is fixed by user.
These values are similar to those of w and b. The machine learns the ideal value for these parameters for high efficiency. The significance of partial connection or CNN can be easily understood through the parameters.
Consider the same example of (30*30*3) vector. The parameter for CNN by using 10 kernels will be 2.7 million. This is a large number. But if the same is done using FNN then the parameters will be at least 100 million. This is almost 50 times that of before. This is significantly larger than CNN. The reason for this large number is due to the full connectivity.
Blockchain is a system of documenting data that will be difficult to hack or change. It is tough to deceive the system. Each block in the chain contains several transactions and every time a new transaction occurs on the blockchain a record of the transaction is added to the participant’s ledger. In simple words, blockchain is not invulnerable the hacker would need more than half of the control in the allocated file.
WHO OWNS BLOCKCHAIN?
According to Wikipedia, blockchain is a cryptocurrency blockchain explorer service. Bitcoin is supported by the same. It was found in 2011 by Benjamin Reeves, Nicolas Cary, and Peter Smith.
Blockchain was found as Blockchain.info which could be used to trace bitcoin transactions. The function of the site is to allow bitcoin users to see the public cryptocurrency transactions. By 2014, blockchain was popular and the users grew.
In 2018, blockchain started to sell services to institutional cryptocurrencies. Whereas in 2020, the company is said to have more than 30 million users. The next year it grew to a family of 60 plus million wallet users.
BLOCKCHAIN’S SERVICE
Blockchain as said records information. It provides an outlet to hold and oversee crypto investments. The platform also submits financial service standards.
The company offers a hosted cryptocurrency wallet that is to store digital for online access. It allows users to buy and sell cryptocurrencies.
A special feature is, the company has a non-custodial wallet. The company has no access to the wallet’s data, the user is the sole owner of the information. This draws attention as it maintains privacy. The user has a private key to get hold of the data which is known solely by the user.
There is an explorer which allows the public to see the transactions. If one has the hash code with the address of the wallet, they can see received, sent and the fee information. The tool is used to analyse the activity.
IS BLOCKCHAIN RELIABLE?
Yes, it is considered to be reliable and trustworthy as, if one goes offline the others in the network get access to the ledger.
HOW DOES IT WORK?
Blockchain grows to 300GB. The programming language is said to be C. There is no need for a middle man in the process that is one of the specialities. It has faster transactions.
SKILLS NEEDED TO BE A BLOCKCHAIN DEVELOPER
Cryptocurrency.
Data structure.
Web development.
Blockchain Architecture.
Java
C++
Python
FACTS ABOUT BLOCKCHAIN
Blockchains can be either public or private.
Bitcoin transactions are measured in bytes.
0.5% of the world population uses blockchain. That said it comes around 18,850,000.
Ethereum, Ripple, Quorum and R3 Corda are other blockchain platforms.
IBM is the largest blockchain company.
As for the development, it is still in the place internet was a few years ago.
Blockchain isn’t always Anonymous.
The disadvantage is once the record is made it cannot be altered. As there are no third parties the risk is minimal. To understand blockchain there are few videos on youtube, do Check it out!
Hi! Hope you all are doing good. I’m a kindle parent for more than a month. So I thought why not share about kindle. I simply love the device so much and I can’t stay away from it as much as I even named my device.
Kindle is a small, light e-reader and has been developed by Amazon. We can store books, charge it and carry it with us as it is lightweight. There is a kindle app that can also be used.
Advantages of Kindle
Convenient e-reader.
Thousands of e-books.
Cheaper and affordable books.
Dictionary in one click.
It has a paper-like screen which gives us a paperback feel.
E-ink is being used in this device.
It is not bad for the eyes.
With kindle unlimited, you get lots of free books.
It does not emit light.
Long battery life.
Glare-free.
Disadvantages of kindle
It is not a physical book.
Lack of book smell.
Lack of colourful illustration.
Hard to share with friends.
Eye strain if used continuously and at night.
The battery can die out. You have to carry the charger for journeys.
You can join kindle unlimited to get access to free books. In India, you have to pay 1 Month = Rs.199, 6 months = Rs. 999 and 12 Months = Rs. 1,799.
KINDLE (10TH GEN)
PRODUCT DETAILS
Device: Kindle 10th Generation.
Manufacturer: Amazon.
Weight: 168g.
Model No.: J9G29R.
Country of Origin: India.
I have this device and trust me I love it! If one can’t afford paperbacks, ebooks are an incredible option. The device is super cute and light. You won’t get distracted as you can’t assess social media on the device. This device does not support audiobooks.
Paper White has 8GB and 32GB storage. The price varies as per the storage. Important thing is, it is waterproof hence, you can read it in a bathtub, beach, and pool area. It doesn’t support audiobooks.
Kindle Oasis has a page-turner button. The screen is flat edge to edge. It has an elegant look. The screen rotation feature is helpful. The cost may vary as per the storage.
In kindle, we have the features to change fonts and font size. There are few basic features like layout changes and themes.
There are pretty covers for the device on Amazon. The experience is not like a paperback yet it gives us a pleasant experience. Images are black and white but that doesn’t make my experience any less than beautiful.
When we are out in direct sunlight, a glare-free screen enables us to read. As much as I love paperback, reading in kindle doesn’t make you less of a reader. I feel that money should not be a barrier to reading. When you can afford ebooks, do make use of it. It might not be the same but I think paperback and kindle can co-exist.
The previous article was about the procedure to develop a deep learning network and introduction to CNN. This article concentrates on the process of convolution which is the process of taking in two images and doing a transformation to produce an output image. This process is common in mathematics and signals analysis also. The CNN’s are mainly used to work with images.
In the CNN partial connection is observed. Hence all the neurons are not connected to those in the next layer. So the number of parameters reduces leading to lesser computations.
Sample connection is seen in CNN.
Convolution in mathematics refers to the process of combining two different functions. With respect to CNN, convolution occurs between the image and the filter or kernel. Convolution itself is one of the processes done on the image.
Here also the operation is mathematical. It is a kind of operation on two vectors. The input image gets converted into a vector based on colour and dimension. The kernel or filter is a predefined vector with fixed values to perform various functions onto the image.
Process of convolution
The kernel or filter is chosen in order of 1*1, 3*3, 5*5, 7*7, and so on. The given filter vector slides over the image and performs dot product over the image vector and produces an output vector with the result of each 3*3 dot product over the 7*7 vector.
A 3*3 kernel slides over the 7*7 input vector to produce a 5*5 output image vector. The reason for the reduction in the dimension is that the kernel has to do dot product operation on the input vector-only with the same dimension. I.e. the kernel slides for every three rows in the seven rows. The kernel must perfectly fit into the input vector. All the cells in the kernel must superimpose onto the vector. No cells must be left open. There are only 5 ways to keep a 3-row filter in a 7-row vector.
This pictorial representation can help to understand even better. These colors might seem confusing, but follow these steps to analyze them.
View at the first row.
Analyse and number the different colours used in that row
Each colour represents a 3*3 kernel.
In the first row the different colours are red, orange, light green, dark green and blue.
They count up to five.
Hence there are five ways to keep a 3 row filter over a 7 row vector.
Repeat this analysis for all rows
35 different colours will be used. The math is that in each row there will be 5 combinations. For 7 rows there will be 35 combinations.
The colour does not go beyond the 7 rows signifying that kernel cannot go beyond the dimension of input vector.
These are the 35 different ways to keep a 3*3 filter over a 7*7 image vector. From this diagram, we can analyse each row has five different colours. All the nine cells in the kernel must fit inside the vector. This is the reason for the reduction in the dimension of output vector.
Procedure to implement convolution
Take the input image with given dimensions.
Flatten it into 1-D vector. This is the input vector whose values represent the colour of a pixel in the image.
Decide the dimension, quantity and values for filter. The value in a filter is based on the function needed like blurring, fadening, sharpening etc. the quantity and dimension is determined by the user.
Take the filter and keep it over the input vector from the first cell. Assume a 3*3 filter kept over a 7*7 vector.
Perform the following computations on them.
5a. take the values in the first cell of the filter and the vector.
5b. multiply them.
5c. take the values in the second cell of the filter and the vector.
5d. multiply them.
5e. repeat the procedure till the last cell.
5f. take the sum for all the nine values.
Place this value in the output vector.
Using the formula mentioned later, find the dimensions of the output vector.
The previous article was about the procedure to develop a deep learning network and introduction to CNN. This article concentrates on the process of convolution which is the process of taking in two images and doing a transformation to produce an output image. This process is common in mathematics and signals analysis also. The CNN’s are mainly used to work with images.
In the CNN partial connection is observed. Hence all the neurons are not connected to those in the next layer. So the number of parameters reduces leading to lesser computations.
Sample connection is seen in CNN.
Convolution in mathematics refers to the process of combining two different functions. With respect to CNN, convolution occurs between the image and the filter or kernel. Convolution itself is one of the processes done on the image.
Here also the operation is mathematical. It is a kind of operation on two vectors. The input image gets converted into a vector-based on color and dimension. The kernel or filter is a predefined vector with fixed values to perform various functions onto the image.
Process of convolution
The kernel or filter is chosen in order of 1*1, 3*3, 5*5, 7*7, and so on. The given filter vector slides over the image and performs dot product over the image vector and produces an output vector with the result of each 3*3 dot product over the 7*7 vector.
A 3*3 kernel slides over the 7*7 input vector to produce a 5*5 output image vector. The reason for the reduction in the dimension is that the kernel has to do dot product operation on the input vector-only with the same dimension. I.e. the kernel slides for every three rows in the seven rows. The kernel must perfectly fit into the input vector. All the cells in the kernel must superimpose onto the vector. No cells must be left open. There are only 5 ways to keep a 3-row filter in a 7-row vector.
This pictorial representation can help to understand even better. These colors might seem confusing, but follow these steps to analyze them.
View at the first row.
Analyse and number the different colours used in that row
Each colour represents a 3*3 kernel.
In the first row the different colours are red, orange, light green, dark green and blue.
They count up to five.
Hence there are five ways to keep a 3 row filter over a 7 row vector.
Repeat this analysis for all rows
35 different colours will be used. The math is that in each row there will be 5 combinations. For 7 rows there will be 35 combinations.
The colour does not go beyond the 7 rows signifying that kernel cannot go beyond the dimension of input vector.
These are the 35 different ways to keep a 3*3 filter over a 7*7 image vector. From this diagram, we can analyse each row has five different colours. All the nine cells in the kernel must fit inside the vector. This is the reason for the reduction in the dimension of output vector.
Procedure to implement convolution
Take the input image with given dimensions.
Flatten it into 1-D vector. This is the input vector whose values represent the colour of a pixel in the image.
Decide the dimension, quantity and values for filter. The value in a filter is based on the function needed like blurring, fadening, sharpening etc. the quantity and dimension is determined by the user.
Take the filter and keep it over the input vector from the first cell. Assume a 3*3 filter kept over a 7*7 vector.
Perform the following computations on them.
5a. take the values in the first cell of the filter and the vector.
5b. multiply them.
5c. take the values in the second cell of the filter and the vector.
5d. multiply them.
5e. repeat the procedure till the last cell.
5f. take the sum for all the nine values.
Place this value in the output vector.
Using the formula mentioned later, find the dimensions of the output vector.
The previous article was on algorithm and hyper-parameter tuning. This article is about the general steps for building a deep learning model and also the steps to improve its accuracy along with the second type of network known as CNN.
General procedure to build an AI machine
Obtain the data in the form of excel sheets, csv (comma separated variables) or image datasets.
Perform some pre-processing onto the data like normalisation, binarisation etc. (apply principles of statistics)
Split the given data into training data and testing data. Give more preference to training data since more training can give better accuracy. Standard train test split ratio is 75:25.
Define the class for the model. Class includes the initialisation, network architecture, regularisation, activation functions, loss function, learning algorithm and prediction.
Plot the loss function and interpret the results.
Compute the accuracy for both training and testing data and check onto the steps to improve it.
Steps to improve the accuracy
Increase the training and testing data. More data can increase the accuracy since the machine learns better.
Reduce the learning rate. High learning rate often affects the loss plot and accuracy.
Increase the number of iterations (epochs). Training for more epochs can increase the accuracy
Hyper parameter tuning. One of the efficient methods to improve the accuracy.
Pre-processing of data. It becomes hard for the machine to work on data with different ranges. Hence it is recommended to standardise the data within a range of 0 to 1 for easy working.
These are some of the processes used to construct a network. Only basics have been provided on the concepts and it is recommended to learn more about these concepts.
Implementation of FFN in detecting OSTEOARTHRITIS (OA)
Advancements in the detection of OA have occurred through AI. Technology has developed where machines are created to detect OA using the X-ray images from the patient. Since the input given is in the form of images, optimum performance can be obtained using CNN’s. Since the output is binary, the task is binary classification. A combination of CNN and FFN is used. CNN handles feature extraction i.e. converting the image into a form that is accepted by the FFN without changing the values. FFN is used to classify the image into two classes.
CNN-convolutional neural network
The convolutional neural network mainly works on image data. It is used for feature extraction from the image. This is a partially connected neural network. Image can be interpreted by us but not by machines. Hence they interpret images as a vector whose values represent the color intensity of the image. Every color can be expressed as a vector of 3-D known as RGB- Red Green Blue. The size of the vector is equal to the dimensions of the image.
This type of input is fed into the CNN. There are several processing done to the image before classifying it. The combination of CNN and FNN serves a purpose for image classification.
Problems are seen in using FFN for image
We have seen earlier that the gradients are chain rule of gradient at different layers. For image data, large number of layers in order of thousands may require. It can result in millions of parameters. It is very tedious to find the gradient for the millions of these parameters.
Using FFN for image data can often overfit the data. This may be due to the large layers and large number of parameters.
The previous article dealt with the networks and the backpropagation algorithm. This article is about the mathematical implementation of the algorithm in FFN followed by an important concept called hyper-parameter tuning.
In this FFN we apply the backpropagation to find the partial derivative of the loss function with respect to w1 so as to update w1.
Hence using backpropagation the algorithm determines the update required in the parameters so as to match the predicted output with the true output. The algorithm which performs this is known as Vanilla Gradient Descent.
The way of reading the input is determined using the strategy.
Strategy
Meaning
Stochastic
One by one
Batch
Splitting entire input into batches
Mini-batch
Splitting batch into batches
The sigmoid here is one of the types of the activation function. It is defined as the function pertaining to the transformation of input to output in a particular neuron. Differentiating the activation function gives the respective terms in the gradients.
There are two common phenomena seen in training networks. They are
Under fitting
Over fitting
If the model is too simple to learn the data then the model can underfit the data. In that case, complex models and algorithms must be used.
If the model is too complex to learn the data then the model can overfit the data. This can be visualized by seeing the differences in the training and testing loss function curves. The method adopted to change this is known as regularisation. Overfit and underfit can be visualized by plotting the graph of testing and training accuracies over the iterations. Perfect fit represents the overlapping of both curves.
Regularisation is the procedure to prevent the overfitting of data. Indirectly, it helps in increasing the accuracy of the model. It is either done by
Adding noises to input to affect and reduce the output.
To find the optimum iterations by early stopping
By normalising the data (applying normal distribution to input)
By forming subsets of a network and training them using dropout.
So far we have seen a lot of examples for a lot of procedures. There will be confusion arising at this point on what combination of items to use in the network for maximum optimization. There is a process known as hyper-parameter tuning. With the help of this, we can find the combination of items for maximum efficiency. The following items can be selected using this method.
Network architecture
Number of layers
Number of neurons in each layer
Learning algorithm
Vanilla Gradient Descent
Momentum based GD
Nesterov accelerated gradient
AdaGrad
RMSProp
Adam
Initialisation
Zero
He
Xavier
Activation functions
Sigmoid
Tanh
Relu
Leaky relu
Softmax
Strategy
Batch
Mini-batch
Stochastic
Regularisation
L2 norm
Early stopping
Addition of noise
Normalisation
Drop-out
All these six categories are essential in building a network and improving its accuracy. Hyperparameter tuning can be done in two ways
Based on the knowledge of task
Random combination
The first method involves determining the items based on the knowledge of the task to be performed. For example, if classification is considered then
Activation function- softmax in o/p and sigmoid for rest
Initialisation- zero or Xavier
Strategy- stochastic
Algorithm- vanilla GD
The second method involves the random combination of these items and finding the best combination for which the loss function is minimum and accuracy is high.
Hyperparameter tuning would already be done by researchers who finally report the correct combination of items for maximum accuracy.
The previous article gave some introduction to the networks used in deep learning. This article provides more information on the different types of neural networks.
In a feed-forward neural network (FFN) all the neurons in one layer are connected to the next layer. The advantage is that all the information processed from the previous neurons is fed to the next layer hence getting clarity in the process. But the number of weights and biases significantly increases when there is a large number of input. This method is best used for text data.
In a convolutional neural network (CNN), some of the neurons are only connected to the next layer i.e. connection is partial. Batch-wise information is fed into the next layer. The advantage is that the number of parameters significantly reduces when compared to FFN. This method is best used for image data since there will be thousands of inputs.
In recurrent neural networks, the output of one neuron is fed back as an input to the neuron in the previous layer. A feed-forward and a feedback connection are established between the neurons. The advantage is that the neuron in the previous layer can perform efficiently and can update based on the output from the next neuron. This concept is similar to reinforcement learning in the brain. The brain learns an action based on punishment or reward given as feedback to the neuron corresponding to that action.
Once the final output is computed by the network, it is then compared with the original value, and their difference is taken in different forms like the difference of squares, etc. this term is known as loss function.
It will be better to explain the role of the learning algorithms here. The learning algorithm is the one that tries to find the relation between the input and output. In the case of neural networks, the output is indirectly related to input since there are some hidden layers in between them. This learning algorithm works in such a way so as to find the optimum w and b values for the loss function is minimum or ideally zero.
The algorithm in neural networks do this using a method called backpropagation. In this method, the algorithm starts tracing from the output. It then computes the values for the parameters corresponding to the neuron in that layer. It then goes back to the previous layer does the computations for the parameters of the neurons in that layer. This procedure is done till it encounters the inputs. In this way, we can find the optimum values for the parameters.
The computations made by the algorithm are based on the type of the algorithm. Most of the algorithms find the derivative of a parameter in one layer with respect to the loss function using backpropagation. This derivative is then subtracted from the original value.
Where lr is the learning rate; provided by the user. The lesser the learning rate, the better will be the results but more the time is taken. The starting value for w and b is determined using the initialization.
Method
Meaning
Zero
W and b are set to zero
Xavier
w and b indirectly proportional to root n
He
w and b indirectly proportional to root n/2
Where n; refers to the number of neurons in a layer. These depend on the activation function used.
The derivative of the loss function determines the updating of the parameters.
Value of derivative
Consequence
-ve
Increases
0
No change
+ve
Decreases
The derivative of the loss function with respect to the weight or bias in a particular layer can be determined using the chain rule used in calculus.
The fashionable age is the age of science, technology and knowledge in which all of these are interrelated and are different aspects of the same thing. Explosion of knowledge and data , supported breathtaking advancement within the world of science and technology, has bestowed on man powers enviable even for gods. it’s helped man conquer space and time. Now one has unraveled many mysteries of nature and life and is ready to face new challenges and move forward within the realm of the unknown and thus the undiscovered. In India there has been an extended and distinct tradition of scientific research and technological advancement since the past .
Since independence, India has accelerated it’s speed and efforts in this field and have established many research laboratories, institutions of upper learning and technical education. The results would make anybody’s heart swell with pride , confidence and fulfillment. The best, however, is yet to return . The central and state governments, various public and private sector establishments are engaged in scientific research and technological development to require the state on the trail of rapid development, growth and prosperity. There are about 200 research laboratories spread everywhere in the country. The institutions of upper learning, and universities, the fashionable temples of learning, are all committed to need the country forward. they’re well equipped and staffed to secure for the people of the state all the blessings and benefits which can accrue from the acquisition and application of knowledge and technology. But there is no room for complacency, for during this field only the sky’s the limit and that we are yet a developing country.
Our technology policy is comprehensive and well thought out. It aims at developing indigenous technology to ensure efficient absorption and adoption of imported technology suitable to national priorities and availability of resources. Its main objective is attainment of technical competence and self- reliance, leading to reduction in vulnerability in strategic and important areas.
With a view to strengthening our economy and industrial development, our government has introduced many structural reforms through adoption of a replacement industrial policy which features an important pertaining to the programmes of development concerning science and technology. Consequently, technology has become our mainstay enterprise and now we’ve built a robust and reliable infrastructure for research, training and development in science and technology. Within the field of agriculture, our scientific and technological researches have enabled us to be self-reliant and self-sufficient in food grains.
Today, India withstand droughts and natural calamities with much greater confidence than ever before. Now, we are at an edge to export food grains, etc. and are on the sting of white and blue revolutions. Our agricultural scientists and farmers, who are always ready to imbibe new technologies, our country has many kinds of hybrid seeds, crop- protection technologies, balanced farming practices and better water and irrigation management techniques. Similarly within the sector of economic research, we’ve achieved many milestones and India is emerging as a significant industrial power of the earth .
The Council of Scientific and Industrial Research (CSIR), which has its network of research laboratories and institutions, has been chiefly instrumental in our major achievements in scientific and industrial research. We’ve now joined the exclusive club of six advanced nations by developing our own supercomputer at the Centre for Development of Advance Computing (C- CAD) at Pune. Our Atomic Research Commission, acknowledged in 1948, is engaged in valuable nuclear research for peaceful purposes. The chief agency for implementing atomic energy programmes is the Department of atomic energy . The Bhabha Atomic Research Centre, Trombay, near Mumbai is the most important single scientific establishment within the country, directing nuclear research. Now, we’ve five research reactors, including Cyrus, Dhruua, Zerina and Purnima. We’ve administered two underground nuclear tests at Pokhran in Rajasthan.
This is often an interesting achievement by our nuclear scientists, which has enabled us to become one of the chosen few countries on earth to have done it. India is additionally the first developing country, and one of the seven countries of the earth to master fast breeding technology. Research in breeder technology is currently happening at Gandhi Centre for Atomic Research at Kalpakkam, Chennai. The successful launching of the Polar Space Launching Vehicle (PSLV- D-2), in October 1994, marked India’s entry into the league of the world’s major space powers. Within the INSAT-2 series of satellites, launched first in 1992, India has shown its ability to fabricate complex systems like anything made anywhere within the earth . Our previous launches of the SLV-3 and thus the SLV were merely stepping stones to what’s going to be the workhorses of the business, the PSLV, which can launch one tone satellite into orbit of up to 1000 km, and therefore the Geosynchronous Satellite Launch Vehicle, which can take 2.5 tonne satellite to orbits 36,000 km away. India’s space programme rocketed to greater heights with the successful launch of the second Geosynchronous Satellite Launch Vehicle (GSLV-D2) in May, 2003. As has been rightly observed, the challenge before Indian Space Research Organisation (ISRO) is to take care of the momentum of the programme by integrating it with other missions. The foremost obvious ones are related to military communication and reconnaissance.India’s first space mission to specialize in an extraterrestrial landing, Chandrayaan-2, would have commenced by the time you read this. It’s a symbol achievement for India’s technological capability, in areas ranging from propulsion , signals and communications, materials, robotics, remote guidance and even AI , to let the lunar lander navigate on its own on the far side of the moon. If successful on all targeted fronts, it’d also increase humankind’s understanding of cosmology and thus the origins of the planet , because the moon probably could also be a piece of this planet that got thrown out at a stage when it had been mostly molten matter. And, of course, it’d cause greater understanding of the moon itself, its chemistry and composition. America landed men on the moon essentially to demonstrate that it had overcome the Sputnik scare — the shock realisation that the Soviet Union was before it in space science and technology which its own education system had to repair for greater specialize in science and maths — and had beaten the Soviet Union therein lone area of human achievement during which the Communist nation had been ahead.
Achievements in space still have a component of demonstration of technological capability, apart from their intrinsic utility. So, becoming the fourth nation within the world, behind the US, the previous Soviet Union and China, to land a mobile explorer on the moon, tells the earth of India’s capability altogether the intricate technologies that are marshalled and harmonised to carry out Chandrayaan-2, its predecessor having orbited the moon with a proximity of 100km. The mission, conceived in 2008, has taken 11years to end . The mission director and thus the project director are both women, to boot. The Indian Space Research Organisation is standing testimony to the overall public sector’s capacity to deliver outstanding results, when given autonomy and resources. There’s a case for similar public sector initiatives in cyber security, telecom systems and AI . What it lacks is political vision and commitment. Our success on Antarctica speaks volumes of our scientific genius and technological wisdom within the world . So far, 13 scientific expeditions by our oceanographers,scientists and technicians are to Antarctica where we’ve two permanent stations on the icy continent. within the field of defence also our achievements are quite laudable.
The successful production of such missiles as Prithvi and Nag testify to the high capabilities and achievements of our scientists. we’ve also been successful in producing opt-electronic preparation and night-vision devices required for our indigenous tanks. The HAL at Bangalore has already produced the Advanced Light Helicopter (ALH). Obviously, technology has been used effectively as a tool and instrument of national development and yet much remains to be achieved so that its benefits reach the masses. Scientists within the country will strive hard to bring technological developments to people’s doorsteps.
Therefore, they can not rest on their laurels, but should remember the famous and galvanizing lines of the poet Robert Frost: The woods are lovely, dark and deep, But I even have promises to stay, And miles to travel before I sleep……
Machine learning is the branch of Artificial Intelligence (AI). In AI, the machines are designed to simulate human behavior. Whereas in machine learning, the machines are allowed to learn from the past data without programming explicitly. Any technology user in today’s world has benefitted from machine learning. It is a continuously growing field and hence provides several opportunities to the research industries. In machine learning, tasks are classified into broad categories. Two of the most adopted machine learning categories are supervised learning and unsupervised learning. In supervised learning, the machines train the algorithms based on the sample input and output labeled by the humans. It uses patterns to predict values on additional unlabeled data. In unsupervised learning, the machine trains the algorithm with no labeled data. It will find the structure within its input data. As a field, machine learning deals with data, so having a piece of knowledge in statistics will be useful in better understanding concepts.
WHY MACHINE LEARNING?
It develops systems that can automatically adapt and customize themselves according to the individuals.
It can be a key for unlocking the value of corporate and customer data which in turn helps the company to stay ahead of the competition.
For growing data and the different available data, the computational process is cheaper and faster and provides affordable storage.
By using algorithms to build models, organizations can make better decisions without human intervention.
Relationships and correlations can be hidden in a large amount of data. Machine learning will help find these relationships.
As technology keeps changing, it is difficult to continuously redesign the system by hand.
In some cases like medical diagnostics, the amount of data available about certain tasks might be too large for explicitly encoding by humans.
VARIOUS FIELDS THAT USES MACHINE LEARNING:
GOVERNMENT: By using machine learning systems, the prediction of potential future scenarios and adapting rapid changes becomes easy for government officials. Machine learning helps to improve cybersecurity and cyber intelligence. It also helps by reducing the failure rates of the project.
HEALTHCARE: The use of sensors to predict the pulse rate, heartbeats, sugar levels, sleeping patterns helps the doctors to assess their patient’s health in real-time. It provides real-time data from past surgeries and past medical records which will improve the accuracy of the surgical robot tools. Some of the benefits are avoidance of human errors and will be helpful during complex surgeries.
MARKETING AND SALES: The marketing sector has been revolutionized since the arrival of artificial intelligence (AI) and machine learning. It has increased customer satisfaction by 10%. E-commerce and social media sites use machine learning to analyze the things that you are interested in and help in suggesting similar products to you based on your past habits. It has greatly helped in increasing the sales of e-shopping sites.
TRANSPORTATION: Through deep learning, machine learning, has explored the complex interactions of highways, traffic roads, accident-prone areas, crashes, environmental changes, and so on. It helped in traffic control management by providing results from the past day. So, the company can able to get their raw materials without any delay and supply their finished goods to the market inefficient time.
FINANCE: The insights produced by machine learnings helps the investors to give a clear picture of risk and the right time for investment and helps to identify the high-risk clients and signs of fraudulent areas. It helps in analyzing the stock market movement to give financial recommendations. Machine learning also helps to be aware of the risks in the finance department.
MANUFACTURING: Machine learning has helped to improve productivity in the industrial field. It helps in the expansion of product and service lines due to mass production in a short time. Improved quality control with insights helps to improve the product’s quality. Ability to meet the customer’s new needs. Prediction helps to find risks and reduces the cost of production.
Thus in today’s world, machine learning is implemented in several fields to complete the work faster and cheaper. The machine should be able to do all the works that man can do and machine learning will help to achieve this goal.


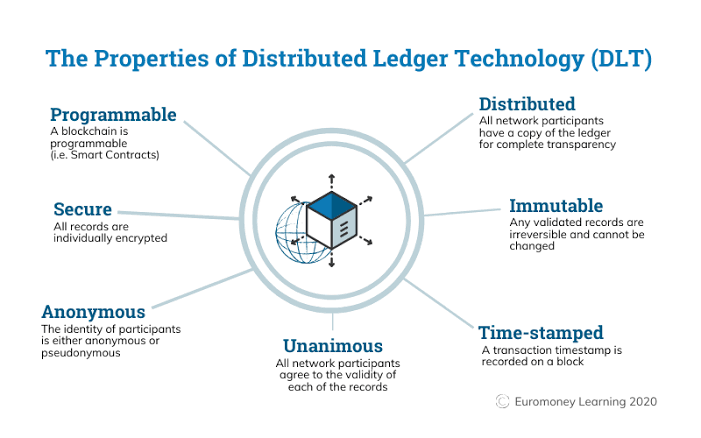
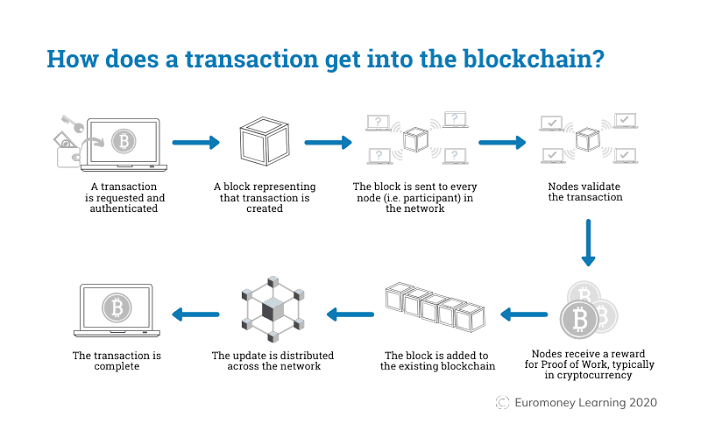


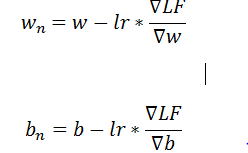


You must be logged in to post a comment.